equity duration: a puzzle on high dividend stocks - q · pdf fileequity duration: a puzzle on...
TRANSCRIPT
Equity Duration: A Puzzle on High Dividend Stocks ∗
Hao Jiang
Michigan State University
Zheng Sun
University of California–Irvine
This Draft: October 2015
Abstract
This paper examines the duration of individual stocks, i.e., the sensitivities of their
prices to changes in interest rates. Counter to the intuition from the dividend discount
model, we find that stocks that pay higher dividends tend to have longer duration, ex-
periencing greater price declines (increases) when interest rates rise (fall). Using data
on mutual fund flows and institutional investor holdings, we find evidence of “reaching
for dividends”: when interest rates fall, investors switch more funds to income-oriented
equity mutual funds, and the weights of high dividend stocks in the portfolios of income-
dependent institutions such as income funds and insurance companies increase. The
resulting higher demand for high dividend stocks appears to increase the sensitivities of
their prices to interest rate changes, thereby contributing to their long duration puzzle.
JEL: G10, G11, G12, G23
Keywords:: Equity Duration; Interest Rate Risk; Dividends; Income Funds; Flows;
Institutional Investors.
∗Jiang is from Eli Broad College of Business, Michigan State University. Phone: 1-517-353-2920. E-mail:[email protected]. Sun is from Paul Merage School of Business, University of California, Irvine. Phone:1-949-824-6907. Email: [email protected].
1
1 Introduction
Central banks around the world have been rushing to lower interest rates to uncharted ter-
ritories. The globally universal accommodative monetary policies have created an ultra-low
interest rate environment. Between December 2014 and May 2015, approximately $2 trillion
long-term sovereign debt was trading at negative yields (Bank for International Settlements,
2015). In the U.S., the Federal Funds Rate has hovered around zero for more than six years
since 2009, with long-term nominal and real interest rates (yields on 10-year Treasury notes
and Treasury Inflation-Indexed Security) diminishing to merely 2.16% and 0.33% in May
2015, respectively. Across the investment community, the ultra-low interest rates near the
zero lower bound heighten the concern for interest rate risk when central banks “normal-
ize” the monetary policy, which has important implications for investors’ asset allocation
decisions.
Despite the pressing need to understand the impact of changes in interest rates on the
value of financial assets, empirical literature on equity duration has been limited. This study
proposes to fill the gap. In particular, we build on the intuition from popular valuation mod-
els such as the dividend discount model and test if stocks with lower dividends have longer
duration, i.e., larger sensitivities in prices to changes in interest rates. To gain intuition,
we may view a common stock as a claim to a portfolio of future cash flows like a series
of zero-coupon bonds. High-growth firms tend to have lower dividend payouts but higher
future growth rates, which skew the distribution of their cash flows towards the most distant
future. In contrast, firms with higher dividend payouts tend to have lower retention ratios
and lower future growth rates; the distribution of their cash flows is relatively denser in the
closer future. As a result, the valuation model predicts that duration, which is the weighted
average maturity of the series of zero-coupon bonds, tends to be longer for stocks with lower
dividend payouts.1
We empirically examine this prediction by computing value-weighted returns to portfolios
of stocks formed on the basis of their dividend to price ratios (dividend yield), and estimating
their empirical duration as the percentage price increase associated with a one-percent decline
1In Section 3, we formalize this intuition.
2
in interest rates (e.g., yields on 10-year Treasury notes). Our results indicate that during
the period from 1963 to 2014, ceteris paribus, when interest rates decline by 1.00%, high
dividend stocks tend to experience an increase in returns by 1.35%, whereas low dividend
stocks tend to have a decrease in returns by 1.12%, with both effects statistically significant
at the 1% level. The difference in estimated duration between high and low dividend stocks
is 2.46 with high statistical significance. Using dividend payout ratios (dividends divided by
book equity) as an alternative measure of dividend payments, we obtain a similar pattern.
These results indicate that contrary to the intuition from the valuation model, high dividend
stocks appear to have longer duration.
The longer duration of high dividend stocks does not simply reflect the possibility that
they may have higher stock market beta. In our estimation of equity duration, we control
for the influence of aggregate stock market movements. In fact, over our sample period,
high dividend stocks tend to have lower stock market beta. In an alternative specification,
we also control for other commonly used stock market factors that drive the comovement
in stock prices, such as the size, value, and momentum factors (see, e.g., Fama and French,
1993; Jegadeesh and Titman, 1993). The long duration of high dividend stocks remains
economically large and statistically significant in this alternative specification. Moreover,
despite the highly volatile correlation between aggregate stock market and bond market
returns ranging from very negative to very positive (e.g., Baele, et al., 2013; Campbell, et
al., 2013) the long duration of high dividend stocks remains stable in the past five decades.
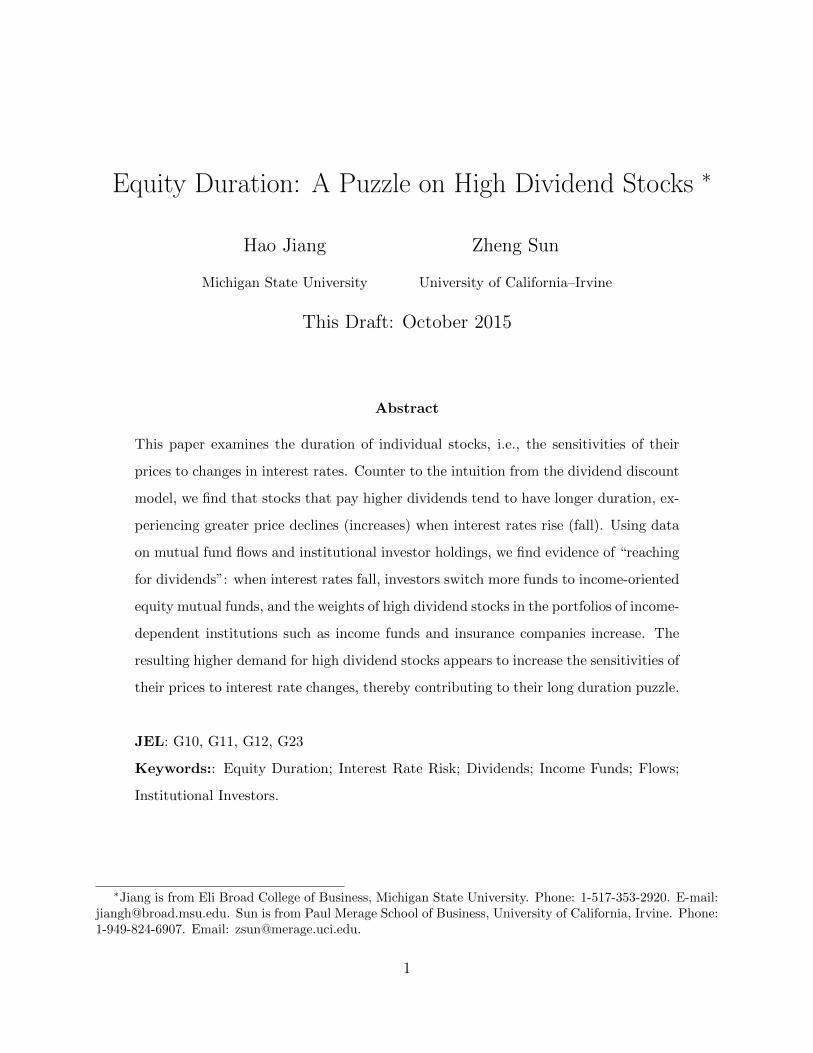
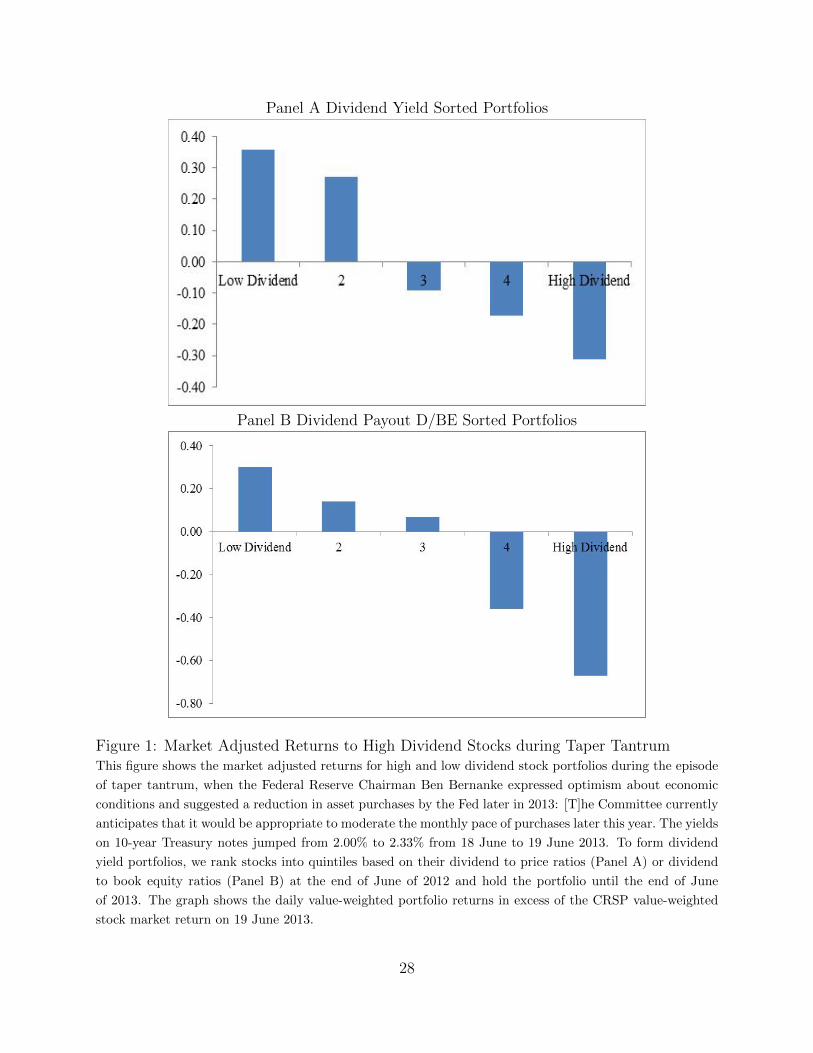
As another illustration, Figure 1 shows the market-adjusted returns to high and low
dividend stocks during the episode of “taper tantrum.” In the press conference concluding
the two-day Federal Open Market Committee Meeting on 19 June 2013, the Federal Reserve
Chairman Ben Bernanke expressed optimism about economic conditions and suggested a
reduction in purchases of long-term bonds by the Fed (as one of its tools for accommodative
monetary policy) later in 2013: “[T]he Committee currently anticipates that it would be
appropriate to moderate the monthly pace of purchases later this year.” Shocked by this
news, long-term interest rates ascended, with, e.g., the yields on 10-year Treasury notes
jumping up from 2.00% to 2.33% from 18 June to 19 June 2013. On the same day, high
3
dividend stocks tumbled more than the aggregate stock market, whereas low dividend stocks
increased in value relative to the stock market. The spread in daily market-adjusted returns
between high and low dividend stocks is 67 basis points (bps) for dividend yield-sorted
portfolios and 97 bps for dividend payout-sorted portfolios. The evidence from this natural
experiment illustrates the longer duration of high dividend stocks.
What accounts for the high duration of high dividend stocks? The popular dividend
discount model does not take into account the effect of uncertainty on stock prices. If firms
with less volatile cash flows tend to retain less of their earnings and distribute more to
shareholders, high dividend stocks may enjoy lower discount rates (due to lower cash flow
volatility) that penalize less the contribution of their more distant cash flows to their market
value. The resulting larger share of more distant cash flows in the firm value then implies
a longer duration of high dividend stocks. To examine this conjecture, we use stock price
volatility as a proxy for the cash flow volatility and test for its influence on the duration of
high dividend stocks. Our results indicate that after controlling for the influence of volatility,
the longer duration of high dividend stocks remains large and statistically significant.
From a related perspective, less profitable firms may have weaker ability to pay dividends.
If less profitable firms have higher likelihood of falling into distress, i.e., lower distance to
default, their cash flows can have shorter duration. We evaluate this possibility by computing
a firm-level distance to default measure based on the Merton (1974) model. We find strong
evidence that controlling for the distance to default, high dividend stocks still have longer
duration than low dividend stocks. Hence, these results reinforce the long duration puzzle
for high dividend stocks.
What is special about dividend payout in and of itself? In the pioneering paper by
Miller and Modigliani (1961), dividend policy is irrelevant to a firm’s value in the world
with uncertainty but perfect capital markets, because investors are indifferent between the
income (dividend) and capital gain components of returns. The intuition is straightforward:
in the idealized capital market, investors can transform income to capital gain and vice versa
without costs according to their own preferences; as a result, dividends play no special role in
driving investor demand. In real capital markets with frictions, however, the transformation
4
between income and capital gains incurs transaction costs. For investors demanding regular
income streams over a long period, e.g., retirees who demand regular monthly income flows
to finance their desired consumption plans in the next 15 years, the income component of
returns, i.e., the dividend yield, may have desirable attributes that attract their demand.
A natural place for investors to gain income-driven assets is the bond market. In partic-
ular, long-term bonds may have special advantages for long-horizon investors with relatively
well defined income demand. The ability of long-term bonds to finance future consumption
streams, however, depends on the level of interest rates. Under the environment with per-
sistently low interest rates (e.g., nominal and real interest rates hovering slightly above zero
in the current extremely accommodative monetary policy regimes), long-term bonds tend
to lose their superior long-term investment value. A greener pasture for income-oriented
investors in such an environment may be dividend paying stocks, especially those with high
dividend yields that offer sufficiently powerful income streams to support desirable consump-
tion plans. We argue that this hypothesis of “reaching for dividends” in a low interest rate
environment is an important contributor to the longer duration of high dividend stocks.
Delving into this hypothesis, we exploit a comprehensive data set of quarterly institutional
investor holdings of U.S. equities from 1980 to 2014 to study their portfolio decisions of high
and low dividend stocks under different interest rate environments. This data set, available
to us due to the Securities and Exchange Commission’s required 13F filings, allows us to
classify institutions according to their legal types into banks, insurance companies, mutual
funds, investment advisors, and others (pension funds, endowments and others) at the level
of individual investment companies. We find that under high interest rate environments
(top 20% of quarters with high long-term interest rates), all five types of institutions tend to
underweight high dividend stocks in their portfolios relative to the market, in line with the
idea that institutional investors tend to prefer share repurchases to dividends as distributions.
Under low interest rate environments (bottom 20% of quarters with low long-term interest
rates), however, the institutional aversion to high dividend stocks universally shrinks, with
mutual funds and insurance companies tending to overweight high dividend stocks in their
portfolios relative to the market. This pattern is particularly pronounced for mutual funds:
5
when interest rates are high, they underweight high dividend stocks by more than 4% relative
to the market portfolio; however, when interest rates are low, they overweight high dividend
stocks by more than 2% relative to the market.
Among mutual funds, income-oriented equity funds are natural buyers of high dividend
stocks. We find that the aggregate preference for high dividend stocks by mutual funds
appears to be driven by the behavior of income funds. First, over 1963 to 2014, mutual fund
investors send disproportionately more money to income funds when interest rates are low.
The time-series correlation between excess flows into income funds over those into the entire
equity funds and long-term interest rates is -50% and highly statistically significant. This
impetus for the expansion of income funds within the mutual fund sector due to fund flows
is important for the aggregate preference of mutual funds for high dividend stocks. Second,
income funds as a group appear to more aggressively overweight high dividend stocks when
interest rates are lower. Despite their overall tilting toward stocks with higher dividends,
when interest rates are high, income funds on average underweight stocks in the top quintile
with the highest dividend yields by 1.3% relative to the market, but overweight stocks in the
fourth quintile with high dividend yields by 5%. When interest rates are low, income funds
overweight stocks with the highest dividend yields in the top quintile by 4.5% and those in
the fourth quintile by 9.3% relative to the market.
What may be driving this change in the behavior of income fund managers across different
interest rate environments? Our analysis of flows across income funds indicates that flows
are sensitive not only to net fund returns but also to their dividend yields, and the influence
of dividends on fund flows depends crucially on the level of interest rates. In particular, when
interest rates are low, the tournament for clients’ money among income funds rewards funds’
ability to generate income (dividends), incremental to their ability to generate total return.
The pressure of competition naturally leads income funds to reach further for dividends in
low interest rate environments.
This tilting in the demand for high dividend stocks when interest rates fall to a lower
level can impact the prices of high dividend stocks, increasing their sensitivities to interest
rate changes. As an illustration of this view, we form portfolios on the basis of dividend
6
yields and the weights of stocks in the income fund portfolio in excess of those in the market
portfolio. We find that, for high dividend stocks, stocks with high income fund holdings
tend to have duration longer than those with low income fund holdings by 1.24 years. That
is, when interest rates decline by 1%, the prices of high dividend stocks with high income
fund holdings on average increase by an additional 1.24% relative to those of high dividend
stocks with low income fund holdings. This result shows that “reaching for dividends is an
important contributor to the high duration puzzle of high dividend stocks.
The rest of this article is organized as follows. Section 2 reviews the related literature.
Section 3 starts with a motivating theoretical framework for our empirical design and then
introduces the data and sample. Section 4 presents a long duration puzzle for high dividend
stocks. Section 5 studies investor demand for high dividend stocks and the resulting impact
on their duration. Section 6 includes robustness tests and Section 7 concludes.
2 Related Literature
The literature on equity duration is scarce. Earlier studies of equity duration (e.g., Lanstein
and Sharpe (1978); Cornell (1999)) emphasize the connection between stock market beta
and duration, and point to the importance of controlling for the exposures to aggregate
stock market when estimating equity duration. Sharing with us a common theme on firm-
level equity duration, Dechow, Sloan, and Soliman (2004) follow a different route with a
different focus. They construct a measure of implied equity duration for individual firms,
using the formula of Macaulay duration as the weighted average of the time to the receipt
of prospective cash flows on the firms’ common shares. Their main innovation is to exploit
financial statement analysis to create a forecasting model for individual firms’ future cash
flows, which leads to an estimate of the firms’ imputed equity duration. They then explore
how duration risk may be priced in the cross-section of stock returns. We instead use an
empirical approach to estimate firms’ equity duration, and examine the actual behavior
of equity duration from the perspective of an equity valuation model. Identifying a long
duration puzzle for high dividend stocks, we explore the market force contributing to this
7
puzzle and flesh out new evidence on “reaching for dividends.”
Our study contributes also to several other strands of literature. First, it extends the
growing literature that studies the comovement between aggregate stock and bond markets.
This literature emphasizes the time-varying nature of stock and bond correlations (e.g.,
Baele, et al., 2010; Campbell, et al., 2013). Our study focuses on the cross-section of stocks.
In our empirical estimation of equity duration, we use various specifications that control for
aggregate stock market movements, and other commonly used broad return factors such as
the value, size and momentum factors. This design allows us to focus on the heterogeneity
of interest rate exposures across stocks, after we tease out the common variation in stock
returns due to their exposures to equity risk. The rich information from individual stocks
can provide useful information to better understand the determinants of equity duration.
Therefore, our work can be an important extension of this literature.
Second, there is a new but growing literature on equity yields (see, Binsbergen and Koijen,
2015 for an excellent review). So far this literature focuses primarily on a few major stock
indices for a short period due to data limitation. Our study of the behavior of equity duration
for the broad cross-section of stocks over a long time span can provide a micro-foundation
to better understand the price of equity duration.
Third, our paper builds on the earlier literature on the interest rate elasticity of stock
prices and extends the literature on inflation risk in equity markets. Specifically, Haugen
and Wichern (1979) provide an analytic framework for interest rate elasticity of both bonds
and stocks. They recognize that the notion of duration can be quite useful for understanding
movements in bond and stock prices. Our study can be viewed as building on their analytic
results and pioneer important drivers of the actual behavior of equity duration. Moreover,
our focus on the interest rate sensitivities of stock prices makes our study related to but
distinct from the large literature on how inflation influences stock prices (e.g., Fama and
Schwert, 1977; Modigliani and Cohn, 1979; Boudoukh and Richardson, 1993; Bekaert and
Engstrom, 2010). Simply put, movements in long-term interest rates contain information
on the variation in expected inflation, expected future real short-term interest rates, and
the term premium that reflects, e.g., compensation for inflation and future interest rate
8
uncertainty. As a result, equity duration has distinctive features from equity inflation risk.
Finally, the proposed study contributes to the important literature on how the behavior
of institutions impacts asset prices (e.g., He and Krishnamurthy, 2013; Vayanos and Woolley,
2013). To the best of our knowledge, our paper is the first to document how dividend payouts
affect the competition among income funds for their clients’ money and how the strength of
competition among this dimension varies across different interest rate environments. Consid-
ering the explosion of mutual fund assets in the past decades and the increasingly important
role of monetary policy in asset markets, our paper deepens our understanding of mutual
fund behavior and its impact on asset markets.
3 Equity Duration: A Motivating Framework
In this section, we set up a framework of equity duration that motivates our empirical
analyses, and then introduce the data and empirical methodology.
3.1 Equity Duration in Dividend Discount Model
Our notion of equity duration is conceptually similar to the bond duration, which points to
both the sensitivities of bond prices to changes in interest rates and the average maturity
of a bond’s cash flows. Despite the popularity of duration in valuing fixed income securities
since the seminal work by Macaulay (1938), equity duration has received much less attention
in the literature.2 In what follows, we start with a simple dividend discount model to gain
intuition regarding equity duration.
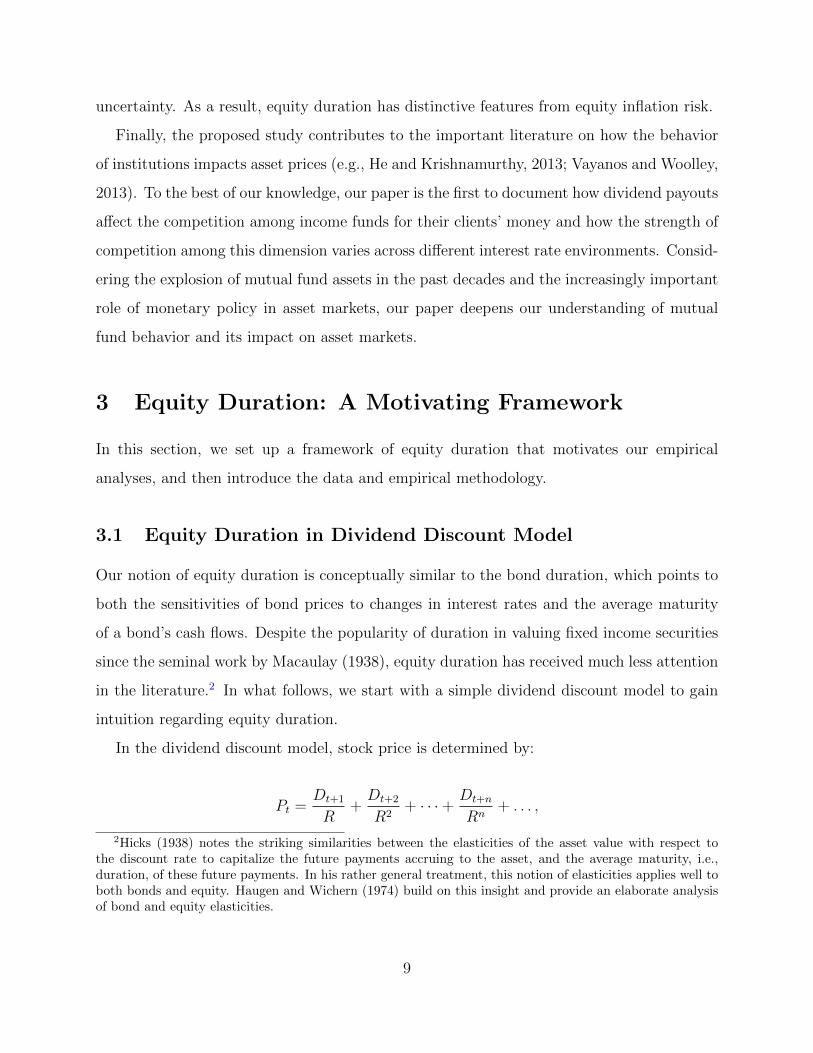
In the dividend discount model, stock price is determined by:
Pt =Dt+1
R+Dt+2
R2+ · · ·+ Dt+n
Rn+ . . . ,
2Hicks (1938) notes the striking similarities between the elasticities of the asset value with respect tothe discount rate to capitalize the future payments accruing to the asset, and the average maturity, i.e.,duration, of these future payments. In his rather general treatment, this notion of elasticities applies well toboth bonds and equity. Haugen and Wichern (1974) build on this insight and provide an elaborate analysisof bond and equity elasticities.
9
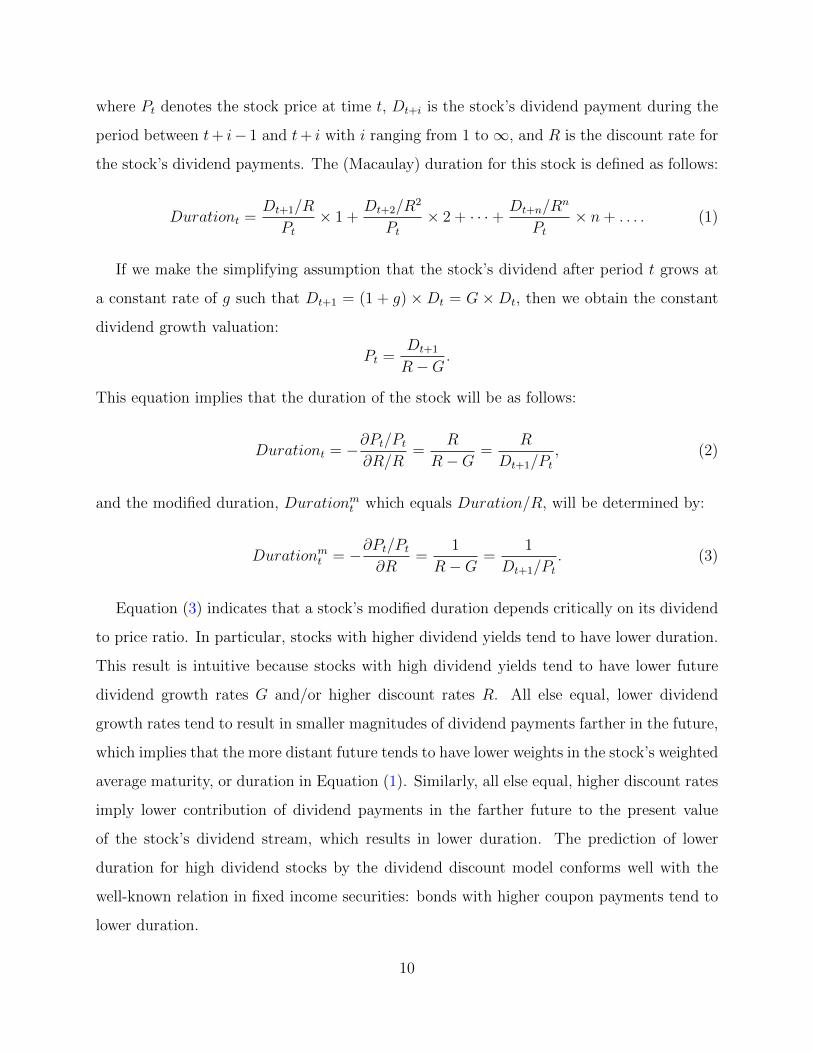
where Pt denotes the stock price at time t, Dt+i is the stock’s dividend payment during the
period between t+ i− 1 and t+ i with i ranging from 1 to∞, and R is the discount rate for
the stock’s dividend payments. The (Macaulay) duration for this stock is defined as follows:
Durationt =Dt+1/R
Pt
× 1 +Dt+2/R
2
Pt
× 2 + · · ·+ Dt+n/Rn
Pt
× n+ . . . . (1)
If we make the simplifying assumption that the stock’s dividend after period t grows at
a constant rate of g such that Dt+1 = (1 + g) ×Dt = G ×Dt, then we obtain the constant
dividend growth valuation:
Pt =Dt+1
R−G.
This equation implies that the duration of the stock will be as follows:
Durationt = −∂Pt/Pt
∂R/R=
R
R−G=
R
Dt+1/Pt
, (2)
and the modified duration, Durationmt which equals Duration/R, will be determined by:
Durationmt = −∂Pt/Pt
∂R=
1
R−G=
1
Dt+1/Pt
. (3)
Equation (3) indicates that a stock’s modified duration depends critically on its dividend
to price ratio. In particular, stocks with higher dividend yields tend to have lower duration.
This result is intuitive because stocks with high dividend yields tend to have lower future
dividend growth rates G and/or higher discount rates R. All else equal, lower dividend
growth rates tend to result in smaller magnitudes of dividend payments farther in the future,
which implies that the more distant future tends to have lower weights in the stock’s weighted
average maturity, or duration in Equation (1). Similarly, all else equal, higher discount rates
imply lower contribution of dividend payments in the farther future to the present value
of the stock’s dividend stream, which results in lower duration. The prediction of lower
duration for high dividend stocks by the dividend discount model conforms well with the
well-known relation in fixed income securities: bonds with higher coupon payments tend to
lower duration.
10
Before leaving this subsection, we shall note that whereas we use the special case of a
constant dividend growth model to derive an exact formula of equity duration, the qualitative
relation between the timing of dividend payments and equity duration is rather general.3
Moreover, our empirical tests should not be viewed as literally testing the constant dividend
growth model.
3.2 Empirical Methodology and Data
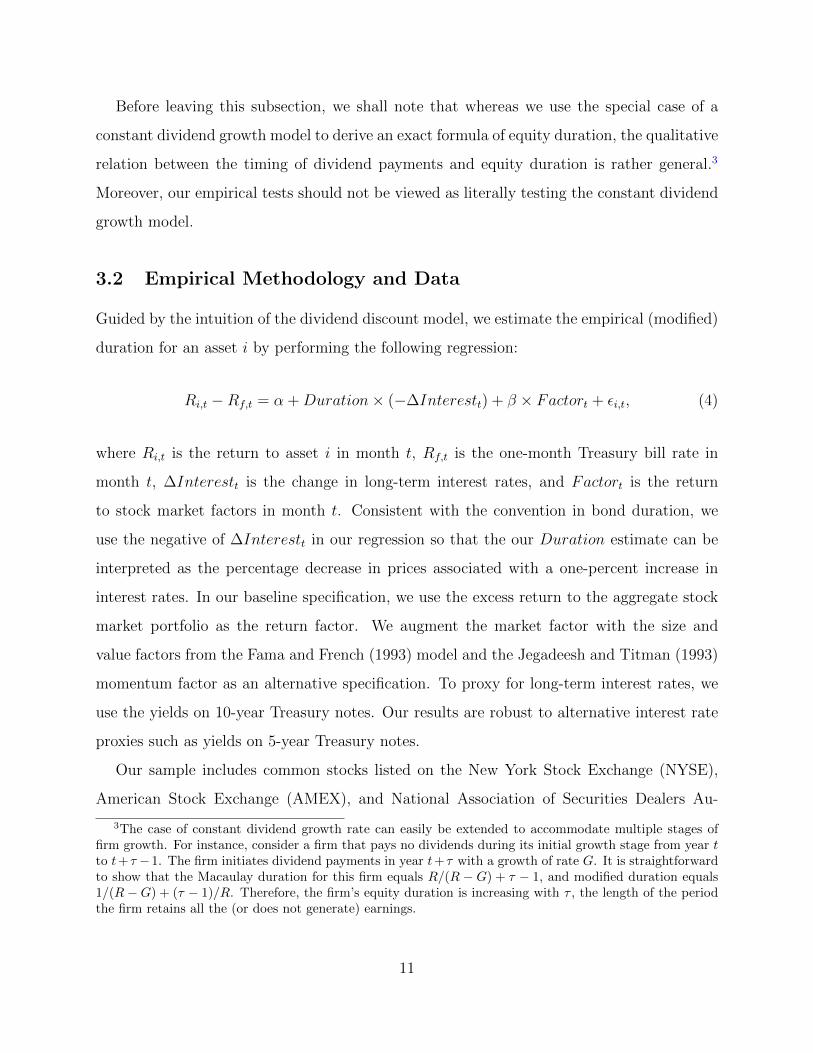
Guided by the intuition of the dividend discount model, we estimate the empirical (modified)
duration for an asset i by performing the following regression:
Ri,t −Rf,t = α +Duration× (−∆Interestt) + β × Factort + εi,t, (4)
where Ri,t is the return to asset i in month t, Rf,t is the one-month Treasury bill rate in
month t, ∆Interestt is the change in long-term interest rates, and Factort is the return
to stock market factors in month t. Consistent with the convention in bond duration, we
use the negative of ∆Interestt in our regression so that the our Duration estimate can be
interpreted as the percentage decrease in prices associated with a one-percent increase in
interest rates. In our baseline specification, we use the excess return to the aggregate stock
market portfolio as the return factor. We augment the market factor with the size and
value factors from the Fama and French (1993) model and the Jegadeesh and Titman (1993)
momentum factor as an alternative specification. To proxy for long-term interest rates, we
use the yields on 10-year Treasury notes. Our results are robust to alternative interest rate
proxies such as yields on 5-year Treasury notes.
Our sample includes common stocks listed on the New York Stock Exchange (NYSE),
American Stock Exchange (AMEX), and National Association of Securities Dealers Au-
3The case of constant dividend growth rate can easily be extended to accommodate multiple stages offirm growth. For instance, consider a firm that pays no dividends during its initial growth stage from year tto t+ τ −1. The firm initiates dividend payments in year t+ τ with a growth of rate G. It is straightforwardto show that the Macaulay duration for this firm equals R/(R − G) + τ − 1, and modified duration equals1/(R −G) + (τ − 1)/R. Therefore, the firm’s equity duration is increasing with τ , the length of the periodthe firm retains all the (or does not generate) earnings.
11
tomated Quotations (NASDAQ) during the period from July 1963 to December 2014, as
available from the Center for Research in Security Prices (CRSP). Consistent with prior
literature, we require the CRSP share codes to be either 10 or 11 and exclude stocks with
prices below $5 as of the portfolio formation date.
Accounting data such as dividends to common shareholders are from the Compustat.
Macroeconomic data such as the Treasury bond yields come from the Federal Reserve Eco-
nomic Data (FRED) maintained by the St. Louis Fed. Our institutional holdings data come
from the SEC 13 F filings and mutual fund holdings data from the SEC N-30D filings, both
collected by the Thomson Reuter. Mutual fund returns, flows, dividends and other fund-
specific information come from the CRSP. Data on stock return factors and risk-free rates
are from Kenneth French.
4 A Long Duration Puzzle of High Dividend Stocks
4.1 Baseline Results
We start by estimating how the interest rate sensitivity of stocks prices is related to their
dividend payouts. To reduce the estimation error, we follow the standard approach in the
asset pricing literature by estimating stock duration on portfolio levels. Specifically, at the
end of each June from year 1963 to year 2014, we sort stocks into quintile portfolios based
on their dividend to price ratios (or dividend to book equity ratio) measured at the most
recent fiscal year end. We compute the value-weighted returns for each quintile portfolio,
and then estimate the duration of each portfolio by performing regression (4). Our proxy
for the interest rate is the yield on 10-year Treasury notes.4
Table 1 presents the estimation results. Counter to the intuition from the dividend dis-
count model, which predicts a negative association between equity duration and dividend
4We have used the yield on 5-year Treasury notes as an alternative measure of the interest rate andobtained qualitatively similar results. For even longer maturities, the U.S. Treasury discontinued the 20-year constant maturity series at the end of calendar year 1986 and reinstated that series on October 1, 1993.As a result, there are no 20-year rates available for the time period January 1, 1987 through September30, 1993. Similarly, 30-year Treasury constant maturity series was discontinued on February 18, 2002 andreintroduced on February 9, 2006. We therefore focus on the yield on 10-year Treasury notes.
12
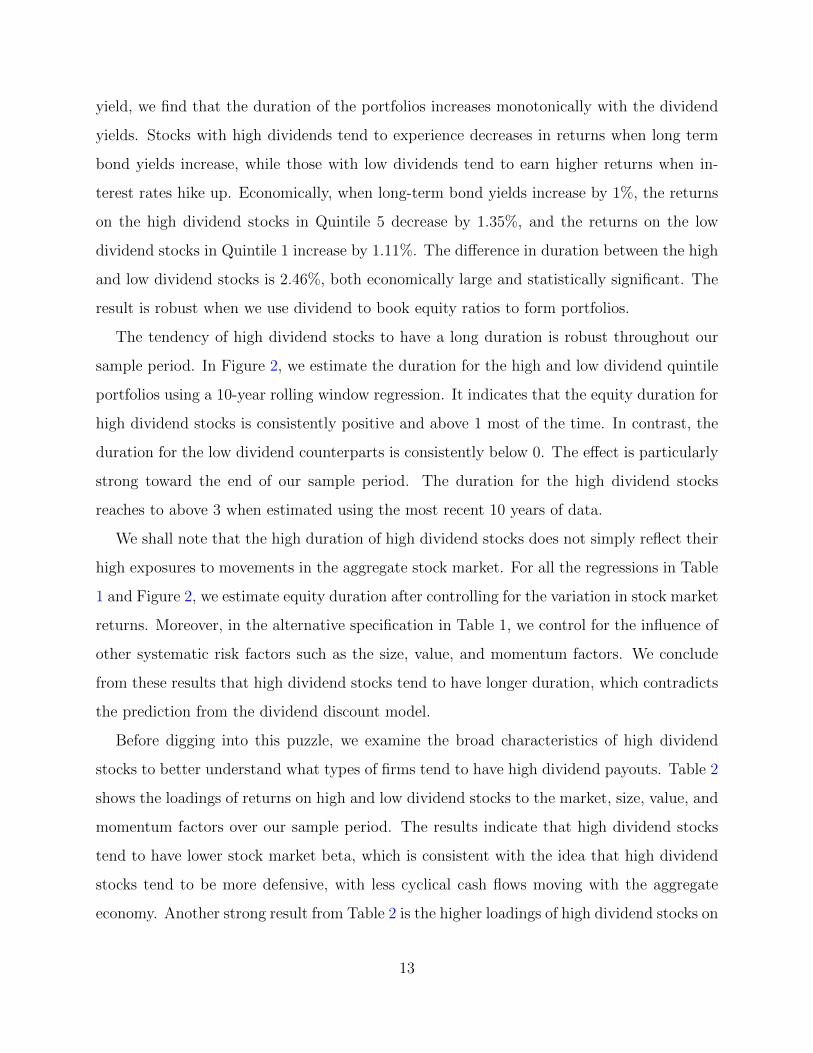
yield, we find that the duration of the portfolios increases monotonically with the dividend
yields. Stocks with high dividends tend to experience decreases in returns when long term
bond yields increase, while those with low dividends tend to earn higher returns when in-
terest rates hike up. Economically, when long-term bond yields increase by 1%, the returns
on the high dividend stocks in Quintile 5 decrease by 1.35%, and the returns on the low
dividend stocks in Quintile 1 increase by 1.11%. The difference in duration between the high
and low dividend stocks is 2.46%, both economically large and statistically significant. The
result is robust when we use dividend to book equity ratios to form portfolios.
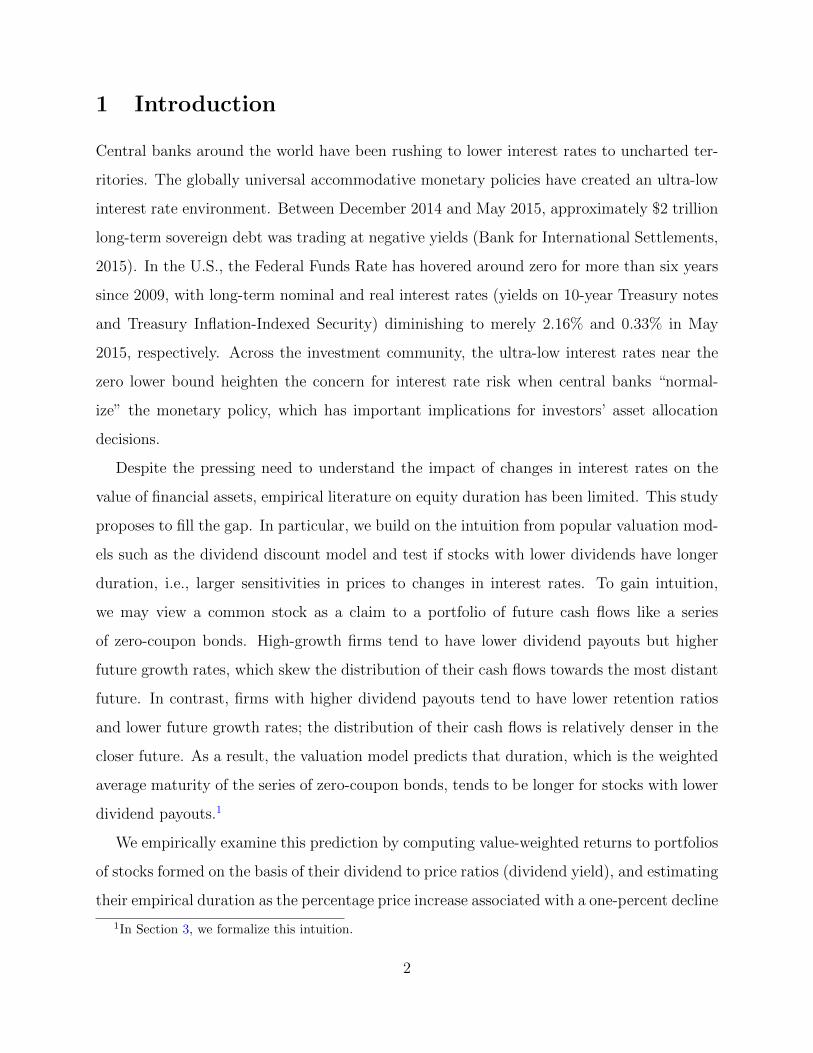
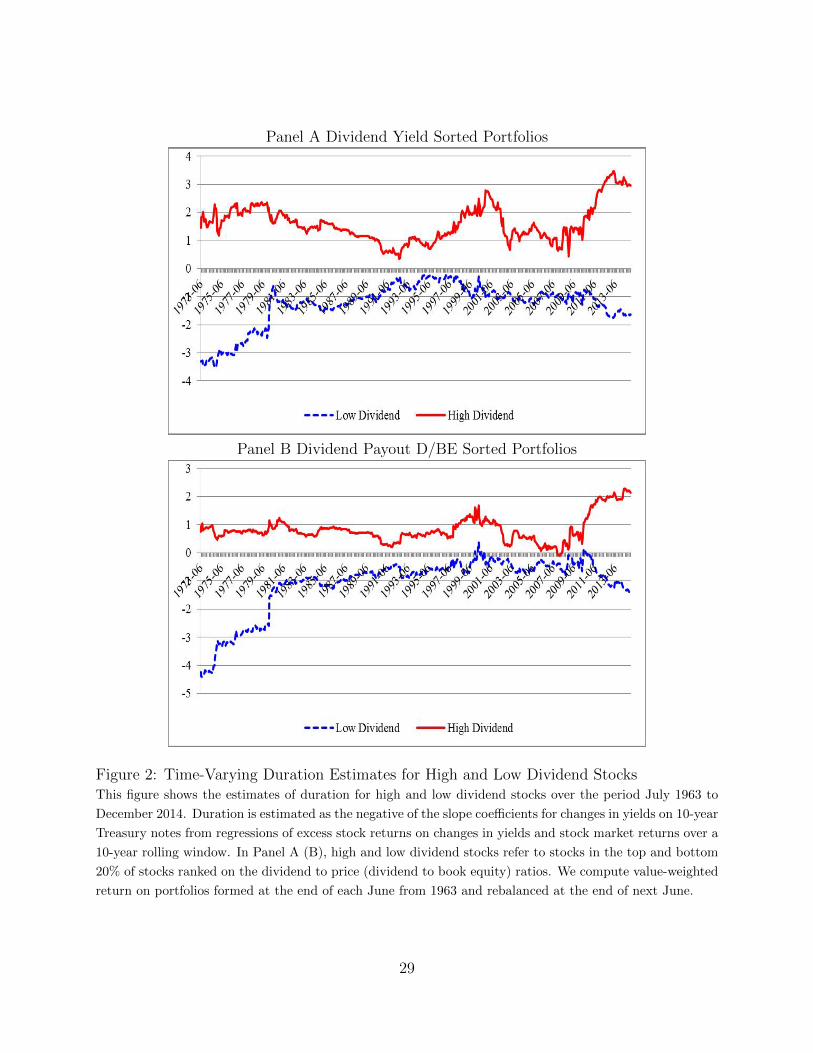
The tendency of high dividend stocks to have a long duration is robust throughout our
sample period. In Figure 2, we estimate the duration for the high and low dividend quintile
portfolios using a 10-year rolling window regression. It indicates that the equity duration for
high dividend stocks is consistently positive and above 1 most of the time. In contrast, the
duration for the low dividend counterparts is consistently below 0. The effect is particularly
strong toward the end of our sample period. The duration for the high dividend stocks
reaches to above 3 when estimated using the most recent 10 years of data.
We shall note that the high duration of high dividend stocks does not simply reflect their
high exposures to movements in the aggregate stock market. For all the regressions in Table
1 and Figure 2, we estimate equity duration after controlling for the variation in stock market
returns. Moreover, in the alternative specification in Table 1, we control for the influence of
other systematic risk factors such as the size, value, and momentum factors. We conclude
from these results that high dividend stocks tend to have longer duration, which contradicts
the prediction from the dividend discount model.
Before digging into this puzzle, we examine the broad characteristics of high dividend
stocks to better understand what types of firms tend to have high dividend payouts. Table 2
shows the loadings of returns on high and low dividend stocks to the market, size, value, and
momentum factors over our sample period. The results indicate that high dividend stocks
tend to have lower stock market beta, which is consistent with the idea that high dividend
stocks tend to be more defensive, with less cyclical cash flows moving with the aggregate
economy. Another strong result from Table 2 is the higher loadings of high dividend stocks on
13
the value factor, which is consistent with the intuition exposited in Subsection 3.1 that firms
with lower (higher) future growth prospects tend to pay higher (lower) dividends. These two
salient features are robust to using the dividend yield or dividend to book equity ratio to
measure dividend payouts. When we use the dividend to book equity ratio to form portfolios,
we find that high dividend stocks tend to be larger, although this result disappears when we
measure dividend payouts using the dividend yield. In summary, in line with our intuition,
we find firms with less cyclical cash flows and lower future growth prospects tend to pay out
more dividends, which nevertheless have a longer duration.
4.2 Cash Flow Volatility and Distance to Default
One caveat of the dividend discount model is that it does not take into account the uncer-
tainty of the cash flows. As argued by Haugen and Wichern (1974), risky securities may be
less sensitive to interest rate changes and have shorter duration, because the relative con-
tribution from distant cash payments to the total present value is small as compared with
a risk free security. In other words, the certainty equivalents of risky securities’ future cash
flows decay with increasing terms.
The link between cash flow risk and dividends is strongly rooted in the dividend literature.
Lintner (1956) reports that managers are reluctant to distribute higher dividends if they face
high uncertainty and may have to reduce the future dividend payment due to lower earnings.
This finding of conservatism in dividend policy is confirmed by a more recent study by Brav
et al. (2005). Hoberg and Prabhala (2009) provide empirical evidence that dividends are
negatively related to firms’ cash flow risk. If stocks with higher dividends tend to have lower
cash flow risk, then their sensitivity to interest rate changes will be relatively larger. This
consideration leads us to examine whether the long duration of high dividend stocks may
be driven by their low cash flow risk. As shown in a recent stream of studies documenting
a secular increase in idiosyncratic risk and its importance in driving firms’ cash flow risk
(Campbell et al., 2001; Campbell and Taksler, 2003; Pastor and Veronesi, 2003; Brandt,
Brav, and Graham, 2005), we study whether the high interest rate sensitivity of the high
dividend stocks is due to their potential lower idiosyncratic risk.
14
We perform double sorts. Specifically, at the end of each June, we independently sort
stocks into five quintile portfolios on the basis of their dividend to price ratios along one
dimension and idiosyncratic volatilities in the past year along another dimension. Twenty-
five portfolios thus emerge from the intersection of the double sorts. We then estimate
the interest rate sensitivities of the portfolios using Regression (4). As shown in Table 3,
conditional on the level of idiosyncratic volatility, stocks with high dividends continue to
have higher duration. Impressively, the duration puzzle remains strong even for the groups
of stocks with low idiosyncratic volatility, suggesting that cash flow risk cannot fully explain
the duration puzzle.
Another related explanation is the distance to default, which determines the expected life
expectancy of firms’ cash flows. When a firm files for bankruptcy, it may pay a liquidating
dividend to its shareholders, which truncates the distribution of its future cash flows to zero
and results in a lower duration. Intuitively, a financially distressed firm with a low distance
to default may have limited ability and/or willingness to distribute dividends to shareholders.
If the portfolio of low dividend stocks contains a large proportion of financially distressed
firms with a low distance to default, the portfolio’s duration may be low for this reason.
In Table 4, we test whether distance to default could explain the duration puzzle. We
measure the distance to default following Bharath and Shumway (2008). Their measure is
based on the Merton (1974) bond pricing model, but does not require solving for the implied
asset value and volatility. Similar to what we did in Table 4, we double sort stocks into 25
portfolios based on firms’ distances to default and dividend to price ratios. We find that
controlling for the distance to default, stocks with high dividends continue to have higher
duration than those with low dividends. These results reinforce the long duration puzzle of
high dividend stocks, and motivate us to search for an explanation based on the behavior of
investors in dividend-paying stocks.
15
5 A Hypothesis of “Reaching for Dividends”
Inspired by the growing literature on how investor demand moves asset prices, in this section
we explore the demand for high dividend stocks and its potential influence on their prices,
advancing a hypothesis of reaching for dividends when interest rates fall. While a full
explanation of the long duration puzzle for high dividend stocks should involve many forces
and clearly goes beyond the scope of this paper, we believe that the particular mechanism of
interest rate-sensitive investor demand represents an important factor contributing to this
phenomenon.
5.1 Reaching for Dividends when Interest Rates Fall: A Hypoth-
esis of Investor Demand
What is special about dividend payout in and of itself? According to Miller and Modigliani
(1961), a firm’s dividend policy per se is irrelevant to its value in the world with perfect capital
markets, because investors can transform income to capital gain and vice versa without costs
according to their own preferences, e.g., creating “home-made” dividends by realizing capital
gains. In real capital markets with frictions, however, the transformation between income
and capital gains incurs transaction costs.5 For investors demanding regular income streams
over a long period, e.g., retirees who demand regular monthly income flows to finance their
desired consumption plans in the next 15 years, or insurance companies that offer annuities
so that they are obligated to make regular cash payments to the policy holders for a long
period of time, the income component of returns may have desirable attributes that attract
their demand.
A natural place for investors to gain income-driven assets is the bond market. In partic-
ular, long-term bonds may have special advantages for long-horizon investors with relatively
well defined income demand. The ability of long-term bonds to finance future consumption
5Huberman (1990) presents a model in which dividends may be irrelevant even in capital markets withtransaction costs. In his model economy, investors have a flexible liquidity account that absorbs any shocksfrom dividend payments so that their optimal portfolio choice is not affected by dividend payments. In ourhypothesis, however, certain investors are liquidity-constrained so that income from dividend-paying firmsis an important attribute influencing their demand.
16
streams, however, depends on the level of interest rates. Under the environment with per-
sistently low interest rates (e.g., nominal and real interest rates hovering slightly above zero
in the current extremely accommodative monetary policy regimes), long-term bonds tend
to lose their superior long-term investment value. A greener pasture for income-oriented
investors in such an environment may be dividend paying stocks, especially those with high
dividend yields that offer sufficiently powerful income streams to support desirable consump-
tion plans. We argue that this hypothesis of “reaching for dividends” in a low interest rate
environment is an important contributor to the longer duration of high dividend stocks.
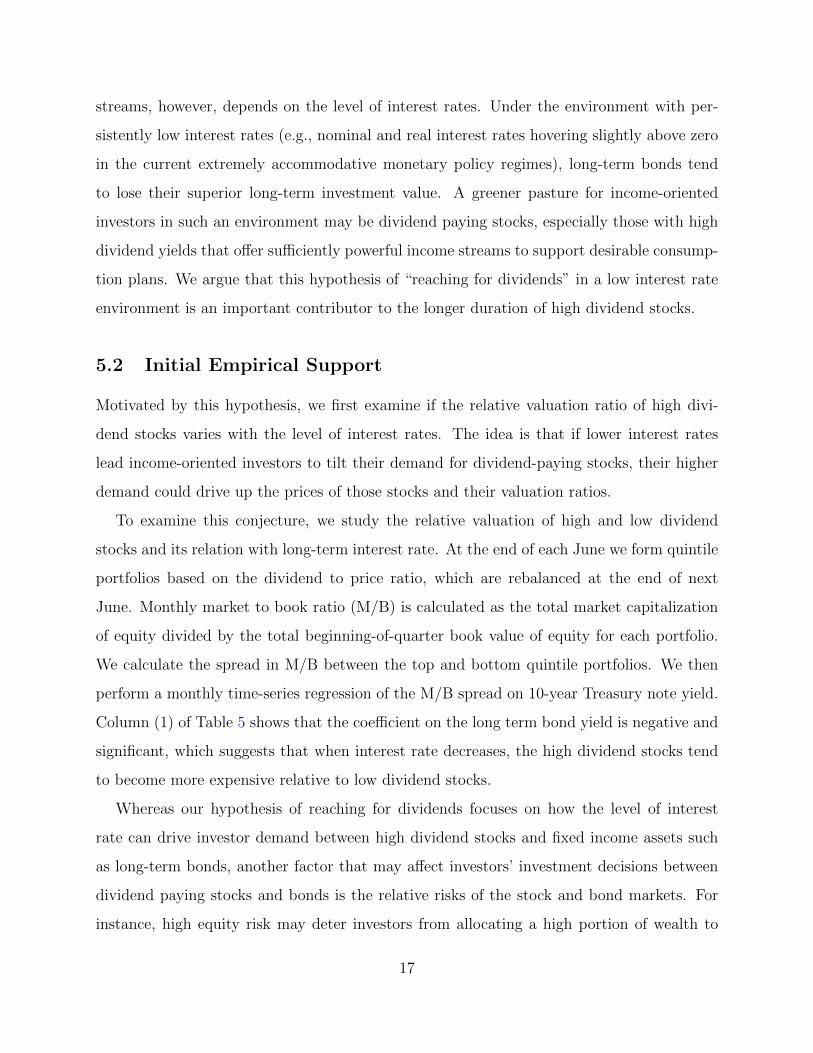
5.2 Initial Empirical Support
Motivated by this hypothesis, we first examine if the relative valuation ratio of high divi-
dend stocks varies with the level of interest rates. The idea is that if lower interest rates
lead income-oriented investors to tilt their demand for dividend-paying stocks, their higher
demand could drive up the prices of those stocks and their valuation ratios.
To examine this conjecture, we study the relative valuation of high and low dividend
stocks and its relation with long-term interest rate. At the end of each June we form quintile
portfolios based on the dividend to price ratio, which are rebalanced at the end of next
June. Monthly market to book ratio (M/B) is calculated as the total market capitalization
of equity divided by the total beginning-of-quarter book value of equity for each portfolio.
We calculate the spread in M/B between the top and bottom quintile portfolios. We then
perform a monthly time-series regression of the M/B spread on 10-year Treasury note yield.
Column (1) of Table 5 shows that the coefficient on the long term bond yield is negative and
significant, which suggests that when interest rate decreases, the high dividend stocks tend
to become more expensive relative to low dividend stocks.
Whereas our hypothesis of reaching for dividends focuses on how the level of interest
rate can drive investor demand between high dividend stocks and fixed income assets such
as long-term bonds, another factor that may affect investors’ investment decisions between
dividend paying stocks and bonds is the relative risks of the stock and bond markets. For
instance, high equity risk may deter investors from allocating a high portion of wealth to
17
stock markets. Therefore, controlling for the risks of the two markets would allow us to draw
a sharper inference of the marginal contribution of the level of interest rate to the valuation
spread. Column (2) shows that the negative relation between long-term bond yield and
the valuation spread is indeed stronger once we control for the volatility of stock and bond
markets. Also, consistent with relative risks being a factor that influences investors’ relative
preference for bonds versus dividend paying stocks, the relative valuation of high dividend
stocks decreases when stock volatility is high, but increases when bond volatility is high.
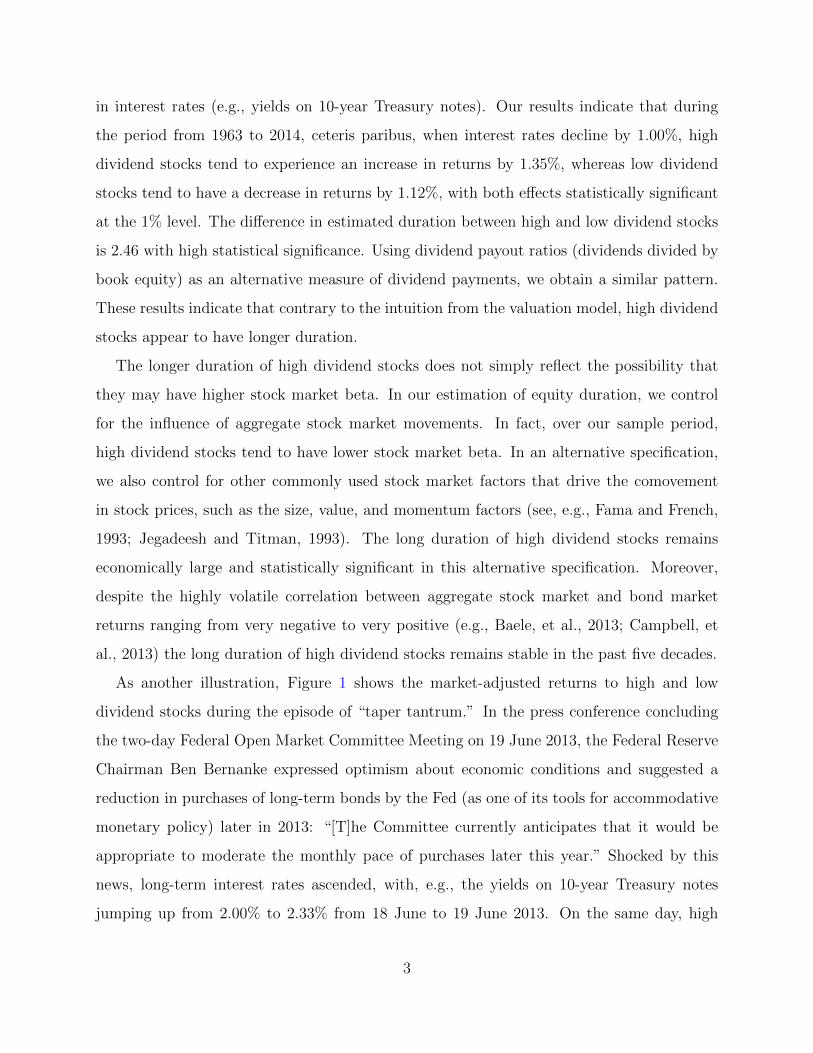
For a detailed dynamic description, Figure 3 plots the relation between the valuation
spread and interest rate. We filter out the effect of stock and bond market volatility to focus
on the marginal contribution of interest rate to the valuation spread. Consistent with Table
5, high dividend stocks tend to experience an increase (decrease) in valuation relative to low
dividend stocks when interest rate is low (high). The correlation between the two time series
is -0.42 with a p-value of 0.0001. The negative relation between the two series tends to hold
during most of the sample period, and the pattern is particularly strong after 1990, with a
correlation coefficient of -0.57.
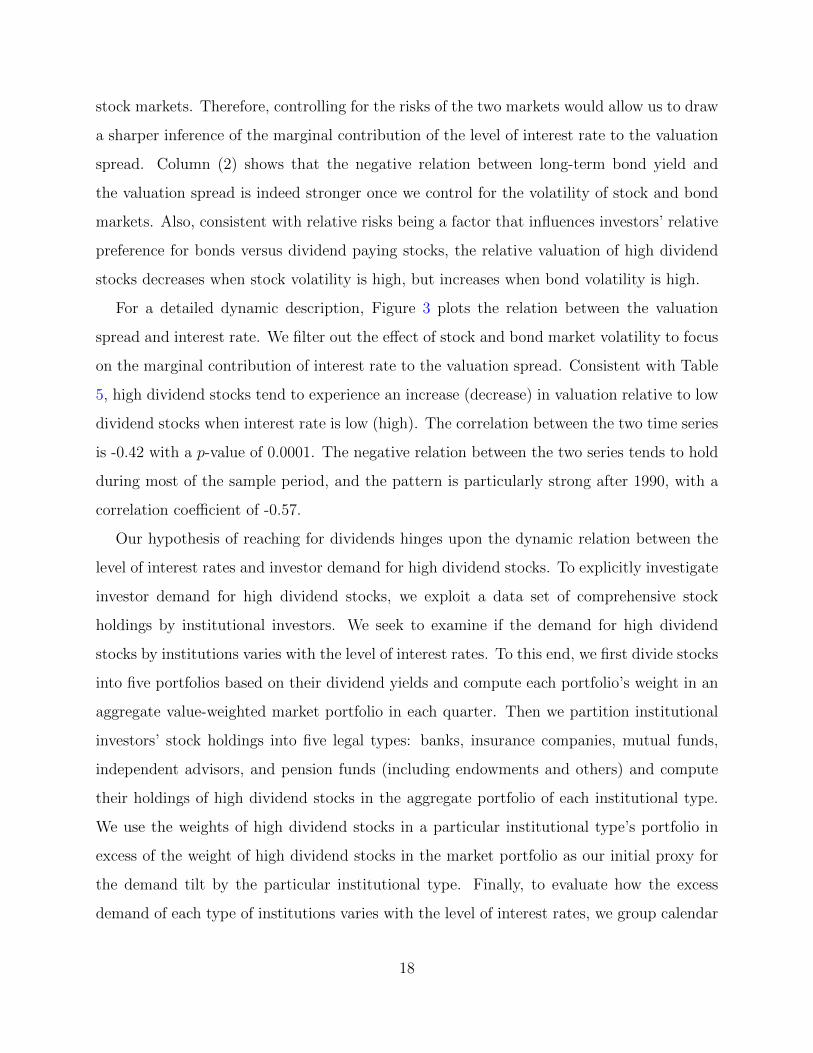
Our hypothesis of reaching for dividends hinges upon the dynamic relation between the
level of interest rates and investor demand for high dividend stocks. To explicitly investigate
investor demand for high dividend stocks, we exploit a data set of comprehensive stock
holdings by institutional investors. We seek to examine if the demand for high dividend
stocks by institutions varies with the level of interest rates. To this end, we first divide stocks
into five portfolios based on their dividend yields and compute each portfolio’s weight in an
aggregate value-weighted market portfolio in each quarter. Then we partition institutional
investors’ stock holdings into five legal types: banks, insurance companies, mutual funds,
independent advisors, and pension funds (including endowments and others) and compute
their holdings of high dividend stocks in the aggregate portfolio of each institutional type.
We use the weights of high dividend stocks in a particular institutional type’s portfolio in
excess of the weight of high dividend stocks in the market portfolio as our initial proxy for
the demand tilt by the particular institutional type. Finally, to evaluate how the excess
demand of each type of institutions varies with the level of interest rates, we group calendar
18
quarters in our sample into high and low interest rate periods, which refer to the top and
bottom 20% of quarters ranked on the basis of the 10 year Treasury note yields.
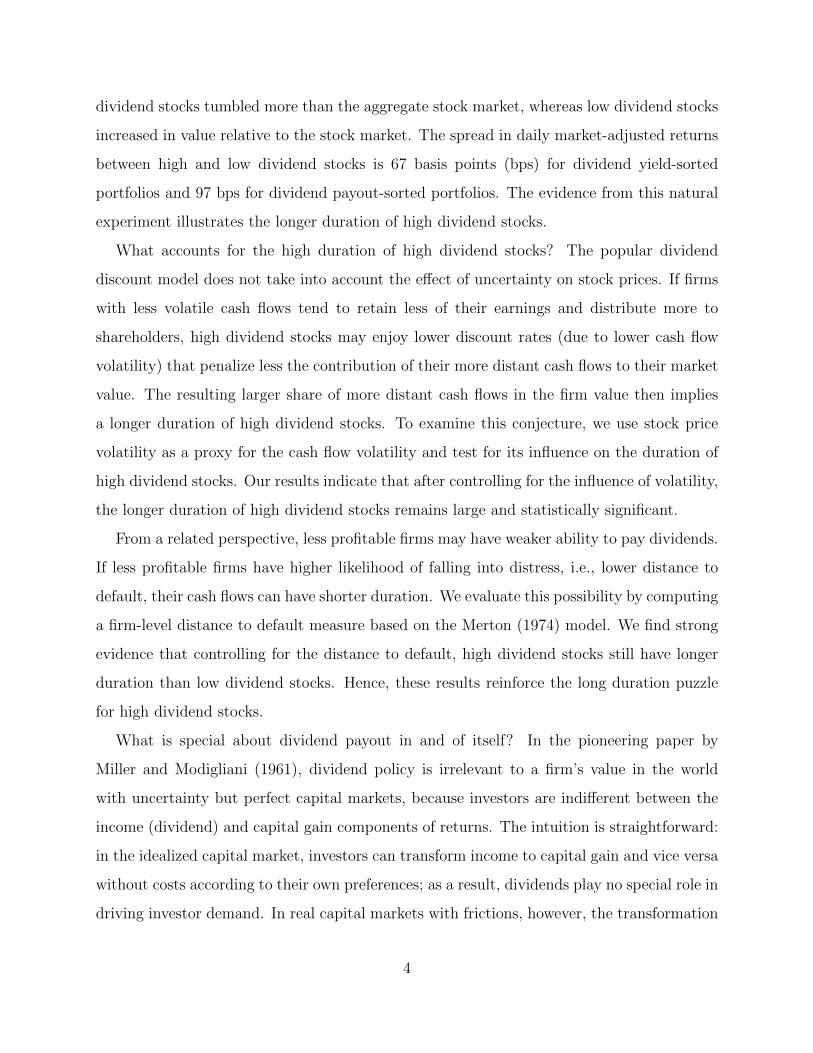
Figure 4 plots the average excess portfolio weights of high dividend stocks in the portfolio
of each institutional type under low and high interest rate regimes. The results indicate that
despite the widespread underweighting of high dividend stocks across institutional types in
high interest rate environments, they all tend to increase the weights of high dividend stocks
in their portfolios relative to the market when interest rate declines. Among the five types of
institutions, mutual funds are especially responsive to interest rate changes. Although they
underweight high dividend stocks relative to the market portfolio by 4.5% when interest rate
is high, they overweight those stocks by 2.3% during the low interest rate period. Another
institutional type that stands out is insurance companies, which choose to underweight high
dividend stocks by 3.6% when interest rates are high, but overweight them by 0.7% when
interest rates are low.
We then perform multivariate regressions to formally test how the demand by each type
of institutions varies with the level of interest rates. We are able to find reliable evidence for
the dynamic preference for high dividend stocks by insurance companies, mutual funds, and
independent advisors, which is reported in Table 6. Specifically, we run panel regressions
of the fraction of stocks owned by each type of institutional investors on the dividend price
ratio of the stocks, an interaction term between dividend price ratio and the level of yields on
10-year Treasury notes, and a battery of control variables including firm size, book-to-market
ratio, past annual return (momentum), the membership in the Standard & Poors 500 Index,
and time fixed effects. The first column in Table 6 shows that unconditionally, there is a
tendency for institutional investors to avoid high dividend stocks, which is consistent with the
findings by other studies that individual investors prefer high dividend stocks. The second
column shows that the preference of insurance companies, mutual funds, and independent
advisors for high dividend stocks significantly increases when the interest rate decreases.
19
5.3 Income-Oriented Equity Funds
In this subsection, we build on the evidence in the previous subsection that mutual funds
as a group exhibit a strong preference for high dividend stocks when interest rate is low.
We exploit detailed information on individual mutual funds and study the behavior of fund
flows and fund managers’ portfolio selection in different interest rate regimes. Among mutual
funds, income-oriented funds constitute the most natural buyers of high dividend stocks,
which leads to our focus. We flesh out fresh evidence that when interest rate is low, mutual
fund investors particularly favor the high income flows from income funds. They switch
more money to those funds that generate particularly high dividends, the effect of which
is incremental to funds’ performance based on total returns. The resulting higher demand
for high dividend stocks when interest rate is lower appears to drive up their interest rate
sensitivity.
The main objective of income-oriented funds, as typically stated in their prospectus, is to
seek relatively high current income and growth of income by investing primarily in dividend-
paying stocks. Consistent with their stated objective, we find in Table 7 that income funds
on average indeed overweight dividend paying stocks. During the period from 1980 to 2014
when detailed information on individual fund holdings is available, Column 1 of Table 7 shows
that income funds overweight the stocks in the highest 20% dividend yield bracket by 3%
and those in the second highest bracket by 6.8%. In contrast, they on average underweight
stocks in the lowest 20% dividend yield portfolio by 8.1%.
The allocation between low and high dividend stocks by income funds appears to depend
on the level of interest rates. When interest rate is low, we find that income funds exhibit
strong preferences for holding high dividend stocks: They overweight stocks in the top
quintile with the highest dividend yields by 4.5%, and overweight stocks in the fourth highest
dividend yield quintile by 9.3%. When interest rate is high, however, income funds tend to
be more reluctant to overweight high dividend stocks. In fact, they underweight stocks in
the top quintile with the highest dividend yields by 1.3%, and reduce the overweighting of
stocks in the second highest dividend bracket to 5%. It is this dynamic shift of the strength
20
of preferences for dividend paying stocks that is central to our hypothesis.6
How to understand the dynamic investment behavior of income funds? Viewed through
the perspective of financial intermediation, mutual funds amount to pools of money from
ultimate investors seeking to achieve their own investment objectives. Income funds naturally
aggregate the stock of money from investors with an objective of income generation. Since
fixed income assets and dividend paying stocks provide a reliable source of cash flows for
the purpose of income generation, they are the natural habitat for income-oriented investors
and mutual funds. The investment opportunities in fixed income markets depend critically
on the level of interest rates. In particular, when both real and nominal interest rates trend
down, bond valuation is inflated and the income-generating ability of bonds is weakened.
Accordingly, the relative attractiveness of dividend paying stocks is accordingly increased.
This mechanism, which is at the heart of our reaching for dividends hypothesis, yields three
testable predictions in the context of income funds, which we will examine one by one.
Prediction (1): When interest rates go down, investors switch more money to income-
oriented equity funds. Figure 5 provides evidence consistent with this prediction. It shows
a strong comovement between flows to income-oriented equity funds and long-term interest
rates. To tease out the influence of aggregate flows into and out of equity funds, we measure
proportional flows to income mutual funds in excess of the proportional flows to all equity
mutual funds. The results indicate that during the high interest rate regime such as early
1980s, income funds tend to receive less flows compared with other equity mutual funds. In
contrast, during the low interest rate period, such as the period post the millennium, income
funds receive more money flows than their peer equity mutual funds. The excess flows to
income funds reaches to its apex around 2011–2013 period, where the long term interest
rate is reaching its lowest historical level. Over the entire sample period, the excess flows to
income funds and long-term interest rates have a correlation of -0.50, which is statistically
significant at 1% level.
6As a back-of-envelope calculation, since the average stock holdings of equity income funds represent 72%of the total mutual fund equity holdings as computed from the SEC 13F filings, their overweighting of thetop quintile dividend stocks by 4.5%, all else equal, translates into 3.2% overweight of high dividend stocks inthe aggregate mutual fund portfolio. This computation suggests that income funds drive the 2.3% aggregatemutual fund portfolio tilt toward high dividend stocks when the interest rate is low as shown in Figure 4.
21
Prediction (2): When interest rates are low, investors reward income funds with higher
dividend yields by allocating more money to those funds. Table 8 provides evidence consis-
tent with this prediction. It reports the flow-performance relation for income funds. Unlike
the previous flow-performance analyses, we separately examine of the effects of funds’ past
net returns and their dividend yield components on fund flows. A fund’s dividend yield is
measured as the ratio between the amount of dividend distribution and the NAV at which
the dividends can be reinvested. To capture the dependence of the flow-performance relation
on the level of interest rates, we include in the regression interaction terms between the two
performance measures and long-term interest rates. We find that unconditionally investors
are indifferent between receiving capital gains or dividend yields, which is evidenced by the
significant positive coefficient on fund return yet insignificant coefficient on dividends. How-
ever, investors tend to switch attention from net fund returns to dividends when interest
rates are low. For example, when quarterly interest rate is at its lowest 20% quintile over the
sample period, a 1% increase in past quarter fund returns increases flows to income funds by
0.253%. In contrast, a 1% increase in past quarter dividend yields increases flows by 2.762%,
which is 11 times stronger than the effect of fund returns.
Overall, Figure 5 and Table 8 provide supporting evidence that mutual fund investors
reward income-oriented mutual funds and especially the income funds with high dividend
yields by switching more money to those funds, when long-term interest rate is low. Consis-
tent with the evidence in Table 7, as mutual fund investors prefer to receive dividends rather
than capital gains, income fund managers rationally respond to their clients by reaching for
high dividend stocks during the low interest rate period.
Prediction (3): Stocks with large holdings by income funds have a longer duration,
i.e., their prices are particularly sensitive to interest rate movements. Finally, we examine
whether income funds’ demand for high dividend stocks during the low interest rate period
serves as a contributing factor to the duration puzzle documented in our paper. To this end,
we test whether the duration of high dividend stocks varies with the amounts held by income
funds. Previous literature finds that to accommodate flows into or out of mutual funds, their
managers tend to at least partially scale up or down their existing portfolio positions (Lou,
22
2012). This result implies that stocks held more by income funds may experience stronger
flow-induced demand pressure, which, combined with the sensitivity of income fund flows to
interest rates, leads those stocks to a higher interest rate sensitivity. Table 9 presents the
duration estimates for the 25 portfolios sorted by stocks’ dividend to price ratios and their
weights held by income funds in excess of their weights in the market portfolio. We find for
high dividend stocks, those with high income fund holdings tend to have longer durations
than those with low income fund holdings. The interest rate sensitivity for high dividend
stocks is the strongest for the portfolio with the highest income fund holdings. 1% increase
in interest rate would decrease the returns of the portfolio by 1.84%, which is three times
the effect on their low income-fund-holding counterparts.
6 Conclusions
The persistently low interest rate around the globe has highlighted the importance of interest
rate risk in driving the value of financial assets. This paper studies the duration of individual
stocks, i.e., the sensitivities of stock prices to changes in interest rates, to advance our
understanding of this important issue. We find that, counter to the intuition from the
dividend discount model, stocks that pay higher dividends tend to have longer duration,
experiencing greater price declines (increases) when interest rates rise (fall). We refer to this
phenomenon as the long duration puzzle on high dividend stocks.
We then focus on one particular mechanism based on investor demand to explore the
potential driving forces of this puzzle. Specifically, we use data on mutual fund flows and
institutional investor holdings, and find evidence of “reaching for dividends”: when interest
rates fall, investors switch more funds to income-oriented mutual funds, and the weights
of high dividend stocks in the portfolios of income-dependent institutions such as income
mutual funds and insurance companies increase. The resulting higher demand for high
dividend stocks appears to increase the sensitivities of their prices to interest rate changes,
thereby contributing to their long duration puzzle.
Our results point to interesting future research. One direction is to deepen the study
23
of investment behavior of retail and institutional investors across asset classes, especially
between long-term bonds and high dividend stocks. Our evidence suggests that these two
asset classes compete to win investors’ wealth allocation, and that the flows of funds across
the asset classes vary through different interest rate regimes and thus the business cycle.
This naturally connects to the widely known but very controversial Fed model, which states
that the valuation ratios of stocks and bonds, i.e., the stock earnings yield and long-term
bond yield, tend to move in unison in equilibrium. We plan to explore this question in
subsequent research.
24
Reference
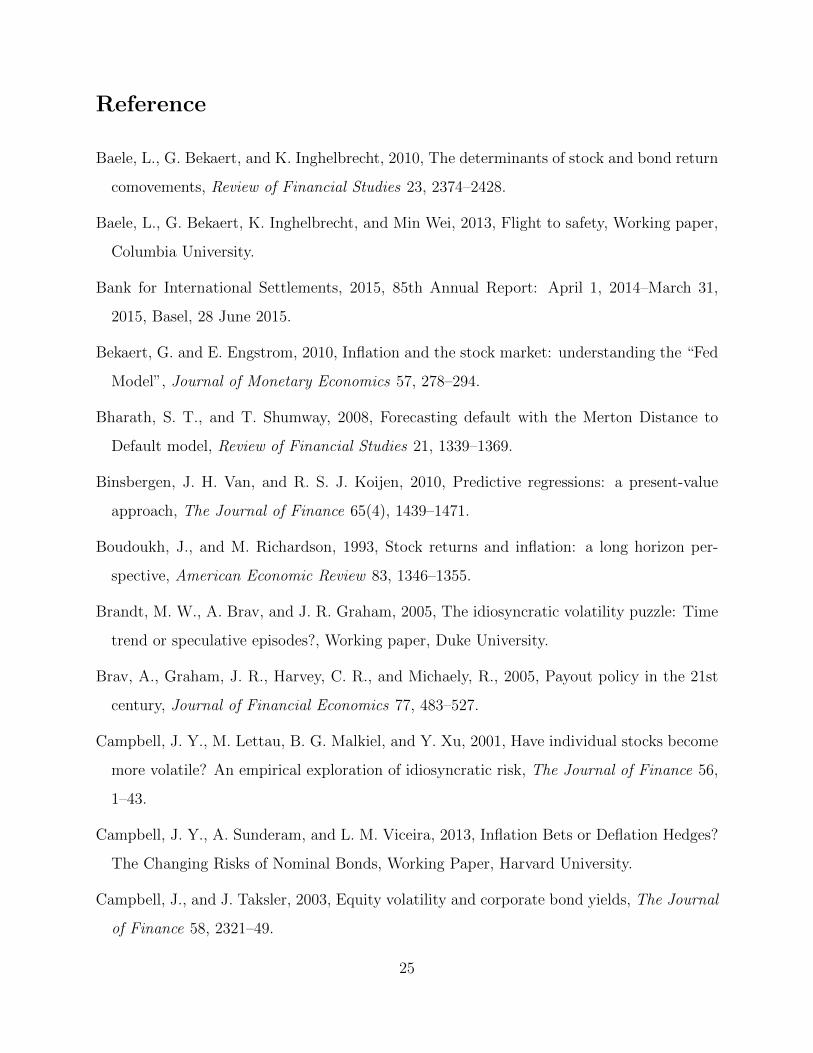
Baele, L., G. Bekaert, and K. Inghelbrecht, 2010, The determinants of stock and bond return
comovements, Review of Financial Studies 23, 2374–2428.
Baele, L., G. Bekaert, K. Inghelbrecht, and Min Wei, 2013, Flight to safety, Working paper,
Columbia University.
Bank for International Settlements, 2015, 85th Annual Report: April 1, 2014–March 31,
2015, Basel, 28 June 2015.
Bekaert, G. and E. Engstrom, 2010, Inflation and the stock market: understanding the “Fed
Model”, Journal of Monetary Economics 57, 278–294.
Bharath, S. T., and T. Shumway, 2008, Forecasting default with the Merton Distance to
Default model, Review of Financial Studies 21, 1339–1369.
Binsbergen, J. H. Van, and R. S. J. Koijen, 2010, Predictive regressions: a present-value
approach, The Journal of Finance 65(4), 1439–1471.
Boudoukh, J., and M. Richardson, 1993, Stock returns and inflation: a long horizon per-
spective, American Economic Review 83, 1346–1355.
Brandt, M. W., A. Brav, and J. R. Graham, 2005, The idiosyncratic volatility puzzle: Time
trend or speculative episodes?, Working paper, Duke University.
Brav, A., Graham, J. R., Harvey, C. R., and Michaely, R., 2005, Payout policy in the 21st
century, Journal of Financial Economics 77, 483–527.
Campbell, J. Y., M. Lettau, B. G. Malkiel, and Y. Xu, 2001, Have individual stocks become
more volatile? An empirical exploration of idiosyncratic risk, The Journal of Finance 56,
1–43.
Campbell, J. Y., A. Sunderam, and L. M. Viceira, 2013, Inflation Bets or Deflation Hedges?
The Changing Risks of Nominal Bonds, Working Paper, Harvard University.
Campbell, J., and J. Taksler, 2003, Equity volatility and corporate bond yields, The Journal
of Finance 58, 2321–49.
25
Cornell, B., 1999, Risk, duration, and capital budgeting: New evidence on some old ques-
tions, The Journal of Business 72, 183–200.
Dechow, P. M., R. G. Sloan, M. T. Soliman, 2004, Implied equity duration: a new measure
of equity risk, Review of Accounting Studies 9 (2-3), 197-228.
Eades, K. M., P. J. Hess, and E. H. Kim, 1984, On interpreting security returns during the
ex-dividend period, Journal of Financial Economics 13, 3–34.
Elton, E. J., and M. J. Gruber, 1970, Marginal stockholder tax rates and the clientele effect,
Review of Economics and Statistics 52 (1), 68–74.
Fama, E. F., and K. R. French, 1993, Common risk factors in the returns on stocks and
bonds, Journal of Financial Economics 33, 3–56.
Fama, E. F., and G. W. Schwert, 1977, Asset returns and inflation, Journal of Financial
Economics 5, 115–46.
Graham, J. R., and A. Kumar, 2006. Do dividend clienteles exist? Evidence on dividend
preferences of retail investors. The Journal of Finance 61(3), 1305–36.
Graham, J. R., R. Michaely, and M. R. Roberts, 2003, Do price discreteness and transactions
costs affect stock returns? Comparing ex-dividend pricing before and after decimalization,
The Journal of Finance 58 (6), 2611–2636.
Green, R. C., and K. Rydqvist, 1999, Ex-day behavior with dividend preference and limi-
tations to short-term arbitrage: The case of Swedish lottery bonds, Journal of Financial
Economics 53 (2), 145–187.
Haugen, R. A., and Wichern, D. W.,1974, The elasticity of financial assets, The Journal of
Finance, September: 1229–1240.
He, Z., and A. Krishnamurthy, 2013, Intermediary asset pricing, American Economic Review
103, 1–43.
Hoberg, G., and N. R. Prabhala, 2009, Disapering dividends, catering, and risk. Review of
Financial Studies 22, 79–116.
26
Jegadeesh, N., and S. Titman, 1993, Returns to buying winners and selling losers: Implica-
tions for stock market efficiency, The Journal of Finance 48 (1), 65-91.
Lanstein, R., and W. F. Sharpe, 1978, Duration and security risk, The Journal of Financial
and Quantitative Analysis 13(4), 653–668.
Lintner, J., 1956, Distribution of incomes of corporations among dividends, retained earnings,
and taxes, American Economic Review 46, 97–113.
Macaulay, F., 1938, The movements of interest rates, bond yields and stock prices in the
United States since 1856, New York: National Bureau of Economic Research.
Merton, R., 1974, On the pricing of corporate debt: the risk structure of interest rates, The
Journal of Finance 29(2), 449–470.
Modigliani, F., and R. Cohn, 1979, Inflation, rational valuation, and the market, Financial
Analysts Journal, 37, 24–44.
Miller, M. H., and F. Modigliani, 1961, Dividend policy, growth, and the valuation of shares,
The Journal of Business 34(4), 411–433.
Pastor, L., and P. Veronesi, 2003, Stock valuation and learning about profitability, The
Journal of Finance 58, 1749–1789.
Thaler, R. H., and H. M. Shefrin, 1981, An economic theory of self-control, Journal of
Political Economy 89 (2), 392–406.
Vayanos, D., and P. Woolley, 2013, An institutional theory of momentum and reversal,
Review of Financial Studies 26, 1087–1145.
27
Panel A Dividend Yield Sorted Portfolios
Panel B Dividend Payout D/BE Sorted Portfolios
Figure 1: Market Adjusted Returns to High Dividend Stocks during Taper TantrumThis figure shows the market adjusted returns for high and low dividend stock portfolios during the episode
of taper tantrum, when the Federal Reserve Chairman Ben Bernanke expressed optimism about economic
conditions and suggested a reduction in asset purchases by the Fed later in 2013: [T]he Committee currently
anticipates that it would be appropriate to moderate the monthly pace of purchases later this year. The yields
on 10-year Treasury notes jumped from 2.00% to 2.33% from 18 June to 19 June 2013. To form dividend
yield portfolios, we rank stocks into quintiles based on their dividend to price ratios (Panel A) or dividend
to book equity ratios (Panel B) at the end of June of 2012 and hold the portfolio until the end of June
of 2013. The graph shows the daily value-weighted portfolio returns in excess of the CRSP value-weighted
stock market return on 19 June 2013.
28
Panel A Dividend Yield Sorted Portfolios
Panel B Dividend Payout D/BE Sorted Portfolios
Figure 2: Time-Varying Duration Estimates for High and Low Dividend StocksThis figure shows the estimates of duration for high and low dividend stocks over the period July 1963 to
December 2014. Duration is estimated as the negative of the slope coefficients for changes in yields on 10-year
Treasury notes from regressions of excess stock returns on changes in yields and stock market returns over a
10-year rolling window. In Panel A (B), high and low dividend stocks refer to stocks in the top and bottom
20% of stocks ranked on the dividend to price (dividend to book equity) ratios. We compute value-weighted
return on portfolios formed at the end of each June from 1963 and rebalanced at the end of next June.
29
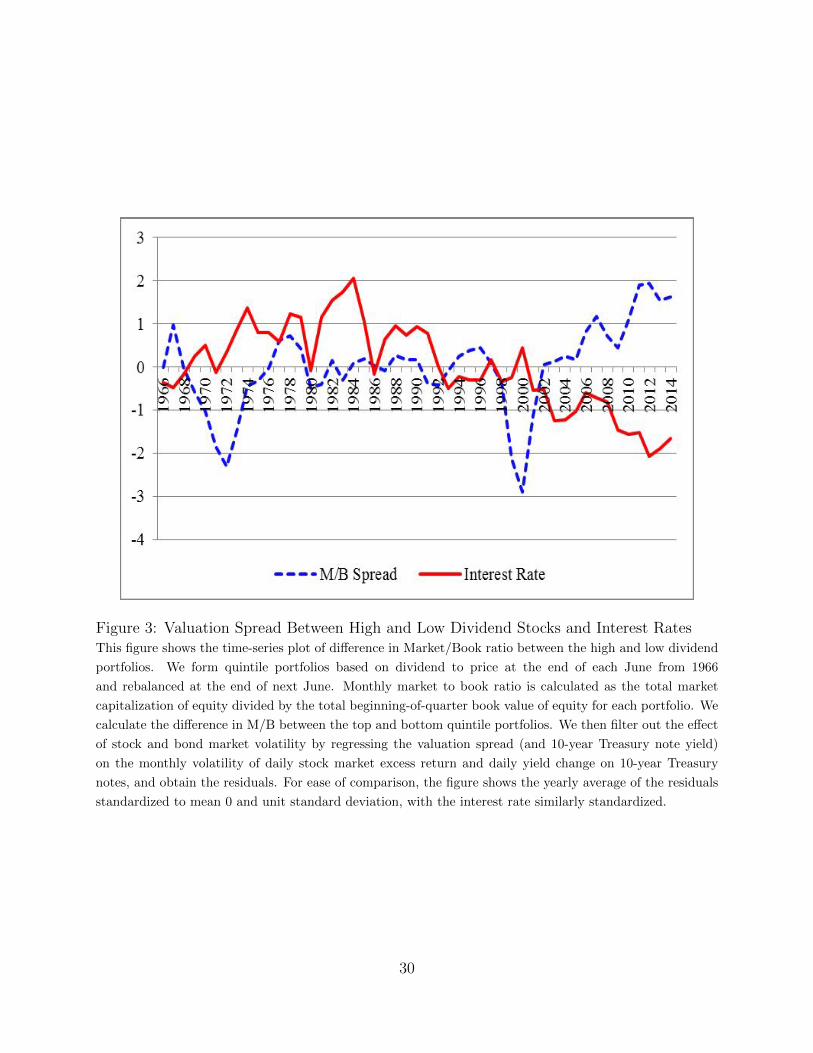
Figure 3: Valuation Spread Between High and Low Dividend Stocks and Interest RatesThis figure shows the time-series plot of difference in Market/Book ratio between the high and low dividend
portfolios. We form quintile portfolios based on dividend to price at the end of each June from 1966
and rebalanced at the end of next June. Monthly market to book ratio is calculated as the total market
capitalization of equity divided by the total beginning-of-quarter book value of equity for each portfolio. We
calculate the difference in M/B between the top and bottom quintile portfolios. We then filter out the effect
of stock and bond market volatility by regressing the valuation spread (and 10-year Treasury note yield)
on the monthly volatility of daily stock market excess return and daily yield change on 10-year Treasury
notes, and obtain the residuals. For ease of comparison, the figure shows the yearly average of the residuals
standardized to mean 0 and unit standard deviation, with the interest rate similarly standardized.
30
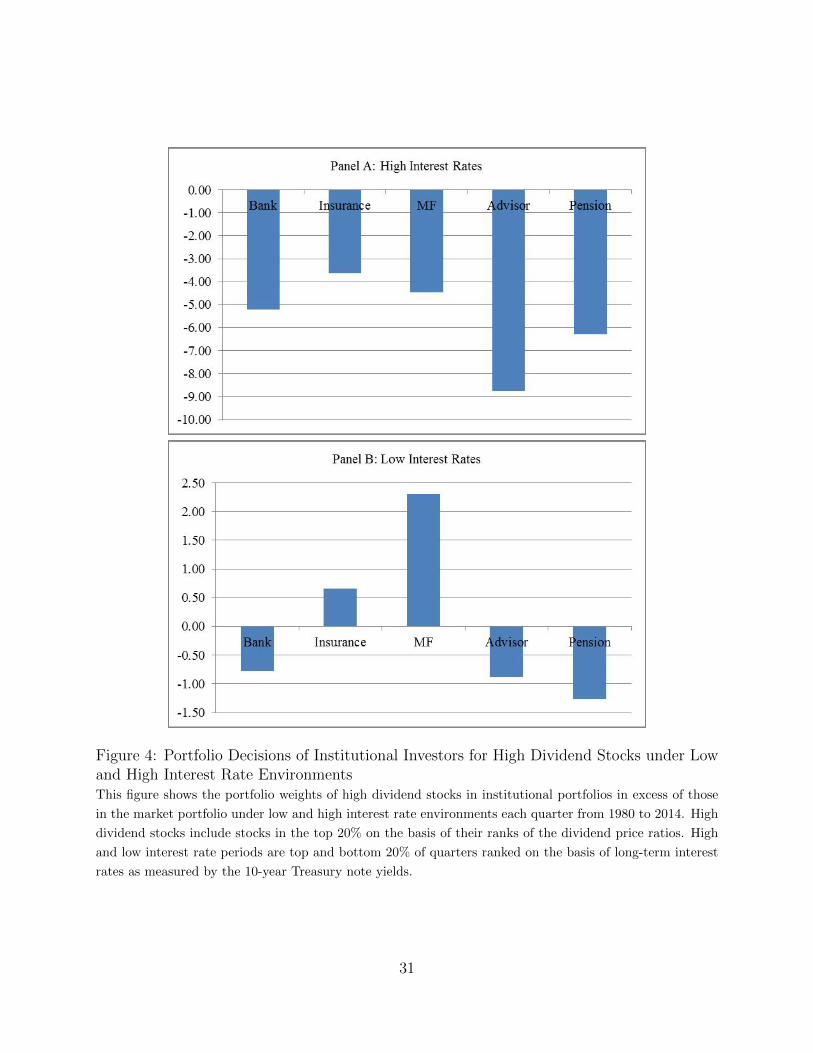
Figure 4: Portfolio Decisions of Institutional Investors for High Dividend Stocks under Lowand High Interest Rate EnvironmentsThis figure shows the portfolio weights of high dividend stocks in institutional portfolios in excess of those
in the market portfolio under low and high interest rate environments each quarter from 1980 to 2014. High
dividend stocks include stocks in the top 20% on the basis of their ranks of the dividend price ratios. High
and low interest rate periods are top and bottom 20% of quarters ranked on the basis of long-term interest
rates as measured by the 10-year Treasury note yields.
31
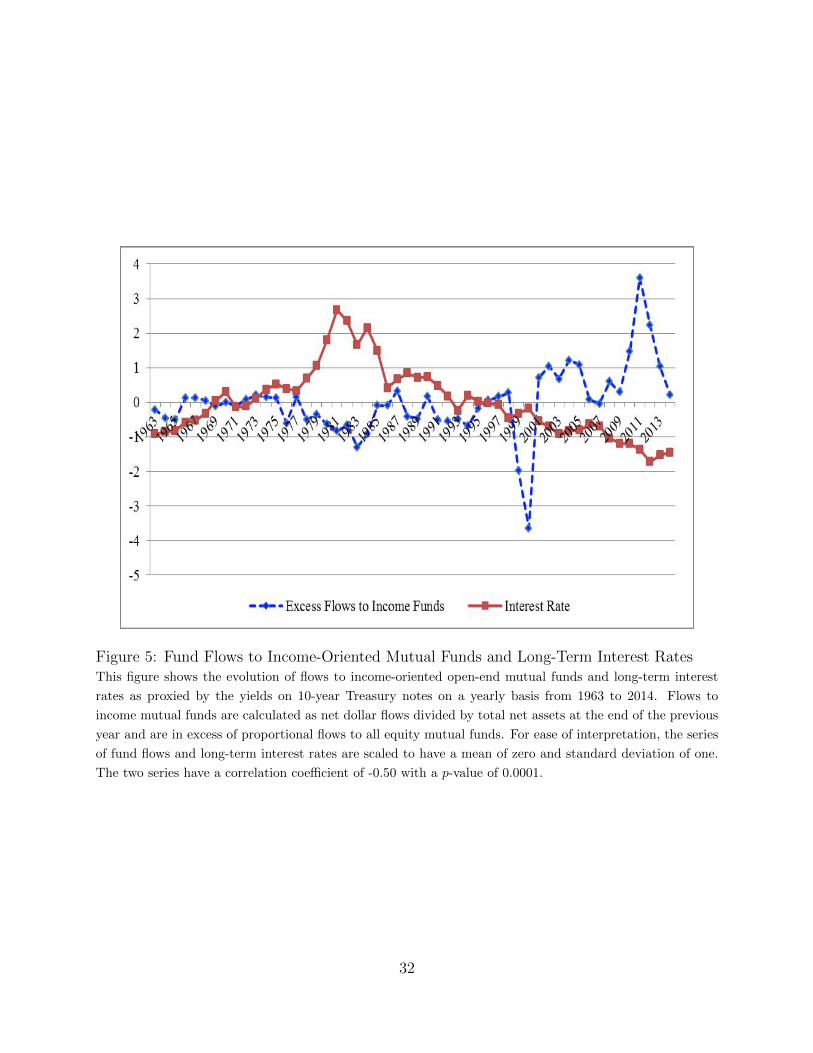
Figure 5: Fund Flows to Income-Oriented Mutual Funds and Long-Term Interest RatesThis figure shows the evolution of flows to income-oriented open-end mutual funds and long-term interest
rates as proxied by the yields on 10-year Treasury notes on a yearly basis from 1963 to 2014. Flows to
income mutual funds are calculated as net dollar flows divided by total net assets at the end of the previous
year and are in excess of proportional flows to all equity mutual funds. For ease of interpretation, the series
of fund flows and long-term interest rates are scaled to have a mean of zero and standard deviation of one.
The two series have a correlation coefficient of -0.50 with a p-value of 0.0001.
32
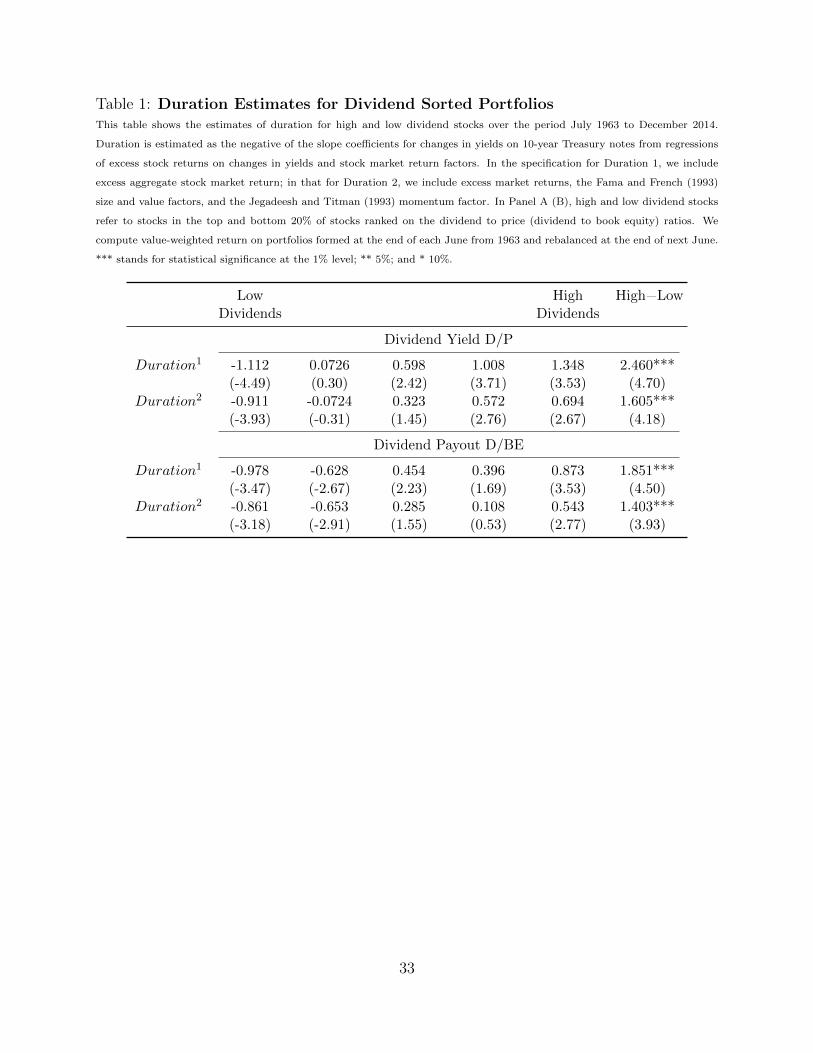
Table 1: Duration Estimates for Dividend Sorted PortfoliosThis table shows the estimates of duration for high and low dividend stocks over the period July 1963 to December 2014.
Duration is estimated as the negative of the slope coefficients for changes in yields on 10-year Treasury notes from regressions
of excess stock returns on changes in yields and stock market return factors. In the specification for Duration 1, we include
excess aggregate stock market return; in that for Duration 2, we include excess market returns, the Fama and French (1993)
size and value factors, and the Jegadeesh and Titman (1993) momentum factor. In Panel A (B), high and low dividend stocks
refer to stocks in the top and bottom 20% of stocks ranked on the dividend to price (dividend to book equity) ratios. We
compute value-weighted return on portfolios formed at the end of each June from 1963 and rebalanced at the end of next June.
*** stands for statistical significance at the 1% level; ** 5%; and * 10%.
LowDividends
HighDividends
High−Low
Dividend Yield D/P
Duration1 -1.112 0.0726 0.598 1.008 1.348 2.460***(-4.49) (0.30) (2.42) (3.71) (3.53) (4.70)
Duration2 -0.911 -0.0724 0.323 0.572 0.694 1.605***(-3.93) (-0.31) (1.45) (2.76) (2.67) (4.18)
Dividend Payout D/BE
Duration1 -0.978 -0.628 0.454 0.396 0.873 1.851***(-3.47) (-2.67) (2.23) (1.69) (3.53) (4.50)
Duration2 -0.861 -0.653 0.285 0.108 0.543 1.403***(-3.18) (-2.91) (1.55) (0.53) (2.77) (3.93)
33
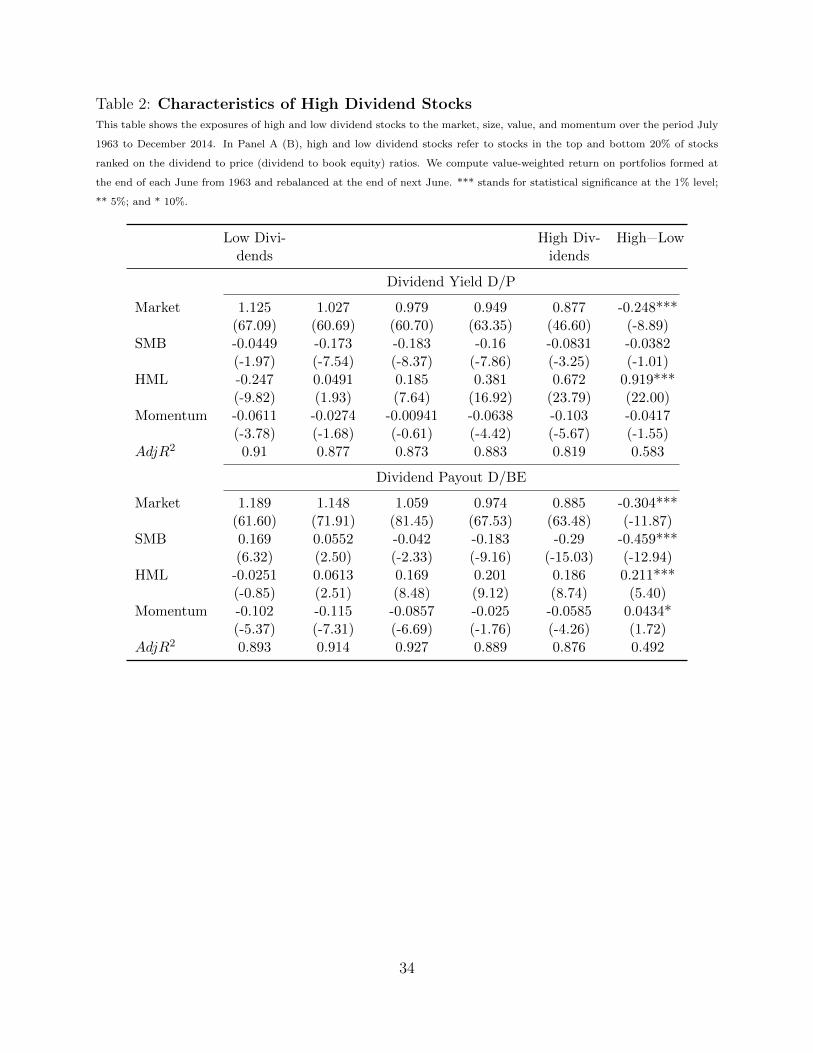
Table 2: Characteristics of High Dividend StocksThis table shows the exposures of high and low dividend stocks to the market, size, value, and momentum over the period July
1963 to December 2014. In Panel A (B), high and low dividend stocks refer to stocks in the top and bottom 20% of stocks
ranked on the dividend to price (dividend to book equity) ratios. We compute value-weighted return on portfolios formed at
the end of each June from 1963 and rebalanced at the end of next June. *** stands for statistical significance at the 1% level;
** 5%; and * 10%.
Low Divi-dends
High Div-idends
High−Low
Dividend Yield D/P
Market 1.125 1.027 0.979 0.949 0.877 -0.248***(67.09) (60.69) (60.70) (63.35) (46.60) (-8.89)
SMB -0.0449 -0.173 -0.183 -0.16 -0.0831 -0.0382(-1.97) (-7.54) (-8.37) (-7.86) (-3.25) (-1.01)
HML -0.247 0.0491 0.185 0.381 0.672 0.919***(-9.82) (1.93) (7.64) (16.92) (23.79) (22.00)
Momentum -0.0611 -0.0274 -0.00941 -0.0638 -0.103 -0.0417(-3.78) (-1.68) (-0.61) (-4.42) (-5.67) (-1.55)
AdjR2 0.91 0.877 0.873 0.883 0.819 0.583
Dividend Payout D/BE
Market 1.189 1.148 1.059 0.974 0.885 -0.304***(61.60) (71.91) (81.45) (67.53) (63.48) (-11.87)
SMB 0.169 0.0552 -0.042 -0.183 -0.29 -0.459***(6.32) (2.50) (-2.33) (-9.16) (-15.03) (-12.94)
HML -0.0251 0.0613 0.169 0.201 0.186 0.211***(-0.85) (2.51) (8.48) (9.12) (8.74) (5.40)
Momentum -0.102 -0.115 -0.0857 -0.025 -0.0585 0.0434*(-5.37) (-7.31) (-6.69) (-1.76) (-4.26) (1.72)
AdjR2 0.893 0.914 0.927 0.889 0.876 0.492
34
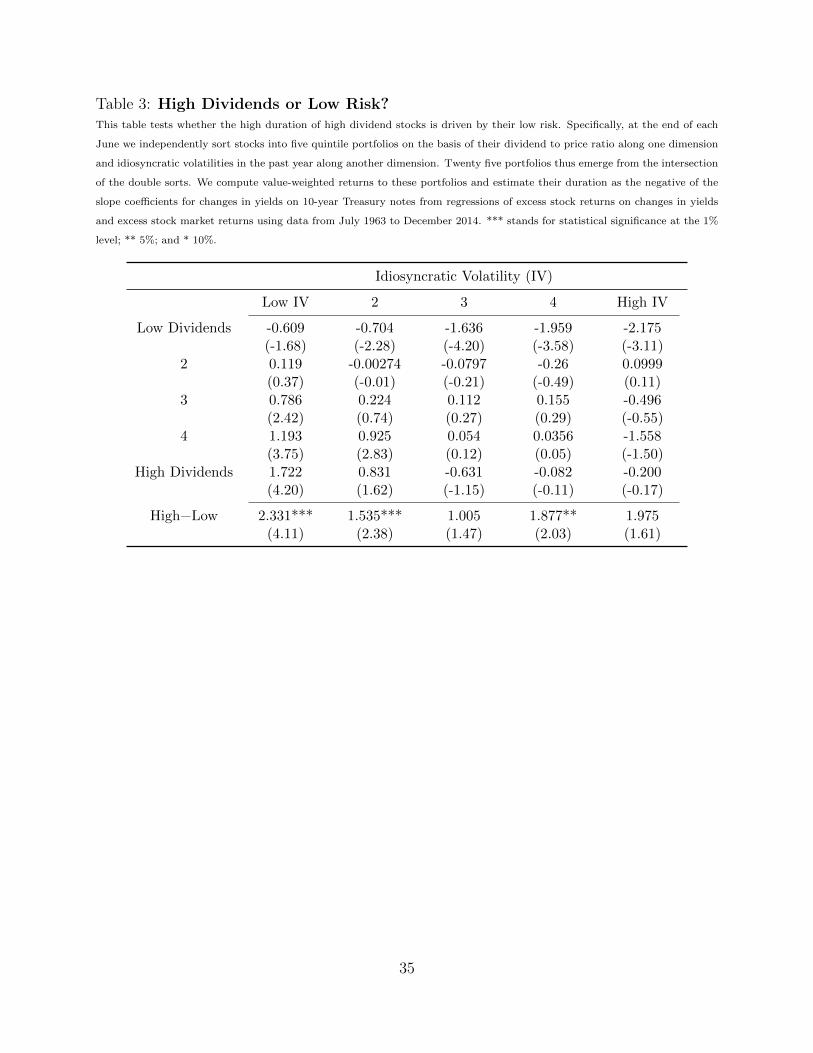
Table 3: High Dividends or Low Risk?This table tests whether the high duration of high dividend stocks is driven by their low risk. Specifically, at the end of each
June we independently sort stocks into five quintile portfolios on the basis of their dividend to price ratio along one dimension
and idiosyncratic volatilities in the past year along another dimension. Twenty five portfolios thus emerge from the intersection
of the double sorts. We compute value-weighted returns to these portfolios and estimate their duration as the negative of the
slope coefficients for changes in yields on 10-year Treasury notes from regressions of excess stock returns on changes in yields
and excess stock market returns using data from July 1963 to December 2014. *** stands for statistical significance at the 1%
level; ** 5%; and * 10%.
Idiosyncratic Volatility (IV)
Low IV 2 3 4 High IV
Low Dividends -0.609 -0.704 -1.636 -1.959 -2.175(-1.68) (-2.28) (-4.20) (-3.58) (-3.11)
2 0.119 -0.00274 -0.0797 -0.26 0.0999(0.37) (-0.01) (-0.21) (-0.49) (0.11)
3 0.786 0.224 0.112 0.155 -0.496(2.42) (0.74) (0.27) (0.29) (-0.55)
4 1.193 0.925 0.054 0.0356 -1.558(3.75) (2.83) (0.12) (0.05) (-1.50)
High Dividends 1.722 0.831 -0.631 -0.082 -0.200(4.20) (1.62) (-1.15) (-0.11) (-0.17)
High−Low 2.331*** 1.535*** 1.005 1.877** 1.975(4.11) (2.38) (1.47) (2.03) (1.61)
35
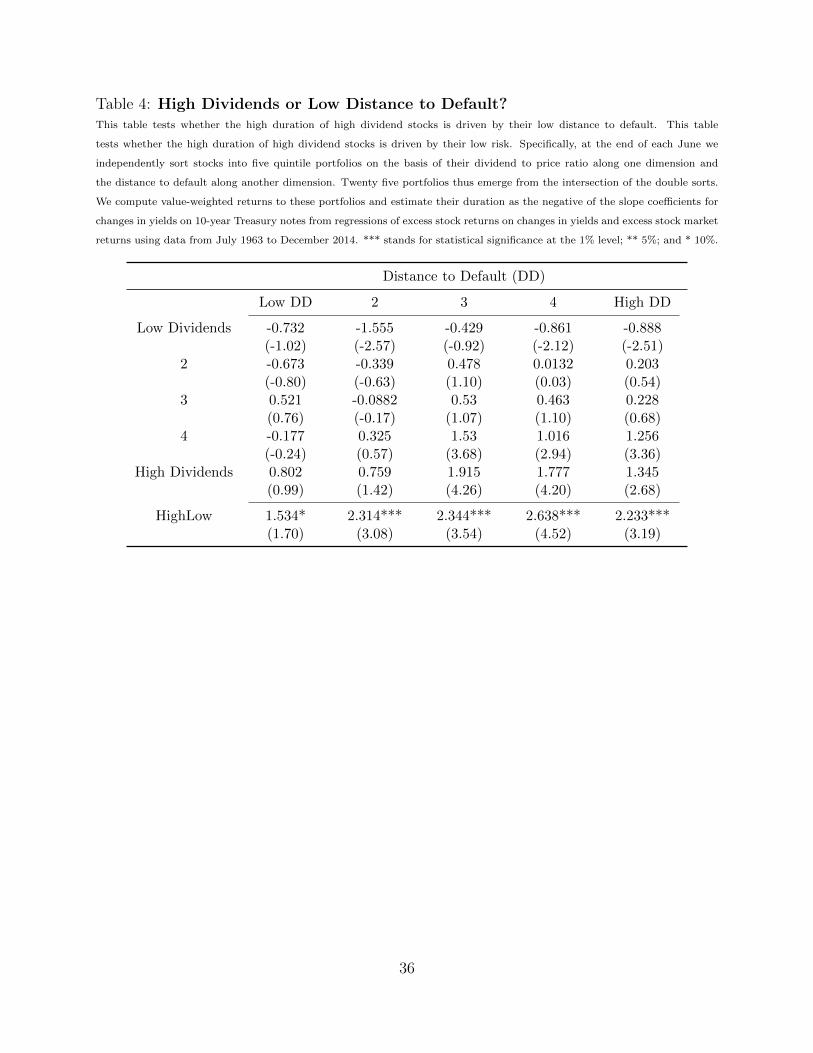
Table 4: High Dividends or Low Distance to Default?This table tests whether the high duration of high dividend stocks is driven by their low distance to default. This table
tests whether the high duration of high dividend stocks is driven by their low risk. Specifically, at the end of each June we
independently sort stocks into five quintile portfolios on the basis of their dividend to price ratio along one dimension and
the distance to default along another dimension. Twenty five portfolios thus emerge from the intersection of the double sorts.
We compute value-weighted returns to these portfolios and estimate their duration as the negative of the slope coefficients for
changes in yields on 10-year Treasury notes from regressions of excess stock returns on changes in yields and excess stock market
returns using data from July 1963 to December 2014. *** stands for statistical significance at the 1% level; ** 5%; and * 10%.
Distance to Default (DD)
Low DD 2 3 4 High DD
Low Dividends -0.732 -1.555 -0.429 -0.861 -0.888(-1.02) (-2.57) (-0.92) (-2.12) (-2.51)
2 -0.673 -0.339 0.478 0.0132 0.203(-0.80) (-0.63) (1.10) (0.03) (0.54)
3 0.521 -0.0882 0.53 0.463 0.228(0.76) (-0.17) (1.07) (1.10) (0.68)
4 -0.177 0.325 1.53 1.016 1.256(-0.24) (0.57) (3.68) (2.94) (3.36)
High Dividends 0.802 0.759 1.915 1.777 1.345(0.99) (1.42) (4.26) (4.20) (2.68)
HighLow 1.534* 2.314*** 2.344*** 2.638*** 2.233***(1.70) (3.08) (3.54) (4.52) (3.19)
36
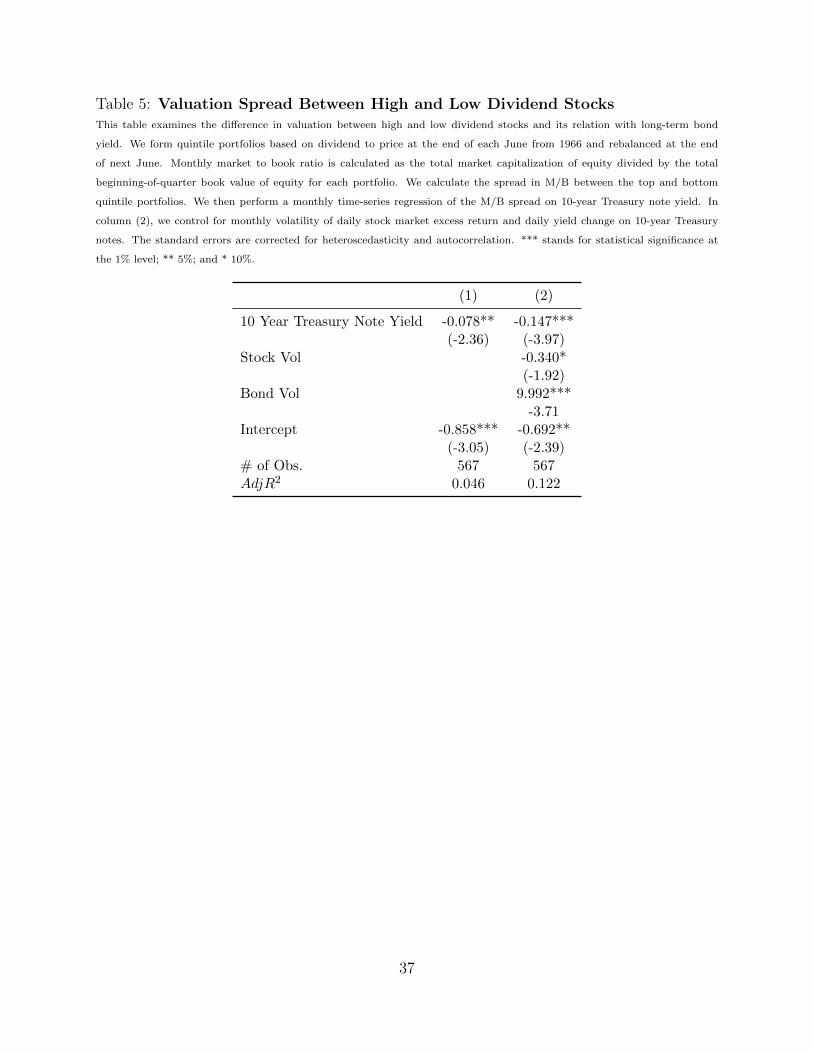
Table 5: Valuation Spread Between High and Low Dividend StocksThis table examines the difference in valuation between high and low dividend stocks and its relation with long-term bond
yield. We form quintile portfolios based on dividend to price at the end of each June from 1966 and rebalanced at the end
of next June. Monthly market to book ratio is calculated as the total market capitalization of equity divided by the total
beginning-of-quarter book value of equity for each portfolio. We calculate the spread in M/B between the top and bottom
quintile portfolios. We then perform a monthly time-series regression of the M/B spread on 10-year Treasury note yield. In
column (2), we control for monthly volatility of daily stock market excess return and daily yield change on 10-year Treasury
notes. The standard errors are corrected for heteroscedasticity and autocorrelation. *** stands for statistical significance at
the 1% level; ** 5%; and * 10%.
(1) (2)
10 Year Treasury Note Yield -0.078** -0.147***(-2.36) (-3.97)
Stock Vol -0.340*(-1.92)
Bond Vol 9.992***-3.71
Intercept -0.858*** -0.692**(-3.05) (-2.39)
# of Obs. 567 567AdjR2 0.046 0.122
37
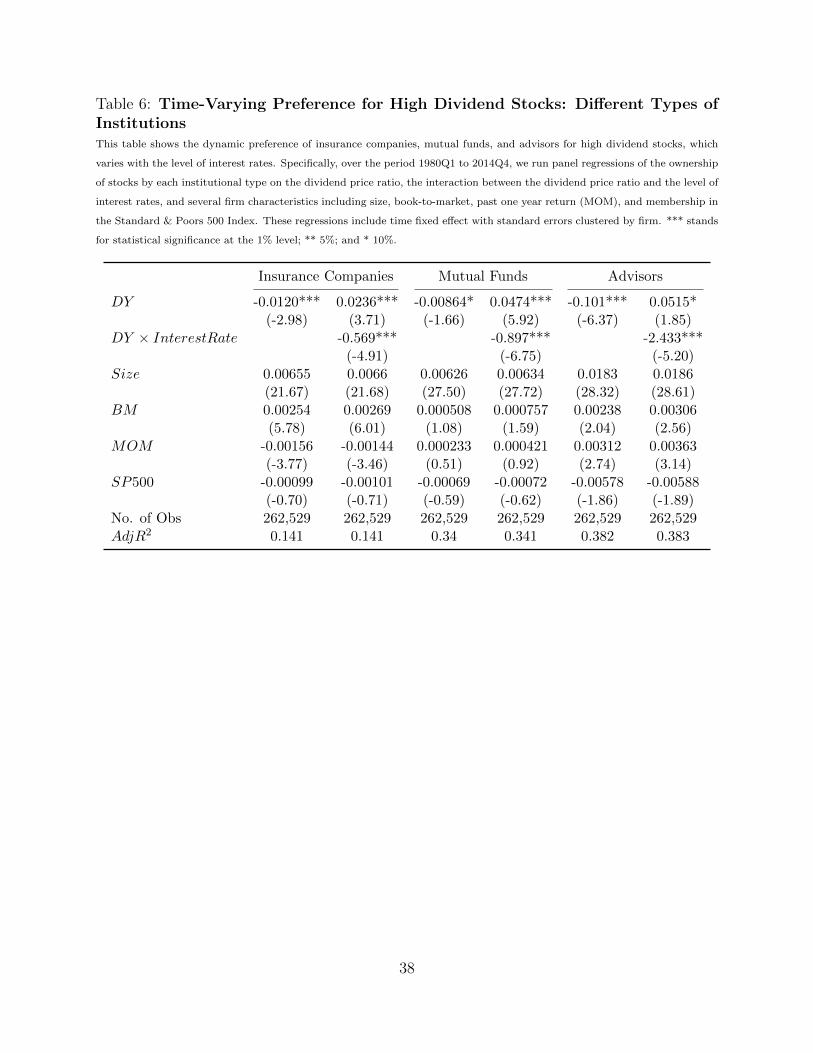
Table 6: Time-Varying Preference for High Dividend Stocks: Different Types ofInstitutionsThis table shows the dynamic preference of insurance companies, mutual funds, and advisors for high dividend stocks, which
varies with the level of interest rates. Specifically, over the period 1980Q1 to 2014Q4, we run panel regressions of the ownership
of stocks by each institutional type on the dividend price ratio, the interaction between the dividend price ratio and the level of
interest rates, and several firm characteristics including size, book-to-market, past one year return (MOM), and membership in
the Standard & Poors 500 Index. These regressions include time fixed effect with standard errors clustered by firm. *** stands
for statistical significance at the 1% level; ** 5%; and * 10%.
Insurance Companies Mutual Funds Advisors
DY -0.0120*** 0.0236*** -0.00864* 0.0474*** -0.101*** 0.0515*(-2.98) (3.71) (-1.66) (5.92) (-6.37) (1.85)
DY × InterestRate -0.569*** -0.897*** -2.433***(-4.91) (-6.75) (-5.20)
Size 0.00655 0.0066 0.00626 0.00634 0.0183 0.0186(21.67) (21.68) (27.50) (27.72) (28.32) (28.61)
BM 0.00254 0.00269 0.000508 0.000757 0.00238 0.00306(5.78) (6.01) (1.08) (1.59) (2.04) (2.56)
MOM -0.00156 -0.00144 0.000233 0.000421 0.00312 0.00363(-3.77) (-3.46) (0.51) (0.92) (2.74) (3.14)
SP500 -0.00099 -0.00101 -0.00069 -0.00072 -0.00578 -0.00588(-0.70) (-0.71) (-0.59) (-0.62) (-1.86) (-1.89)
No. of Obs 262,529 262,529 262,529 262,529 262,529 262,529AdjR2 0.141 0.141 0.34 0.341 0.382 0.383
38
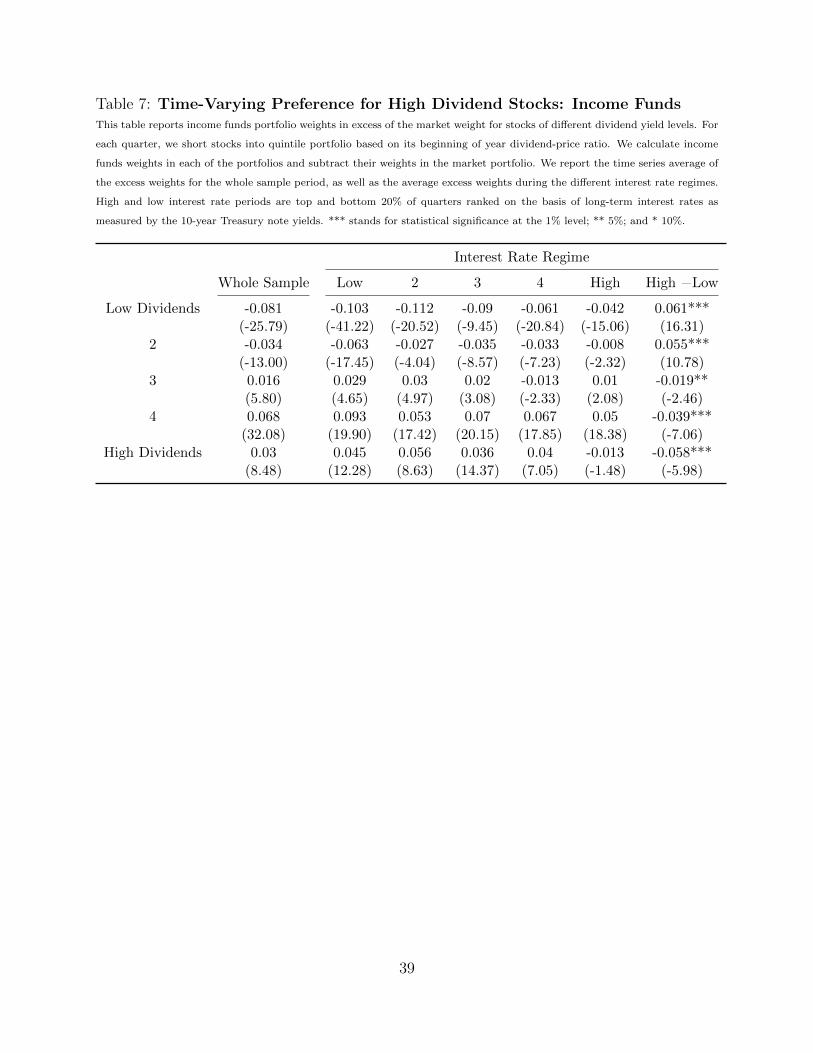
Table 7: Time-Varying Preference for High Dividend Stocks: Income FundsThis table reports income funds portfolio weights in excess of the market weight for stocks of different dividend yield levels. For
each quarter, we short stocks into quintile portfolio based on its beginning of year dividend-price ratio. We calculate income
funds weights in each of the portfolios and subtract their weights in the market portfolio. We report the time series average of
the excess weights for the whole sample period, as well as the average excess weights during the different interest rate regimes.
High and low interest rate periods are top and bottom 20% of quarters ranked on the basis of long-term interest rates as
measured by the 10-year Treasury note yields. *** stands for statistical significance at the 1% level; ** 5%; and * 10%.
Interest Rate Regime
Whole Sample Low 2 3 4 High High −Low
Low Dividends -0.081 -0.103 -0.112 -0.09 -0.061 -0.042 0.061***(-25.79) (-41.22) (-20.52) (-9.45) (-20.84) (-15.06) (16.31)
2 -0.034 -0.063 -0.027 -0.035 -0.033 -0.008 0.055***(-13.00) (-17.45) (-4.04) (-8.57) (-7.23) (-2.32) (10.78)
3 0.016 0.029 0.03 0.02 -0.013 0.01 -0.019**(5.80) (4.65) (4.97) (3.08) (-2.33) (2.08) (-2.46)
4 0.068 0.093 0.053 0.07 0.067 0.05 -0.039***(32.08) (19.90) (17.42) (20.15) (17.85) (18.38) (-7.06)
High Dividends 0.03 0.045 0.056 0.036 0.04 -0.013 -0.058***(8.48) (12.28) (8.63) (14.37) (7.05) (-1.48) (-5.98)
39
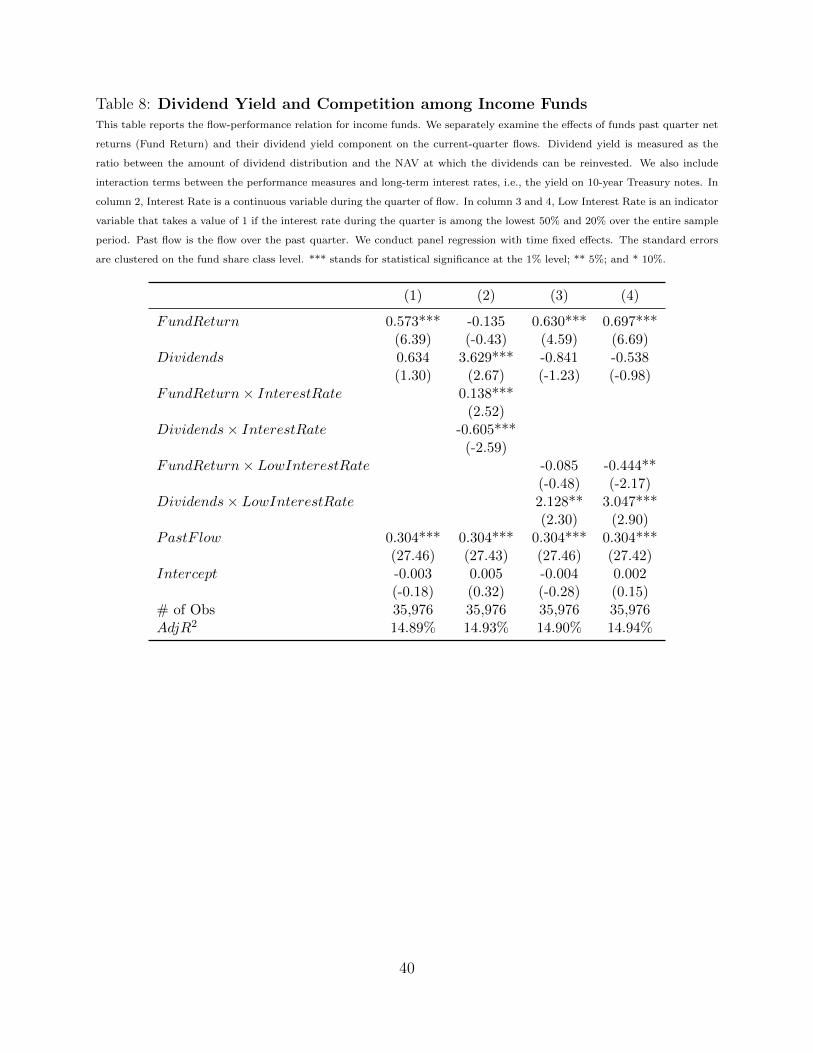
Table 8: Dividend Yield and Competition among Income FundsThis table reports the flow-performance relation for income funds. We separately examine the effects of funds past quarter net
returns (Fund Return) and their dividend yield component on the current-quarter flows. Dividend yield is measured as the
ratio between the amount of dividend distribution and the NAV at which the dividends can be reinvested. We also include
interaction terms between the performance measures and long-term interest rates, i.e., the yield on 10-year Treasury notes. In
column 2, Interest Rate is a continuous variable during the quarter of flow. In column 3 and 4, Low Interest Rate is an indicator
variable that takes a value of 1 if the interest rate during the quarter is among the lowest 50% and 20% over the entire sample
period. Past flow is the flow over the past quarter. We conduct panel regression with time fixed effects. The standard errors
are clustered on the fund share class level. *** stands for statistical significance at the 1% level; ** 5%; and * 10%.
(1) (2) (3) (4)
FundReturn 0.573*** -0.135 0.630*** 0.697***(6.39) (-0.43) (4.59) (6.69)
Dividends 0.634 3.629*** -0.841 -0.538(1.30) (2.67) (-1.23) (-0.98)
FundReturn× InterestRate 0.138***(2.52)
Dividends× InterestRate -0.605***(-2.59)
FundReturn× LowInterestRate -0.085 -0.444**(-0.48) (-2.17)
Dividends× LowInterestRate 2.128** 3.047***(2.30) (2.90)
PastF low 0.304*** 0.304*** 0.304*** 0.304***(27.46) (27.43) (27.46) (27.42)
Intercept -0.003 0.005 -0.004 0.002(-0.18) (0.32) (-0.28) (0.15)
# of Obs 35,976 35,976 35,976 35,976AdjR2 14.89% 14.93% 14.90% 14.94%
40
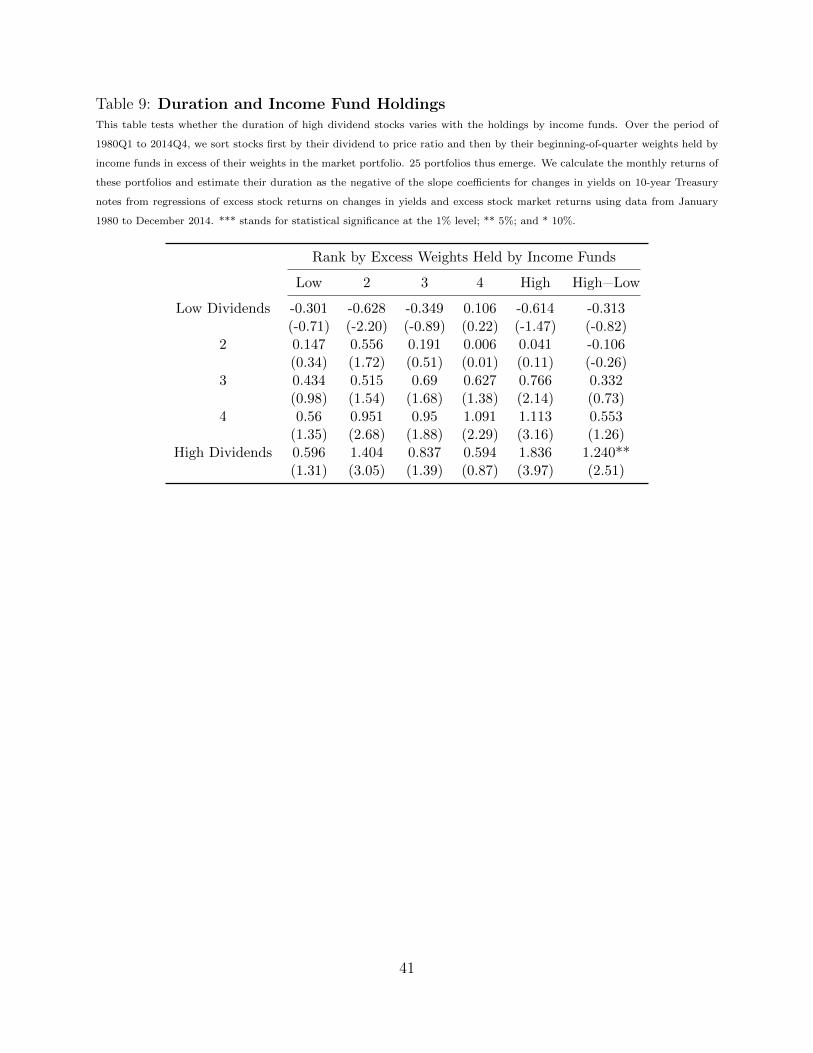
Table 9: Duration and Income Fund HoldingsThis table tests whether the duration of high dividend stocks varies with the holdings by income funds. Over the period of
1980Q1 to 2014Q4, we sort stocks first by their dividend to price ratio and then by their beginning-of-quarter weights held by
income funds in excess of their weights in the market portfolio. 25 portfolios thus emerge. We calculate the monthly returns of
these portfolios and estimate their duration as the negative of the slope coefficients for changes in yields on 10-year Treasury
notes from regressions of excess stock returns on changes in yields and excess stock market returns using data from January
1980 to December 2014. *** stands for statistical significance at the 1% level; ** 5%; and * 10%.
Rank by Excess Weights Held by Income Funds
Low 2 3 4 High High−Low
Low Dividends -0.301 -0.628 -0.349 0.106 -0.614 -0.313(-0.71) (-2.20) (-0.89) (0.22) (-1.47) (-0.82)
2 0.147 0.556 0.191 0.006 0.041 -0.106(0.34) (1.72) (0.51) (0.01) (0.11) (-0.26)
3 0.434 0.515 0.69 0.627 0.766 0.332(0.98) (1.54) (1.68) (1.38) (2.14) (0.73)
4 0.56 0.951 0.95 1.091 1.113 0.553(1.35) (2.68) (1.88) (2.29) (3.16) (1.26)
High Dividends 0.596 1.404 0.837 0.594 1.836 1.240**(1.31) (3.05) (1.39) (0.87) (3.97) (2.51)
41