equity indicators project update - dallascityhall.comdallascityhall.com/government/council meeting...
TRANSCRIPT


Equity Indicators Project Update
Theresa O’DonnellChief Resilience OfficerCity of Dallas
Human and Social Needs CommitteeJune 4, 2018

Overview• Present the final scores for the Equity Indicators
report and discuss next steps.
2
Human and Social Needs

Background• On October 16, 2017, the Human and Social Needs
Committee received an update on the Resilient Dallas Phase II scope of work that included an introduction to the Equity Indicators project.
• On December 4, 2017, the Equity Indicators project team sought direction from the Human and Social Needs Committee on proposed domains and indicators.
• On May 7, 2018, the preliminary findings of the Equity Indicators project were briefed to the Human and Social Needs Committee.
3
Human and Social Needs

Dallas Equity Indicators• Methodology developed by the City University of
New York Institute for State and Local Governance (ISLG)
• Funding has been provided by the Rockefeller Foundation for ISLG to work with five cities
• Dallas, Tulsa, St. Louis, Oakland and Pittsburgh• University of Texas at Dallas Institute for Urban
Policy Research (IUPR) has been our data partner on this project
4
Human and Social Needs

Dallas Equity Indicators• Goal: To design a framework of indicators to measure
progress toward achieving greater equity in Dallas over time
• Policy tool that can be used by communities, government agencies, researchers, and policy groups
• Use same methodology as NYC, but working to create a tailored tool for Dallas
• Focus:• People who experience inequities• The areas in which they experience inequity• The current state of equity in these areas• How the state of equity changes over time
5
Human and Social Needs

Equity Themes and Topics
6
Human and Social Needs

Equity Themes and Topics
7
Human and Social Needs

8
Human and Social Needs

Most Equitable Indicators• Trust in Government 93
• Resident responses on the City’s Community Survey show only minor deviation between race, ethnicity or gender
• Graduation Rates 90• The four-year completion rates provided by TEA indicate
students of all racial and ethnic groups have graduation rates within 5 points of each other
• Service Satisfaction 89• Average composite satisfaction score on Community
Survey shows little variation among respondents according to race, ethnicity or gender
• Hospital Quality 85• Average quality score for hospitals within close proximity to
neighborhoods
9
Human and Social Needs

Least Equitable Indicators• Job Opportunities 1
• Residents in racially diverse neighborhoods have access to 17 times the number of jobs as residents in African American neighborhoods
• Low Educational Attainment 1• 44% of Hispanic adults lack a high school diploma
compared to only 4% of White adults• Overcrowding 1
• More than 15% of Hispanic households have more than two individuals per room
• Child Asthma 10• African American children suffer from asthma almost 8
times more than Asian children
10
Human and Social Needs

Score
Business Development 29
Employment 29
Income 37
Poverty 19
Economic OpportunityTheme Score: 28/100• The sample indicator Job
Opportunities is one of the least equitable indicators with a score of 1
• Racially diverse neighborhoods have access to 17 times the number of jobs (40,000+) within a 30-minute public transit commute as majority-Black neighborhoods (~2,500)
11
Human and Social Needs

Score
Early Education 64
Elementary and Middle School 57
High School 52
Education of the General Population
10
EducationTheme Score: 46/100• 45% of Hispanic adults do
not have a high school education, compared to only 4% of White adults (Low Educational Attainment)
• White students are nearly three times as likely to be college ready as African American students and two times as prepared as Hispanic students (College Readiness)
12
Human and Social Needs

Score
Affordability of Housing 49
Community Resources 63
Quality of Housing 25
Services 61
Housing and Neighborhood QualityTheme Score: 49/100• The sample indicator
Internet Coverage earned a score of 16
• Fewer than 10% of White households lack internet access, compared to more than 30% of African American households
13
Human and Social Needs
Score
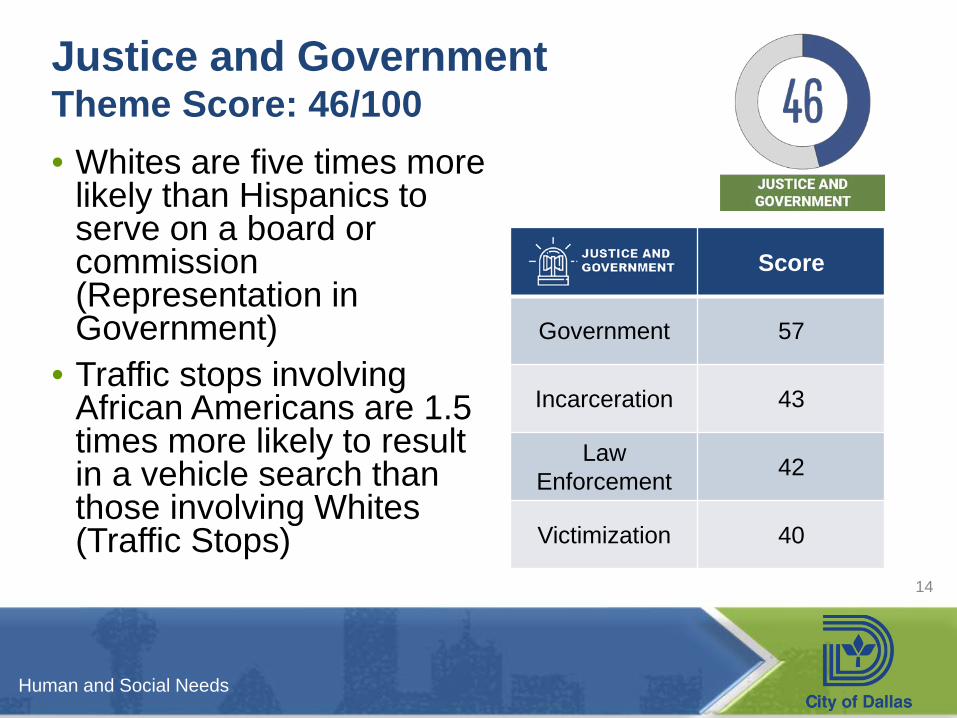
Government 57
Incarceration 43
Law Enforcement 42
Victimization 40
Justice and GovernmentTheme Score: 46/100• Whites are five times more
likely than Hispanics to serve on a board or commission (Representation in Government)
• Traffic stops involving African Americans are 1.5 times more likely to result in a vehicle search than those involving Whites (Traffic Stops)
14
Human and Social Needs

Score
Behavioral Risk Factors 36
Health Care 50
Population Health 35
Maternal and Child Health 32
Public HealthTheme Score: 38/100• The rate of asthma for
Black children is almost eight times the rate for Asians and just more than four times the rate for Whites and Hispanics (Child Asthma)
• The pregnancy rate for Hispanic mothers under the age of 16 is nearly five times higher than the rate for White mothers (Teen Pregnancy)
15
Human and Social Needs

Score
Access to Services and Opportunities 51
Access to Transportation 65
Quality of Transportation 73
Built and Natural Environment 45
Transportation and InfrastructureTheme Score: 59• Majority-African American
neighborhoods have three times the number of vacant residential structures as White neighborhoods
• Neighborhoods of concentrated poverty have four times the number of vacant structures as neighborhoods whose residents earn 185% of the poverty rate (Residential Vacancies)
16
Human and Social Needs

Indicator Scores
17
Human and Social Needs
Score2018 Topic
Score2018 Theme
Score
Business Establishments 27Business Ownership 36Business Revenue 23Job Opportunities 1Jobless Rate 58Adults with High-Growth, High-Paying Jobs 29Average Full-Time Income 35Average Hourly Wage 37Household Income 38Child Poverty 31Concentrated Poverty 11Full-Time Employees Living in Poverty 14Early Education Enrollment 44Early Education Enrollment 75Kindergarten Readiness 73Elementary and Middle School Academic Performance 60Elementary and Middle School Quality 36Elementary and Middle School Teacher Tenure 76College Readiness 36Graduation Rates 90Suspensions 29Low Educational Attainment 1Impact of Education 14College-Educated Population 16
High School
Education of General Population
Elementary and Middle School
Education
Early Education
Economic Opportunity
Theme
Income
Employment
Topic Indicator Name
2018
Business Development
Poverty
Theme Scores
28.33
Topic Scores
36.67
18.67
29.33
28.67
57.33
64.00
51.67
10.33
45.83

Indicator Scores (cont.)
18
Human and Social Needs
Score2018 Topic
Score2018 Theme
Score
Home Loan Denial Rates 43Housing Burden 64Home Ownership 40Libraries 75Parks 75Cultural and Recreational Amenities 38Overcrowding 1Building Quality 35Util ity Expenses 38Internet Coverage 16Service Satisfaction 89Street Quality 79Voter Turnout 59Representation in Government 20Trust in Government 93Fines and Fees 73Jail Admission Rates 31Juvenile Detention Rates 24Arrest Rates 37Police Force Diversity 31Traffic Stops 58Property Crime Victimization Rates 61ER Util ization Rates for Injuries 30Violent Crime Victimization Rates 29
Law Enforcement
Incarceration
Victimization
Justice and Government
Government
Community Resources
Housing Affordability
Housing and Neighborhood
Quality of Housing
Services
Theme Topic Indicator Name
2018 Theme ScoresTopic Scores
42.67
40.00
42.00
62.67
49.00
61.33
24.67
57.33
49.42
45.50

Indicator Scores (cont.)
19
Human and Social Needs
Score2018 Topic
Score2018 Theme
Score
Consumption of Unhealthy Foods 38Physical Activity 58Smoking Rates 11Delivery of Preventative Care 39Health Insurance 27Hospital Quality 85Chronic Diseases 36Mortality 37Mental Health 32Prenatal Care 63Teen Pregnancy 22Child Asthma 10Access to Goods and Services 21Commuting Time 78Transit Connectivity 54Cost Burden 82Transit Coverage 79Transit Availabil ity 33Capacity 73Consistency of Service 72Private Vehicle Availabil ity 75Residential Vacancies 27Structures in Floodplain 40Home Energy Deficiency Score 69
Access to Services and Opportunities
Access to Transportation
Quality of Transportation
Transportation and
Infrastructure
Built and Natural Environment
50.33
35.00
31.67
45.33
73.33
64.67
51.00
35.67
Maternal and Child Health
Population Health
Public Health
Behavioral Risk Factors
Health Care
Theme Topic Indicator Name
2018 Theme ScoresTopic Scores
58.58
38.17

Next Steps• Finalize and release first report• Collaborate with Truth, Racial Healing &
Transformation and Dallas ISD on community engagement opportunities
• Re-evaluate indicators after receiving feedback and input from the community
• Second round of data collection will begin Summer/Fall of 2018
• Second report with an analysis of change (or no change) by the first quarter of 2019
20
Human and Social Needs

Equity Indicators Project Update
Theresa O’DonnellChief Resilience OfficerCity of Dallas
Human and Social Needs CommitteeJune 4, 2018