equity lending, investment restrictions, and fund … · equity lending, investment restrictions,...
TRANSCRIPT

Equity Lending, Investment Restrictions, and Fund Performance*
Richard Evans
Darden School of Business - University of Virginia [email protected]
Miguel A. Ferreira
Nova School of Business and Economics [email protected]
Melissa Porras Prado
Nova School of Business and Economics [email protected]
This Version: September 2014
Abstract
The dramatic increase in the percentage of mutual funds lending equities suggests that lending fees are an increasingly important source of income for investment advisors. We find that funds that lend equities underperform otherwise similar funds in spite of lending income. The effect of lending is concentrated in funds that cannot act on the short-selling signal due investment restrictions set by the fund family to diversify their fund offerings across styles. Additionally, we find evidence consistent with family cross-subsidization through the sharing of the short selling demand information generated by equity lending. Our findings suggest that the family organization explains why fund managers lend, rather than sell, stocks with short selling demand. Keywords: Mutual funds, Index funds, Performance, Security lending
JEL: G12, G14, G15, G23
* The authors thank John Adams, Lauren Cohen, Nuno Fernandes, Tariq Haque, Andrew Karolyi, Marc Lipson, Pedro Matos, Adam Reed, Jonathan Reuter, Pedro Santa-Clara, Clemens Sialm, and Duarte Trigueiros; seminar participants at the University of Cambridge, Pompeu Fabra, Ca’Foscari Venezia, University of Geneve, EPFL/University of Lausanne, Georgetown University, Nova School of Business and Economics, Darden School/McIntire School at the University of Virginia; and conference participants at the 2013 Oregon Finance Conference, 2013 SFS Cavalcade, Lubrafin 2013, 1st Luxembourg Asset Management Summit, 2012 Portuguese Finance Network Conference, AEFIN 20th Finance Forum, and 25th Australasian Finance and Banking Conference for helpful comments and suggestions. We thank David Antunes, André Chen, André Fernando, Carlos Mirpuri, Naim Patel, Fábio Santos, Filipe Sodagar, and Francisco Vital for outstanding research assistance.

1
1. Introduction
A securities lending program offers a unique opportunity for mutual funds to generate additional
income. By lending the securities in their portfolio, funds earn both interest and appreciation on the
collateral of loaned securities. However, borrowing demand from short sellers for a stock is a strong
signal of future underperformance. While many investors cannot profit from this short-selling demand
signal due to arbitrage limits, in particular the difficulty in borrowing the stock, fund managers who are
long the stock of interest can sell it in order to benefit. Thus, it is an empirical question whether the
income generated from security lending outweighs the potential improvement in a fund’s performance if
the manager sells the stock in response to a short-selling demand signal.1
Using a sample of 1,924 active and 146 passive equity funds over the 1996–2008 period drawn from
the SEC’s N-SAR filings, we examine security lending practices and their impact on mutual fund
performance. We find that 85% of the funds in our sample are allowed to lend, but only 42% are actually
lending. This increase in the number of mutual funds that lend has made them an increasingly important
source of lending inventory, representing almost a quarter of the over $12 trillion global securities lending
inventory and double the percentage of inventory from US pension funds.2 While the willingness to lend
shares among U.S. mutual funds has increased dramatically over the sample period (from 15% of active
funds in 1996 to 43% in 2008), we find that actively managed equity funds that lend securities
underperform otherwise similar funds that do not lend. The four-factor risk-adjusted net return difference
between funds that lend and those that do not lend is statistically and economically significant at between
0.5% and 1% per year. The findings are robust to the inclusion of many family- and fund-level controls,
including style and fund fixed effects as well as propensity score matching methods.
1 Research that shows that short selling predicts future negative abnormal returns includes Brent, Morse, and Stice (1990), Senchank and Starks (1993), Aitken, Frino, McCorry, and Swan (1998), Danielsen and Sorescu (2001), Dechow, Hutton, Meulbroek, and Sloan (2001), D’Avolio (2002), Desai, Ramesh, Thiagarajan, and Balachandran (2002), Geczy, Musto, and Reed (2002), Jones and Lamont (2002), Lamont (2004), Asquith, Pathak, and Ritter (2005), Boehmer, Jones, and Zhang (2008), Diether, Werner, and Lee (2009), and Boehmer, Huszar, and Jordan (2010). 2 “Securities Lending Best Practices – A Guidance Paper for US Mutual Funds”, 2012, eSecLending, p.3, September 16, 2014.

2
Additionally, we find that index funds that lend stocks do not underperform otherwise similar index
funds as their risk-adjusted performance should not be affected by lending their holdings. Index funds
tracking the same index have similar portfolio holdings and returns, and thus index funds that lend
securities generate income that increase returns relative to other funds that do not lend. In contrast, active
funds can have different holdings, and thus the underperformance of funds that lend securities can be
driven endogenously by the holdings (i.e., funds lend the stocks that are demanded by short-sellers).
These results suggest that the underperformance of active funds is driven by demand effects, which is
consistent with the findings of Kaplan, Moskowitz and Sensoy (2013) that the increase in lending supply
does not adversely affect equity prices.
If the decision to lend shares is based on the demand from short sellers for a fund’s stock holdings,
our findings suggest that short sellers are better informed than fund managers. The idea that short sellers
are better informed investors is not new, and it is supported by a host of both theoretical and empirical
papers.3 This indicates that funds that lend have a long position in the stocks that are most desired by
short sellers. What is surprising about our fund performance results is that through their security lending
operation, fund families and managers receive a clear signal about the demand by short sellers for the
stocks in their portfolio but then fail to act on that signal by selling those stock holdings.
One potential explanation for the observed fund underperformance is that the security lending
decision is made at the advisor level for family-wide reasons, which is consistent with the idea that
family-level profit maximization concerns can dominate fund-level performance concerns (e.g., Nanda,
Wang, and Zheng (2004), Gaspar, Massa, and Matos (2006), Reuter (2006)). Anecdotally, larger fund
families often diversify their product offerings across different investment objectives in order to
maximize total assets under management and, in turn, family-wide profits. In describing the compensation
3 Diamond and Verrecchia (1987) argue that given the costs associated with short selling (i.e., loss of proceeds, lending fees, and dividends) investors that engage in shorting are likely to be informed traders. Engelberg, Reed, and Ringgenberg (2012) argue that the information advantage of short sellers lies in their ability to process publicly available information. Christophe, Ferri, and Angel (2004), Christophe, Ferri, and Hsieh (2010), Karpoff and Lou (2010), and Boehmer, Jones, and Zhang (2011) find evidence that short sellers actually anticipate earnings surprises, financial misconduct, and analyst downgrades.

3
system at the Massachusetts Financial Services fund family, Chief Investment Officer Kevin Parke
explained this strategic consideration:4
“…some types of stocks are always out of favor, and I want our managers to stay with those
stocks, picking the best of the worst. When they come back into favor, MFS will be prepared for
the inevitable surge in inflows. So I will continue to pay a manager well who is doing a good job
in an out-of-favor fund. But they must stick to picking the best stocks in their respective category.
I’m not going to reward a value manager who beat her index by including tech stocks (when tech
stocks were hot) in her portfolio. That is cheating. We need to build an excellent track record and
expertise in each of our asset classes over the long run.”
If a manager was allowed complete flexibility in managing their portfolio, decisions to purchase
securities outside their investment objective or to switch into and out of cash could potentially harm the
fund families’ overall product strategy of which funds to offer in each investment objective.5 If fund
managers are restricted from selling stocks in a style in order to accommodate these family-wide strategic
considerations, they might be unable to respond to the observed short-selling demand signal.
Consistent with this idea, we find that funds that lend securities are from larger fund families with
fund offerings that are well diversified across investment objectives. Also consistent with these family-
wide considerations and the effectiveness of the family’s product diversification strategy, we find that
families with securities lending programs are better at retaining assets within the family (i.e., outflows
from one fund are more likely to be recaptured as inflows to another fund in the family instead of leaving
the family altogether).
To assess whether or not investment restrictions prevent these managers from acting on the short-
selling signal, we construct an index of fund manager restrictions following Almazan, Brown, Carlson,
and Chapman (2004). We find that the underperformance of funds that lend stocks is concentrated among
4 “Massachusetts Financial Services,” Harvard Business School Case #902-132. 5 For example, value fund managers dramatically underperformed growth fund managers in 1999. If value managers started purchasing technology stocks to try and generate similar fund returns, those same managers would have missed the outperformance of value stocks relative to growth stocks after the burst of the Internet bubble.

4
funds in which the manager faces more investment restrictions.
While it is difficult to assess a manager’s motivation for selling a stock and to control for the aspects
of the stock themselves, we employ an unique holdings-based test to show the robustness of our results.
Specifically, we examine fund holdings for a sample in which a manager simultaneously manages a fund
that is allowed to lend securities and a fund that is not allowed. To assess the strategic implications of
engaging in equity lending, we compare how the manager responds to stocks that are “hard-to-borrow” in
the two different funds. We find that managers respond to a short-selling demand signal by selling the
stock in their portfolio, but the effect is much larger in the fund that is prohibited from lending versus the
fund that is allowed to lend. This result corroborates the interpretation of our findings that those funds
that can act upon the information signal received from the stocks in high borrowing demand outperform
funds that cannot.
Families may also benefit from security lending through sharing information inherent in the short
selling demand signal among funds within the family. To the extent that equity lending generates valuable
information, families may have some funds that lend securities so that other funds can trade based on that
information. We test for this cross-subsidization by examining whether funds that have access to lending
information through other funds in the same investment objective and family outperform otherwise
similar funds in families without access to the same lending information. We find that funds with access
to lending information within the family outperform funds without access to lending information by 4 to 6
basis points per month.
To further test the information cross-subsidization hypothesis, we run an analysis using fund
holdings. We first identify across a fund family all stocks that go on “special” and are held by a fund
within the family that lends equities. While this is a subset of all stocks that go on special, if equity
lending provides information about borrowing/short selling demand, these are the securities about which
the fund family has unique information. We then examine the performance of funds in the family that do
not lend, but that hold these same stocks. Using propensity score methods, we match these non-lending
funds that potentially learn about the short selling demand for their holdings through this intra-family

5
channel, with non-lending funds that hold the same stock, but that do not have access to this lending
information.
We find that non-lending funds with access to this intra-family information sell a larger percentage
of their position than similar funds without this intra-family information channel regarding the stocks on
special. This evidence is also consistent with the idea that the sharing of equity lending information
within a family has family-wide benefits, thus helping to explain why mutual fund managers lend what
they could sell. It is important to note that our tests of the information hypothesis use short-selling
demand proxies that could be purchased by fund families and could therefore be classified as “public”, at
least for a certain cost. At the same time, these measures proxy for any unique private information that the
family could generate from their security lending operations, including intra-daily indications of short-
selling demand, unmet or unfulfilled demand (calls to the lending desk when all shares have been lent),
and information regarding the identity of borrowers/short-sellers.
We find little or no evidence for alternative explanations for the observed underperformance like
agency costs associated with the use of an affiliated lender. Adams, Mansi, and Nishikawa (2011)
examine the equity lending practices of index funds and the role of mutual fund boards and affiliated
lending agents in negotiating what fraction of the security lending income is kept by the fund. They find
that index funds with an affiliated lending agent generate less lending income consistent with agency
problems inherent in negotiating with an affiliated agent. We examine whether the relation between
performance and equity lending among active funds is explained by the impact of lending agent
affiliation. We find that equity lending is more negatively related to performance for funds with affiliated
lending agents, but this effect is statistically insignificant in the case of active funds.
Our paper contributes to the understanding of the determinants of mutual fund performance. The
literature focuses on the performance consequences associated with portfolio holdings or long stock
positions (e.g., Kacperczyk, Sialm, and Zheng (2005), Cremers and Petajisto (2009)) and only a few
studies examine short stock positions. Agarwal, Boyson, and Naik (2009) find that mutual funds that
implement hedge fund strategies outperform traditional mutual funds. Chen, Desai, and Krishnamurthy

6
(2012) find that funds that short stocks as part of their investment strategy generate significant abnormal
performance from both their long and short stock position.
We also contribute to the understanding the economics of security lending, in particular the relation
between security lending and performance and the rationale of fund families in initiating security lending
programs. Our paper is related to a recent paper by Kaplan, Moskowitz, and Sensoy (2013) that studies
the effect on stock prices of a shock to the supply of lendable shares. They conducted an experiment for
an anonymous money manager in 2008–2009 and find that the returns to stocks that are made available to
lend are no different from the other stocks, which suggests that funds can lend out their stocks to earn
lending fees without fearing negative consequences for the value of their holdings.
Our paper provides new insights about the fund manager decision to lend shares by studying the
impact of stock lending on the performance of a large sample of actively managed mutual funds over an
extended period between 1996 and 2008, which contains periods of high and low demand for borrowing
stocks. Our results indicate that, on average, equity lending is associated with negative fund performance.
Security lending can be a profitable business, but fund managers should be aware of the potential adverse
effects on stock prices from securities lending. This result is not related to the effect of shorting supply on
stock prices, but rather to how managers respond to borrowing demand because of the fund family
organization. Our paper shows that the decision to lend is made out of strategic family-wide
considerations, which is consistent with the idea that family-level profit maximization can dominate
individual fund performance-maximization.
2. Data
Investment companies are required by the Investment Company Act of 1940 to file semiannual and
annual N-SAR reports with the SEC. The N-SAR form includes 133 numbered questions related to the
investment practices of each fund. The responses to these questions provide information on trading
activities, including whether or not the fund is allowed by its prospectus to lend securities and whether or

7
not it actually lends equities (question 70N) during the reporting period.6
We gather the N-SAR-B annual fund filings from the SEC’s Edgar database starting in 1996 and
ending in 2008.7 We focus on U.S. open-end domestic equity mutual funds, including both active and
index funds. We obtained the filings for 3,113 funds, of which 2,898 are active funds and 215 are index
funds. N-SAR reports are filed at a “series” level in which a series consists of one or more funds. For each
fund in the series, we hand collect the CUSIP and ticker. The sample is representative of the U.S. mutual
fund industry as it covers 62% of the number of funds and aggregate TNA of equity funds in the CRSP
mutual fund database (see Table A.1 in the Internet Appendix).8 Our matched N-SAR-CRSP sample does
not differ significantly from the CRSP sample in terms of the main fund characteristics such as fund size,
age, expense ratio, and turnover.
We then match each fund to the CRSP mutual fund database to collect data on performance and fund
characteristics. For funds with multiple share classes, we compute fund-level variables by aggregating
across the different share classes and eliminating duplicate share classes. From our sample of U.S.
domestic equity funds, we also exclude sector funds, enhanced index funds, and funds with no style
category. The final sample covers 2,070 funds, of which 1,924 are active funds and 146 are index funds.
The explanatory variables of interest are indicator variables that equal one for funds that are allowed
to lend securities (“Security Lending Allowed”) and funds that actually lend securities (“Security Lending
Used”) in each year. We also collect the income generated from lending (“Security Lending Income”) and
the collateral used to secure the security loan (“Security Lending Collateral”) from the annual SEC N-
CSR fillings. The income and collateral variables only cover the 2002–2008 period.
We use several fund-level variables in our analysis. We obtain the holdings as reported in
Morningstar for the sample period 1996–2008 for the funds in our sample and calculate the value-
6 A list of the questions and sub-questions is available at: http://www.sec.gov/info/edgar/forms/N-SARdoc.htm. 7 Reporting began with a subset of funds in 1993 and was gradually phased in for all funds. All funds were required to report by the end of 1995. 8 Other studies that use the N-SAR data include Edelen (1999), Almazan, Brown, Carlson, and Chapman (2004), Reuter (2006), Christoffersen, Evans, and Musto (2012), and Edelen, Evans, and Kadlec (2012).

8
weighted average short interest and institutional ownership of the stocks in the fund’s portfolio. We
calculate fund utilization, defined as the ratio of average short interest to institutional ownership for the
stocks in the fund’s portfolio. Fund utilization controls for the short-selling demand (as proxied by short
interest) and the lending supply (as proxied by institutional ownership).
We also calculate a measure of fund manager investment restrictions. Following Almazan, Brown,
Carlson, and Chapman (2004), we construct a fund-level index of investment restrictions in each year
using the N-SAR-B fund filings. The index is constructed using the answers to six questions on
investment restrictions: (1) borrowing of money, (2) margin purchases, (3) short selling, (4) writing or
investing in options on equities, (5) writing or investing in stock index futures, and (6) investments in
restricted securities. We code the answers as dummy variables that equal one if the fund is restricted.
Restrictions are aggregated in three categories: use of leverage (1)–(3), derivatives (4)–(5), and illiquid
assets (6). We take the average of the dummies within each category and then take an average of the three
categories. The resulting restriction index is between zero and one, and a higher score indicates a more
constrained fund.9
Table 1 provides summary statistics for all the variables used in our analysis. The monthly four-
factor Carhart alphas are calculated using factor exposures estimated over the previous 36 months. The
average four-factor alpha is slightly negative (14 basis points per month), which is consistent with
previous studies. Fund characteristics include total net assets (TNA), net fund flow as a percentage of
TNA, expense ratio, fund turnover, active share, age, and performance rank within the investment style
category. The variables also include fund family characteristics such as family TNA, average family net
flows, expense ratio and active share (of actively managed funds), and the percentage of index funds,
9 We also construct an alternative restriction index that includes the additional investment allowance/restriction questions in the N-SAR fillings: writing or investing in repurchase agreements, options on equities, options on debt securities, options on stock indices, interest rate futures, stock index futures, options on futures, options on stock index futures, other commodity futures; investments in restricted securities, shares of other investment companies, securities of foreign issuers; currency exchange transactions; loaning portfolio securities; borrowing of money; purchases/sales by certain exempted affiliated persons; margin purchases; and short selling. The results using this alternative index are similar to those presented in the paper.

9
subadvised funds, and funds sold through brokers in the family. Table A.2 in the Appendix provides
variable definitions.
We examine the prevalence of security lending among mutual funds. Panel A of Table 2 and Figure
1 show a dramatic increase in both the percentage of active funds that are allowed to lend securities and
the percentage of funds that actually lend securities. Before 2000, less than 25% of the active funds
actually lent their stock holdings. In the 2000s, the percentage of active funds lending out their holdings
increased significantly, reaching 43% in 2008. The percentage of index funds engaging in security
lending has always been higher relative to that of active funds, but we also observe an increase in the
willingness to lend securities in recent times. The percentage of index funds lending their holdings
increased significantly from 14% in 1997 to 67% in 2008.
Panel B of Table 2 shows the transition probabilities between the different security lending states.
During the sample period, 16% of active funds and 40% of index funds switch from prohibiting to
allowing security lending. Less than 3% of the active and index funds switch from allowing to prohibiting
security lending.
3. Security Lending and Fund Performance
In this section, we study the relation between security lending and fund performance. A fund
generates additional income when it lends its stock holdings, but the short-selling/borrowing demand for a
stock is a strong signal of future underperformance. It is an empirical question whether or not the income
generated from stock lending outweighs the potential gain a manager could obtain by responding to this
short-selling demand signal by selling the stock. We examine this trade-off through the analysis of the
fund’s risk-adjusted performance and equity lending.
3.1 Multivariate Regression Results
We first estimate panel regressions of monthly fund after-fee performance on the security lending
used dummy and other fund characteristics. The dependent variable is the fund’s monthly four-factor
alphas. We control for short-selling demand and lending supply using the fund utilization variable. Other

10
control variables include the expense ratio, total net assets (TNA), net flow, turnover, family TNA, and
percentage of funds sold through brokers in the family. The standard errors are clustered at the fund level
to correct for within-fund correlation. Table 3 presents the regression estimates. Panel A shows the
estimates for the sample of active funds and Panel B for the sample of index funds.
Column (1), Panel A, shows a negative and significant relation between fund performance and
security lending. This indicates that active funds that lend out their stock holdings underperform
otherwise similar funds that do not make their holdings available to the lending market. The effect is
economically important as funds that lend their holdings underperform other funds by six basis points per
month in terms of four-factor alphas.
The coefficients of the other fund characteristics are in line with previous studies. Fund size is
negatively related to performance, while family size is positively related (Chen, Hong, Huang, and Kubik
(2004)). Expenses negatively impact performance (Malkiel (1995), Carhart (1997), Gil-Bazo and Ruiz-
Verdu (2009)), and broker-sold funds underperform even after controlling for expenses (Bergstresser,
Chalmers, and Tufano (2009)). It is interesting to note that the coefficient on the level of utilization of the
fund’s portfolio holdings is negative and significant, which is consistent with the evidence of a negative
relation between short-selling demand and future stock performance.
To address the potential concern that the fund performance result is due to an omitted variable such
as portfolio manager skill and style differences, columns (2)–(4) include investment style fixed effects,
investment style-time fixed effects, and fund fixed effects, respectively. This controls for unobserved
sources of fund heterogeneity and addresses the joint determination problem in which an unobserved
time-invariant variable simultaneously determines fund performance and fund characteristics. The
economic magnitude of the security lending effect on performance remains sizable in all specifications.
Columns (1)–(4) use a sample that includes both funds that are allowed to lend securities and funds
that are not allowed. If funds that allow security lending are systematically different from funds that
prohibit lending, the results could be spurious. To address this concern, columns (5)–(8) present estimates
using only the sample of active funds that are allowed to engage in security lending, that is, excluding

11
funds that are prohibited from lending. Similar to the previous results, we find that funds that lend out
securities underperform similar funds that are allowed to lend but refrain of doing so by four to seven
basis points per month. Overall, the results on the sample of active funds suggests that the adverse effects
on fund performance from continuing to hold stocks with strong short-selling demand outweighs the
additional income generated by lending these stocks.
While managers of active funds have discretion over whether or not to buy, sell or hold a given
stock, index fund managers have much less discretion. Because their objective is to track as closely as
possible the performance of their stated index, passive fund managers likely do not focus on the future
out- or underperformance of a stock, but rather they focus on whether or not it belongs to the index they
are tracking. Given this fundamentally different motivation for buying, selling or holding stocks, index
funds serve as an important robustness check throughout our analysis. If our interpretation of the findings
for active funds is correct, we should not find a negative relationship between security lending and the
performance of index funds. To assess whether or not this is the case, we separately estimate the security
lending used coefficient for the sample of index funds. Panel B of Table 3 presents the results. Consistent
with our interpretation, the security lending used variable is statistically insignificant in all specifications.
3.2 Propensity Score Matching Results
Matching methods alleviate some of the concerns associated with linear regressions and mitigate
asymptotic biases arising from self-selection. We use propensity score matching to compare the
difference in performance of both active and index funds that lend securities (treated sample) with funds
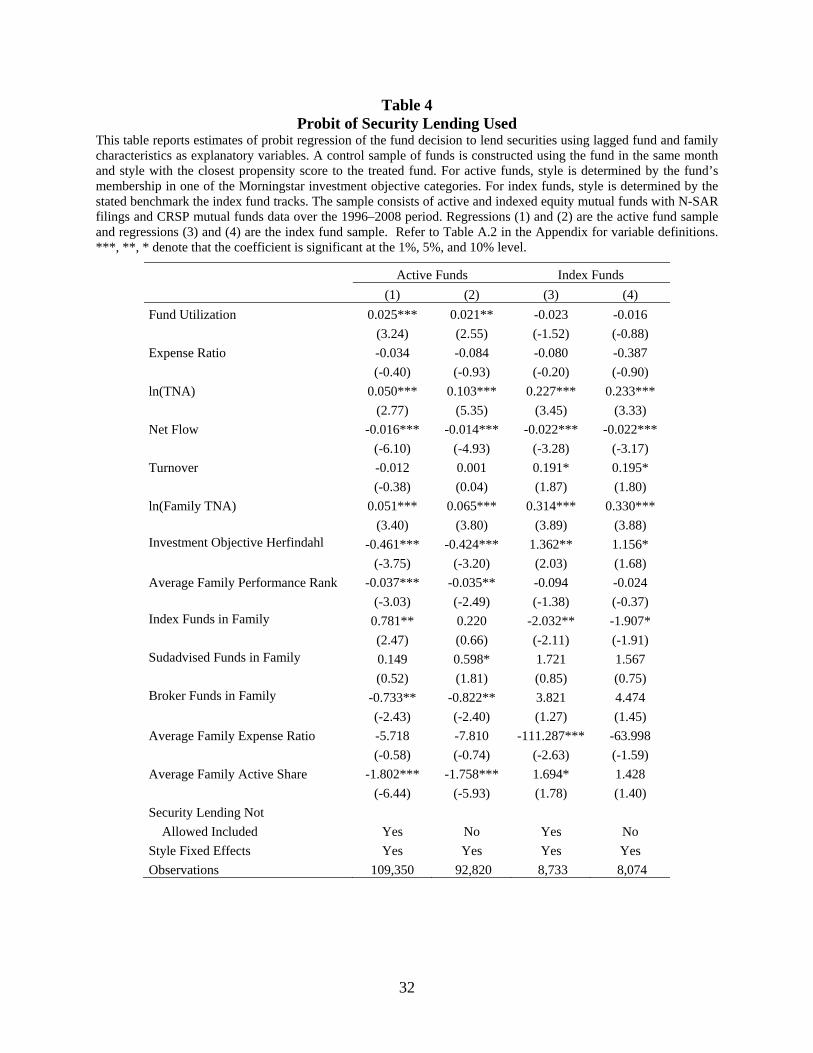
that do not lend securities (control sample). We estimate a probit of the fund’s decision to lend securities
(dependent variable is the security lending used dummy variable) based on family and fund
characteristics. In each month, we match each fund that lends securities with a fund that does not lend
securities with the closest propensity score (nearest neighbor estimator) in the same investment objective
(in the case of active funds) or tracking the same underlying benchmark (in the case of index funds).
Table 4 reports the estimates of the probit of the fund security lending decision. Columns (1) and (2)

12
use the sample of active funds, while columns (3) and (4) use the sample of index funds. Similar to Table
3, columns (1) and (3) include funds that are not allowed to lend securities and in columns (2) and (4) the
sample is limited to those funds that are allowed to lend securities.
In addition to providing a basis for selecting the control sample, the probit provides insight into the
economics behind securities lending. For the sample of active funds, larger funds with lower flows from
larger fund families in which less funds are sold through brokers are more likely to initiate a security
lending program. Families with lower average fund performance, as measured by the average fund
performance rank within the investment objective, are also more likely to initiate a security lending
program. Families with lower average active share across funds are also more likely to allow lending.
Perhaps, not surprisingly, funds with a higher utilization rate are more likely to lend as well.
Families with more diverse fund offerings across investment objectives, as proxied by the Herfindahl
index of total net assets (TNA) in each investment objective, are more likely to allow security lending.
The results suggest that initiating a security lending program is a family-wide decision related, in part, to
the diversification of the family’s overall product offerings across investment objectives. These results are
consistent with Rizova (2012) that shows that security lending is a family-level decision driven by
economies of scale and past performance.
For index funds, the fund size, family size and net flow results are similar. However, the results in
column (4) with only funds that are allowed to lend indicate that index funds that lend shares are more
likely to come from a family with offerings concentrated in an investment objective. Given the
disproportionate size of index funds tracking the S&P 500, this result may arise from families with index
fund operations concentrated in large cap investment objectives.
Table 5 shows a comparison of average fund performance and characteristics between the treated
and non-treated samples and between the treated and control samples. The control samples for the active
and index funds are identified using the probit estimates from regressions (2) and (4) of Table 4,
respectively. Panel A of Table 5 presents the comparison for active funds and Panel B presents the
comparison for index funds.

13
Table 5 confirms the results of Table 4 for both active and index funds. The average active fund in
the treated sample has a negative four-factor alpha of 18.3 basis points per month and the average fund in
the control sample has a negative alpha of 14.5 basis points per month. The estimated effect on risk-
adjusted performance of security lending is a statistically significant 3.8 basis points per month, which is
similar to our previous estimates. For index funds, there is a negative and statistically insignificant
difference when comparing the treated to non-treated samples, but when using the control sample, the
difference is positive and statistically insignificant at 1.8 basis points. Looking at the other variables in
Table 5, we see that there are significant differences between the treated and non-treated samples, but the
control sample constructed using the propensity score matching method is closer to the treated sample for
the majority of fund characteristics.10 As a robustness check, we also run a regression of the differences in
four-factor alpha performance between treated and propensity score matched control funds but controlling
for the characteristics with statistically significant differences. The differences (untabulated) in four-factor
alphas are similar at -3.2 basis points for active funds and 1 basis point for index funds.
3.3 Effect of Investment Restrictions and Affiliated Lending Agents
We have shown that actively managed funds that lend securities underperform otherwise similar
funds that do not lend securities. This is perhaps not surprising given the documented relation between
short-selling demand and the future underperformance of a stock. What is surprising is that fund
managers receive a clear signal about the demand by short sellers for their stock holdings but then choose
to lend the stocks instead of selling them in anticipation of the future price decrease. Why would they fail
to act upon this signal?
One potential explanation is that fund managers might be limited in their ability to act upon the
information signal. Almazan, Brown, Carlson, and Chapman (2004) show that management companies
confine managers’ investment decisions through the use of various restrictions. In the N-SAR form
10 If we do not require the control sample to match the date and investment objective/benchmark exactly, the differences between treated and control funds improves substantially, but the performance results are similar to what is found in Table 5.

14
(question 70N) mutual funds are asked to provide information on their investment activities and whether
or not they are prohibited from using certain investment strategies. Following Almazan, Brown, Carlson,
and Chapman (2004), we compute an index of the investment restrictions that a manager faces in the
usage of leverage, derivatives, and illiquid assets. The value of the index ranges between zero and one,
and a higher score indicates a more restricted fund (see Table A.2 in the Appendix for a detailed
description). We interact the restriction index with the security lending used dummy variable to see how
investment restrictions affect the relation between fund performance and security lending. If this channel
explains our findings, we should find that the interaction variable coefficient is negative and significant.
Table 6 presents the estimate of performance regressions similar to those in Table 3 with additional
explanatory variables. The samples includes only active funds and the specification includes style-time
fixed effects.11 Column (1) includes the interaction between the security lending used dummy and the
restriction index. The coefficient on the interaction between the security lending used dummy variable
and the restrictions index is negative and significant. The interpretation is that the negative effect of
equity lending on fund performance is concentrated among funds in which managers face more
investment restrictions. This is consistent with security lending only negatively affecting fund
performance when funds are restricted from selling stock holdings even though they observe the short-
selling demand signal.
In an alternative test, we examine the effect of security lending on fund performance conditional on
whether funds are allowed to trade options or futures, which could be used to hedge the future expected
underperformance of the stocks held by the fund with short selling demand.12 The results in column (2)
show that the negative effect of security lending on performance is offset for funds that can trade options
or futures. Funds that lend out stocks underperform similar funds by 9.7 basis points, but for those funds
that can trade options and futures, the effect on performance is attenuated by 7.9 basis points. So the net
11 The results are robust to the inclusion of family fixed effects. 12 We consider whether a fund is allowed to trade futures and options. Specifically, we consider whether a fund can trade equity options, debt options, index options, stock futures, option futures, commodity futures, interest rate futures, and option index futures.

15
effect of security lending on performance for those funds that are less restricted is nearly zero. This
evidence is consistent with managers being able to act upon the information signal inherent in borrowing
demand when they are less restricted.
An alternative explanation for the negative link between fund performance and security lending is
that the income from lending the securities is insufficient to offset the potential adverse effect on the
value of the fund’s holdings due to agency costs. In a typical security lending arrangement, the lending
income is split between the fund investors and the lending agent who facilitates the security lending.
Adams, Mansi, and Nishikawa (2011) find that index funds with an affiliated lending agent earn lower
investment returns on lent securities and less of the lending income is shared with the fund investors. If
lending through an affiliated lending agent generates income for the fund family, the fund manager might
be more inclined to lend in spite of the impact on fund performance because of the benefits for the family
through the use of the affiliated lending agent.
In order to explore conflicts of interest as a channel by which security lending might affect fund
performance, we gathered information on whether a fund uses an affiliated lending agent from the SEC
N-CSR fillings. We examine this channel by looking at the performance differences between funds whose
lending arrangements involve an affiliated lending agent and those that only use an unaffiliated lending
agent. Column (3) of Table 6 shows that the coefficient of the interaction between the security lending
used dummy and the affiliated lending agent dummy is negative, which is consistent with the evidence of
a conflict of interest described by Adams, Mansi, and Nishikawa (2011) but the effect is economically
and statistically insignificant. Moreover, the negative relation between security lending and performance
remains negative and significant after we add the affiliated agent dummy and its interaction to the
regression. The interpretation is that the presence of an affiliated lending agent enhances the negative
effect of security lending on performance, but there is also a negative and significant effect when no
affiliated lending agent is involved. The estimates in column (3) suggest that conflicts of interest cannot
explain the negative relation between fund performance and security lending in active funds.
The results are consistent with the idea that fund managers recognize the negative signal about future

16
performance inherent in the short-selling demand for the fund’s holdings, but they are limited in their
ability to act upon it. In such a case, security lending would at least generate some income improving the
fund’s performance when the fund manager is restricted to act.
An additional reason why mutual fund families might require some funds to lend their securities is to
have better access to the information signal in security lending fees. While market participants can
purchase rebate rate data, a family’s securities lending operation may generate additional information
regarding the identify of clients who are interested in borrowing, individual borrowing transaction data,
and information about borrowing transactions that were inquired about or proposed but never concluded.
To the extent that equity lending generates valuable information, families may have some funds lending
so that other funds can trade on that signal. Families might allow certain funds to engage in security
lending even if this leads to underperformance to maximize their comparative advantage in information
acquisition and investing in other funds of the family.
We test for information cross-subsidization within fund families by examining the performance of
funds have access to lending information within a family. The lending information dummy takes the value
of one if a fund does not lend securities and belongs to a family with at least one fund (active or index) in
the same investment objective that lends securities. We run a panel regression of the four-factor alpha on
the lending information dummy variable and fund characteristics. If families leak the short selling
information to other funds in the family we expect the coefficient on lending information to be positive
and significant. Column (4) of Table 6 shows that the lending information coefficient is positive and
statistically significant. Funds with access to lending information within the family outperform otherwise
similar funds without access to lending information by 3.8 basis points per month.
The results supports the idea that security lending generates positive information externalities to
other funds in the same family that attenuate the negative effect on fund performance of security lending.
3.4 Manager-Fund Pairs Results
While the results above provide evidence that consistent with family-wide interests, fund managers

17
might be limited in their ability to act upon the information signal. It is difficult to analyze the a
manager’s reasons for buying or selling a particular stock because we do not know his information set. If
we look at the decision of the same manager about the same stock at the same time in two different
portfolios, we can effectively control for the manager’s information set and better isolate the impact of
investment restrictions. By selecting two portfolios from the same manager in which security lending is
allowed in one and prohibited in the other, we can analyze how security lending may affect the manager’s
decision to trade the stock.
To implement this test, we identify a sample of active funds in which at least two funds have the
same manager, but security lending is allowed in one fund and is prohibited in the other fund. We then
identify those stocks that are held in both funds that become “hard-to-borrow” (i.e., stocks with high
short-selling demand and limited borrowing supply).13 A stock is classified as hard-to-borrow if the ratio
of short interest to shares outstanding is greater than 20%.14 Using quarterly fund holdings around the
month when the stock becomes hard-to-borrow, we calculate the change in the number of shares held (as
a percentage of the number of shares outstanding) by the manager in each of the two funds and the
difference between the two funds.15
Panel A of Table 7 shows that a fund manager decreases his position by 0.109% of shares
outstanding when a stock becomes hard-to-borrow in the fund in which security lending is prohibited. In
the fund in which securities lending is allowed, the manager only decreases his position in the same stock
by 0.054%. The difference is statistically significant at the 1% level. This suggests that when a fund
manager is prohibited from lending, he is more likely to respond to the short-selling demand signal by
13 D’Avolio (2002) and Nagel (2005) show that short selling is more expensive when institutional ownership is low. Kolasinski, Reed, and Ringgenberg (2012) show that lending fees are responsive to high short-selling demand. 14 The cutoff of 20% as a proxy for specialness is selected by comparing monthly stock level specialness data from Data Explorers to different cutoffs for the short interest/shares outstanding ratio. While the stock-level specialness data only covers the period from July 2006 to December 2010, we use it to identify the cutoff (across 5% increments) of the ratio of short interest to shares outstanding with the highest correlation to actual specialness. We then apply this cutoff of 20% as our proxy for specialness across the whole sample period (1996 to 2008). 15 In the case where there are more than two funds for a given manager, we take the average for funds in which security lending is allowed and for funds in which it is prohibited.
18
selling the stock.
To refine the previous test, we split the sample of manager-fund pairs into two groups: funds that are
allowed to lend securities but do not actually lend any securities in a given month (Panel B), and funds
that are allowed to lend securities and actually lend securities in a given month (Panel C). In both panels,
the comparison group remains the twin portfolio of the manager in which security lending is prohibited.
We expect that managers of funds that are allowed to lend but do not actually lend to behave similarly to
their restricted portfolio. In contrast, we expect the difference in the position change to be greatest for
managers who are allowed to lend and actually lend stocks in a portfolio versus their restricted portfolio.
Panel B shows a statistically insignificant difference in the position change of the fund that is
allowed to lend securities but does not lend versus the fund in which security lending is prohibited. Panel
C shows that a manager decreases his position when a stock becomes hard-to-borrow by 0.058% of shares
outstanding in the fund that lends securities, while the decrease is 0.145% in the fund in which security
lending is prohibited. The difference of 0.087% is statistically significant at the 1% level.
Table 7 also reports the average expense ratio, total net assets (TNA), age, net flow and whether the
fund is subadvised for each group of funds. Panel C shows that the funds in which the manager is less
responsive to the short-selling demand signal (funds in which security lending is allowed and used) have
lower expense ratios, smaller size, are older, have lower flows, and a higher percentage of them are
subadvised. This evidence is consistent with the idea that the funds with security lending programs in
place that actually lend securities are less profitable for the fund family.
Overall, the evidence suggests that a manager is less sensitive to the short-selling demand signal
when a securities lending program is in place, while the same manager responds more aggressively to the
same signal in a fund in which security lending is not allowed.
3.5 Family Security Lending Information and Manager Response to Borrowing Demand
The intra-family information cross-subsidization evidences show that funds with access to lending
information outperform otherwise similar funds without access to lending information. While we attempt

19
to control for other factors in that analysis, the possibility of an omitted variable remains. In this section,
we refine our analysis of whether or not funds from families that have lending information trade on it.
Using holdings data, we first identify across a fund family all stocks that go on “special” and are held
by funds that lend securities. While this is a subset of all stocks that go on special, if equity lending
provides information about borrowing/short selling demand, these are the securities about which the fund
family has unique information. We then identify those funds in the same family that do not lend but hold
these stocks that are on special (treated funds) and compare their trading behavior to otherwise similar
funds that also hold these stocks and do not lend, but belong to a family that does not have lending
information about the stock on special (non-treated funds).
Using propensity score methods, we then match these non-lending funds that potentially learn about
the short selling demand for their holdings through this intra-family channel, with non-lending funds that
hold the same stock, but that do not have access to this lending information (control funds). Panel A of
Table 8 reports the estimates of the probit regression we use to select control funds using propensity score
matching methods. Column (1) presents the estimates for the sample of active funds and column (2)
presents the estimates for the sample of index funds.
We then compare the trading behavior of funds (treated) that do not lend, but that potentially have
access to short selling demand information about their holdings through other funds in the family with
funds (control) from other families that do not have access to short selling demand information through
their family’s security lending operations. Position change is the quarterly change in the number of shares
held by the fund (as a percentage of the number of shares outstanding) around the period in which the
stock becomes hard-to-borrow if the ratio of short interest to shares outstanding is greater than 20%.
Panel B of Table 8 shows the comparison of the average fund trading and characteristics between the
treated and non-treated samples and between the treated and control samples for active funds. Treated
funds show a smaller increase in the position (0.022%) compared to non-treated funds (0.088%) when a
stock goes on special. The average difference between treated and control funds is also negative at
0.064%, which is statistically significant at a 1% level. This result is consistent with the idea that funds

20
that do not lend securities benefit from other funds in the same family that do lend.
In addition, we repeat the exercise using index funds. Since index funds are passive in their trading
approach, if we find similar result in the sample of index funds, it suggests that sharing of short selling
demand information across funds in the family does not drive the trading behavior. Panel C of Table 8
shows no difference in position change between treated and control funds in the sample of index funds.
This finding corroborates that fund families leak security lending information to other funds within the
family and these funds trade on this information.
3.6 Fund Flows Results
Why do fund families restrict funds’ investment policies? In order to maximize assets under
management, a key determinant of profitability, fund families often diversify their fund offerings across
different investment objectives. If an investor in the family’s funds redeems his shares due to poor
performance or other factors, the family has an alternate investment option to offer him. Successfully
retaining the investor’s assets in this way can enhance both the level and the stability of fund family
profits. If fund managers were given complete flexibility in managing a portfolio, their decisions to
purchase securities outside their investment objective or to switch into and out of cash could harm the
fund families’ overall product strategy of which funds to offer in each investment objective.16 If the
implementation of this family-wide product offering strategy requires managers not deviate much from
their designated investment style, regardless of whether or not that style is in favor, a security lending
program will at least generate some income to mitigate the potential impact of holding stocks with short-
selling demand. In this way the family can build a track record and expertise in each asset class and
receive inflows from styles or asset classes favored by investors. Consistent with this idea, in Table 4 we
find that families with fund offerings that are well diversified across investment objectives and families 16 For example, anecdotally during the Internet bubble, value funds had underperformed growth funds, and some value managers increased their exposure to growth stocks. When the bubble burst and value funds subsequently outperformed growth funds, these funds that deviated from their investment objective missed that subsequent outperformance. As investors redeemed from growth funds, fund families would have liked to steer those exiting investors into other family funds including their value funds. If the manager of those value funds deviated from their investment style, family profitability could suffer as investors would look for value funds in other fund families.

21
whose active funds deviate less from their benchmark (i.e., lower active share) are more likely to have
security lending programs in place for their actively managed funds.
An additional prediction of this fund family strategy is related to the recapture of fund flows. If
security lending programs do complement the family’s strategy of diversifying their overall product
offerings, these families should be better at retaining assets under management as outflows from a fund in
the family will translate into inflows into another fund in the same family. Using the inflow and outflow
data from the N-SAR filings, we test this additional prediction. Table 9 shows regression estimates of the
relation between fund inflows and outflows and outflows and inflows from all other funds in the family
(“Family Outflows” and “Family Inflows”). Columns (1) and (2) report results where the dependent
variable is monthly fund inflows, and columns (3) and (4) report results where the dependent variable is
monthly fund outflows. The regression controls for other fund characteristics such as performance,
expense ratio, size, turnover, and family size. We also control for (lagged) fund inflows and outflows and
inflows and outflows into all funds in the same investment objective.
Column (1) shows a positive correlation between a fund’s inflows and contemporaneous outflows
from other funds in the same family, while column (3) shows a positive correlation between a fund’s
outflows and contemporaneous inflows from other funds in the same family. In columns (2) and (4), we
expand the specifications in columns (1) and (3) to include an interaction of family inflows and outflows
with the percentage of a family’s funds that allow securities lending (“Security Lending Allowed in
Family”). The positive and significant coefficients of the interaction variables in columns (2) and (4)
indicate that the family’s ability to recapture assets (i.e., outflows from one fund translating into inflows
to another fund) increases with the percentage of funds where security lending is allowed. In short, the
evidence supports the notion that security lending allows a fund manager to stay close to its investment
objective and be consistent with the overall fund family product strategy.
3.7 Robustness
So far, we have presented results using a dummy variable that indicates whether a fund lends its

22
stock holdings or not, but it does not take into account what fraction of the portfolio is lent or how much
investment income is generated from lending. Table A.2 in the Internet Appendix repeats the analysis in
Table 3 using the actual lending income and collateral instead of the security lending used dummy. This
analysis is restricted to the 2002-2008 period and a subsample of funds for which data on lending income
and collateral are available.
We find that security lending is negatively associated with fund performance. There is a negative
relation between fund performance and lending income in column (1), although the relation with
collateral is statistically insignificant in column (2). When including both the collateral as well as security
lending income in column (3), the coefficient on collateral becomes positive and significant, while the
security lending income coefficient remains negative and significant. A higher collateral value could
signify more bargaining power as a lender, leading to better lending terms.17 Overall, we find that funds
that lend perform worse even when we use lending income as explanatory variable.
4. Conclusion
There is a long literature showing that short-selling demand is a strong signal of the future risk-
adjusted underperformance of a stock. Because of limits to arbitrage, in particular the costs associated
with or the inability to borrow the underlying security, investors are limited in their ability to profit from a
strategy of short-selling these stocks. The focus of our paper is not on short-sellers, but rather on the fund
managers who own these securities in the first place and lend them. We find that actively managed funds
that lend equities underperform otherwise similar funds that do not lend securities, which is consistent
with the evidence of future underperformance of securities with short-selling demand. While this result
could be driven by omitted variables, we run a number of robustness checks including propensity score
17 While the statistically insignificant coefficient on the security lending collateral variable in column (2) is surprising, it is important to note the difference in how the lending income and collateral variables are calculated. In the N-CSR filings, security lending income captures the total lending income for the 12-month period. Security lending collateral, however, is the most recent snapshot of the collateral held by the fund, and not the average collateral held over the 12-month period. Because it gives a more comprehensive assessment of the fund’s lending over the whole period, we expect that lending income is a better proxy for lending activity than collateral.
23
matching and find similar results. This raises an important question which we endeavor to answer in this
paper: why lend what you can sell?
We explore the potential explanation for the observed underperformance coupled with the increasing
popularity of equity lending programs among mutual funds. Indeed, we find that there is a substantial
increase in security lending for equity funds in 1996–2008. While the practice of lending shares was
limited to less than 25% of the active funds before 2000, the percentage of funds lending their shares
increased significantly to 43% by 2008. We find that the negative relation between fund performance and
security lending appears to be explained by the idea that fund family profit maximization considerations
dominate individual fund performance considerations. We find that funds that lend securities are from
larger fund families with fund offerings that are well diversified across investment objectives. Moreover,
we find that the underperformance is concentrated among funds with greater investment restrictions.
The interpretation is that fund managers are limited in their ability to sell the stock when they receive
the short-selling demand signal due to investment restrictions in line with the fund families’ overall
product strategy of which funds to offer in each investment objective. We also find evidence consistent
with cross-family subsidization through sharing of the short selling signal within the fund family. The
investment restrictions and the cross-subsidization of information within fund families explain why fund
managers are reluctant to sell what they can lend. In this way, stock lending will at least generate some
income that minimizes the effects of future stock underperformance.
We conclude that the decision to allow security lending by mutual funds has important implications
for fund performance. While lending fees can be an additional source of income to the fund, the decision
to hold stocks with strong short-selling demand can negatively affect future fund performance. Mutual
fund boards and fund managers should consider this potential trade-off when making decisions about
security lending programs. This paper contributes to the understanding of the consequences of security
lending for fund performance and helps to shed light on the issue of why fund families initiate security
lending programs and why such programs may be detrimental to individual fund performance.

24
References
Adams, J., Mansi, S., Nishikawa, T., 2011. Affiliated agents, board of directors and mutual fund
securities lending returns. Working paper, University of Texas at Arlington.
Agarwal, V., Boyson, N., Naik, N., 2009. Hedge funds for retail investors? An examination of hedged
mutual funds. Journal of Financial and Quantitative Analysis 44, 273-305.
Aitken, M., Frino, A., McCorry, M., Swan, P., 1998. Short sales are almost instantaneously bad news:
Evidence from the Australian stock exchange. Journal of Finance 53, 2205-2223.
Almazan, A., Brown, K., Carlson, M., Chapman, D., 2004. Why constrain your mutual fund manager?
Journal of Financial Economics 73, 289-321.
Asquith, P., Pathak, P., Ritter, J., 2005. Short interest, institutional ownership, and stock returns. Journal
of Financial Economics 78, 243-276.
Bergstresser, D., Chalmers, J., Tufano, P., 2009. Assessing the costs and benefits of brokers in the mutual
fund industry. Review of Financial Studies 22, 4129-4156.
Boehmer, E., Huszar, Z., Jordan, B., 2010. The good news in short interest. Journal of Financial
Economics 96, 80-97.
Boehmer, E., Jones, C., Zhang, X., 2008. Which shorts are informed? Journal of Finance 63, 491-527.
Boehmer, E., Jones, C., Zhang, X., 2011. What do short sellers know? Working paper, University of
Oregon.
Brent, A., Morse, D., Stice, E., 1990. Short interest: Explanations and tests. Journal of Financial and
Quantitative Analysis 25, 273-289.
Chen, H., Desai, H., Krishnamurthy, S., 2012. A first look at mutual funds that use short sales. Journal of
Financial and Quantitative Analysis, forthcoming.

25
Chen, J., Hong, H., Huang, M., Kubik, J., 2004. Does fund size erode mutual fund performance? The role
of liquidity and organization. American Economic Review 94, 1276-1302.
Christoffersen, S., Evans, R., Musto, D., 2012. What do consumers’ fund flows maximize? Evidence
from brokers’ incentives. Working paper, University of Toronto.
Christophe, S., Ferri, M., Angel, J., 2004. Short-selling prior to earnings announcements. Journal of
Finance 59, 1845-1875.
Christophe, S., Ferri, M., Hsieh, J., 2010. Informed trading before analyst downgrades: Evidence from
short sellers. Journal of Financial Economics 95, 85-106.
Cohen, L., Diether, K., Malloy, C., 2007. Supply and demand shifts in the shorting market, Journal of
Finance 62, 2061-2096.
Cremers, M., Petajisto, A., 2009. How active is your fund manager? A new measure that predicts
performance. Review of Financial Studies 22, 3329-3365.
D’Avolio, G., 2002. The market for borrowing stock. Journal of Financial Economics 66, 341-360.
Danielsen, B., Sorescu, S., 2001. Why do option introductions depress stock prices? A study of
diminishing short sale constraints. Journal of Financial and Quantitative Analysis 36, 451-484.
Dechow, P., Hutton, A., Meulbroek, L., Sloan, R., 2001. Short-sellers, fundamental analysis and stock
returns. Journal of Financial Economics 61, 77-106.
Desai, H., Ramesh, K., Thiagarajan, S., Balachandran, B., 2002. An investigation of the informational
role of short interest in the NASDAQ market. Journal of Finance 57, 2263-2287.
Diamond, D., Verrecchia, R., 1987. Constraints on short-selling and asset price adjustment to private
information. Journal of Financial Economics 18, 277-311.
Diether, K., Werner, I., Lee, K., 2009. Short-sale strategies and return predictability. Review of Financial
Studies 22, 575-607.

26
Edelen, R., 1999. Investor flows and the assessed performance of open-end mutual funds. Journal of
Financial Economics 53, 439-466.
Edelen, R., Evans, R., Kadlec, G., 2012. Disclosure and agency conflict in delegated investment
management: Evidence from mutual fund commission bundling. Journal of Financial Economics 103,
308-326.
Engelberg, J., Reed, A., Ringgenberg, M., 2012. How are shorts informed? Short sellers, news, and
information processing. Journal of Financial Economics 105, 260-278.
Gaspar, J.-M., Massa, M., Matos, P., 2006. Favoritism in mutual fund families? Evidence on strategic
cross-fund subsidization. Journal of Finance 61, 73-104.
Geczy, C., Musto, D., Reed, A., 2002. Stocks are special too: An analysis of the equity lending market.
Journal of Financial Economics 66, 241-269.
Gil-Bazo, J., Ruiz-Verdu, P., 2009. The relations between price and performance in the mutual fund
industry. Journal of Finance 64, 2153-2184.
Jones, C., Lamont, O., 2002. Short-sale constraints and stock returns. Journal of Financial Economics 66,
207–239.
Kacperczyk, M., Sialm, C., Zheng, L., 2005. On the industry concentration of actively managed equity
mutual funds. Journal of Finance 60, 1983-2011.
Kaplan, S., Moskowitz, T., Sensoy, B., 2013. The effects of stock lending on security prices: An
experiment. Journal of Finance 68, 1891-1936.
Karpoff, J., Lou, X., 2010. Short sellers and financial misconduct. Journal of Finance 65, 1879-1913.
Kolasinski, A., Reed, A., Ringgenberg, M., 2012. A multiple lender approach to understand supply and
search in the equity lending market, Journal of Finance, forthcoming.
Lamont, O., 2004. Go down fighting: Short sellers vs. firms. Working paper, Yale University.

27
Nagel, S., 2005. Short sales, institutional investors and the cross-section of stock returns, Journal of
Financial Economics 78, 277-309.
Prado, M., 2013. Future lending income and security value. Journal of Financial and Quantitative
Analysis, forthcoming.
Reuter, J., 2006. Are IPO allocations for sale: Evidence from mutual funds. Journal of Finance 61, 2289-
2324.
Rizova, S., 2012. Securities lending and mutual funds. Working paper, University of Chicago.
Senchank, A., Starks, L., 1993. Short-sale restrictions and market reaction to short interest
announcements. Journal of Financial and Quantitative Analysis 28, 177-194.

28
Table 1 Summary Statistics
This table presents mean, median, standard deviation, and number of observations of the fund and family variables. The sample consists of equity mutual funds with N-SAR filings and CRSP mutual funds data over the 1996–2008 period. Refer to Table A.2 in the Appendix for variable definitions.
Mean Median Standard Deviation Observations
Excess Return (%) 0.09 0.50 4.86 120,177
Four-Factor Alpha (%) -0.14 -0.14 1.87 120,177
Security Lending Allowed 0.85 1.00 0.35 120,177
Security Lending Used 0.42 0.00 0.49 120,177
Security Lending Income 0.01 0.00 0.04 99,798
Security Lending Collateral 0.03 0.00 0.07 96,502
Fund Short Interest (%) 2.23 1.22 2.61 120,177
Fund Institutional Ownership (%) 65.01 62.64 11.77 120,177
Fund Utilization (%) 3.10 2.01 2.99 120,177
Expense Ratio (%) 1.24 1.22 0.50 120,177
TNA ($ millions) 1,811 315 6,963 120,129
Net Flow (%) 0.38 -0.23 4.51 120,138
Turnover (%) 87.29 65.00 91.96 120,177
Active Share (%) 73.05 78.66 22.40 107,328
Performance Rank 1.99 2.00 1.33 120,108
Age 10.83 7.00 12.20 120,177
Family TNA ($ billions) 206,187 29,033 781,536 120,177
Average Family Performance Rank 2.00 2.00 0.72 120,168
Average Family Expense Ratio (%) 1.27 1.27 0.41 120,177
Investment Objective Herfindahl 0.33 0.20 0.29 120,177
Family Net Flow (%) 0.04 0.00 4.56 120,163
Average Family Active Share (%) 77.28 77.61 10.05 117,463
Index Funds in Family (% total) 6.39 0.00 12.45 120,177
Sudadvised Funds in Family (% total) 3.12 0.00 9.00 120,177
Broker Funds in Family (% total) 29.29 30.00 21.14 120,177
Restriction Index 0.53 0.56 0.15 120,177
Options-Futures Allowed 0.68 0.88 0.35 120,177
Affiliated Lending Agent 0.09 0.00 0.29 120,177
Lending Information 0.35 0.00 0.48 120,177

29
Table 2 Frequency of Security Lending by Mutual Funds
Panel A reports the number of active and index equity funds that are allowed and engage in security lending by year. The sample consists of equity mutual funds with N-SAR filings and CRSP mutual funds data over the 1996–2008 period. Panel B reports the transition probabilities for the security lending allowed and security lending used states. Refer to Table A.2 in the Appendix for variable definitions.
Panel A: Number of Funds
Active Funds Index Funds
Number Security Security Security Number Sec. Security Security
Year of Funds Lending Lending Lending of Funds Lending Lending Lending
Allowed Used Used (%) Allowed Used Used (%)
1996 48 38 7 15
1997 392 281 55 14 22 13 3 14
1998 519 389 99 19 27 20 9 33
1999 770 595 159 21 45 33 15 33
2000 965 764 234 24 65 54 26 40
2001 1,159 938 313 27 88 77 37 42
2002 1,271 1,072 424 33 112 100 48 43
2003 1,332 1,102 467 35 126 118 57 45
2004 1,365 1,140 518 38 120 113 58 48
2005 1,389 1,154 528 38 116 113 68 59
2006 1,396 1,174 558 40 113 110 66 58
2007 1,385 1,190 608 44 113 109 73 65
2008 1,334 1,152 577 43 106 100 71 67
Total 1,924 1,771 967 50 146 144 89 61
Panel B: Transition Probabilities (%)
Active Funds
Security Lending Allowed Security Lending Used
Not Yest Not Yest
Not-1 84% 16% Not-1 92% 8%
Yest-1 2% 98% Yest-1 10% 90%
Index Funds
Security Lending Allowed Security Lending Used
Not Yest Not Yest
Not-1 60% 40% Not-1 87% 13%
Yest-1 2% 98% Yest-1 6% 94%

30
Table 3 Fund Performance and Security Lending: Multivariate Regression
This table reports estimates of ordinary least squares and fixed effects regressions of the Carhart four-factor alphas (in percentage per month) on the security lending used dummy and lagged fund characteristics for active funds (Panel A) and index funds (Panel B). The sample consists of equity mutual funds with N-SAR filings and CRSP mutual funds data over the 1996–2008 period. Refer to Table A.2 in the Appendix for variable definitions. Robust t-statistics in parentheses are based on standard errors clustered by fund. ***, **, * denote that the coefficient is significant at the 1%, 5%, and 10% level.
Panel A: Active Funds
(1) (2) (3) (4) (5) (6) (7) (8)
Security Lending Used -
0.060*** -
0.057***-
0.041*** -0.040* -
0.058***-
0.054*** -
0.038*** -0.066**
(-4.48) (-4.34) (-3.26) (-1.65) (-3.91) (-3.74) (-2.79) (-2.47)
Fund Utilization -
0.010*** -0.008** 0.005 -0.010** -
0.010*** -0.009** 0.003 -0.011**
(-4.32) (-2.49) (1.25) (-2.39) (-4.19) (-2.48) (0.70) (-2.56) Expense Ratio -0.017 -0.016 -0.018 0.083 -0.015 -0.016 -0.014 0.138**
(-0.82) (-0.79) (-0.89) (1.48) (-0.70) (-0.72) (-0.62) (2.19)
ln(TNA) -0.010** -0.011**
-0.015***
-0.231*** -0.011** -0.012**
-0.016***
-0.219***
(-2.26) (-2.48) (-3.56) (-16.67) (-2.30) (-2.45) (-3.46) (-14.89) Net Flow 0.008*** 0.008*** 0.007*** 0.001 0.009*** 0.008*** 0.007*** 0.001
(5.29) (5.08) (4.98) (0.45) (5.27) (5.08) (4.77) (0.67)
Turnover -
0.057*** -
0.054***-
0.046*** 0.014 -
0.058***-
0.056*** -
0.048*** 0.015
(-5.22) (-4.76) (-4.31) (0.75) (-4.94) (-4.64) (-4.31) (0.73) ln(Family TNA) 0.004 0.002 0.004 0.015 0.007** 0.006* 0.007** 0.028**
(1.27) (0.85) (1.62) (1.13) (2.13) (1.73) (2.09) (2.17)
Broker Funds in Family -
0.001*** -
0.001***-
0.001*** -0.002** -
0.001***-
0.001*** -
0.002*** -0.002**
(-3.16) (-3.46) (-3.75) (-2.18) (-3.14) (-3.37) (-3.81) (-2.22)
Constant 0.036 0.009
(0.88) (0.21)
Style Fixed Effects No Yes Yes No No Yes Yes No Style Time Fixed Effects No No Yes No No No Yes No
Fund Fixed Effects No No No Yes No No No Yes
Security Lending Not
Allowed Included Yes Yes Yes Yes No No No No
Observations 111.484 111.484 111,484 111,484 94,437 94,437 94,437 94,437
R-squared 0.002 0.003 0.216 0.006 0.002 0.003 0.226 0.006
Number of Funds 1,701 1,701 1,701 1,701 1,580 1,580 1,580 1,580

31
Table 3: continued
Panel B: Index Funds
(1) (2) (3) (4) (5) (6) (7) (8)
Security Lending Used -0.014 -0.017 0.005 -0.046 -0.028 -0.029 0.001 -0.091
(-0.52) (-0.66) (0.21) (-0.85) (-1.08) (-1.29) (0.06) (-1.51)
Fund Utilization 0.002 0.006 0.010** 0.014*** 0.003 0.010** 0.014** 0.016***
(1.12) (1.66) (2.39) (2.78) (0.88) (2.47) (2.45) (2.72)
Expense Ratio -
0.128*** -
0.123***-
0.097*** -0.274 -
0.105***-
0.094*** -0.072** -0.179
(-3.81) (-3.93) (-3.93) (-1.38) (-2.96) (-2.80) (-2.31) (-0.87) ln(TNA) 0.006 0.005 -0.002 -0.059 0.003 -0.000 -0.007 -0.042
(0.83) (0.66) (-0.25) (-1.62) (0.36) (-0.04) (-0.85) (-1.53) Net Flow 0.005 0.005 0.009 0.003 0.004 0.004 0.006 0.003
(0.80) (0.75) (1.23) (0.56) (0.74) (0.67) (1.15) (0.63)
Turnover -0.008 0.017 -0.028 0.165*** -0.017 0.002
-0.047*** 0.129***
(-0.60) (0.75) (-1.47) (4.08) (-1.20) (0.09) (-3.29) (7.11)
ln(Family TNA) -0.019** -0.014 -0.011
-0.084*** -0.008 -0.001 -0.001
-0.088***
(-2.06) (-1.35) (-0.99) (-3.43) (-1.09) (-0.14) (-0.10) (-3.60) Broker Funds in Family 0.000 0.000 -0.000 -0.002 0.000 -0.000 -0.000 -0.002
(0.73) (0.07) (-0.86) (-0.87) (0.62) (-0.28) (-0.98) (-1.02)
Constant 0.158* 0.055
(1.78) (0.95)
Style Fixed Effects No Yes Yes No No Yes Yes No Style Time Fixed Effects No No Yes No No No Yes No
Fund Fixed Effects No No No Yes No No No Yes
Security Lending Not
Allowed Included Yes Yes Yes Yes No No No No
Observations 8,693 8,693 8,693 8,693 8,105 8,105 8,105 8,105
R-squared 0.004 0.008 0.639 0.008 0.003 0.008 0.670 0.006
Number of Funds 129 129 129 129 127 127 127 127
32
Table 4 Probit of Security Lending Used
This table reports estimates of probit regression of the fund decision to lend securities using lagged fund and family characteristics as explanatory variables. A control sample of funds is constructed using the fund in the same month and style with the closest propensity score to the treated fund. For active funds, style is determined by the fund’s membership in one of the Morningstar investment objective categories. For index funds, style is determined by the stated benchmark the index fund tracks. The sample consists of active and indexed equity mutual funds with N-SAR filings and CRSP mutual funds data over the 1996–2008 period. Regressions (1) and (2) are the active fund sample and regressions (3) and (4) are the index fund sample. Refer to Table A.2 in the Appendix for variable definitions. ***, **, * denote that the coefficient is significant at the 1%, 5%, and 10% level.
Active Funds Index Funds
(1) (2) (3) (4)
Fund Utilization 0.025*** 0.021** -0.023 -0.016
(3.24) (2.55) (-1.52) (-0.88)
Expense Ratio -0.034 -0.084 -0.080 -0.387
(-0.40) (-0.93) (-0.20) (-0.90)
ln(TNA) 0.050*** 0.103*** 0.227*** 0.233***
(2.77) (5.35) (3.45) (3.33)
Net Flow -0.016*** -0.014*** -0.022*** -0.022***
(-6.10) (-4.93) (-3.28) (-3.17)
Turnover -0.012 0.001 0.191* 0.195*
(-0.38) (0.04) (1.87) (1.80)
ln(Family TNA) 0.051*** 0.065*** 0.314*** 0.330***
(3.40) (3.80) (3.89) (3.88) Investment Objective Herfindahl -0.461*** -0.424*** 1.362** 1.156*
(-3.75) (-3.20) (2.03) (1.68)
Average Family Performance Rank -0.037*** -0.035** -0.094 -0.024
(-3.03) (-2.49) (-1.38) (-0.37) Index Funds in Family 0.781** 0.220 -2.032** -1.907*
(2.47) (0.66) (-2.11) (-1.91) Sudadvised Funds in Family 0.149 0.598* 1.721 1.567
(0.52) (1.81) (0.85) (0.75) Broker Funds in Family -0.733** -0.822** 3.821 4.474
(-2.43) (-2.40) (1.27) (1.45)
Average Family Expense Ratio -5.718 -7.810 -111.287*** -63.998
(-0.58) (-0.74) (-2.63) (-1.59)
Average Family Active Share -1.802*** -1.758*** 1.694* 1.428
(-6.44) (-5.93) (1.78) (1.40)
Security Lending Not
Allowed Included Yes No Yes No
Style Fixed Effects Yes Yes Yes Yes
Observations 109,350 92,820 8,733 8,074

33
Table 5 Fund Performance and Security Lending: Propensity-Score Matching
This table reports the comparison of fund performance and other variables between the treated (funds that lend equities), non-treated and control samples. The control sample of funds is constructed using the fund in the same month and style with the closest propensity score to the treated fund where the propensity scores are determined by the probit regressions (2) and (4) of Table 4 for active and index funds respectively. For active funds, style is determined by the fund’s membership in one of the Morningstar investment objective categories. For index funds, style is determined by the stated benchmark the index fund tracks. Panel A gives the results for active funds and Panel B gives the results for index funds. The differences are given for the variables used in the probit model of Table 4 and the difference in the Carhart four-factor alphas (in percentage per month) between the treated and control fund groups. The sample consists of active and index equity mutual funds with N-SAR filings and CRSP mutual funds data over the 1996–2008 period. Refer to Table A.2 in the Appendix for variable definitions. ***, **, * denote that the coefficient is significant at the 1%, 5%, and 10% level.
Panel A: Active Funds
Treated Non-Treated Difference Treated Control Difference
Four-Factor Alpha (%) -0.184 -0.128 -0.055*** -0.183 -0.145 -0.038*
Fund Utilization (%) 3.172 3.139 0.033 3.173 3.389 -0.216***
Expense Ratio (%) 1.240 1.375 -0.135*** 1.240 1.223 0.017***
ln(TNA) 6.148 5.418 0.730*** 6.148 6.089 0.059***
Net Flow (%) 0.021 0.547 -0.526*** 0.020 0.053 -0.033
Turnover (%) 87.648 95.090 -7.442*** 87.645 89.904 -2.259***
ln(Family TNA) 10.809 9.467 1.342*** 10.808 10.760 0.048*
Investment Objective Herfindahl 0.257 0.375 -0.118*** 0.258 0.249 0.008***
Average Family Performance Rank 1.985 2.002 -0.017*** 1.984 2.001 -0.016**
Index Funds in Family (% total) 6.599 4.025 2.574*** 6.593 5.943 0.651***
Sudadvised Funds in Family (% total) 2.566 2.742 -0.177*** 2.565 2.582 -0.017
Broker Funds in Family (% total) 2.843 5.998 -3.156*** 2.842 3.309 -0.467***
Average Family Expense Ratio (%) 1.235 1.366 -0.132*** 1.235 1.232 0.003
Average Family Active Share (%) 75.127 79.247 -4.120*** 75.136 75.686 -0.550***
Panel B: Index Funds
Treated Non-Treated Difference Treated Control Difference
Four-Factor Alpha (%) -0.075 -0.033 -0.041 -0.084 -0.102 0.018
Fund Utilization (%) 2.877 3.118 -0.242*** 2.393 2.285 0.109
Expense Ratio (%) 0.452 0.546 -0.094*** 0.450 0.661 -0.212***
ln(TNA) 7.016 5.300 1.716*** 7.003 5.707 1.295***
Net Flow (%) 0.608 1.183 -0.576*** 0.415 0.132 0.284
Turnover (%) 40.330 43.300 -2.970 20.184 39.558 -19.374***
ln(Family TNA) 11.866 9.720 2.146*** 11.613 10.898 0.715***
Investment Objective Herfindahl 0.203 0.224 -0.021*** 0.207 0.228 -0.021**
Average Family Performance Rank 2.035 1.998 0.037*** 2.021 1.892 0.129***
Index Funds in Family (% total) 24.779 24.522 0.257 21.450 17.041 4.409***
Sudadvised Funds in Family (% total) 1.665 2.985 -1.320*** 2.036 4.124 -2.088***
Broker Funds in Family (% total) 1.144 1.072 0.072 1.387 1.517 -0.130***
Average Family Expense Ratio (%) 0.963 1.075 -0.112*** 0.996 1.242 -0.246***
Average Family Active Share (%) 72.857 71.027 1.830*** 72.568 75.871 -3.303***
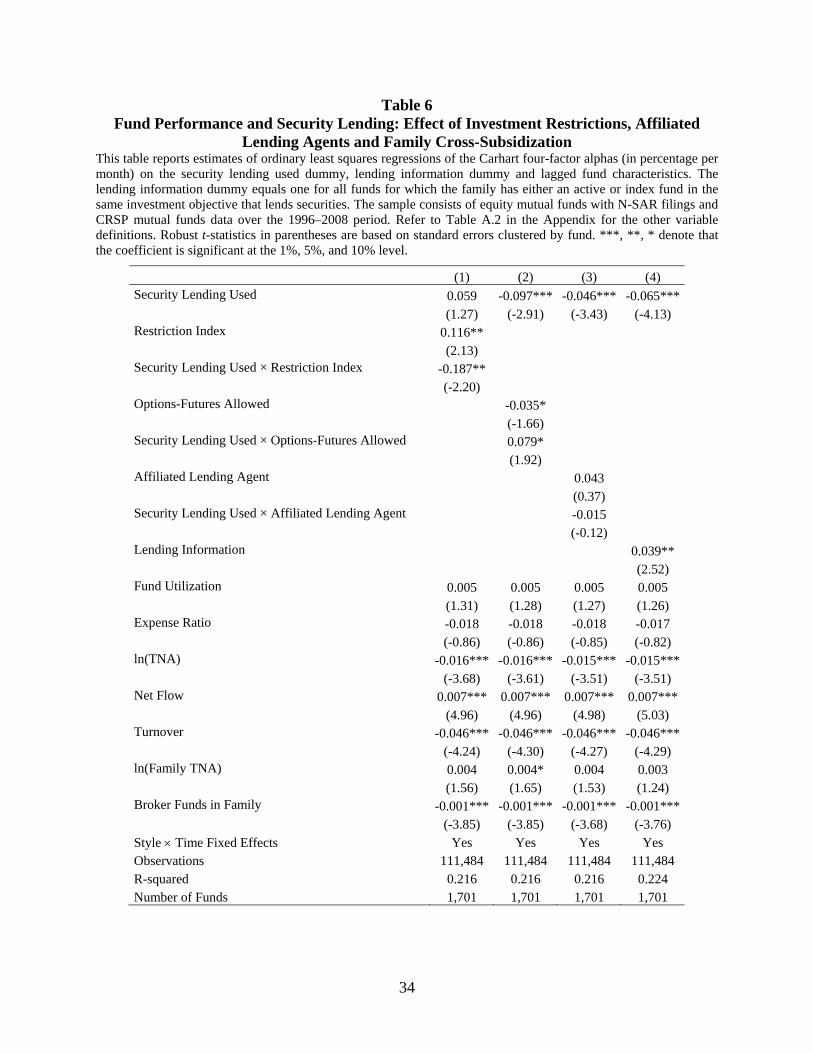
34
Table 6 Fund Performance and Security Lending: Effect of Investment Restrictions, Affiliated
Lending Agents and Family Cross-Subsidization This table reports estimates of ordinary least squares regressions of the Carhart four-factor alphas (in percentage per month) on the security lending used dummy, lending information dummy and lagged fund characteristics. The lending information dummy equals one for all funds for which the family has either an active or index fund in the same investment objective that lends securities. The sample consists of equity mutual funds with N-SAR filings and CRSP mutual funds data over the 1996–2008 period. Refer to Table A.2 in the Appendix for the other variable definitions. Robust t-statistics in parentheses are based on standard errors clustered by fund. ***, **, * denote that the coefficient is significant at the 1%, 5%, and 10% level.
(1) (2) (3) (4) Security Lending Used 0.059 -0.097*** -0.046*** -0.065***
(1.27) (-2.91) (-3.43) (-4.13) Restriction Index 0.116**
(2.13) Security Lending Used × Restriction Index -0.187**
(-2.20) Options-Futures Allowed -0.035*
(-1.66) Security Lending Used × Options-Futures Allowed 0.079*
(1.92) Affiliated Lending Agent 0.043
(0.37) Security Lending Used × Affiliated Lending Agent -0.015
(-0.12) Lending Information 0.039**
(2.52) Fund Utilization 0.005 0.005 0.005 0.005
(1.31) (1.28) (1.27) (1.26) Expense Ratio -0.018 -0.018 -0.018 -0.017
(-0.86) (-0.86) (-0.85) (-0.82) ln(TNA) -0.016*** -0.016*** -0.015*** -0.015***
(-3.68) (-3.61) (-3.51) (-3.51) Net Flow 0.007*** 0.007*** 0.007*** 0.007***
(4.96) (4.96) (4.98) (5.03) Turnover -0.046*** -0.046*** -0.046*** -0.046***
(-4.24) (-4.30) (-4.27) (-4.29) ln(Family TNA) 0.004 0.004* 0.004 0.003
(1.56) (1.65) (1.53) (1.24) Broker Funds in Family -0.001*** -0.001*** -0.001*** -0.001***
(-3.85) (-3.85) (-3.68) (-3.76) Style Time Fixed Effects Yes Yes Yes Yes Observations 111,484 111,484 111,484 111,484 R-squared 0.216 0.216 0.216 0.224 Number of Funds 1,701 1,701 1,701 1,701

35
Table 7 Security Lending and a Manager Response to Borrowing Demand
This table reports an analysis of a sample of 139 active fund managers who manage two or more funds at the same time in which a fund(s) is allowed to lend securities and the other fund(s) is prohibited. Position change is the quarterly change in the number of shares held by the fund (as fraction of shares outstanding) around the period in which the stock becomes hard-to-borrow as proxied by below median institutional ownership (limited supply) and top quartile short interest (excess shorting demand). The table also report mean fund characteristics of the two group of funds managed by the same manager. Panel A shows the results for all manager-stock-fund pairs. Panels B and C report statistics for the subsamples where the funds that are allowed to lend do not lend (Panel B) and do lend (Panel C). The sample consists of active equity mutual funds with N-SAR filings and CRSP mutual funds data over the 1996–2008 period. Refer to Table A.2 in the Appendix for variable definitions. ***, **, * denote that the coefficient is significant at the 1%, 5%, and 10% level.
Panel A: Security Lending Allowed vs. Security Lending Not Allowed
Security Lending
Allowed Security Lending
Not Allowed Difference
Position Change (% shares outstanding) -0.054 -0.109 0.055***
Expense Ratio (%) 1.04 1.16 -0.13***
TNA ($ millions) 2,212 6,719 -4,507***
Age (years) 14.02 13.88 0.15
Net Flow (%) 4.66 0.50 4.16***
Subadvised Fund (% total) 42.53 46.70 -4.16**
Panel B: Security Lending Allowed and Not Used vs. Security Lending Not Allowed
Security Lending
Allowed and Not UsedSecurity Lending
Not Allowed Difference
Position Change (% shares outstanding) -0.045 -0.028 -0.017
Expense Ratio (%) 1.19 1.22 -0.05***
TNA ($ millions) 1,126 3,752 -2,626***
Age (years) 11.57 22.37 -10.80***
Net Flow (%) 16.04 0.94 15.10
Subadvised Fund (% total) 36.47 39.41 -2.94
Panel C: Security Lending Allowed and Used vs. Security Lending Not Allowed
Security Lending
Allowed and Used Security Lending
Not Allowed Difference
Position Change (% shares outstanding) -0.058 -0.145 0.087***
Expense Ratio (%) 0.97 1.14 -0.165***
TNA ($ millions) 2,694 8,038 5,344***
Age (years) 15.11 10.10 5.01***
Net Flow (%) -0.29 0.30 -0.60***
Subadvised Fund (% total) 45.23 49.93 -4.71**

36
Table 8 Family Security Lending Information and a Manager Response to Borrowing Demand
This table reports the comparison between non-lending (treated) funds that have information about stock holdings that go on special through other funds in the family that lend and own the stock and non-lending funds (non-treated) that hold the same stock but do not have access to the information through the family. The control sample of funds is constructed using the fund with the closest propensity score to the treated fund with scores given by the probit regression in Panel A. Position change is the quarterly change in the number of shares held by the fund (as fraction of shares outstanding) around the period in which the stock becomes hard-to-borrow as proxied by below median institutional ownership (limited supply) and top quartile short interest (excess shorting demand). Panel B reports the comparison for active funds and Panel B reports the comparison for index funds. The sample consists of equity mutual funds with N-SAR filings and CRSP mutual funds data over the 1996–2008 period. Refer to Table A.2 in the Appendix for variable definitions. ***, **, * denote that the coefficient is significant at the 1%, 5%, and 10% level.
Panel A: Probit of Lending Information
Active Funds Index Funds
(1) (2)
Fund Utilization 0.003*** 0.012***
(2.67) (7.07)
Expense Ratio -0.088 0.239
(-1.14) (0.86)
ln(TNA) -0.068*** 0.333***
(-3.81) (8.38)
Net Flow 0.718 5.121*
(1.46) (1.91)
Turnover -0.111*** -0.050
(-2.79) (-0.42)
ln(Family TNA) 0.122*** -0.037
(5.59) (-1.37)
Ln(Age) 0.001*** 0.001
(3.25) (0.77)
Four-Factor Alpha 0.000 -0.013***
(0.24) (-3.55)
Sudadvised Funds in Family -0.064 0.360**
(-0.90) (2.45)
Broker Funds in Family -0.017*** -0.020***
(-5.69) (-4.32)
Observations 4,505 1,847
Pseudo R-squared 0.04 0.16
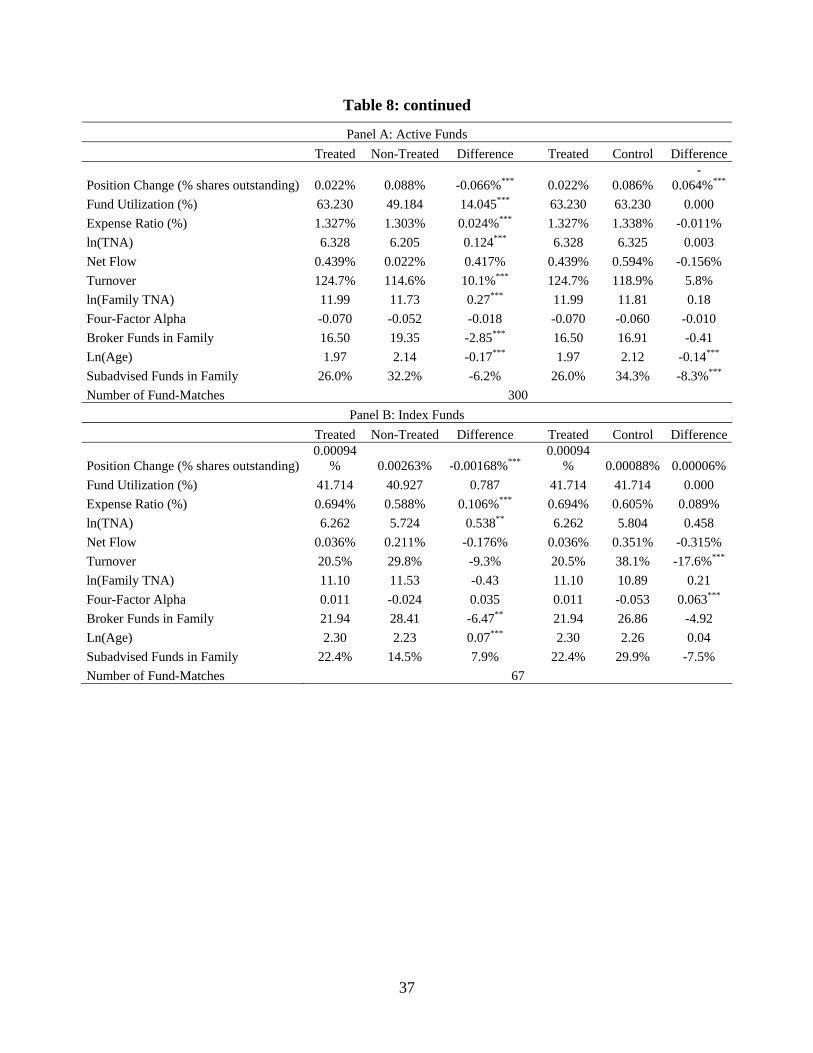
37
Table 8: continued
Panel A: Active Funds
Treated Non-Treated Difference Treated Control Difference
Position Change (% shares outstanding) 0.022% 0.088% -0.066%*** 0.022% 0.086% -
0.064%***
Fund Utilization (%) 63.230 49.184 14.045*** 63.230 63.230 0.000
Expense Ratio (%) 1.327% 1.303% 0.024%*** 1.327% 1.338% -0.011%
ln(TNA) 6.328 6.205 0.124*** 6.328 6.325 0.003
Net Flow 0.439% 0.022% 0.417% 0.439% 0.594% -0.156%
Turnover 124.7% 114.6% 10.1%*** 124.7% 118.9% 5.8%
ln(Family TNA) 11.99 11.73 0.27*** 11.99 11.81 0.18
Four-Factor Alpha -0.070 -0.052 -0.018 -0.070 -0.060 -0.010
Broker Funds in Family 16.50 19.35 -2.85*** 16.50 16.91 -0.41
Ln(Age) 1.97 2.14 -0.17*** 1.97 2.12 -0.14***
Subadvised Funds in Family 26.0% 32.2% -6.2% 26.0% 34.3% -8.3%***
Number of Fund-Matches 300
Panel B: Index Funds
Treated Non-Treated Difference Treated Control Difference
Position Change (% shares outstanding) 0.00094
% 0.00263% -0.00168%***0.00094
% 0.00088% 0.00006%
Fund Utilization (%) 41.714 40.927 0.787 41.714 41.714 0.000
Expense Ratio (%) 0.694% 0.588% 0.106%*** 0.694% 0.605% 0.089%
ln(TNA) 6.262 5.724 0.538** 6.262 5.804 0.458
Net Flow 0.036% 0.211% -0.176% 0.036% 0.351% -0.315%
Turnover 20.5% 29.8% -9.3% 20.5% 38.1% -17.6%***
ln(Family TNA) 11.10 11.53 -0.43 11.10 10.89 0.21
Four-Factor Alpha 0.011 -0.024 0.035 0.011 -0.053 0.063***
Broker Funds in Family 21.94 28.41 -6.47** 21.94 26.86 -4.92
Ln(Age) 2.30 2.23 0.07*** 2.30 2.26 0.04
Subadvised Funds in Family 22.4% 14.5% 7.9% 22.4% 29.9% -7.5%
Number of Fund-Matches 67
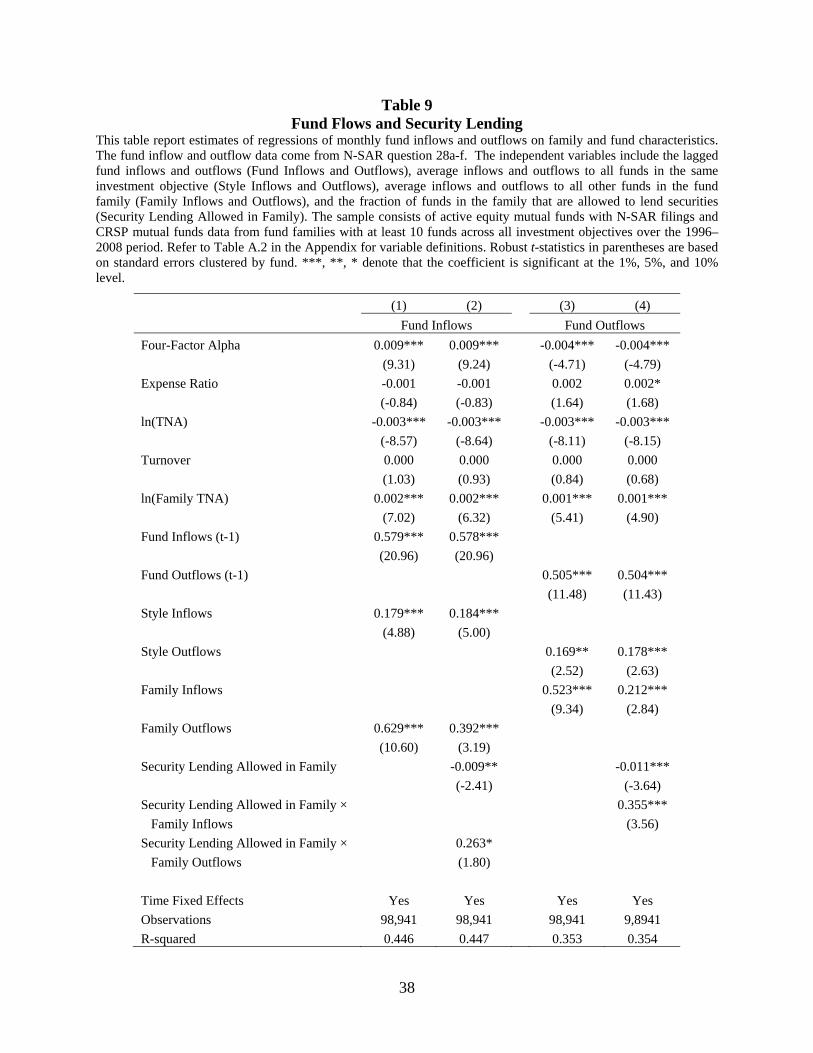
38
Table 9 Fund Flows and Security Lending
This table report estimates of regressions of monthly fund inflows and outflows on family and fund characteristics. The fund inflow and outflow data come from N-SAR question 28a-f. The independent variables include the lagged fund inflows and outflows (Fund Inflows and Outflows), average inflows and outflows to all funds in the same investment objective (Style Inflows and Outflows), average inflows and outflows to all other funds in the fund family (Family Inflows and Outflows), and the fraction of funds in the family that are allowed to lend securities (Security Lending Allowed in Family). The sample consists of active equity mutual funds with N-SAR filings and CRSP mutual funds data from fund families with at least 10 funds across all investment objectives over the 1996–2008 period. Refer to Table A.2 in the Appendix for variable definitions. Robust t-statistics in parentheses are based on standard errors clustered by fund. ***, **, * denote that the coefficient is significant at the 1%, 5%, and 10% level.
(1) (2) (3) (4)
Fund Inflows Fund Outflows
Four-Factor Alpha 0.009*** 0.009*** -0.004*** -0.004***
(9.31) (9.24) (-4.71) (-4.79)
Expense Ratio -0.001 -0.001 0.002 0.002*
(-0.84) (-0.83) (1.64) (1.68)
ln(TNA) -0.003*** -0.003*** -0.003*** -0.003***
(-8.57) (-8.64) (-8.11) (-8.15)
Turnover 0.000 0.000 0.000 0.000
(1.03) (0.93) (0.84) (0.68)
ln(Family TNA) 0.002*** 0.002*** 0.001*** 0.001***
(7.02) (6.32) (5.41) (4.90)
Fund Inflows (t-1) 0.579*** 0.578***
(20.96) (20.96)
Fund Outflows (t-1) 0.505*** 0.504***
(11.48) (11.43)
Style Inflows 0.179*** 0.184***
(4.88) (5.00)
Style Outflows 0.169** 0.178***
(2.52) (2.63)
Family Inflows 0.523*** 0.212***
(9.34) (2.84)
Family Outflows 0.629*** 0.392***
(10.60) (3.19)
Security Lending Allowed in Family -0.009** -0.011***
(-2.41) (-3.64)
Security Lending Allowed in Family × 0.355***
Family Inflows (3.56)
Security Lending Allowed in Family × 0.263*
Family Outflows (1.80)
Time Fixed Effects Yes Yes Yes Yes
Observations 98,941 98,941 98,941 9,8941
R-squared 0.446 0.447 0.353 0.354

39
Figure 1 Security Lending Use by Year
This figure reports the number of active funds (Panel A) and index funds (Panel B) that lend their stock holdings and that do not lend their stock holdings by year. The sample consists of equity mutual funds with N-SAR filings and CRSP mutual funds data over the 1996–2008 period.
Panel A: Active Funds
Panel B: Index Funds
0
100
200
300
400
500
600
700
800
900
1,000
1996 1997 1998 1999 2000 2001 2002 2003 2004 2005 2006 2007 2008
No Security Lending Used Security Lending Used
0
10
20
30
40
50
60
70
80
1996 1997 1998 1999 2000 2001 2002 2003 2004 2005 2006 2007 2008
No Security Lending Used Security Lending Used

40
Table A.1 Variable Definitions
Variable Definition Excess Return Net fund return, in percentage per month, in excess of the U.S. T-bill rate.
Four-Factor Alpha Carhart four-factor alpha, in percentage per month, with factor loadings estimated using 36-month of past fund return data.
Security Lending Allowed Dummy variable that equals one if a fund is allowed to lend shares and zero otherwise (N-SAR form question 70N).
Security Lending Used Dummy variable that equals one if a fund lends out shares and zero otherwise (N-SAR form question 70N).
Security Lending Income Security lending income divided by total net assets (NCSR filings).
Security Lending Collateral Collateral portfolio value divided by total net assets (NCSR filings).
Fund Short Interest Value-weighted average short interest of fund holdings.
Fund Institutional Ownership Value-weighted average institutional ownership, as a fraction of market capitalization, of fund holdings.
Fund Utilization Fund short interest divided by fund institutional ownership.
Expense Ratio Fund fees and operating expenses, which include 12b-1 fees, as a fraction of total net assets.
TNA Fund’s total net assets in $ millions.
Net Flow Percentage growth in total net assets, net of internal growth, assuming reinvestment of dividends and distributions.
Turnover Ratio of aggregated sales or aggregated purchases of securities divided by the average 12-month total net assets of the fund.
Active Share Active share measure of Cremers and Petajisto (2009).
Performance Rank Performance rank quintile within investment style using 36-month of past fund returns.
Age Current date minus the first offer date.
Family TNA Sum of the total net assets of management company in $ millions.
Average Family Performance Rank Average of the performance rank of funds in the fund family.
Average Family Expense Ratio Average expense ratio of funds in the fund family.
Investment Objective Herfindahl Herfindahl of the investment objective of funds in the fund family.
Family Net Flow Average net flow of funds in the fund family.
Average Family Active Share Average active share of funds in the fund family.
Index Funds in Family Percentage of index funds in the fund family.
Subadvised in Family Percentage of subadvised funds in the fund family.
Broker Funds in Family Percentage of funds sold through brokers as measured by the presence of a front load, rear load or 12b1 above 0.25% in the fund family.
Restriction Index Average of investment restrictions dummy variables aggregated into three categories: restrictions to use leverage (borrowing of money, margin purchases, short selling), restrictions to use derivatives (writing or investing in options on equities, writing or investing in stock index futures), and restrictions to invest in illiquid assets.

41
Options-Futures Allowed Average of dummy variables that indicate whether funds are allowed to use of equity options, debt options, index option, interest rate futures, stock futures, option futures, option index futures and commodity futures.
Affiliated Lending Agent Dummy variable that equals one if a fund uses an affiliated lending agent.
Lending information Dummy variable that equals one if a fund does not lend securities and there is at least one active or index fund in the same family and investment objective that lends securities.

1
Internet Appendix to “Equity Lending, Investment Restrictions, and Fund
Performance”
Richard Evans Darden School of Business - University of Virginia
Miguel A. Ferreira Nova School of Business and Economics
Melissa Porras Prado Nova School of Business and Economics
This Version: September 2014
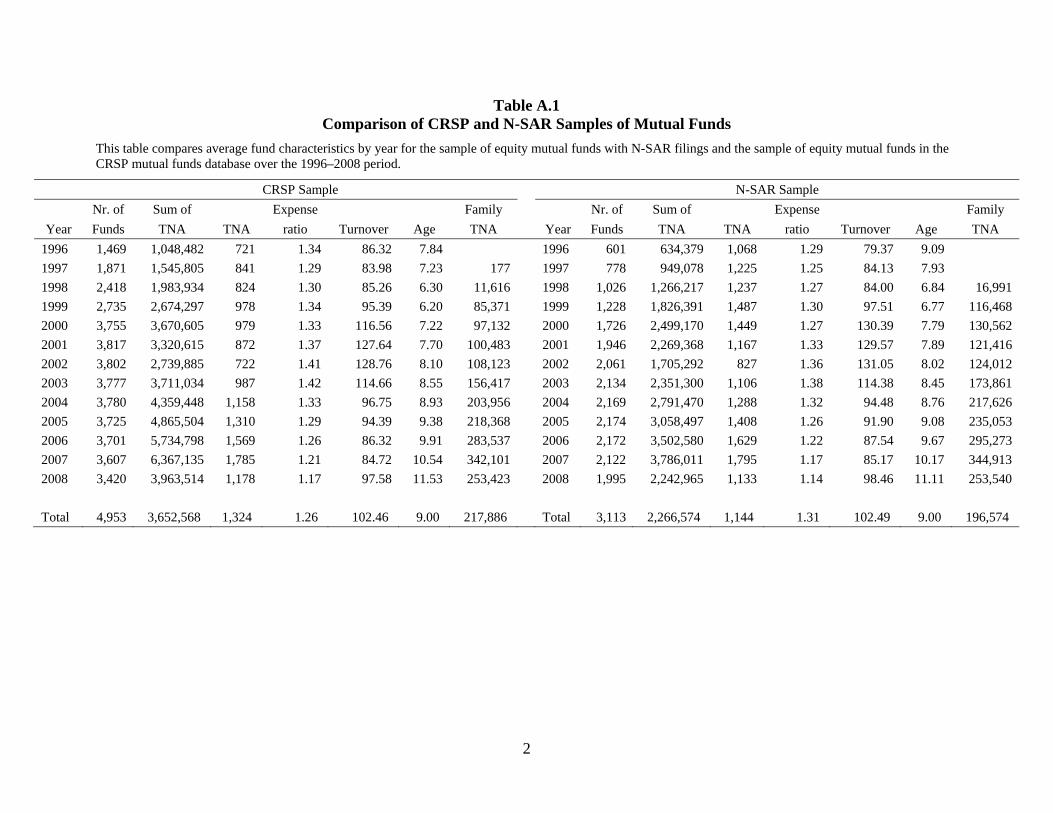
2
Table A.1 Comparison of CRSP and N-SAR Samples of Mutual Funds
This table compares average fund characteristics by year for the sample of equity mutual funds with N-SAR filings and the sample of equity mutual funds in the CRSP mutual funds database over the 1996–2008 period.
CRSP Sample N-SAR Sample
Nr. of Sum of Expense Family Nr. of Sum of Expense Family
Year Funds TNA TNA ratio Turnover Age TNA Year Funds TNA TNA ratio Turnover Age TNA
1996 1,469 1,048,482 721 1.34 86.32 7.84 1996 601 634,379 1,068 1.29 79.37 9.09
1997 1,871 1,545,805 841 1.29 83.98 7.23 177 1997 778 949,078 1,225 1.25 84.13 7.93
1998 2,418 1,983,934 824 1.30 85.26 6.30 11,616 1998 1,026 1,266,217 1,237 1.27 84.00 6.84 16,991
1999 2,735 2,674,297 978 1.34 95.39 6.20 85,371 1999 1,228 1,826,391 1,487 1.30 97.51 6.77 116,468
2000 3,755 3,670,605 979 1.33 116.56 7.22 97,132 2000 1,726 2,499,170 1,449 1.27 130.39 7.79 130,562
2001 3,817 3,320,615 872 1.37 127.64 7.70 100,483 2001 1,946 2,269,368 1,167 1.33 129.57 7.89 121,416
2002 3,802 2,739,885 722 1.41 128.76 8.10 108,123 2002 2,061 1,705,292 827 1.36 131.05 8.02 124,012
2003 3,777 3,711,034 987 1.42 114.66 8.55 156,417 2003 2,134 2,351,300 1,106 1.38 114.38 8.45 173,861
2004 3,780 4,359,448 1,158 1.33 96.75 8.93 203,956 2004 2,169 2,791,470 1,288 1.32 94.48 8.76 217,626
2005 3,725 4,865,504 1,310 1.29 94.39 9.38 218,368 2005 2,174 3,058,497 1,408 1.26 91.90 9.08 235,053
2006 3,701 5,734,798 1,569 1.26 86.32 9.91 283,537 2006 2,172 3,502,580 1,629 1.22 87.54 9.67 295,273
2007 3,607 6,367,135 1,785 1.21 84.72 10.54 342,101 2007 2,122 3,786,011 1,795 1.17 85.17 10.17 344,913
2008 3,420 3,963,514 1,178 1.17 97.58 11.53 253,423 2008 1,995 2,242,965 1,133 1.14 98.46 11.11 253,540
Total 4,953 3,652,568 1,324 1.26 102.46 9.00 217,886 Total 3,113 2,266,574 1,144 1.31 102.49 9.00 196,574
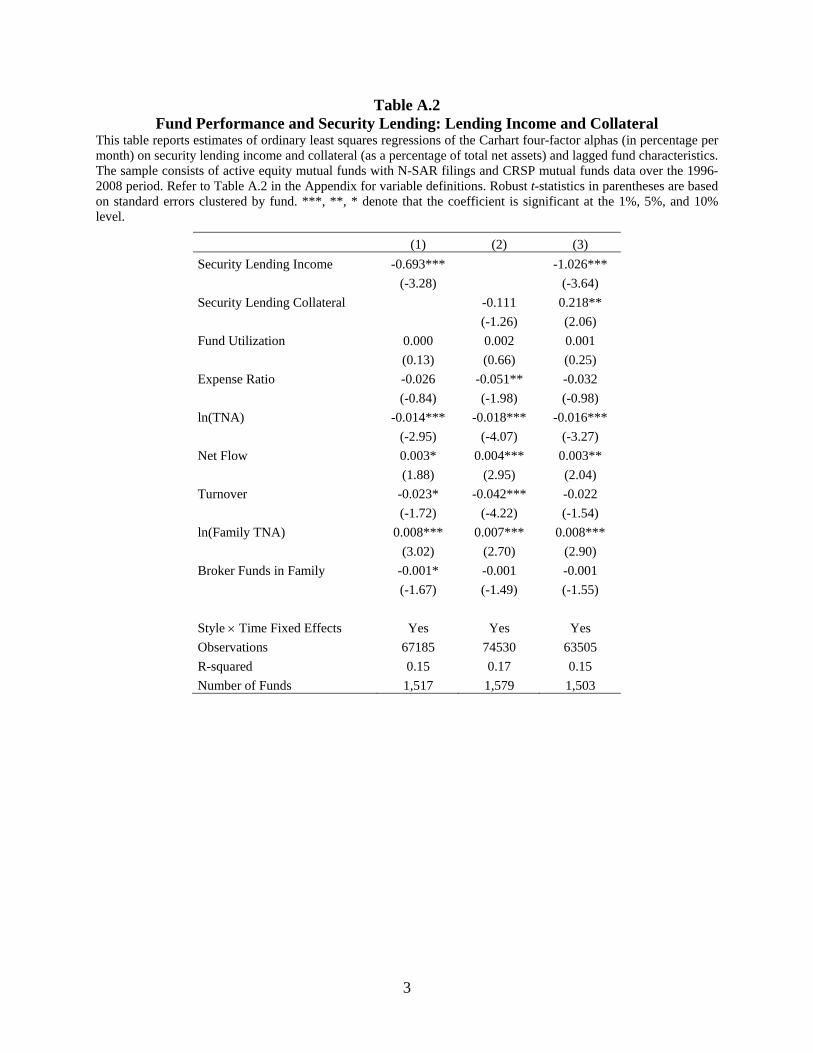
3
Table A.2 Fund Performance and Security Lending: Lending Income and Collateral
This table reports estimates of ordinary least squares regressions of the Carhart four-factor alphas (in percentage per month) on security lending income and collateral (as a percentage of total net assets) and lagged fund characteristics. The sample consists of active equity mutual funds with N-SAR filings and CRSP mutual funds data over the 1996-2008 period. Refer to Table A.2 in the Appendix for variable definitions. Robust t-statistics in parentheses are based on standard errors clustered by fund. ***, **, * denote that the coefficient is significant at the 1%, 5%, and 10% level.
(1) (2) (3)
Security Lending Income -0.693*** -1.026***
(-3.28) (-3.64)
Security Lending Collateral -0.111 0.218**
(-1.26) (2.06)
Fund Utilization 0.000 0.002 0.001
(0.13) (0.66) (0.25)
Expense Ratio -0.026 -0.051** -0.032
(-0.84) (-1.98) (-0.98)
ln(TNA) -0.014*** -0.018*** -0.016***
(-2.95) (-4.07) (-3.27)
Net Flow 0.003* 0.004*** 0.003**
(1.88) (2.95) (2.04)
Turnover -0.023* -0.042*** -0.022
(-1.72) (-4.22) (-1.54)
ln(Family TNA) 0.008*** 0.007*** 0.008***
(3.02) (2.70) (2.90)
Broker Funds in Family -0.001* -0.001 -0.001
(-1.67) (-1.49) (-1.55)
Style Time Fixed Effects Yes Yes Yes
Observations 67185 74530 63505
R-squared 0.15 0.17 0.15
Number of Funds 1,517 1,579 1,503