equivalence of digital tests · 2020-02-22 · equivalence of digital tests 9 non-equivalence...
TRANSCRIPT
EQUIVALENCE OF DIGITAL TESTS
1
Raw-Score Equivalence of Computer-Assisted and
Paper Versions of WISC®–V
Mark Daniel and Dustin Wahlstrom
Pearson
Author Note
Mark Daniel, Clinical Assessment, Pearson; Dustin Wahlstrom, Clinical Assessment, Pearson.
The authors are salaried employees of Pearson and have no financial interest in Q-interactive.
EQUIVALENCE OF DIGITAL TESTS
2
Correspondence concerning this article should be addressed to Mark Daniel, Pearson, 5601
Green Valley Drive, Bloomington, MN 55437. E-mail: [email protected]
EQUIVALENCE OF DIGITAL TESTS
3
Abstract
The adaptation of individually administered psychological tests from paper to app-based
administration formats can present unique threats to the construct and raw score equivalence of
the paper and digital formats. We discuss these potential threats and describe a study evaluating
the equivalence of paper and digital versions of the Wechsler Intelligence Scale for Children®,
fifth edition (WISC–V), which has been adapted to an app-based testing platform called Q-
interactive. The present study (N = 350) used an equivalent groups design to assess the raw score
equivalence of 18 WISC–V subtests that were designed with the intent of minimizing format
effect. Effect sizes in standard-deviation units were small, ranging from –0.20 to 0.20 (mean
absolute value = 0.09), and format effects were unrelated to ability level, age, sex, or parent
education. These results suggest that when tests are designed or adapted with digital-paper
equivalence as a goal, digital–paper raw score equivalence can be achieved across a variety of
construct domains.
Keywords: computer-based testing, equivalence
EQUIVALENCE OF DIGITAL TESTS
4
Raw-Score Equivalence of Computer-Assisted and Paper Versions of WISC®–V
Although slower to embrace technology than many other fields, psychology is
increasingly incorporating app- and computer-based assessment tools (Rabin et al., 2014). One
area of assessment practice that has remained largely non-digital is “individual” (one-on-one)
psychological assessment. Individual assessment has long been considered advantageous because
it lets the examiner see first-hand how the examinee functions; it lets the examinee perform in a
natural way with minimal response demands (e.g., speaking rather than writing; manipulating
physical materials); and it often lets the examiner adjust the administration (e.g., through
prompting) to obtain the best demonstration of the examinee’s abilities.
An app-based software platform designed specifically for individual assessment, Q-
interactive®, became available in 2013 and now supports a large and growing number of tests
used in clinical and school psychology, neuropsychology, speech-language pathology, and
special education including the Wechsler assessments of intelligence, memory, and achievement.
The goal of Q-interactive is to assist, not replace, the examiner, and, in fact, the Q-interactive
app heavily involves the examiner during assessment. The system uses two Bluetooth®-
connected Apple iPads®, one for the examinee and the other for the examiner. The examiner’s
device serves the functions of the paper manual and record form by presenting administration
procedures, a timer, and interfaces for capturing and scoring responses. On tests with visual
stimuli the examiner’s device sends those images to the examinee’s device, which functions as a
digital stimulus book that, on some subtests, can record examinee touches and send them to the
examiner’s device to be scored automatically (subject to the examiner’s review). Other
enhancements relative to paper-based administration are audio recording of oral responses for
EQUIVALENCE OF DIGITAL TESTS
5
later review; item-specific guidance to the examiner on prompting, querying, and scoring;
signaling when a discontinue or reversal rule is met; and automatic computation of raw and
derived scores.
When digital tests are adaptations of paper tests, as is the case for most tests on
Q-interactive, publishers are obligated to show whether the norms and other psychometric
information based on the original paper versions are applicable to the digital versions (AERA,
APA, & NCME, 2014; International Test Commission, 2005). (Here, “paper” is used broadly to
refer to non-digital formats, including oral stimuli and responses or manipulating physical
materials, such as the blocks used in block design tests). Examiners may have invested
significant time in learning to interpret the scores from particular tests based on their own
experience and their study of the research base, so there is value in preserving the meaning of
test scores. Carefully developed norms also represent a significant investment that is worth
retaining if possible.
There are two facets to the equivalence of different versions of a test. One is construct
equivalence, that is, whether they measure the same thing (Van de Vijver & Poortinga, 2005).
Are they equally strong indicators of the focal construct and equally affected (or unaffected) by
secondary or extraneous constructs? Paper and digital versions of a test can have construct
equivalence even if they produce different distributions of raw scores. For example, the optimal
digital version might use different methods of stimulus presentation, administration, or scoring to
capitalize on the capabilities of digital devices, thus changing the raw scores, but (it is hoped)
preserving the construct.
EQUIVALENCE OF DIGITAL TESTS
6
The other form of equivalence is raw score or measurement unit equivalence, that is,
whether paper and digital versions yield the same distribution of raw scores (Van de Vijver &
Tanzer, 2004). This kind of equivalence does not necessarily imply construct equivalence, but as
a practical matter, it is unlikely that one can create a digital version that 1) closely replicates the
stimulus and response processes of the paper version and 2) generates the same distribution of
raw scores, without measuring the same construct. When an adaptation adheres closely to the
original in the response demands on examiners and examinees, it is reasonable to consider raw-
score equivalence to be evidence in support of construct equivalence.
Research Relevant to Equivalence of Individually Administered Tests
There is a large literature evaluating both the raw score and construct equivalence of
group- and self-administered tests typically given in employment and educational settings.
However, little research has been done on the narrower topic of digital versions of individually
administered tests, and much of it dates from the 1980s and 1990s. In the following review, tests
are identified as self-administered or individually administered where applicable, but the
distinction is not always clear-cut since some tests that are often given in one-on-one sessions are
nevertheless essentially self-administered because the examiner has little or no involvement.
Research on paper–digital equivalence of cognitive tests has tended to find no difference
between digital and paper versions. A quarter century ago, Mead and Drasgow’s (1993) meta-
analysis of 159 studies of timed power tests of cognitive ability found, on average, slightly lower
scores on digital versions (effect size –0.03). These authors also concluded that digital and paper
versions of timed power tests measure the same construct, with an average disattenuated
correlation of .97. Tseng, Tiplady, Macleod, and Wright (1998) adapted self-administered tests
EQUIVALENCE OF DIGITAL TESTS
7
of visual searching, verbal memory, and sentence verification to both the computer and Personal
Digital Assistants (PDA), and found no differences between the mean scores on each. Likewise,
Neuman and Baydoun (1998) observed no format effects on simple speeded clerical tests.
Similarly, two studies of the Tower of Hanoi test (Noyes & Garland, 2003; Williams & Noyes,
2007) found no difference between digital and paper (i.e., physical) versions in the number of
moves required to solve the puzzle. Stevenson (2011) compared digital and paper versions of a
pictorial analogies test where young children either manipulated images on screen or moved
physical puzzle pieces, and found no difference in performance.
However, some research has reported format differences, in both directions. Van de
Vijver and Harsveld (1994) found that among the seven subtests in a self-administered cognitive
test battery, digital scores were higher on two measures (both perceptual-speed tests), lower on
three, and the same on two. Results for a computerized adaptation of Raven’s® Standard
Progressive Matrices were mixed: an early study suggested lower scores on computer (Kubinger,
Formann, & Farkas, 1991), but later studies provided evidence for equivalence in both English
(Williams & McCord, 2006) and Spanish (Arce-Ferrer & Guzmán, 2010) versions. The
individually administered version of the Wisconsin Card Sorting Test (WCST) that uses physical
materials was adapted to a self-administered digital version, and four of five studies (summarized
by Steinmetz, Brunner, Loarer, & Houssemand, 2010) found the number correct to be higher on
the digital administration, with an overall average effect size of 0.24 standard deviation.
There is evidence that digital adaptation affects speeded and unspeeded tests differently.
The meta-analysis by Mead and Drasgow (1993) showed that digital and paper versions of
speeded tests often did not measure the same construct (average disattenuated correlation of .72),
EQUIVALENCE OF DIGITAL TESTS
8
and their data (analyzed by Van de Vijver and Harsveld, 1994) indicated lower scores on the
digital versions of speeded tests (average effect size of –0.07). In their own study of seven
cognitive tests, Van de Vijver and Harsveld (1994) reported that examinees worked faster on the
digital versions of five of them, and that digitization affected the construct validity of the
cognitively simpler speeded tests more than the more cognitively complex tests. Tseng et al.
(1998), on the other hand, found slower performance on the digital version of a visual search
task. Digital performance may be less accurate, as was the case on all seven tests studied by Van
de Vijver and Harsveld (1994). However, as noted above, Neuman and Baydoun (1998) found
no paper–digital differences in scores on simple timed clerical tasks.
In general, the research on paper–digital differences on cognitive-ability tests, whether
self-administered or individually administered, has yielded variable findings. When differences
have been found, the hypothesized causes have often been idiosyncratic to the particular test or
method of adaptation, such as the lengthier presentation of stimuli in the digital version of
Vocabulary (Van de Vijver & Harsveld, 1994) or the difficulty of administering the paper
version correctly (WCST; Tien et al., 1996). With respect to speeded tests, there has been
speculation about more general causes, such as perceived demand for speed when using a
computer (Van de Vijvin & Harsveld, 1994). However, for unspeeded tests we did not find much
research on general issues such as the potential effect of viewing a pictorial stimulus on a screen
rather than on paper. Gathering information on specific sources of threats to equivalence would
help build a knowledge base that could inform the design of computer-based tests intended for
use in individualized assessment.
Threats to Equivalence
EQUIVALENCE OF DIGITAL TESTS
9
Non-equivalence between digital and paper versions of a test can be introduced by
diverse sources. For both self-administered tests (e.g., the MMPI® or Raven’s® matrices) and
individually administered tests (e.g., WISC®–V), it is important to recognize that any difference
in the overall assessment procedure, even one that is unrelated to the examinee’s item
performance, could be a threat to paper–digital equivalence if it affects the examinee’s ultimate
score.
The most obvious kinds of threat are differences in how the examinee interacts with test
content, i.e., how stimuli are presented and how the examinee responds. These examinee-based
equivalence threats are the most often studied because they apply to the self-administered tests
that have been the subject of most research. Examples include differences between screen and
print in the size or clarity of visual stimuli, hearing instructions from the computer rather than
from the examiner, responding on a keyboard or with a mouse rather than a pencil, or touching
or dragging on-screen stimuli rather than pointing or speaking.
Even for self-administered tests there are other, less obvious potential influences of the
digital format on scores. The navigational features of the test may have an impact; for example,
examinees may find it harder (or easier) to review and change responses to earlier items with a
digital administration than a paper administration, depending on how the reviewing functionality
is designed. Also, digital administration and examinee performance may not be the same on all
types of digital devices, a fact that has led to concerns about “device comparability” (DePascale,
Dadey, & Lyons, 2016). Devices (e.g., phones, tablets, laptops) and input modes (e.g., keyboard,
mouse, trackpad, touchscreen) have been shown to be related to test score differences (Way,
Davis, Keng, & Strain-Seymour, 2016).
EQUIVALENCE OF DIGITAL TESTS
10
Individually administered tests open the door to additional potential threats to
equivalence because of the involvement of another person, the examiner. The examiner’s digital
interface may affect how well he or she reads instructions, prompts the examinee, records
responses, or scores individual items. For example, on a verbal fluency task (e.g., “Tell me the
names of as many types of food as you can”) a digital response-capture device might make it
harder for the examiner to keep up and lead to fewer correct responses being counted. Similarly,
a difference in how scoring rules are presented or in the mechanics of scoring could change how
responses are scored.
Finally, the examiner’s digital interface could influence examinee performance in a subtle
way. An example occurred during piloting of a Q-interactive version of Wechsler verbal subtests
(e.g., Vocabulary), where the keyboard was used to record oral responses. Because examinees
could see and hear the examiner typing, they tended to pause to let the examiner catch up, and as
the test went on they shortened their responses. Use of the keyboard had to be abandoned.
The Present Study
The purpose of this study was to evaluate the raw-score equivalence of the diverse set of
individually administered cognitive subtests of the Wechsler Intelligence Scale for Children®,
fifth edition (WISC®–V; Wechsler, 2014) that were adapted for Q-interactive. These subtests
vary in the abilities they measure, in how examinees interact with stimuli and make responses,
and in how examiners participate in the assessment. Therefore, the study could reveal patterns of
digital effects related to particular characteristics of the subtests or adaptations.
The WISC–V subtests had been adapted in a conservative, cautious way with the goal of
maintaining equivalence so that existing norms and psychometric information could be used.
EQUIVALENCE OF DIGITAL TESTS
11
WISC®–V subtests assess verbal and nonverbal reasoning, spatial visualization, working
memory, processing speed, and learning-related skills. Attempts to create raw-score-equivalent
adaptations of the three processing speed subtests were unsuccessful, and so digital versions
were created that were not raw score equivalent; those subtests were not included in this study.
To minimize examinee-based threats to equivalence, the digital versions mimicked the
forms of stimulus presentation and response mode of the paper versions; for example, visual
stimuli were the same size as in paper stimulus books. Sometimes this meant foregoing
efficiencies or enhancements that the digital format could have provided. For example,
manipulatives such as the Block Design blocks were retained rather than being replaced by
moveable screen images, out of concern about affecting the measured construct as well as raw
scores. For all subtests, auditory stimuli and instructions were presented by the examiner rather
than by using digital voice. The screen’s response to touch was carefully controlled to avoid
affecting task difficulty; for example, on Visual Puzzles where the examinee selects several
images that go together, each image highlights only briefly when touched so that the examinee
still has to use working memory to keep track of their selections.
By contrast, the examiner’s screen functioned quite differently from the paper materials
(record form and manual) that it replaced. Here, the goal was to design the interface to help the
examiner follow the administration, recording, and scoring rules of the paper version accurately.
A primary criterion for deciding whether to incorporate a feature in the initial design of the
examiner’s interface was a judgment of whether it would lead skilled and conscientious
examiners to assign the same scores as on a paper administration. Features of the examiner’s
interface included a timer, a view of where the examinee touched the screen, item-specific cues
EQUIVALENCE OF DIGITAL TESTS
12
for when and how to query or prompt, audio-recording of oral responses, and signals that
discontinue and reversal rules had been met. These features were considered likely to reduce
examiner errors without otherwise affecting scores, as they essentially allowed the examiner to
better implement the administration procedures that were common across digital and paper
formats.
The cautious nature of the digital adaptations with respect to the examinee’s test-taking
experience, along with the use of tablets with simple, intuitive touchscreen input, were not
assumed to be sufficient to ensure paper–digital equivalence of the WISC®–V subtests; past
research shows that equivalence is difficult to predict. In addition, the research literature on
equivalence deals almost entirely with self-administered tests and does not address threats to
equivalence that are unique to individually administered tests. Therefore, raw-score equivalence
had to be evaluated empirically for each subtest. If research indicated that raw-score equivalence
was not met, then the digital version was modified to attain equivalence (or, as with the
processing speed subtests, the paper and digital versions were equated). The WISC®–V
equivalence study described in this paper was part of a larger program of Q-interactive®
equivalence research that has been ongoing since 2011.
Method
Participants
The sample consisted of 350 children aged 6 to 16 years who were recruited from the
general population to be part of the WISC®–V standardization and who were randomly assigned
to take the battery in either the paper or the Q-interactive® format. Only children without
perceptual or motor disabilities or severe clinical conditions were included, because the purpose
EQUIVALENCE OF DIGITAL TESTS
13
of the study was to detect general effects of the digital adaptations. Test performance of people
with disabilities or clinical conditions may well be affected by the difference between digital and
paper formats, and such effects are important for test users to understand, but that issue was
beyond the scope of this study.
After testing was complete, 175 pairs were formed by matching paper and digital cases
by age, gender, ethnicity, and parent education. The resulting sample was evenly distributed
across ages (M = 11.1 years, SD = 3.2 years), included 58% females, had ethnic representation
close to that of the general child population (11% African American, 17% Hispanic, 66% White,
and 6% Other), and was above-average in parent education (75% with some post-high-school
education).
All 113 participating examiners were experienced in administering WISC®–V in paper
format. They underwent training in Q-interactive administration of WISC®–V, demonstrated
competence in digital administration and scoring, and did several complete practice
administrations prior to the study. About half (58%) of them conducted administrations in both
formats, 38% did only digital administrations, and 4% did only paper administrations.
Materials and Procedures
Each child took the paper or Q-interactive version of the WISC®–V. Each subtest yields
normalized age-based scores on the scaled score (M = 10, SD = 3) or standard score (M = 100,
SD = 15) metric. The three processing speed subtests were administered but not analyzed,
because they had not yet been adapted for Q-interactive, other than to use the examiner’s tablet
as a timing device.
EQUIVALENCE OF DIGITAL TESTS
14
All administrations were video recorded, with parent consent. Examiner errors in
administering the tests or scoring items during administration were not corrected, because these
errors might have been influenced by the administration format. However, post-administration
errors such as incorrectly summing item scores were corrected if they were not related to the
administration itself.
The study used an equivalent-groups design in which the assignment to paper or digital
format was random within each demographically matched pair. The equivalent-groups design is
advantageous for research on equivalence of test formats because each examinee takes the test
only once, thus removing the possible influence of recent experience with the task. Although the
retest design (using the same or alternate forms) has the benefit that examinees serve as their
own controls, this comes at the cost of learning and practice effects on second-administration
scores, especially on problem-solving tests (Calamia, Makon, & Tranel, 2012; Kaufman, 1994).
Another disadvantage of the retest design is that there can be an interaction between format and
sequence; for example, format might have a greater effect on first-administration performance,
when examinees are unfamiliar with the task, than on a later administration. The equivalent
groups method avoids these concerns and directly addresses whether individuals taking a test for
the first time will obtain the same score regardless of format. The stratified random assignment
used in this study had the additional benefit of improving statistical power by reducing the
variance in the group difference that is due to sampling error.
The effect of format on performance was estimated separately for each WISC®–V
subtest. In order to enhance statistical power beyond that provided by the randomly equivalent
groups, we used a multiple-regression approach in which the subtest score was predicted from
EQUIVALENCE OF DIGITAL TESTS
15
ability and demographic variables as well as format. The dependent variable in each analysis was
the subtest’s age-based normative score, that is, the scaled score with a population mean of 10 or
100 and standard deviation of 3 or 15. The independent variables were: selected other WISC®–V
subtests or indexes that had been found to be minimally affected by format; demographic
characteristics (age, gender, parent education, and ethnicity); and a dummy-coded variable for
format (0 for paper and 1 for digital). Selection of the WISC®–V subtests/indexes used as
predictors was based on a preliminary run of the main analysis in which subtests/indexes that had
shown small format effects in a WISC®–IV equivalence study (the Block Design, Arithmetic,
and Digit Span subtests and the Verbal Comprehension Index) were the predictors. (For analysis
of each verbal subtest, the VCI was replaced by the Similarities or Vocabulary subtest.) The
subtests/indexes that showed the smallest format effects in the preliminary analysis were chosen
as predictors in the main analysis. These were the Letter-Number Sequencing, Picture Concepts,
Picture Span, and Visual Puzzles subtests and the Verbal Comprehension Index.
The unstandardized regression weight for the dummy format variable represented the
format effect, that is, the average difference in scaled scores between formats (digital minus
paper) after controlling for other variables. This was divided by the normative standard deviation
(3 or 15) to yield the effect size. Prior to the study, an effect size of 0.20 or less had been set as a
criterion for considering the paper and digital versions to have sufficient raw-score equivalence
for use in practice. This effect size is equal to a difference of 0.6 scaled score points (M = 10,
SD = 3) or 3 standard score points (M = 100, SD = 15), and it is less than the standard error of
measurement of scores on most of the subtests in the study. In order to compare the dispersion of
EQUIVALENCE OF DIGITAL TESTS
16
scores in the two formats, the equality of the standard deviations of scores on each subtest was
tested using the folded F test.
Additional analyses were performed to see whether format had a differential effect at
different levels of ability or other personal characteristics. Data from the paper-format sample
was used to create a regression equation predicting scores on each subtest from the independent
variables (WISC®–V subtests and stratification variables) listed above. This equation was then
applied to the digital-format sample to calculate an expected paper-format score for each subtest.
The difference between the actual digital-format score and the predicted paper-format score was
an individualized indicator of format effect, and its correlations with ability level and other
examinee characteristics were calculated.
Results
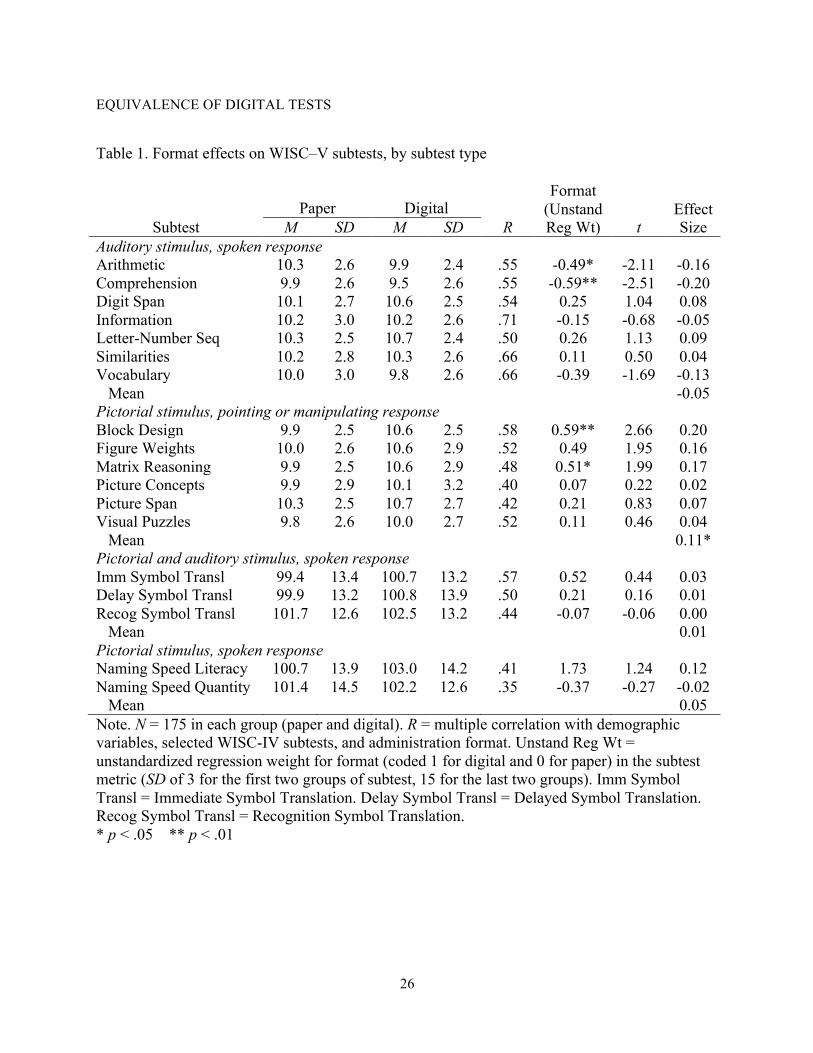
Table 1 shows the results for the 18 subtests, grouped by administration characteristics.
There were no statistically significant differences between standard deviations in the two format
groups. The median multiple correlation of subtest scaled score with demographics, other
WISC®–V scores, and format was .52, indicating that these variables accounted for about one-
fourth of score variance. With 350 cases and a typical multiple correlation of .50, statistical
power to detect a true effect size of 0.20 (with alpha = .05) was .58.
The first group of subtests consisted of seven where the stimulus and response were both
oral. Most of the effect sizes were very small and they varied in direction, ranging from –0.20 to
0.09 (M = –0.05). Two effect sizes (for Arithmetic and Comprehension) were statistically
significant and were at or near the equivalence criterion of 0.20, with higher scores for paper
administration.
EQUIVALENCE OF DIGITAL TESTS
17
In the six subtests of the second group, visual stimuli were shown on the iPad® and the
examinee responded by pointing or touching or, in the case of Block Design, by arranging
physical blocks to match the stimulus. All format effects were in the direction of higher scores
for digital administration, with values ranging from 0.02 to 0.20. Two of the differences were
statistically significant (for Block Design and Matrix Reasoning), and three were at or near the
effect-size criterion of 0.20. The mean effect size (0.11) in this group was significantly greater
than zero (t = 3.55, p < .05).
Finally, the format effects for the five Symbol Translation and Naming Speed subtests,
which use visual (or visual and auditory) stimuli and oral responses, were all small (–0.02 to
0.12; M = 0.03).
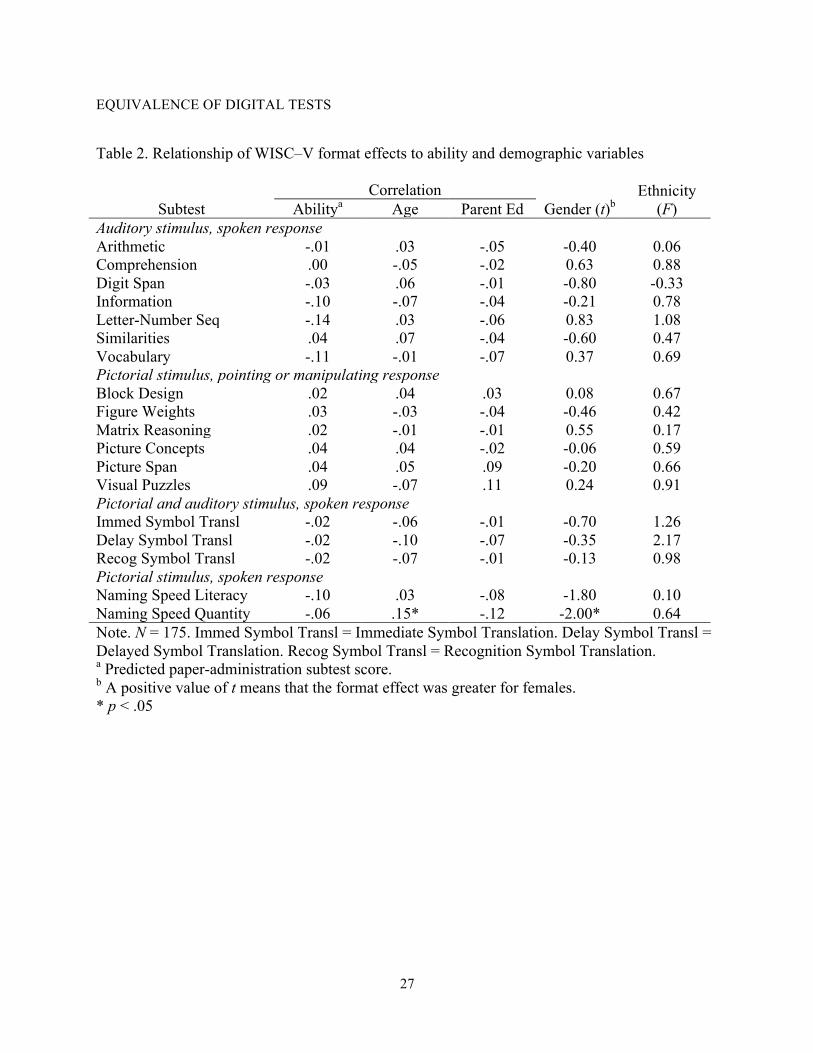
Table 2 shows results of the analysis of whether the individualized format effect (the
difference between the actual digital score on the subtest and the predicted paper score based on
demographics and other subtests) differed for examinees of different ability levels or other
personal characteristics. Relationships with all examinee characteristics were negligible. Of 90
comparisons, only two were significant at the .05 level, fewer than expected by chance. Overall,
these findings support the conclusion that none of the adaptations of WISC®–V subtests to digital
format had an effect that manifested itself more (or only) at some levels of ability, age, parent
education, gender, or ethnicity.
Discussion
The results of this study indicate few differences between the paper and Q-interactive®
versions of the WISC®–V. Effect sizes for all of the subtests were at or below 0.20. A major
contributor to this generally positive result was the conservative approach to digital adaptation,
EQUIVALENCE OF DIGITAL TESTS
18
which placed highest priority on maintaining equivalence by keeping the stimulus presentation
and the response demands as similar as possible across formats (e.g., maintaining manipulatives
such as blocks, retaining identical size of test stimuli, and keeping the examiner in control of
presenting instructions). Results suggest that paper–digital equivalence can be obtained for
diverse individually administered cognitive tasks if careful attention is paid to equivalence issues
throughout the development process and design decisions are made with equivalence in mind.
Nevertheless, several subtests showed statistically significant format effects. Scores on
two of the subtests having auditory stimuli and spoken responses—Arithmetic and
Comprehension—were significantly lower in the digital format. The threats to equivalence in
tests of this type were thought to stem from examiner behavior: how the examiner presented the
stimuli (i.e., item administration rules), when and how the examiner queried responses, and how
the examiner recorded and scored responses. Our careful review of videos, reports from
examinees and examiners, and the raw data did not, unfortunately, identify sources of these
significant effects. No systematic differences in the accuracy of administration or scoring were
observed. One might speculate that the lower scores on Comprehension, which elicits extended
oral responses that must be scored subjectively, were due to differences in how responses were
captured or scored. This would not apply to Arithmetic, however, where the oral responses are
concise (numbers).
Conversely, digital scores tended to be slightly higher on subtests that use pictorial
stimuli and nonverbal responding. This format effect was statistically significant for Matrix
Reasoning and Block Design, and was nearly as great for Figure Weights. One hypothesis is that
digital displays in general, or the iPad® in particular, are more engaging for children than paper.
EQUIVALENCE OF DIGITAL TESTS
19
Greater attention could be responsible for the marginal increase in scores on such tests. However,
this would not account for the near-zero format effects on Picture Concepts (0.02) and Visual
Puzzles (0.04) which also require visual attention. Again, careful inspection of the videos and
other data did not reveal any differences in examinee or examiner behavior (although a
difference in attention would be difficult to observe).
As a practical matter, when research reveals a small but significant format effect for
which there is no apparent explanation despite cautious adaptation and careful scrutiny of the
evidence, the implications for practice are not clear-cut. There is always the possibility that the
effect is random and not replicable. Making a statistical adjustment to raw scores would be a
strong reaction that would rely heavily on the study’s numerical result. Creating new norms
would be expensive and time-consuming and would introduce its own statistical error. For these
reasons, in situations where there is not a clear and convincing explanation for a format effect,
we have adopted the policy of accepting format effects below a low threshold (0.20 standard
deviation) until additional data or new explanatory insights suggest otherwise.
Our results indicate that format effects did not vary as a function of age, gender,
ethnicity, parent education, or overall ability level. These results suggest that within the
WISC®–V age range (6–16 years), paper–digital format effects are consistent across numerous
demographic variables. More research is needed to fully understand the effect of digital
administration at other ages, particularly among elderly examinees who may have little computer
experience.
Another limitation of the present study was its use of WISC®–V subtests as predictors of
performance on other subtests. Even though the predictors were carefully selected because of
EQUIVALENCE OF DIGITAL TESTS
20
evidence that they were themselves unaffected by format, their use could have introduced a bias
toward underestimation of format effects because of the common format of the predictor and
focal subtests.
The generalizability of study results is limited by the fact that children with clinical
conditions or disabilities were not included in the sample, even though the WISC®–V is typically
used with such individuals. Our rationale was that the initial major equivalence study should
focus on whether there are general effects of the digital format, and that any subgroup-specific
format effects would add noise that would make such general effects harder to detect.
Nevertheless, follow-up investigation of such group-specific effects is of great importance to
assessment practice.
This study addressed only the raw-score equivalence of digital and paper WISC®–V
versions, and did not attempt to evaluate construct equivalence. The decision to prioritize
analysis of raw-score equivalence followed from the strategy of designing the digital version to
replicate the paper stimuli and response processes as closely as possible so that raw-score
equivalence would be achieved. The fact that what examinees perceive and how they respond
appear to be virtually the same in both formats, combined with the finding that raw scores are
equivalent, make it likely that the versions measure the same construct. However, this needs to
be evaluated empirically, and future research should assess the various aspects of construct
equivalence relevant to the WISC®–V. For example, are the factor structures of the digital and
paper versions of the test consistent, do individuals with clinical conditions perform similarly
across paper and digital formats, and do the two versions correlate similarly with other measures
EQUIVALENCE OF DIGITAL TESTS
21
of cognition? This work is ongoing and will provide valuable information about the
interchangeable use of the paper and digital versions of WISC®–V.
Finally, there is a gap in the research literature on paper–digital equivalence (including
the present study), namely the inability of most studies to identify the causes of non-equivalence.
Such information would be invaluable for the design of digital tests that are not affected by
extraneous factors. As our study illustrates, teasing out explanations may require more than just
careful observation; targeted investigation that isolates and tests potential sources of non-
equivalence may be needed. Of course, tests are increasingly often being developed in digital
format from the beginning, and this can reduce or even eliminate the need for cross-format
equivalence, especially when the tests utilize features that can only be delivered digitally.
Nevertheless, a detailed understanding of the effects of particular aspects of the digital format on
examinee performance can be expected to contribute to the quality of digital test design. In the
meantime, a greater understanding of the threats to paper–digital equivalence will help test
developers maximize equivalence and help practitioners use and interpret digital versions
appropriately.
EQUIVALENCE OF DIGITAL TESTS
22
References
American Educational Research Association, American Psychological Association, and National
Council on Measurement in Education. (2014). Standards for educational and
psychological testing. Washington, DC: AERA.
Arce-Ferrer, A. J., & Guzman, E. M. (2009). Studying the equivalence of computer-delivered
and paper-based administrations of the Raven Standard Progressive Matrices test.
Educational and Psychological Measurement, 69, 855–867. doi:
10.1177/0013164409332219
Calamia, M., Markon, K., & Tranel, D. (2012). Scoring higher the second time around: Meta-
analyses of practice effects in neuropsychological assessment. The Clinical
Neuropsychologist, 26, 543-570. doi: 10.1080/13854046.2012.680913
DePascale, C., Dadey, N., & Lyons, S. (2016). Score comparability across computerized
assessment delivery devices: Defining comparability, reviewing the literature, and
providing recommendations for states when submitting to Title 1 Peer Review. Report
commissioned by the Council of Chief State School Officers (CCSSO), Technical Issues
in Large-Scale Assessment (TILSA), and State Collaborative on Assessment and Student
Standards (SCASS). Washington, DC: Council of Chief State School Officers.
International Test Commission. (2005). ITC guidelines on computer-based and internet delivered
testing. [www.intestcom.org]
Kaufman, A. S. (1994). Practice effects. In R. J. Sternberg (Ed.), Encyclopedia of human
intelligence (Vol. 2, pp. 828–833). New York: Macmillan.
Kubinger, K. D., Formann, A. K., & Farkas, M. G. (1991). Psychometric shortcomings of
EQUIVALENCE OF DIGITAL TESTS
23
Raven’s Standard Progressive Matrices, in particular for computerized testing. European
Review of Applied Psychology, 41(4), 295–300.
Mead, A., & Drasgow, F. (1993). Equivalence of computerized and paper-and-pencil cognitive
ability tests: A meta-analysis. Psychological Bulletin, 114(3), 449–458.
Neuman, G., & Baydoun, R. (1998). Computerization of paper-and-pencil tests: When are they
equivalent? Applied Psychological Measurement, 22(1), 71-83. doi:
10.1177/01466216980221006
Noyes, J. M., & Garland, K. J. (2003). Solving the Tower of Hanoi: does mode of presentation
matter? Computers in Human Behavior, 19(5), 579–592. doi: 10.1016/S0747-
5632(03)00002-5
Rabin, L. A., Spadaccini, A. T., Brodale, D. L., Grant, K. S., Elbulok-Charcape, M. M., & Barr,
W. B. (2014). Utilization rates of computerized tests and test batteries among clinical
neuropsychologists in the United States and Canada. Professional Psychology: Research
and Practice, 45, 368. doi: 10.1037/a0037987
Steinmetz, J., Brunner, M., Loarer, E., & Houssemand, C. (2010). Incomplete psychometric
equivalence of scores obtained on the manual and the computer version of the Wisconsin
Card Sorting Test? Psychological Assessment, 22(1), 199–202. doi: 10.1037/a0017661
Stevenson, C. E., Touw, K. W. J., & Resing, W. C. M. (2011). Computer or paper analogy
puzzles: Does assessment mode influence young children’s strategy progression?
Educational & Child Psychology, 28, 67–84.
Tien, A. Y., Spevack, T. V., Jones, D. W., Pearlson, G. D., Schlaepfer, T. E., & Strauss, M. E.
(1996). Computerized Wisconsin Card Sorting Test: comparison with manual
EQUIVALENCE OF DIGITAL TESTS
24
administration. The Kaohsiung Journal of Medical Sciences, 12(8), 479-485.
Tseng, H., Tiplady, B., Macleod, H. A., & Wright, P. (1998). Computer anxiety: A comparison
of pen-based personal assistants, conventional computer and paper assessment of mood
and performance. British Journal of Psychology, 89, 599-610. doi: 10.1111/j.2044-
8295.1998.tb02705.x
Van de Vijver, F. J. R., & Harsveld, M. (1994). The incomplete equivalence of the paper-and-
pencil and computerized versions of the General Aptitude Test Battery. Journal of
Applied Psychology, 79(6), 852–859. doi: 10.1037/0021-9010.79.6.852
Van de Vijver, F. J. R., & Poortinga, Y. H. (2005). Conceptual and methodological issues in
adapting tests. In R. K. Hambleton, P. F. Merenda, & C. D. Spielberger (Eds.), Adapting
Educational and Psychological Tests for Cross-Cultural Assessment (pp. 39–63).
Mahwah, NJ: Erlbaum.
Van de Vijver, F., & Tanzer, N. K. (2004). Bias and equivalence in cross-cultural assessment: an
overview. Revue Européenne de Psychologie Appliqée, 54, 119-135. doi:
10.1016/j.erap.2003.12.004
Way, W. D., Davis, L. L., Keng, L., & Strain-Seymour, E. (2016). From standardization to
personalization: The comparability of scores based on different testing conditions, modes,
and devices. In F. Drasgow (Ed.), Technology in testing: Improving educational and
psychological measurement, Vol 2. Abingdon, UK: Routledge.
Wechsler, D. (2014). Wechsler intelligence scale for children (5th ed.). San Antonio, TX:
Pearson.
Williams, D. J., & Noyes, J. M. (2007). Effect of experience and mode of presentation on
EQUIVALENCE OF DIGITAL TESTS
25
problem solving. Computers in Human Behavior, 23(1), 258–274. doi:
10.1016/j.chb.2004.10.011
Williams, J. E., & McCord, D. M. (2006). Equivalence of standard and computerized versions of
the Raven Progressive Matrices Test. Computers in Human Behavior, 22, 791–800. doi:
10.1016/j.chb.2004.03.005
EQUIVALENCE OF DIGITAL TESTS
26
Table 1. Format effects on WISC–V subtests, by subtest type
Subtest
Paper Digital
R
Format (Unstand Reg Wt) t
Effect Size M SD M SD
Auditory stimulus, spoken response Arithmetic 10.3 2.6 9.9 2.4 .55 -0.49* -2.11 -0.16 Comprehension 9.9 2.6 9.5 2.6 .55 -0.59** -2.51 -0.20 Digit Span 10.1 2.7 10.6 2.5 .54 0.25 1.04 0.08 Information 10.2 3.0 10.2 2.6 .71 -0.15 -0.68 -0.05 Letter-Number Seq 10.3 2.5 10.7 2.4 .50 0.26 1.13 0.09 Similarities 10.2 2.8 10.3 2.6 .66 0.11 0.50 0.04 Vocabulary 10.0 3.0 9.8 2.6 .66 -0.39 -1.69 -0.13 Mean -0.05 Pictorial stimulus, pointing or manipulating response Block Design 9.9 2.5 10.6 2.5 .58 0.59** 2.66 0.20 Figure Weights 10.0 2.6 10.6 2.9 .52 0.49 1.95 0.16 Matrix Reasoning 9.9 2.5 10.6 2.9 .48 0.51* 1.99 0.17 Picture Concepts 9.9 2.9 10.1 3.2 .40 0.07 0.22 0.02 Picture Span 10.3 2.5 10.7 2.7 .42 0.21 0.83 0.07 Visual Puzzles 9.8 2.6 10.0 2.7 .52 0.11 0.46 0.04 Mean 0.11* Pictorial and auditory stimulus, spoken response Imm Symbol Transl 99.4 13.4 100.7 13.2 .57 0.52 0.44 0.03 Delay Symbol Transl 99.9 13.2 100.8 13.9 .50 0.21 0.16 0.01 Recog Symbol Transl 101.7 12.6 102.5 13.2 .44 -0.07 -0.06 0.00 Mean 0.01 Pictorial stimulus, spoken response Naming Speed Literacy 100.7 13.9 103.0 14.2 .41 1.73 1.24 0.12 Naming Speed Quantity 101.4 14.5 102.2 12.6 .35 -0.37 -0.27 -0.02 Mean 0.05 Note. N = 175 in each group (paper and digital). R = multiple correlation with demographic variables, selected WISC-IV subtests, and administration format. Unstand Reg Wt = unstandardized regression weight for format (coded 1 for digital and 0 for paper) in the subtest metric (SD of 3 for the first two groups of subtest, 15 for the last two groups). Imm Symbol Transl = Immediate Symbol Translation. Delay Symbol Transl = Delayed Symbol Translation. Recog Symbol Transl = Recognition Symbol Translation. * p < .05 ** p < .01
EQUIVALENCE OF DIGITAL TESTS
27
Table 2. Relationship of WISC–V format effects to ability and demographic variables
Subtest Correlation
Gender (t)b Ethnicity
(F) Abilitya Age Parent Ed Auditory stimulus, spoken response Arithmetic -.01 .03 -.05 -0.40 0.06 Comprehension .00 -.05 -.02 0.63 0.88 Digit Span -.03 .06 -.01 -0.80 -0.33 Information -.10 -.07 -.04 -0.21 0.78 Letter-Number Seq -.14 .03 -.06 0.83 1.08 Similarities .04 .07 -.04 -0.60 0.47 Vocabulary -.11 -.01 -.07 0.37 0.69 Pictorial stimulus, pointing or manipulating response Block Design .02 .04 .03 0.08 0.67 Figure Weights .03 -.03 -.04 -0.46 0.42 Matrix Reasoning .02 -.01 -.01 0.55 0.17 Picture Concepts .04 .04 -.02 -0.06 0.59 Picture Span .04 .05 .09 -0.20 0.66 Visual Puzzles .09 -.07 .11 0.24 0.91 Pictorial and auditory stimulus, spoken response Immed Symbol Transl -.02 -.06 -.01 -0.70 1.26 Delay Symbol Transl -.02 -.10 -.07 -0.35 2.17 Recog Symbol Transl -.02 -.07 -.01 -0.13 0.98 Pictorial stimulus, spoken response Naming Speed Literacy -.10 .03 -.08 -1.80 0.10 Naming Speed Quantity -.06 .15* -.12 -2.00* 0.64 Note. N = 175. Immed Symbol Transl = Immediate Symbol Translation. Delay Symbol Transl = Delayed Symbol Translation. Recog Symbol Transl = Recognition Symbol Translation. a Predicted paper-administration subtest score. b A positive value of t means that the format effect was greater for females. * p < .05