erd technical note no. 8 - homepage - ucla luskin · erd technical note no. 8 testing savings...
TRANSCRIPT

ERD Technical Note No. 8
Testing Savings Product InnovationsUsing an Experimental Methodology
Nava AshrafDean S. Karlan
Wesley Yin
November 2003
Nava Ashraf is a Ph.D. candidate in the Department of Economics, Harvard University; DeanS. Karlan is Assistant Professor of Economics and International Affairs, Princeton Universityand President, Innovations for Poverty Action; and Wesley Yin is a Ph.D. candidate in theDepartment of Economics, Princeton University. The authors wish to thank Brett Coleman,Nimal Fernando, Roger Thomas Moyes, Sununtar Setboonsarng, Vo Van Cuong, and XianbinYao from the Asian Development Bank for useful comments and, the Asian DevelopmentBank for funding under RSC-C20817-PHI. Likewise, Dr. Enjiang Cheng of Victoria University,Australia for reviewing the paper, and the Green Bank of Caraga for its collaboration. Allviews and errors are the authors’.

Asian Development BankP.O. Box 7890980 ManilaPhilippines
2003 by Asian Development BankNovember 2003ISSN 1655-5236
The views expressed in this paper are those of theauthor(s) and do not necessarily reflect the views orpolicies of the Asian Development Bank.

Foreword
The ERD Technical Note Series deals with conceptual, analytical or method-ological issues relating to project/program economic analysis or statistical analysis.Papers in the Series are meant to enhance analytical rigor and quality in project/program preparation and economic evaluation, and improve statistical data and de-velopment indicators. ERD Technical Notes are prepared mainly, but not exclusively,by staff of the Economics and Research Department, their consultants, or resourcepersons primarily for internal use, but may be made available to interested externalparties.

Table of Contents
Abstract ix
I. Introduction 1
II. Before the Evaluation: Product Innovation 2
III. Production Evaluation: Randomized Control Experimental Design 3A. Internal Controls and Contamination 5B. Unit of Observation 5C. Sample Frame 6D. Timing and Duration of Study 6
IV. Baseline and Follow-up Survey 7A. Designing a Survey 7B. Putting the Survey Together 11C. Testing and Implementing the Suvey 12
V. Analysis 13
VI. Policy Recommendations and Conclusion 15
Appendix 1: Steps for New Product Development 16
Appendix 2: Sample Survey Modules for Baseline and Follow up Evaluation 20
Bibliography 33
Abstract
This paper advocates a rigorous, scientific approach to the evaluation ofinnovations in micro-savings products. Such rigorous, randomized evaluations canhelp microfinance institutions (MFIs) have a clearer sense of why certain productsare successful while others are not, and can help researchers and policymakers inves-tigate the mechanisms and incentives involved with successful savings mobilization.However, randomized evaluation designs are not for all MFIs, as they involve a largedegree of planning and resources. Furthermore, although product design matters,many other issues (such as organizational capacity, internal controls, accounting sys-tems and regulatory environment) matter greatly for the success of a savings program.This paper describes what is involved in carrying out a randomized evaluation designonce a savings product has been developed, and how to design and implement appro-priate survey instruments to analyze accurately the welfare impact of savings innova-tions. The paper is intended to serve as a technical guide for the use by administratorsof MFI’s, and by collaborative external agency staff sharing an interest in micro-savings product development.
ERD Technical Note No. 8��������������� ������ ����������������� ������ ������������������
1
���������������
The pressure to develop viable financial products relevant to target markets has coincidedwith the rapid trend in the microfinance industry for self-sufficiency. Determining the net benefits of aproduct requires careful analysis of the institutional costs and benefits. From a policy perspective, thepotential benefits of a product are rarely limited to the narrowly defined benefits of increased accountbalances. A financial product may impact a client in a broad range of economic behavior: it may inducechanges to a client's propensity to save, to her investment behavior, and to the intrahousehold alloca-tion of her household's resources. A full analysis of a financial product from a policymaker's perspec-tive considers these broad economic impacts, of which internal benefit to the microfinance institution(MFI) is but one. This paper provides a detailed operational guide to assessing the broader impacts ofa new financial product using experimental methodologies.
Although this paper focuses on randomized control evaluations that include extensive house-hold surveys, one should not infer from this that such surveys are necessary for successful research andproduct innovation. On the contrary, surveys could be considered a luxury of the researcher with theresources, and of the policymaker with the desire to know the full impact of a product on householdwelfare. A financial institution keen to understand the viability, sustainability, and profitability of agiven product need not collect such data, but rather should focus on administrative data (i.e., savingsaccount balances) as the primary outcomes of interest.
To assess broader impacts, however, significant effort must be spent in gathering original dataon a new product's effects; existing data are inadequate for assessing the impacts of a financial productthat has not existed or been tested before. The approach we advocate in gathering such data andcarrying out product evaluation is neither cheap nor fast; it does, however, lead to more accurateevaluations, purged of the biases that plague most evaluations of microfinance products. Much of thisguide focuses on how to design and carry out product evaluations so as to avoid such biases throughrandomization, appropriate survey sampling, questionnaire design, and data collection. The last part ofthe article addresses data analysis and evaluation.
Randomized control evaluations of new products, whether they include extensive householdsurveys or not, are not appropriate for each and every microfinance institution. An MFI must be dedi-cated to the process in order for the research to yield reliable results. There is a clear role both forcollaboration with research institutions and for public subsidies to test new product designs, so thatother nonsubsidized organizations can then free-ride on the knowledge created through the rigorous,randomized pilot phase evaluation.
Throughout this article, the authors refer to a case study in the Philippines (Box 1). In 2002,the authors began a research project with the Green Bank of Caraga in Mindanao to examine theeffectiveness of savings products with built-in commitment features. It is hoped that reference to thisproject will help clarify the steps for product implementation and assessment. Furthermore, it is hopedthat this example may motivate similar endeavors elsewhere that aim to assess the broader impacts offinancial products.

November 2003Nava Ashraf, Dean S. Karlan, Wesley Yin
2
Box 1: Philippines Savings Project—General Description
���� ���� �� ���� ���������� � � �� ���� ��� ���������������� ��� ���� �� ��� � ����� ���������� ������������������� ����������� ���� ��!� ����� �"���� �������� � ��� ���� ���� ������� ��� ���������#������ ���������� ��������� �������������� ���� ����#����� �� ����� �� �������������������������������������������������������� ������������������������� ����������� ������������� ����������������������� ���� #� � ��$��������!�%������������������������������������ ����������������������� ���������������������������������� � �����#�������� ������� ��� �� ��������������� ������� �������� �� ��� ��� ���� ��� ��������!� $� ��� �� �#��������� ���������������������� ������������������������������� ������������������������� ��� ��� ����������!�&����#������������������ ������������������������������������������������������������� ��������������������� ���� ����������� ���������� ���� ���� ��� ������� ������ !
%������������������������������������������� ������'��&����(��������������)��������!�����&����(�������������������������������� ������������������������������������������������������!������ ��������������������� ���� ��� �������� ����� ������� ��� ���� ��� � ����� ����#� ��� ����� ��� �� * +������� ��������� ���� ����� �����������������������!��������)��������������������������������������� ������ ��������������������������������������������� ���������������������������� ���������� ����������������,�!�!#��������������#����������������#� ���!-#� ������ �� ���� �������������� ����#� � � ������� � �������!� ��� ��������� ��������� �� �#������ ����� � �������#� ����� � ������ �������� � �� ���� ����� ��������� ������� ������������� ������#��������� ��� �����������������#� ��� ����� ������� ������ �!
������� �����������������������������������
There are four stages to developing and testing an innovative savings product:
(i) Idea Generation: different pieces of information converge and point to client demand fora new savings product.
(ii) Development of Product Concept: an institution studies the market more comprehensive-ly, designs a prototype based on the findings, estimates the cost of providing such aproduct, and evaluates its institutional capacity for offering such a product (Box 2).
(iii) Pilot Test & Evaluation: the institution and its research collaborators implement a pilottest, which tests the market's acceptance of the prototype, as well as the functioning ofthe institution's systems in providing it. This trial run includes the elements necessary forevaluating the impact of the product, by randomizing interested clients into three groups:treatment, marketing only, and control. The feedback from these processes allows plan-ners to perfect the product and systems, and to develop a marketing/promotion strategyfor launching to a wider audience. Before the product is tested in this stage, a baselinesurvey of all three groups is carried out to assess baseline indicators of interest. Once thepilot test is complete, a follow-up survey is carried out and progress on the indicators iscompared among groups.
(iv) Product Launching: the product is offered on a much wider scale.
Appendix I describes Stages 1 and 2 in more detail, for interested microfinance professionals.These stages involve carrying out focus groups, in-depth interviews, and a market survey to assessdemand and supply for a new product. These are the stages at which data is gathered to assess clientneeds and current habits, in order to develop an appropriate savings product. Once the product isdeveloped, the emphasis turns to gathering data on baseline measures of welfare for those who will beparticipating in the product trial, in order to evaluate impact.
The rest of the paper is dedicated to this evaluation of impact of a new product, after Stages1 and 2 have been completed. Such evaluation involves a rigorous research process. MFIs often

ERD Technical Note No. 8��������������� ������ ����������������� ������ ������������������
3
implement innovative new products without adequate testing and evaluation (see Matin 2002 forexamples), which make it difficult both for the MFI to systematically learn what aspects of the innova-tion worked and what did not, and for the microfinance industry to further its knowledge about whichsavings products help increase savings. This paper is focused, in particular, on how to carry out evalu-ations in a way that can further overall knowledge about how people save and how to increase savingsamong the poor.
Box 2: Philippines Savings Project—Product Development
� ��������������������� � ������ ������ �������������� �������� �� ��� ���� ���$��� ��� ���������������!����� ������ ���������� ��� ���� �� ������� ������������� �������� ��� ����� �� ����$��� ��� ��� ��� �� ��� ��� ��� *.��������� ���� �������� ������#� ���������� ��� ������������ ��� ��������� ���� �� ��� ��� �������� ��������� � ������ ������ ��������� ���� ��� ���� ���� ��� ����� !� �������� �� � ���������� ��� ��� � � � ����� ��������� � ������#�������� �������� � ������������������� ����������������� ������� ���$����� ����������������� �!������������ ������ ����� ������������������ ������������������ �����$�� ����#� �� ������ ���� ����������� �������#� ��#���������#������� ���� �� ����� � ���� ���� ��� �� ������� ������!� ������� ���� �� ����� ��� ���� ������'� ����� ��� ���������� ��� ���� �������� ������� ��� ��������� �������� ������� ��� ����� ���� ��� ���� ������� ���������� ���������������� �� � ���� ������� � ������� �������������� �������� ,����)�������� *� �� ��� ��������� ��� ������ ���� �� ����-!�/�� ��������� ��� ������� � ������ ��� ������ ��� ���#� ���� ��� ��� �� ���������� ���� ����� ���������� ����� ���(���*#����������������� �� �����$�� ��� ���������� ���������!���������������������� ���� �������!
�����������������������������������������������������������
Most evaluations carried out on microfinance products and projects are vulnerable to multiplecriticisms: if they only evaluate clients of the project after implementation, they do not have a properbaseline to evaluate changes against. If they evaluate based on a baseline and a follow-up survey ofclients, they do not have a proper control group to demonstrate what would have occurred in absenceof the project. Even if they have a control group and a project group, and gather data from both groupsat the baseline level and again as a follow-up, they are vulnerable to the criticism of selection bias,i.e., any changes observed in the project/treatment group could be due to unobservable attributes(ambition, business acumen), which led people in the treatment group to take part in, or select into, theproject in the first place. (See Angrist et al. 2002, Duflo and Saez 2003, Miguel and Kremer 2001,Kremer 2003, and Glewwe et al. 2000 for sample evaluations of social projects using randomizedmethodologies. Guides on randomized evluation are also avaiable in Boruch 1996, Meyer 1995, An-grist and Krueger 2001, and MDRC 2001.)
Randomization aims to eliminate this selection problem when carrying out an evaluation.Since we do not observe certain characteristics that may affect our outcome (savings), it is impossibleto select a control group of nonparticipants and know that they are indeed a valid control group.Randomization solves this problem. Since people are randomly assigned into treatment or controlgroups there is no reason to believe that the groups, on average, should have systematically differentsavings preferences.
Imagine an MFI that wants to evaluate the impact of a time deposit on client savings. If itwere just to compare savings of clients with time deposits to those without it, it could not definitivelysay whether any differences were due to the time deposit itself or to individual character and desire tosave: it is very possible that those clients with a higher propensity to save are the ones who use timedeposit products and it is this higher propensity to save—and not the product—that is responsible forany higher savings the MFI might see. Now imagine that we randomly select participation into treat-

November 2003Nava Ashraf, Dean S. Karlan, Wesley Yin
4
������������������������ ����� �� ���� ������������������� ���������������� ���� ������������� ���������������������� ���� � �� ������ �� ����� !�"�� ��� ��������� ���� �� #$$#%&�'� ���� ����� ������ ��(������ � �� � �� �������� ���� ����� )��� �� �� ��� ��������� ���� ���(�� ����� ��� ���� ���� ������ ����� ��� �������� ���� ��� ����� � ���� �&
Box 3: Randomized Evaluation in Social Science Research
0��������������������� ������������������������������������ �� ��#������ ���������� �� ���������������������������������������1��������2���������� ������!3� �)� �������� ��� ��������� ��� ���� ��� ���������� �����1��� ���������� ��� ������ � �� ��� � ���� ���� ��� ����� ���������� �������������� ����� ���#� ������� ��� ������������������� �� �������������� ��� ��#� ��� ��������������������� ��������������� !�������������#��� ���������� ���� ����� ���������� ���� ���� ����� ���������� ��� ��� ��� � ���������� "�� ���'� � ���� ����� ��� ������������������ �� �� ������������������������������������������� ������ �"����� �������� ���4���!
����������� �������������� ��� ����������������������������
�� ���������������������������/��� �������,��/-�� �� �!��������������� ���������������� #�������������� ��� ������� ������ ��� ������ ���� � ���������� ������� ����#���� ���� ��������� ����� ����� �!
�� ����� ���������)��������� ��� ��������� ��� ������� ��������� �"������� �� ����������� ����� �� ��� ���� ���� ��� � ����'� �������� ������� � ���#������� ���� ������������ ����������� ��� � ������ � ����� ����� ��� � ��� ���� ���5������ � ��6� �����������7�5��� ������ ���#����������� �������� ���������� ��� ������������ 6�� ����5��� ��� � ���#����������� ������������������#����� ���������� ������������ �� ���������������!
������ ����� �����8���������� ��� ����� � �������� ����� ���� ������� ��� ��������� ���������������� ��� ������ ������ ������� ��� ����5��� ��� � ���� ���������� ��� ����� �����#� ��� ����� ������ ����� ���������� ����#������� ������� �� ����������������!���� ���� ������������������� � ��� ��������������� ���/�� ��������� ����������#� � �����#� � ����� �� ������!� ���� ������� � ���� ����� ����� �� ����� ������� ��� ��� �� �������������1������ � ���#� ��� ��� ��"� ��#� � � ��� ���� ������ �� ���������!
������������ ���!"��� #� ���! ��$������%"�$�� �����"�&����'� ���'��������$���#�(���� ����%)���*��� � ����� �������"���� ��+�#���'$� ���
�� ���� ��������� � ����� �� ��������9� �� ������ �"���� ,�9�-#������� � �������������� � ������� �� ������������ ���,���������-����������������������:.#...������ ������;<�� �� ������������� � ��(�������� ���#4���!� ���� � �"���� ��� ����� �������� ������ =�� �� *>>7!
�� ����� �������������� �� �� ��������������� ���� �������� ����� �� ���� ����#� ����� ���� ����������� ��+<�� �� ���������!�� ���������������������������������������'�+<�? ����*�������������� ���������� ��������� *>>76� +<� ? ���� +� �������� ����� ��������� � ������� ��� *>>>6� ��� +<� ? ���� :� �������� ����� ��������� ������� ���+...!
������ ����� ����� ����� �����1��� � �� � ��� �� �� ����� � ������� ���� ��� ������� ���� ���� �� ��� ��������������������� �� ������ ������� ����� ��������������������������������������!�(������ ��������������������� ���� ���������������#��������� �������� ������� �� ����� �������� ������ �#� �������� ���������������� �� ������ ������� ���? ����*����? ����+��������� ���*>>7 *>>>������������� ��� ������������������������ �����!� ���� � �� �� ���� ��� ����������� 2�������� 3� �������#� ��� ������ ������ ��������� ��� ������������� ��������� ��� ������� ����� �� �� �������'
(i) Pupils that received treatment reported being sick significantly less often, had lower ratesof severe anemia, and showed substantial height gains.
(ii) When younger children (Standards 1-4) were de-wormed, they attended school 15 moredays per year, while older children attended approximately 10 more school days per year.
(iii) The entire community and those living up to 6 kilometers away from the treatment schoolsbenefited from de-worming through a phenomenon known as “spillover”. Spillover effectsoccur because medical treatment reduces transmission of worm larvae (eggs) to othercommunity members. Spillover effects allowed pupils of neighboring schools to attendschool an average of 3-4 additional days per year.

ERD Technical Note No. 8��������������� ������ ����������������� ������ ������������������
5
ment and control groups. Randomizing ensures that both the treatment and control groups containindividuals with similar (but unobservable) desires and propensities to save, in theory. Naturally, if fewpeople are in the study, the ability to induce the same distribution of characteristics across treatmentand control groups becomes more limited, in practice. To achieve a better randomization, one needsmore participants. This increases the cost of the study. See Box 4 for the randomization scheme used inthe Philippine savings project.
Quasi-experimental techniques also have risen in popularity. Fundamentally, quasi-experimentaltechniques try to observe the unobservable mentioned above. This has proven effective in some settings,but not in others. When it is easy to predict who will or will not take up a given service, then quasi-experimental techniques can work. Microcredit and microsavings behavior, unfortunately, are quitedifficult to predict. In some cases, quasi-experimental designs can be combined with experimentaldesigns. This requires additional resources (because it requires the creation of a nonrandom controlgroup as well as a random control group) but provides a unique opportunity to assess whether or notthe “unobservable” characteristics that drive the take-up decision do in fact lead to biased results. Ifthey do not, then this opens up many possibilities for research designs that are easier to conduct.Microcredit by its very nature, however, relies on entrepreneurial spirit to succeed, and this is indeeda concept difficult to observe.
�� ��������������� ���!�����"#���#��
Randomization often requires controlling who is allowed to take up a product. This means thatsome individuals desire the new product but are prohibited from being offered it due to the researchdesign. Weaker experimental designs, such as “encouragement” designs, do not require this type ofrestriction. An encouragement design works by “encouraging” some people to take up a service, andnot others, but allowing anyone to take up. If the encouragement is very effective, and hence producesa large difference in take up between those “encouraged” and those not, then statistical conclusionscan be drawn. Typically, however, such strategies only work if the sample size is quite large and theencouragement is quite powerful.
In some cases, contamination can and should be embraced. If one wants to know how benefitsspill over from treatment to control groups, then collecting information on relationships and likelypaths of transmission of benefits can shed insight into this. In many cases, this can be thought of as apositive externality, hence any cost-benefit analysis should take this into account. As an example, thedeworming project conducted in Kenya (see Box 3) did not pass a cost-benefit analysis until thebenefits that accrue to peers of the treated were included in the analysis. This spillover to the controlgroup allowed for a more complete analysis of the benefits, and dramatically changed the final conclu-sion of the research. The link for savings is less direct, but exists nonetheless. If one person learns tosave more, do they teach others about their new approach to finance?
�� �#���$��% ��&��#��
The unit of randomization is an important decision. If a program is large enough, one couldplausibly randomize over villages or counties and measure impact of a program on communities.Randomization at finer levels (at the finest, the randomization is done over individuals) can lead toincreasing logistical costs and internal controls. Marketing, management, and information systems(MIS), and monitoring costs may all be more expensive and labor-intensive for, say, individual-levelrandomization than for a more coarse level of randomization, where, for example, towns, districts orother geographical demarcations are grouped into control and treatment categories.
However, there is a clear tradeoff here: randomizing only across broad groups (such as villag-
November 2003Nava Ashraf, Dean S. Karlan, Wesley Yin
6
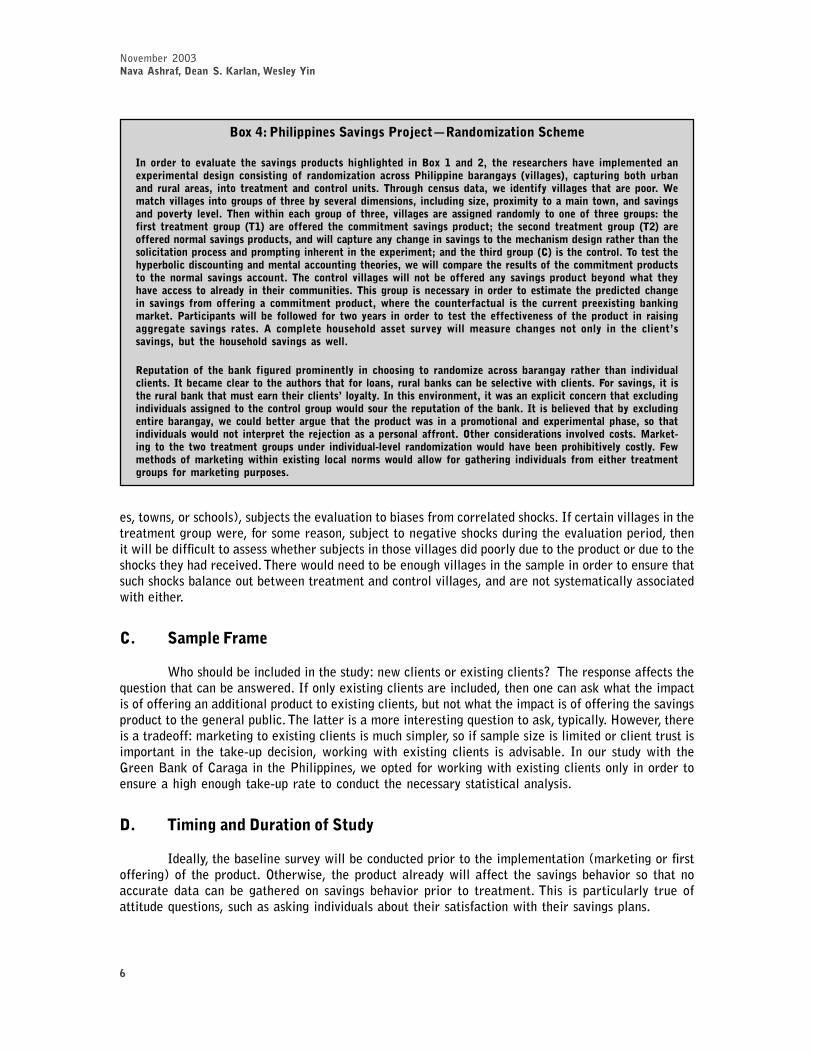
es, towns, or schools), subjects the evaluation to biases from correlated shocks. If certain villages in thetreatment group were, for some reason, subject to negative shocks during the evaluation period, thenit will be difficult to assess whether subjects in those villages did poorly due to the product or due to theshocks they had received. There would need to be enough villages in the sample in order to ensure thatsuch shocks balance out between treatment and control villages, and are not systematically associatedwith either.
� ��"'��� ��"�
Who should be included in the study: new clients or existing clients? The response affects thequestion that can be answered. If only existing clients are included, then one can ask what the impactis of offering an additional product to existing clients, but not what the impact is of offering the savingsproduct to the general public. The latter is a more interesting question to ask, typically. However, thereis a tradeoff: marketing to existing clients is much simpler, so if sample size is limited or client trust isimportant in the take-up decision, working with existing clients is advisable. In our study with theGreen Bank of Caraga in the Philippines, we opted for working with existing clients only in order toensure a high enough take-up rate to conduct the necessary statistical analysis.
�� �#"#�(���!��)���#����$���)!*
Ideally, the baseline survey will be conducted prior to the implementation (marketing or firstoffering) of the product. Otherwise, the product already will affect the savings behavior so that noaccurate data can be gathered on savings behavior prior to treatment. This is particularly true ofattitude questions, such as asking individuals about their satisfaction with their savings plans.
Box 4: Philippines Savings Project—Randomization Scheme
��� � �� � ��� ������� ���� ������� � ������� ������������ ���(��� *� ��� +#� ���� ��� ��� �� ���� ������������ ����� ������� ������� ����������� ��� �����1����� � ��������������� � ����� ,�������-#� ���� ���� ����� � ����� � �� ��#� ����� � ������� ��� ���� ��� �����!� �� ����� ������� ��#���� ��������� �������� ���� �� ��� !�%�������������������� ���������� ���������� ������������#� ������������1�#�� ��������������������#����������������� ��� �����!� ������������ ����� ������� �� ��#� �������� �� �������� ������� ��� ���� ��� �� ���� ����'� ����� ��� � ������� � ���� ,�*-� �� ���� ��� ���� ����������� ������� � �����6� ���� ������� � ������� � ���� ,�+-� ����� ����� ����������� ������#������������� �������������������������������������������� ��� ��������������������� ���������� ������������ ��������������� �����6����������� ��� ����,5-������������ ��!���������������� ����������������������������������������� ���#������������� ������ �������������������������� ��������� ���� �� ��� ������� ������!� ���� ���� ��� ������������� ���� ��� ���� ��� ��� ������� � ������ ����������� �������� ������ ��� � ���� ��� ���� � �����������!� ������ ���� ��������� �� ��� � �� � ��� �������� ����� ���������������� ������� � ������� ���� � ����������� � �����#���� �� ���� ������ ������ ��� ���� �� ���� � ���������� ������� ���!�� �������������� ��� ��������� �� � ���� �� �� ��� � �� � ��� ����� ���� �������������� ��� ����� ������ ��� ������� ����� ������� ���!� )� ��������� ���������� ����� �� ������������� �� ������� ���� ����� ��� ���� ������@�������#� ���� ���� ���������� ������� ������!
0��������� ��� ���� ���� ���� ��� � ���������� ��� ��������� ��� �����1�� � ���� � ���� ��� � ���� ����������������!������������� ������������ �������� �����#� � �����������������������������������!�$� �������#���������� � ���������������� ������ ��������@�������!������������� ������#����������������������� ��������������������������������������������� ���� ������������� ����� �������������������!���� �������������������������������� �� � ���#���� ����������� � ���� ���� ����� ��������� ��� � � ��������� ��� ���� ������� ����#� ��� ������������������������ ���� � ��� ���� �"������������ ������� ���!�/��� �������� ������ ��������������!�� ��� ���� ��� ���� ���� � �������� ��������� � ��������� ������ �����1��������������������� ������������ ������!� $���������� ���� �������������� ��������� ����� �� ��������� ����� �� � ���� ���� ����������� � �������� � � ������� ����� �� �� ��������� �����!

ERD Technical Note No. 8��������������� ������ ����������������� ������ ������������������
7
The duration of the study can be defined by the time that elapses between the baseline surveyand the follow-up survey. The important consideration here is whether the existence of cyclical, well-defined time-varying behavior of individuals affects the analysis. In most cases, savings, business in-vestment, agricultural investment, leisure expenses, and even intrahousehold allocation, fluctuatesaccording to cyclical patterns. This would not be a problem in either a cross-sectional or a panelanalysis if cycles were identical for all individuals. If there exist variations in cyclical behavior acrossindividuals, then problems may arise. Economic impact of the new product may falsely attribute behav-ioral changes due to variation in cyclical behavior to the effect of the new product. This problem isagain solved in theory by randomization: variation in cyclical behavior would not differ for treatmentand control groups if chosen randomly. However, the influence of cyclical behavior on economic issuesis so great that one would be well advised to insist on precaution beyond randomization. It is suggestedthat any follow-up survey be done in intervals of a year subsequent to the baseline analysis, so as toobserve the individual at the same point within the year.
������������������ ����+,������-
This section discusses the decision to conduct a baseline survey and the process for designingand implementing it. Much more extensive volumes have been written on this; we merely provide anoverview of some of the main issues. As mentioned earlier, a randomized control experimental evalu-ation does not require a household survey. The primary outcome of interest, both to policymakers andto the financial institutions, should be the savings held at that financial institution. A project withlimited resources could and should decide to forego the survey instrument and instead focus strictly onthe administrative data. Projects with more resources can and should, however, ask the importantquestions, such as impact on household welfare, which the full survey allows one to answer.
The motivation behind the baseline and follow-up surveys is to assess the broader economicimpact of a new product. In theory, the randomization of the treatment should allow the post interven-tion survey alone to form adequately similar treatment and control groups. However, performing abaseline study is beneficial in many ways. A baseline survey allows the researcher to control forrelevant observable characteristics that randomization did not adequately and evenly distribute acrossexperimental group assignment. This is more of a concern when working with a small sample or whenthere are many dimensions over which one wants to conduct analysis (gender, age, occupation, maritalstatus, etc.).
Furthermore, the baseline survey allows one to examine the characteristics that determinetake-up of the product (if in the treatment group). This can provide useful information for marketingpurposes and future product innovation. As an example, if only married women want the product, thenmarketing should be focused on them, or if only salaried employees seem to want the product, thenperhaps partnerships should be formed with large employers to promote the product.
���������� ������� � ������� ��� �������� � ���������� ������� ��� �������������� ��� ������� ��������������� ������ ������������������� �������
November 2003Nava Ashraf, Dean S. Karlan, Wesley Yin
8
�� �� #(�#�(��.���)�&�*
There are five main steps to designing a survey1: (i) defining the fundamental objective of thesurvey; (ii) choosing which modules to include in the survey, the objectives of each of these modules,and approximate length of each module; (iii) deciding on each question within each module in light ofthat module’s objective; (iv) integrating the modules into a draft questionnaire and translating it, ifneeded; and (v) field testing the questionnaire. Designing and testing the survey should be a jointventure between the researchers and the agency implementing the survey, in consultation with localpolicymakers and MFI staff. Each party brings a unique perspective that needs to be taken into ac-count in order to address the local context and culture, and to make sure the most relevant outcomesare included. A survey design process that includes all parties also minimizes any possible misunder-standing or mismeasurement of each question in the survey.
The fundamental objective of a survey that is going to evaluate a savings product is to providebaseline (pre-treatment) and updated (post-treatment) measures of the economic characteristics (or“outcome variables”) that are most likely to be affected by the new product. There is little reason togather costly data on characteristics that are not likely to change over the duration of the study as aresult of the product, unless one wants to analyze the impact of the product on subgroups of clients(e.g., gender will not change, but we care about gender because we want to know whether the productworks better for men or women). At the most basic level, we want to use the survey to assess whether anew product increases savings overall (not just in the bank account balances).2 This requires detailedmodules investigating the financial, agricultural, and enterprise assets of each participant. Gatheringdata on financial assets alone is inadequate because individuals store wealth in physical assets. Suchitems take the form of household utility or leisure goods, as well as enterprise assets. Indeed, it isplausible that while features of the new financial product are desirable and lead to increased accountholdings, overall savings is unchanged as the client liquidates physical assets. For predicting take-up,it is imperative to have accurate measures of income and expenditure flows, demographic characteris-tics, and measures of savings preferences.
Before discussing the separate modules of the survey, a final general point must be addressed:establishing the unit of observation. If the product is targeted for an individual, then the fundamentalunit of observation is the individual. Yet clearly, financial savings and borrowing is rarely an individualenterprise, especially when shared physical assets and financial obligations are considered. It is likelythat there exists substantial overlap between the client’s activities, and all the activities of the house-hold, even if the interviewee does not have direct control over certain activities, but merely providesfor them. A trade-off must be made between gathering data on all activities and holdings that therespondent and their increased savings may influence, and the cost of the survey. A careful selection ofwhich household-level activities are most relevant to the assessment of the product must also be madewith cost considerations. For all the modules discussed below, see Appendix 2 for sample modulestaken from the Philippines project baseline survey. This survey can and should be modified for otherprojects, as each project implementation has its own relevant and appropriate variables.3
�������������������������������������������������������������������� ������ ��� ���������������������������������� �� �������� ��� ��� ���� ���� ������� ��� ���� ��������� �������� ����� ��� ������������������������������������������������������������������������������ ������ ����������������������������������� ��� ��� ������ ��� ���� �� ������� ���� ������ ��� ������� �������� � !��� ��������� ���� ��������� ���� �������������������� �������� ���� ���� �������
ERD Technical Note No. 8��������������� ������ ����������������� ������ ������������������
9
�� �������� ��������
The purpose of this module is to gather data on basic personal relevant household character-istics. Personal information should include age, sex, education, ethnicity, religion, and employmentstatus and type. Additional information related to the household is also invaluable to assess generalfamily characteristics of the respondent of interest. Basic household-level variables to consider arevalue of property and landholdings, and estimates of monthly income of all adult household members.Appendix 2, Module I, provides a sample module on demographic variables.
Income estimates provide for a general categorization of household flows (see Box 5). Incometends to come in several forms: wages, pension, agriculture, business enterprise, and rental income.Since the unit of observation is the household, it is useful to ask about income flows of the respondentseparate from the other income earners. Depending on the source of income, the respondent may havedifficulty estimating monthly income. Poorer, nonwage earning individuals tend to earn daily or weeklywages. Buy/sell enterprise owners likewise tend to earn on shorter time intervals than wage earners.Allowing for a free response for the unit of time does not force the individual or the interviewer tomake extrapolations. Appendix 2, Module II, includes a sample module on labor income.
�� ����� ��������
The status and characteristics of property and landholding should be included in any modulediscussing physical assets (Appendix 3, Module III). In particular, renters and sharecroppers frequent-ly choose to buy or contribute payments for land they do not yet own. Note that it is common for the ploton top of which the primary residence is situated to be owned separately from any agricultural land. Achange in (status of) the ownership of the housing plot may signal an otherwise unidentifiable changein (a level of) wealth. Likewise, home improvements to roofing, flooring, etc., are also common im-provements made when financial situations improve. Questions regarding housing material, for exam-ple, offer a multitude of possible responses. If, a priori, the researcher is aware of general preferencerankings for goods, then spotting a change in roofing materials reveals income-elastic shifts towardinvestments in the home. Again, it is important to include local researchers and MFI staff in the designof the survey, to understand which home improvements might be more likely, and what are the prefer-ences rankings in a particular region of the survey. This local context is also important for interpretingbaseline welfare measures that involve housing characteristics.
As mentioned, gathering a detailed inventory of household physical assets is important toestimating total household savings. Savings can be stored in both liquid and physical assets. Home andagriculture related physical assets represent savings that are commonly shared by all individuals in thehousehold. Therefore, it is recommended that while the individual is the unit of observation, all largehousehold and agriculture related physical assets are included in the survey. Basic questions concern-ing ownership status and count should form the main components of this module.
Ideally, the researcher would like to ascertain the entire household inventory of physicalassets. In reality, this is impossible. The next best strategy is to focus on assets of substantial value.These items can be more realistically regarded as savings instruments because given their value, theyare more likely to be liquidated. This module should also establish the flow of physical assets throughthe household. This allows the researcher to place a currency figure on the total assets owned and onthe flow of purchases made by the household. However, unlike land and property assets, asking thepresent sales value may be difficult as individuals rarely have a good sense of the market for usedfurniture, electronics, and appliances.

November 2003Nava Ashraf, Dean S. Karlan, Wesley Yin
10
While total assets is a stock, the flow is a rate, which may be difficult to measure due to theinfrequent and lumpy nature of their expenditures. To gather information on flow, it may suffice to askwhether an item of a particular type had been purchased in the past year or so.
Agricultural assets can be similarly regarded. Since the investments and returns to agricultureand animals are frequently shared by all members of a household, there is no justification to inquireabout individual-specific agricultural activities separate from the larger household. The survey shouldgather inventory on animal stock, fertilizers, and farm implements at the household level. Note thatthere may be individuals who do not own land yet, but still engage in agricultural activity; and otherindividuals who do not engage in agricultural activity yet, but still own agricultural assets traditionallyassociated with farming (most commonly for animal husbandry). Animals, in particular, are often usedas savings devices in many cultures. Finally, land holdings can be more readily valued and quantified(area), and should be asked in any survey investigating assets.
Agricultural activity may be of interest beyond the purchasing of more agricultural imple-ments. Increased capital due to a new product may lead to changes in investment behavior beyond thepurchasing of physical assets. Such behavioral changes should be captured in the survey. Investmentquestions can be broad (topics include number of crops harvested or land utilization). Appendix 2,Module III, includes a sample module on physical assets.
In general, it is important to know the price of such assets to be able to value them, and howthe prices for such assets changed over the intervention period. The change in prices of these alterna-tive savings/investments devices—including both physical assets and financial assets relative to that ofsaving in a commitment savings account—could be a reason behind any changes in these assets wemight see. We would thus not be able to attribute changes in these assets to the new savings product.However, if the randomization is done correctly, this need not be a concern. Because subjects acrossmany subregions were randomly assigned to treatment control groups, there is no reason to believethat they would face systematically different changes in relative prices; thus changes in assets we seecan be more confidently attributed to the savings product, rather than to changes in the price of thoseassets. This is a further advantage of randomizing on the individual level, versus on a more regionallevel where it is possible that relative price ratios would change differentially.
Box 5: Philippines Savings Project—Income and Expenditure Patterns
/��� ����� � ���� ���� ��� ���� ���� �� ��� ���� ������ �� � �������� ������������� ���� ����������� �������� �����!������������������������������������������������������� ���������������������!�������� �#���������������������������� � ������������ ��������� ����� ,����� ����� ������-� ������������ ��������� ���� ����� ,����� ����������� ������-!�%����� ���������������������� � �� �������������������������������#����� ����������������� ������ ���������� ��� ��� �������� ���������������� ���� ���������� �� �������� ������ !
������ ���� ����#���� ���������� ������������������� �� ��������������� ���� ���� � ����������!�%����������� �������,������������ ��-����� ������ �����������������!������#��������� ����������A��������� �� ������� ��������������������,������������ ��-���������������#������������������������ �������������!�����������#�������� ������ �������������� ����� ������������������������ �������� ����� ����� � ���!�%������������� � ����#���� ��� ����� � � ������ ��� ��� ��� ���� ����������� � �����#� ��� ������������� � ��� ����� ������� ����� ������ ����� ������ ���� ��� ����������������� ������� �� � �����������!

ERD Technical Note No. 8��������������� ������ ����������������� ������ ������������������
11
�� ����������������
While there is substantial scope for intrahousehold sharing of enterprise assets, the ownershipand control of enterprises generally have more clearly defined demarcations. Therefore it is not neces-sary to survey the assets and activities of all household enterprises, but only those that are directlyaffected by changes in financial capital due to the new product.
As with the case of agricultural activities, enterprise activities should be investigated withrespect to the stock of physical investments, and to the broader shifts in investment behavior. Thesurvey should first identify all relevant household enterprises, ensuring that the fungibility of capitalacross household enterprises is accounted for. It is helpful to gather all responses for assets and invest-ment behavior for an enterprise before continuing to the next enterprise. Appendix 2, Module IV,provides a sample module for Nonagricultural Enterprise Assets.
�� ���� �����������������������
Of the modules suggested in this article, financial assets and liabilities may be the most diffi-cult for which to gather accurate data relevant to the assessment of the new product. Three main issuescharacterize this difficulty. First, and most fundamentally relevant to an investigation of financial be-havior, is that people pool financial resources. This is of critical importance because the first ordereffect of a financial product is a change to financial asset level. If sharing of financial assets occurs,then the study may be confounded from the beginning. Randomization can control for unidentifiablesharing of resources. However, if sharing occurs as a result of the product (household members usingthe new product of the client of interest), then bank data will have systematic positive measurementerror. As a result, it is important to inquire about the balances of all accounts owned by the client ofinterest, and the account balances owned by anyone who contributes to the new product of the client.
A second problem involves the reluctance of some individuals to reveal their account balanc-es. Naturally, the researcher already has access to individual bank account data. The researcher canverify the accuracy of the individual’s response. However, the main interest in these questions is todetermine total financial asset levels. Assets held in a bank with whom the researcher is not affiliatedwill not be estimated accurately if dishonesty plays a role in response. The most useful tactics theinterviewer can employ are to (i) ensure confidentiality (indeed, a common impediment to accurateresponses to savings is due to the fear of friends and relatives wanting to borrow money from theclient); (ii) explain the motivation of the research to alleviate suspicion; (iii) request that the interviewbe in private; and (iv) categorize the question in brackets so that the exact figure is not revealed.
A final difficulty is ensuring anonymity of the researcher. This is compromised if the interview-er reveals the collaboration between the MFI and the researcher, as clients may regard such a collab-oration with suspicion. Such collaboration may easily be revealed if the survey asks about balances ata particular institution. A useful tactic is to first ask where the client has accounts of a certain type.Then the interviewer is free to ask about account balances at the institutions of interest, inquiringabout each of the accounts at the institutions just named by the respondent. Indeed, the interviewershould already expect the name of the bank with whom she is collaborating to be named!
This section should also account for savings held at home and in informal savings and lendinggroups. Limited markets for microsavings and microfinance have created large markets for informalassociations and savings and lending clubs. Individuals with accounts at MFIs or at commercial banksmay still participate in savings groups. Such associations may incorporate desirable peer pressure andsocial commitment devices that formal finance markets may not provide.
November 2003Nava Ashraf, Dean S. Karlan, Wesley Yin
12
Finally, this section should include gifts and transfers that the household has received, as thesecan often be a large component of household income. Appendix 4, Module V, provides a samplemodule for financial assets and liabilities.
�� �)��#�(��.���)�&�*���(��.��
Once the various modules have been designed, care must be taken when bringing them togeth-er into the questionnaire to ensure that there are no overlaps in the individual questions acrossmodules. It is often hard to persuade households to sit for a very long survey, so repeats or extraneousquestions should be eliminated at this stage. However, careful attention should be paid to the trade-offbetween the time costs of repeated questions, and the benefits of consistency checks that only repeatedquestions can provide (see Box 6).
The questionnaire requires detailed formatting and translation into local languages—twoprocesses whose importance are often underestimated. While the developer of the questionnaire fullyunderstands the nuances of each question and the structure of logic across questions, the same cannotbe assumed of the respondent. The logic defining the flow of questions within a survey module may notbe immediately apparent to the respondent. Formatting the questionnaire with an apparent flow canfacilitate accurate data collection, and minimize both the survey subject’s discomfort with particularquestions and data entry errors. Other references provide a more detailed discussion of the implica-tions of a well-structured questionnaire.4 Translation of the questionnaire into local languages is alsotaken for granted. Fewer mistakes are made when the questionnaire is translated at the time of theinterview. It also ensures that the survey testing stage will better be able to discover undesired conno-tations of questions when asked in the local languages.
� �� �#�(���!��"'��"���#�(��.���)�&�*
Once the survey has been designed, brought together, and translated, it is critical that thesurvey be field-tested. The goal of a field test is to ensure that the questionnaires collect the informa-tion they are intended to collect (Grosh and Glewwe 2000). Every question should be properly testedin the field for clarity of wording, possibility of ambiguous response, and multiple interpretations; allresponses to the question must be anticipated and coded. The modules should be reassessed after thefield testing to make certain that all major activities, living arrangements, and sources of in-kind andcash income (where applicable, depending on the objectives of the survey) have been accounted for,and to delete any redundant or irrelevant questions. Finally, the questionnaire as a whole should bereassessed to make sure there are no variables that are unintentionally double-counted, and that thefull range of required information is collected. The field testing of the survey should be done by thesurvey designers, the survey research supervisor, and a few experienced surveyors.
After the survey is tested, reassessed and, if necessary, adapted, the survey team should betrained fully. The survey team should consist of a main research supervisor who will be involved indesigning and testing the survey and will train the surveyors and supervisors; several field supervisorswho will oversee the work of the surveyors; and a team of surveyors who will actually ask the questions.Once the surveyors and field supervisors have become very familiar with the survey and have beentrained on surveying skills such as not leading the interviewee when asking a question, probing wherenecessary, etc., they should do field trials with the survey. Once these field trails are done, and thesurvey team feels confident in their ability to conduct the questionnaire, the survey implementation
�"������������������� ��������������#��� ������$������������������ � ������ ������
ERD Technical Note No. 8��������������� ������ ����������������� ������ ������������������
13
officially begins.5 At the end of every day, the field supervisors should look over the surveys brought inand clarify anything that remains ambiguous with the surveyor who undertook the survey. The surveysare then ready for data entry.
If the researchers are particularly interested in conducting gender analysis to see if, for exam-ple, a certain product affected household decisions about resource allocation or changed intrahouse-hold conflicts, men and women should ideally be asked the questions separately, and not in eachother’s presence. It is also important to have enough women on the survey team so that women beingsurveyed feel comfortable being in a separate room alone with the surveyor.
This survey, as described above, provides baseline measures of welfare for the individual and/or household. Once the product is introduced, the researchers and MFI should jointly decide when thefollow-up survey should be implemented. The follow-up survey is essentially the same as the baselinesurvey, and provides a panel of the same household over the project period. The timing of the follow-up should be determined by when impact can reasonably be expected. For areas in which income
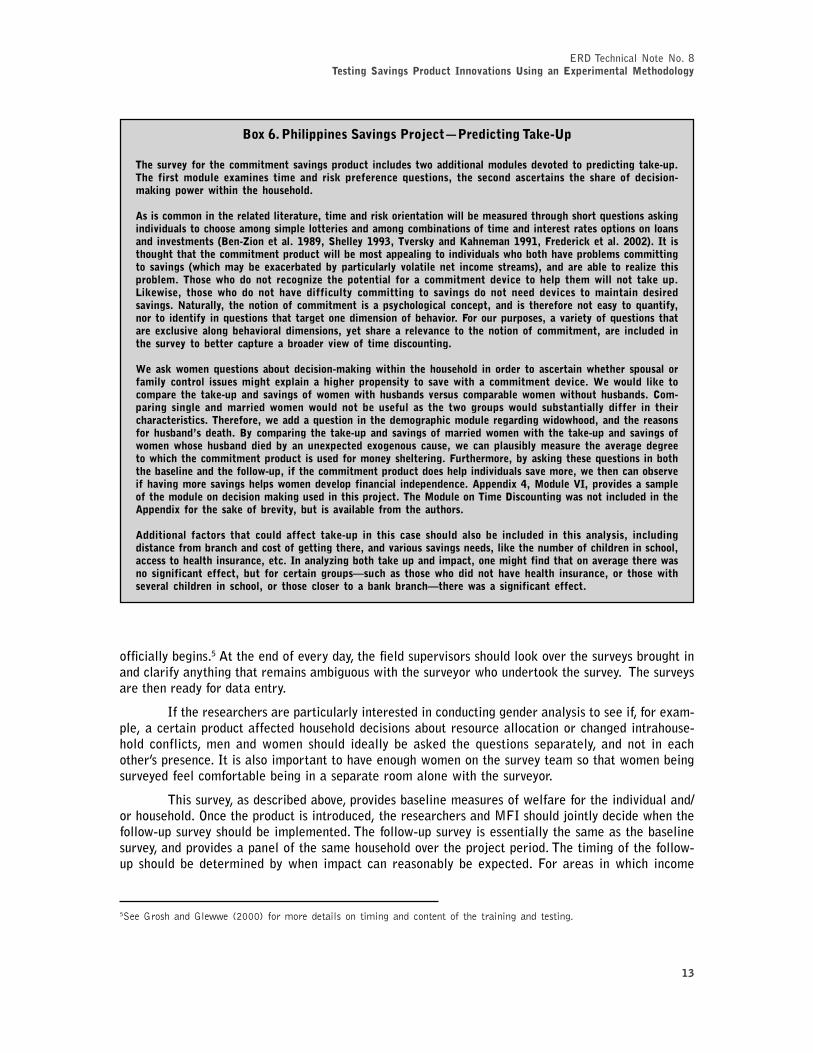
Box 6. Philippines Savings Project—Predicting Take-Up
������ ������ � ����������������������� ������ ��������� ��������������������������������� ������������ ��!���� �� ���������� �������� ����� ��� ���� � ��� ����� A��������#� ���� ������� ��� ����� ���� �� �� ��� �������� ���������� �������� �������������!
)������������������� ���������� �� �#��������� ����� ��������������������� ����� �������� ��A���������������������������������������������������� ��������������������������������������� ���� ����������������������������������,(�� B��������!�*>7>#��������*>>:#���� �������4������*>>*#�$ ��� ��������!�+..+-!���� ������������������������������ ������������������������������������������������������� �������������������� ������� ,������������ ���� ��������� ����� ��� �������� ���� ������� �� ���-#� ��� �� ���� ��� ���1�� ����� �����!� ���������� ��� ���� ������1�� ���� ��������� �� � � ����������� ������� ��� ����� ���������� ���� ���� ��!&�������#� ���������� ��� ���� ���� ����������� ����������� ��� ������� ��� ���� ����� �������� ���������� ���� ��������!�C�� ���#� ����������� ��� ����������� ��� � ������������� �������#� ��� ��� ��� ��� ������ ���� ���A������#�� � ��� ��������� ���A��������� ���� � ��������������������������� !�$� ��� ��� �����#��� ��������A��������� ��� �� ���������� ����������� �� ����������#� ���� �� �� � �������� ��� ����������� ��� ����������#� �� ��������� ������ �� ���� �������� � ���� �� �� ��� � �������� ����������������!
%�����������A��������� ����� �������� ������������� �������������� ��� � �� � ��� ��� ���������� � ������� � ������ ���� ��� ������������� ������� � ����� � � ��������� ��� ��������� � ����������� ������!�%�������� ����� ������ �� ���� ��� ��� ��� ������� �������������� �������� �� ���� ���� ������������������ �������!�5�� � ���� ������� ���� ���������������� ���� ��� ������� �� ���� ���� � ����������� ������������ ����� � ��� ���� �� ��� ������!���� ��� �#��������A�������� ������������ ������������ �� ��������������#�������� ������� �������@������!�(������ ���� ���� ��� ������ ����������� ��������������� ���� ��� ������ ��������������������� ��������������� ������������� ���������� ����#���� ���������������� �� ���� �� ������ ��������������������������� ������ ���������� ������������� ���!�$� ��� �� �#����������������A��������� �������������������������������� ��#�������������������� ��������������������������������� �#���������������� ������������� ������������������������������������� ������������!�)��������D#��������E�#�� ����������������������������������������������������������� �"���!��������������������9���������������������������������)�������� �� � ���� �������� �����#����� ���������� � ����������� �!
)��������� ���� �� ���� ������ ������ ��� ��� ��� ����� ���� ������� ���� ��� ��������� ��� ����� ������#� ������������������ ���� �������������������������� �#����� �����������������#��������������� ��������� ������������#������������������� ���#����!�������1������������������������#������������������������� ������ ������� ����������� ������#� ���� �� � �� ���� � ����F����� �� �������������� ���� ���� ������ ���� ���#� � � �������������� �� ����� ��� ��� ������#� � � ������ ����� � ��� � ����� ���F��� ����� � ����������� ������!
�"��������� ���������� ������� �������� ������ ��� ����� ��� �������� � � ���� ������ ��� �������

November 2003Nava Ashraf, Dean S. Karlan, Wesley Yin
14
follows clear annual cycles, the period after the intervention is started and before the follow-up shouldbe at least one year. Because the same households are asked about their assets before and after, theyshould not need to remember how much they had before. This helps avoid memory bias. However, careshould be taken to make sure that there is the same interview schedule across all households in boththe baseline and the follow-up survey, so that the timing for each is similar.
��������-���
The baseline survey has the potential to define the characteristics that determine take-up ofthe product conditional on having been offered it in the randomization. This analysis must be restrictedto those individuals who are offered the product. By comparing the characteristics of individuals whotake up the product when offered, against those who do not, the researcher can make statements aboutwhat characteristics influence the take-up decision of the client.
The impact analysis draws upon three data sources: baseline data, follow-up survey data, andall data gathered by the MFI. The latter includes basic data on balances and transaction history, aswell as other savings and loan products that the subjects were using or had available to them.
The effort spent on randomization has immediate returns in the analysis: the sophistication ofthe experimental research design allows for easier identification of estimated impacts of the newproduct.
The randomization of assignments should induce statistically similar pre-intervention treat-ment and control groups so that the post-intervention survey is sufficient for consistent estimation ofproduct impact. Under sufficiently successful randomization, simple averages between outcomes ofinterest in the post-treatment survey can be compared across the two groups. In theory this alone willdeliver consistent estimates on the impact of the new product. However, depending on the sampleincluded in the analysis, the estimated difference has different interpretations.
While treatment assignment is random, take-up within the treatment group is not, as discussedabove. Therefore a distinction exists between comparing the average outcomes across all clients in theexperimental groups, and comparing the average of the control individuals against those treatmentindividuals who took up the product. Comparing the outcome for treatment versus control groups canbe done through a simple OLS regression of the relevant outcome variable (e.g., for changes over thetime period in account balances or asset accumulation) on a dummy variable for treatment status. Sucha regression is no different than a simple comparison of means t-test to test whether the mean of twosamples (treatment and control) can be distinguished statistically. The coefficient on the treatmentdummy variable (whether this person was in the treatment group or not) is considered the Intent toTreat effect (ITT). This is an average of the causal effect of being offered the product. This is becausesince it is an average of all who were assigned to the treatment group and offered the product, itincludes both those who took up the product and those who did not. This might result in much lowerestimates of treatment effect than otherwise expected if the percentage of people offered the productwho actually took it up was low.
It is possible to try to “scale up” this ITT effect by the proportion of people who actually tookup the product. This provides an estimate of the effect of the product on those who used it, referred toas the Treatment on the Treated (TOT) effect. Although this is an important estimate, the subtle distinc-tion in the question it asks should be noted for policy purposes: This analysis answers the question“what is the impact of this product on clients who take it up?” and not “what is the impact of thisservice on clients who are offered this product?” For policy implications, this is very different if thosewho take up the product are fundamentally different than those who do not, and also in terms ofconducting cost-benefit analysis. This estimate is calculated through Two Stage Least Squares by using
ERD Technical Note No. 8��������������� ������ ����������������� ������ ������������������
15
assignment to treatment group as an instrument for actual treatment (since assignment to treatmentgroup was random and exogenous to the outcome variable we care about, but the take-up decision islikely correlated with outcomes of interest6). The instrumental variables approach is required for onesimple reason: the decision to take up a commitment savings product is likely to be highly correlatedwith overall desire to save more for the future. The key policy question requires understanding whatwould have happened if the commitment savings product were not offered in the marketplace. Individ-uals who took up the product, had the product not been offered, likely would have found some othermeans by which to save. For this reason, there must be some random variation in the access to theproduct in order to attribute its impact to the product, and not the overwhelming and unstoppabledesire of the client to save.
A word should be said about possible biases that may remain, and which can particularlyplague a randomized design. Foremost among these is attrition bias, the effect whereby members ofthe treatment group leave the sample, either by moving or by refusing the follow-up survey, etc. Inthese cases, the researchers will not have post-treatment data for a certain group of people who wereoriginally in the sample, and thus this group of people will have to be excluded from the analysis.However, it is likely that this attrition was not random. For example, perhaps the least motivatedpeople dropped out or the most economically vulnerable moved. This would bias the results, since theanalysis is now based on a nonrandom sample. With random assignment into control and treatmentgroups, and with analysis being based on assignment to treatment group, rather than actual treatmentstatus, one would hope that there should not be any reason why more or different types of people woulddrop out in the treatment group than in the control group. In the example of the Philippines, attritionbias would be an issue if members of a certain group were either more likely to move or more likely torefuse a follow-up survey, but since individuals were randomly selected this should not be the case. Inother examples of field experiments where treatment was given to certain schools but not others,attrition bias has been a significant problem as pupils actually moved from control schools to treatmentschools in order to receive the treatment. Since those pupils were still considered control groupsubjects, and their averages included in the control group average, this biased the results downward.
Another bias that is not as frequently a problem but should still be considered is the Haw-thorne effect where being followed in itself is a treatment. Thus, control households might adapt theirbehavior differently than they would have otherwise because they know that they will be interviewedand followed. This is likely to be a larger problem for studies that have very regular follow-up, asopposed to only once a year.
���������-���������������������������
This guide is not for every microfinance organization nor is it for every microfinance product.Rather, it is for the leaders, for the microfinance organizations interested in breaking into new territoryto learn more about specific impacts of new product designs that are new, promising, but unproven. Adonor funding such early-stage innovations should want generalizable results so that policy recommen-dations can be drawn and projects replicated and expanded. For this reason, there is a strong argument
�%�� ������ ��� ���� ��������� ��������� �� �� ����������� ������ ��� ��������&��� ����� ��� ���� ��� ������� ���� !'!� ������� %!!&���� �������� ��������������� ��� �� ����(� ��� ��������� ��� ���� ��������� ��� ���� ������� ���� ���� ���� ���������������� ���� ������ ��������)�� �������� ���� ��������� �� ��������*� ��� ��������� ��� ��������� ������ �� ������ �����*� ����� �������� ������ �������� ��� ��������� ���� ����� ���� ���������� ��������� +���� ���� ������ ����������� ��� ����������� ���� ���� � ���� �� ����������� ������ ���� ��������*� �� ��� ����� ���� ���� ��������� � ���� ��� ��������� ���� ����� � ���������������������������������� ������� ��
November 2003Nava Ashraf, Dean S. Karlan, Wesley Yin
16
�"���,�������� ��� �����(--�����������. �������� ��� �$�����������)� ���������� ������ ��� ����������� ��� /��������)��� ��� �������� ������ �������� ��� ���� ���� ����� ���������
to subsidize early-stage innovative work, such as the commitment savings products being tested cur-rently in the Philippines. This approach to testing innovations is true not just for microfinance, but alsofor development projects across most sectors.
The microfinance industry in particular is rampant with different lending and savings products,and little empirical research has shed insight into the relative merits (see Banerjee 2002), both to theinstitutions as well as the clients, of one product design relative to another. Comparing product successacross organizations, unfortunately, confounds organizational differences. In other words, did ProductA at Organization A work better than Product B at Organization B because the product design wasbetter, or because Organization A simply is better managed? There typically is little way to disentanglethe difference between the personnel and the difference between the products design. Valid productdesign testing must be done within organizations. Rigorous, experimental designs can inform microfi-nance organizations and donors worldwide about what works best (and for whom) and what does not.Such rigorous experimental designs should be carried out in addition to, and not in lieu of, importantqualitative research to help define and design innovative solutions.7 Once the idea is formulated andqualitatively the ideas seem to work, then quantitative experimental designs can draw robust conclu-sions, including cost-benefit analysis, to decide whether the project should be replicated and scaled.

ERD Technical Note No. 8��������������� ������ ����������������� ������ ������������������
17
���������/��������� �����+������������������*
The process for developing a new financial product is described in great detail in many other publica-tions, such as the Microsave Market Research for Microfinance (available: http://www.microsave.org),and the Microenterprise Best Practice publications on new product development (available: http://www.microsave.org). The bulk of this paper has focused on the proper evaluation of such new financialproducts. In this appendix, we will review the steps that are involved with developing a new productbefore it is to be tested.
Stage 1. Idea Generation
Ideas for new products come from many sources. Donors often suggest products that have been usedsuccessfully in other contexts. Researchers may provide ideas on new products based on their research.Exchange visits from other microfinance practitioners generate new ideas. Participation in conferenc-es contributes new insights, as does investigation of research provided on the Internet. Staff of aninstitution can provide ideas. And finally, probably the best source of ideas on new products is aninstitution's own clients. It is very important to listen to clients, and to the people within the institutionwho have direct contact with them, such as promoters, loan officers, and cashiers. Institutions caninstitutionalize a client feedback mechanism by establishing a client committee whose members pro-vide feedback, not only on new product ideas, but also on existing products and their delivery. Anothername for this committee might be quality control committee. Feedback from clients also comes fromloan officers and promoters in their regular meetings with supervisors.
Data analysis can contribute to generating new ideas for products. These data would include monitor-ing information as well as evaluation findings. Some indicators that might point to the need for a newproduct would be loan delinquency, drop out rates, inactive savings accounts, limited demand for aproduct, and seasonality of demand for savings or loans. This information can be bolstered by a marketstudy, discussed in the next section.
Stage 2. Development of a Product Concept ("Prototype")
Management may decide that a particular idea merits further discussion. Once management makesthat decision, the next step is to appoint or deputize a person to act as the coordinator of the effort. Thisperson has often been called the “champion” because s/he is responsible for overseeing the develop-ment of the product down to its final launching. This person can appoint a committee of staff (and evennonstaff) to assist in the work. This committee will be referred to in this document as the “productdevelopment committee”. It is helpful if the committee members represent the different departmentsof the institution. This is important so that the product development process incorporates differentfunctional aspects like the management of information, human resources, finances, and field staff.Nonstaff could include board members, clients, and/or consultants.
The first task of the committee is to gather more comprehensive information in order to develop adetailed product concept that responds to the market.
������������ �����������
A market study has two sides: supply and demand. A supply study investigates the supply, or offer, for aparticular product or service. Institutions that are conducting a supply study should be careful to
�������� ���� ����������� ���� � �������� ������ ������� ���� ���� ������� ����� ��/������

November 2003Nava Ashraf, Dean S. Karlan, Wesley Yin
18
maintain a broad definition of the concept of “supply.” This is not just a study of what the competitorsare offering. It is a study of all the options that people have for a particular service or product, which,in the example of a savings product, could include “in kind” savings vehicles, such as animals or land,or informal savings societies, like ROSCAS, as well as savings accounts in more formal institutions.
The basic questions that need to be addressed in a supply study are:
(i) What mechanisms are available in the market that meet this particular need,which in the case of commitment savings products, would be larger sums ofmoney for events (weddings, schools), assets (land, animals, machinery) or pro-ductive activities (planting, labor costs, working capital)?
(ii) What are the specific market niches? What type of person uses each differentservice?
(iii) What are the important features of the mechanism or service?(iv) What are the advantages and disadvantages to the user of the service?(v) What are the costs and the benefits (returns) of each service or product?
It is useful, before embarking on an activity of this sort, to draw up a scope of work, describing what isto be accomplished and how long it should take. This is especially important if outsiders are involvedin the data gathering.
���������������������������������������������
A demand study is intended to evaluate the demand for a product or service. The first step in thisprocess is to segment, or divide, a population in accordance with its financial needs. An example of amarket segment might be rural coffee farmers. It is likely that this segment will have common financialneeds that will, at the same, be different from other market segments, for example, urban womentraders. By segmenting a population by productive activity, socioeconomic status, household size, andother factors, it becomes easier to determine what a client's financial needs might be.
Once these segments have been defined, the study can use a variety of methodological tools andinformation sources to answer questions about the needs of a particular segment or niche of a popula-tion. These questions include the following:
(i) What is this person's economic situation?(ii) What does this person need money for?(iii) When does this person have money to invest or save in his/her business cycle?(iv) When does the business owner need money?(v) How does this person save money now?(vi) Why does s/he put aside capital in these ways?(vii) Do women have different needs for savings than men?
Answers to these questions may be different in different areas of the country, at different times of theyear, and at different stages in a business' growth, and at different moments in an individual's life. Goodmethodological tools will take these issues into account.
To gather information in a way that can be analyzed, methodological tools can be used, including focusgroups, semistructured interviews, individual interviews, and quantitative surveys. Each tool has ad-vantages and disadvantages, based on its complexity, cost, and time to administer and analyze. It isuseful to combine different types of tools, in order to double check ("triangulate") information receivedfrom different sources.

ERD Technical Note No. 8��������������� ������ ����������������� ������ ������������������
19
�������� �
The focus group is one methodological tool that tends to yield good results at low cost. These groupsare often used to refine demand, for quality control, and to hear opinions on prototypes. They can yieldvaluable information on the features of a product that are most important to a client, which are notnecessarily the cost. The following steps should be used when undertaking a focus group:
Step 1: Team Selection
The person facilitating the group should have experience in running a focus group, both in facilitatingand in analyzing the data that is yielded. The facilitator should speak the language of the participants.The facilitator is a person who understands that the purpose of the group is not to arrive at a consensusbut rather to investigate the depth of opinions and the reasons behind them. In addition to the facilita-tor, there should be a rapporteur, to record the information for later analysis. Both the facilitator andthe rapporteur should have a good knowledge of the country or context, and understanding of savingsproducts and client savings behavior. However, both will be careful not to let their preconceived ideasinfluence the discussion. In other words, they must remain objective and open-minded.
Step 2: Group Criteria Selection
The second step is to select the criteria by which group members will be chosen. Different groups canbe chosen using different criteria. In the case of focus groups on new savings products, one group mightbe composed of rural, poor women. Another might be composed of urban men with small businesses.Notice that the group selection criteria often correspond to the market segmentation criteria that werediscussed earlier. In cultures where women are subservient to men, the groups should be divided bygender.
Step 3: Fix the Venue
The place and time of the focus groups is very important. The groups should be held at a neutrallocation, at a convenient time of day for the participants, which does not interfere with the businessesor home activities. The place should be in a closed area, to avoid outsiders listening in, and quiet. Itshould be easily accessible to the participants. The discussion should last no more than two hours, andparticipants should be advised of this before the meeting so that they can arrange their activities.
Step 4: Prepare a Discussion Guide
A discussion guide is a general document for guiding the discussion, rather than a fixed questionnaire.For investigating the need for new savings products, the guide should include questions such as:
(i) How do you currently save, and why?(ii) What has been your success in saving for a particular event or need?(iii) What have been the difficulties that you have faced in saving for a particular
event or need?
Step 5: Conduct the Focus Group
The facilitator always begins by introducing her/himself as well as the rapporteur. S/he explains thepurpose of the interview, and thanks the participants for coming. S/he explains that the facilitatingteam is a group of independent researchers, and that the discussion is confidential. Only the generalopinions will be shared with others; people's names will not be identified. If an institution is doing focusgroups with its own clients, then the staff who most frequently interact with the clients in the groupshould not be facilitators, rapporteurs, or even observers.
After this, the facilitator begins with general questions that are designed to put people at ease. Grad-ually the discussion becomes more involved and more animated, as the facilitator directs the questions
November 2003Nava Ashraf, Dean S. Karlan, Wesley Yin
20
toward the purpose. Opinions should be solicited from all participants by the facilitator. No one personshould dominate. The facilitator should take care not to lead the participants to a particular answer,because it is quite common that the participants will say exactly what they think the facilitator wants tohear.
The rapporteur does not contribute to the discussion, but may pass small notes to the facilitator aboutwho needs to be drawn out, or if a question is not clear. The group will have been told during theintroduction that this might occur, so that the facilitator does not lose their trust. A useful device forrecording these discussions is a tape recorder, since it is difficult to write down everything that is beingsaid.
Step 6: Debrief
After the focus group is concluded, and before beginning another one, it is important to debrief andrecord impressions. The team sits together and the rapporteur reads the notes taken to see if clarifica-tion is necessary. The tape recording can be used to double check. At this time it is valuable to reviewthe guide, to make sure that the questions are adequate for the purpose.
Step 7: Analyze
After a day's work of focus groups, there should be analysis of the data. The words of the participantsare the data. This data can be analyzed by the following factors:
(i) intensity of opinion(ii) frequency of opinion(iii) personal experience vs. rumor or vague impression(iv) relationships between concepts
The analysis obtained from the focus group interviews can be supplemented by data from the othermethodological tools mentioned above.
������������������������
Other sources of information are previously collected government household datasets, governmentpublications, research studies, newspapers, and Internet websites. These can be valuable in providingbroader perspectives on macroeconomic and political trends, demographics, population and environ-mental changes, and other variables that might impact a new product.
�������������
Once the market study results have been analyzed, and each population segment's needs identified, itbecomes possible to design a prototype product for pilot testing. The prototype should specify each ofthe features of the product, which, for a commitment savings account product, might include:
(i) the minimum savings balance for opening an account(ii) deposit parameters(iii) withdrawal parameters (minimum periods, maximum periods)(iv) penalties for early withdrawal(v) rollover features(vi) exceptions to the regular features
Cost and MIS aspects of the product are also major considerations for an institution in new productdevelopment.

ERD Technical Note No. 8��������������� ������ ����������������� ������ ������������������
21
���������0�������������-�������� ��������������� ����+������������
�� ���������� �����
���� ������ ������ ���� �������������������������������������������������������������� ������� ����������������������������������������������������������� �
���� ��������������������� ��������� ����� ���������
��!� ����� �����"�������#��$��������������" ������ ������������������������������������������������������������ � ��������������� �������#��$�������������� ����������������������������� �
��������� ������������������������������������������������������ %&����� �������������������������������������������������������� '
���� ��������"����� �� ���� ��� ����������!!����� ������������������������������� ���� ����������������� � ��� ��������������������� ���� �������������!�������� ��������������� %��� ������� ������!�� � ��������������������� '
��� &���� �������� ��������������� (�� ������������������������������������������������������������� )*����� ��������������������������������������������������������� �*����� ��������������������������������������������������������� �*����% ��������������������������������������������������������� %*����' ��������������������������������������������������������� '*����+ ��������������������������������������������������������� +,���������*������� �������������������������������������� -��� ������������������������������������������������������������� .��� ������������������������������������������������������������� /��% ������������������������������������������������������������� 0�����!��*������� ���������������������������������� �)1!#2�!�3�� �*������� ���������������������������� ��3������ ������������������������������������������������������ ��3������ ������������������������������������������������������ �%3�����% ������������������������������������������������������ �'3�����*������� ������������������������������������������ �+4 �*������������� ���������������������������������� �-
�%�� 5����$�!������� 6� ���������������������������������������������������������������� �(7�8����'9 ��������������������������������������������� �
�%�� ������!���������������� �� ���$� 2����������!�������:���� ������"������������� ������ ����!���������������� ������!�������
�'� ����������������$�������� �� ���� ;,<3=>5,*>,�2��(52��(��,(21���2:��?
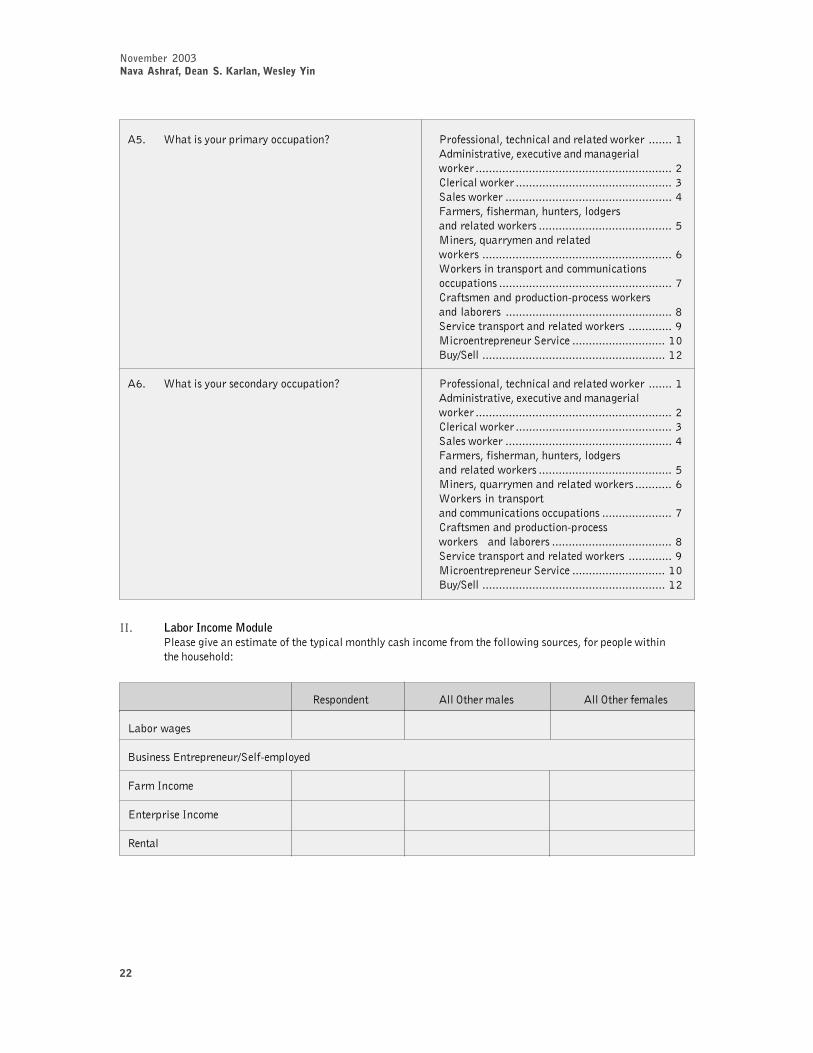
November 2003Nava Ashraf, Dean S. Karlan, Wesley Yin
22
�+� &���� ����������!!������ 4��� ����"��!���!��������������8�� ������� ������� �����$�"���!���$����������������8�� ����������������������������������������������������������� �3����!����8�� ����������������������������������������������� %���� ��8�� �������������������������������������������������� '������ "�� ������"������ "����� ������������8�� ���������������������������������������� +����� "@��������������������8�� ��������������������������������������������������������� -&�8�� ������ ������!�����!���� !!������ ���������������������������������������������������� .3���� ����������!���A��!� ��8�� ��������� �������������������������������������������������� /���$�!����� ���������������8�� ������������� 0��!����������������$�!� ���������������������������� �)B��#���� ������������������������������������������������������� ��
�-� &���� ��� �!�����!!������ 4��� ����"��!���!��������������8�� ������� ������� �����$�"���!���$����������������8�� ����������������������������������������������������������� �3����!����8�� ����������������������������������������������� %���� ��8�� �������������������������������������������������� '������ "�� ������"������ "����� ������������8�� ���������������������������������������� +����� "@��������������������8�� ����������� -&�8�� ������ ������!�����!���� !!������ ��������������������� .3���� ����������!���A��!� ��8�� ��������� ������������������������������������ /���$�!����� ���������������8�� ������������� 0��!����������������$�!� ���������������������������� �)B��#���� ������������������������������������������������������� ��
��� ������������� �����4��� ���$���� ��������������!��������!� ���!��������������� ��!� "������������������ ����C
�� ������ ���:�������� ���:����������
=�������
B� ��� ,�����������#����A�������
������!��
,������� ���!��
������

ERD Technical Note No. 8��������������� ������ ����������������� ������ ������������������
23
���� �������������� �����
�� ������������������������������% ��������� 8��D� ��$������!��!�����!������������ ��� !���� ��������������� �����������
��� ������������������C ,���� ������������������������������������������������������������ �B��� ��������������������������������������������������������� �3����� ���������������������������������������������������������� %&� ������������������������������������������������������������ '2��� #����������� ������������������������������������������ +:���� ;�4,3��6? ����������������������������������������� -
��� ������������ �����C ��8� ����# ��$����# !����������� ���������������� �(���#!��#��������!� ��������������������������������� �������#���� ����������������������������������������������� %��������������#��������������8 ����������� '4����������������������� �������������������������� +����!�!����#������ ���������������������������������� -3�����#������!8 #��������� �$��������� ������������������������������������������������������� .:���� ;�4,3��6? ����������������������������������������� /
�%� ������������ ���C ��8� ����# ��$����# !����������� ����������������� �(���#!��#��������!� ��������������������������������� �*��$���E����� ���������������������������������������������� %2��� #!������� ������������������������������������������������� ':���� ;�4,3��6? ����������������������������������������� +
�'� � ��� �� ������������������ 6� ���������������������������������������������������������������� ��� ���� 7��6,�"�F�42:�-9
( ����������������������������������������������������������������� �
�+� ��(:"����� �������������� ���� �������������������������������������������������������������� ����������� �������������������������������������������������� �:���� ;�4,3��6? ������������������������������������������ %5�G�8�� ���������������������������������������������������� '(������!���� ������������������������������������������������ +
�-� ������8��� ��������������� ����� ;&��2,2�,��:>(2�(4,�:��(52��,��������"����� �������������� �������� 7�:(2�=6"6,��=6",23�94�6�,(2��7&��2,00��2�,�:>�,�:=55:,�(:2 ��5,?��F,�(�2�==�,(24�6�,(2�9
��:>(2 7>(�2�:�3>��,(3692��,>(�2
�.� 3����� ������ ������������������� 6� ���������������������������������������������������������������� �(� ���������������������������������������������������������������� �7��(:"�F�42:BC3:(�>�,�5>��B=,�9
�/� ���� ����� �����������"����!����� ;&��2,2�,��:>(2�(4,�:�?����!��$����� 4
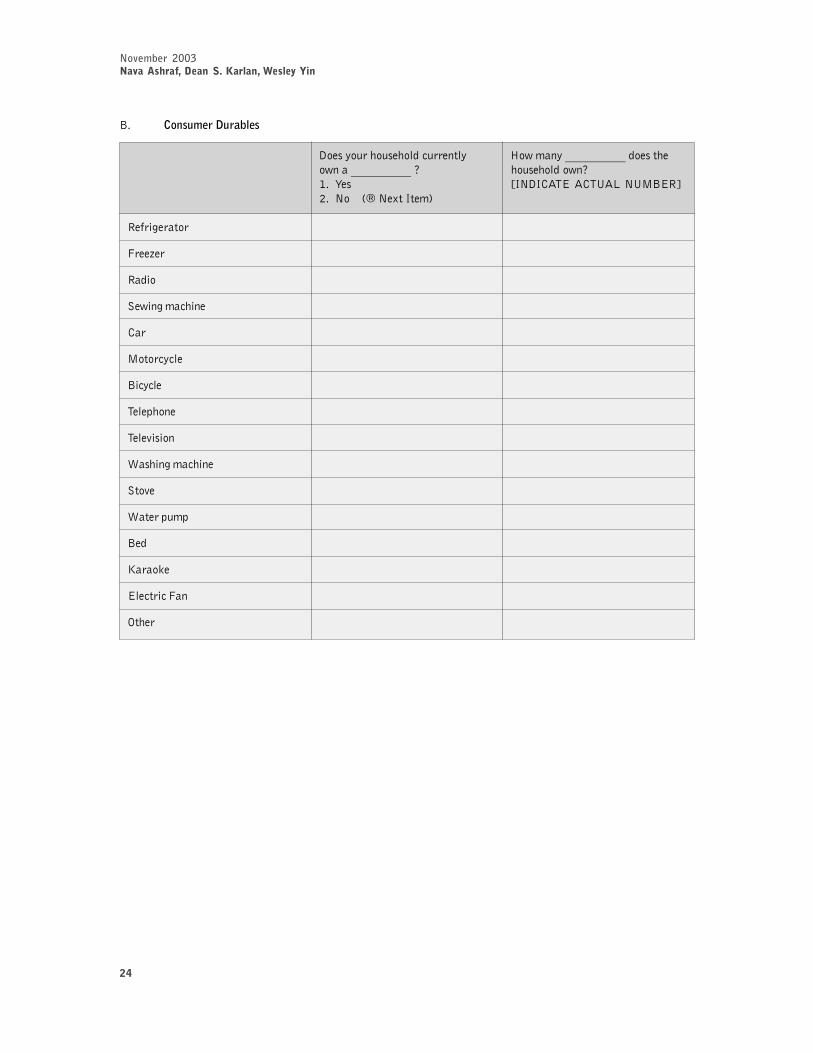
November 2003Nava Ashraf, Dean S. Karlan, Wesley Yin
24
B� �����������������
5� ����� ����!�������� ������HHHHHHHHHH�� ������HHHHHHHHHH �� ������ �� 6� ;�(5�3�2,�32>�=(>�B,�?�� (7I(�������9
�����������
����E��
����
��������!����
3��
���!�!��
B�!�!��
2�������
2���$� ��
&� ������!����
��$�
&��������
B��
F���8�
,��!���!���
:����

ERD Technical Note No. 8��������������� ������ ����������������� ������ ������������������
25
3� ������������������
�� ����
3�� 5� ��������������� ����� ����� 6� ���������������������������������������������������������������� �������!����������� � ( ����������������������������������������������������������������� �
7��(:"*:2:4������9
3�� &���� ������������� � ��������!������� 7���2�2,59���� � ������� ����
0#� 1��� ����� ���������� � ������� ��"�'�2'1�3
������ 0���4�� �������� 5!����������� ���������� ������� ������� #6����� ����� 71���"�� �� ���� 8
4���
4���
4��%
4��'
4��+
07� %�� ������������3
9�� ������������ 52� ������������ �
08� 1��� ����� ������� ���������� �������3
0:� ;��� ����� ������� ������� ��������3
'��� ���.������� �� 5"���������� ���� �<��� ��������� #
0=�� 1��� ����� ����� � ��������� ������ ����3
'��4�� �������� 5"���� �)��������� � �>��� ���������� #%��������"�����������6����� ��� 7�����?�� ��� 8'�����@@@@@�
�%���2"1+>5��6>'0++A!'�0B�'!;+>.1%"+���'�!'2+C!�64'!�
0B� 1��� ����� ��� ������������ ���3�0'2D+>!�>+�!'�"E�,+!+>�%��%D+2�%2'!;+>?2%!"�
0F� ;������� �������������� �������� ��� � �������������������������3�1>%!+D�4?+�'�64'!"'12+A�<9;'?"+.;'4A,+,<+>�"�
��� ?��

November 2003Nava Ashraf, Dean S. Karlan, Wesley Yin
26
5� ��������������������
5� ����� ������ ������HHHHHHHHHH�� ������HHHHHHHHHH �� ������ �� 6� �� (7I(�������9
��������
���� �������
����� �������
����
������
���� ����� ����
���������� ����� ����
��������
����� ��������
���� ��������
���� ��������
����
����� ����������� ����
���� ����������� ����
���������� !�����
��"������
������ #$��%&
���� #����&
������
���� #$�������&
���
����
'����
�������

ERD Technical Note No. 8��������������� ������ ����������������� ������ ������������������
27
,� ������������ ����������
����!���$��� ���� ������� ������� "��$����HHHHH������� ������� �$��������HHHHH"����� ��7&��2,��:>(2�(4,�:�9 �������������HHHHH
�� 6� ����!������������ �� (
�������E��
������
4� ��!���
�����!���
�����!���
�1� !������������������������������
�� "�������������������
��� :$������� ������� "�� ���������� 6� ����������������������������������������������������������� ��� ��������������A����!��������������� � ( ������������������������������������������������������������ ����!�����!� �� � ��$�!� " 7��(:"�F�42:�,32�:(1C�:>�,�:=5������ ��#��������� ��� ��(�(3��=���,2��(5=��B�=�2�,�9
��� &���8������������ ��� ����� ���������� 7���2�2,5"��(:(,&��2,009
�%� ��������� ����������� �������������� 7�2�2,2��,C�:(2�#6,��9
�'� &������������������������ � ���"�� �������� ����!� ������������������������ )������ �������� ����!� ���������������������� )����� ����� ��� ������������������������������������������ )%2������������8�� ����������������������������������� )'3����!����� ���!� �� �������������������������� )+��� ��� ������������������������������������������������� )-:������������!� �������������������������������������� ).����� ���������������������������������������������������� )/:���� 74=,��,�4,3��69
�+� &���8� ��!� �� ���������������� 7���2�2,59������������ �

November 2003Nava Ashraf, Dean S. Karlan, Wesley Yin
28
B� ��#����������$��������2������@�� ��� ��������������!����$���������!�������� ��� �����$���� "���� ���!��������!� ������A8���$������� ��� ��$�!� ��������!��$������� ������ ��� ��$�!� ��������������!��������!��������������� �"����� �����!��������� ��� ����������� ����������� � ������� �����
J�� ��� ��� ��� ��� J�� J�� ��� ��� :!� ($ 5�!
2���!��,������� ���$����������HHHHHHHHHH
2���!��,������� �,���������� ������HHHHHHHHHH
3� ����������������������8��� 8��@�� ��� �������� �� 7����� "�@�������"�������� "$���!�� "�� "��!�9������� �������� ��� �
����� ���" 5�������� ����!���� ������������� ��� �������� � ���������!�� � ����������� ������HHHHH"��HHHHH ����HHHHH �HHHHH ����!�!���� 6� � ( � 6� � ( �� �������7I(�������9 7I=� �K�� ���9 ����
,������� �:��
=���
B�������
,@�������#��������
���������
2� 7���&���!�"����� "��!�9
=����1���!��
�����1���!��
>����� ���*�
��!8#��$�����
,������� �2�
=���
B�������
,@�������#��������
���������
2�
=����1���!��
�����1���!��
>����� ���*�
��!8#��$�����

ERD Technical Note No. 8��������������� ������ ����������������� ������ ������������������
29
1� %�������������������������� �����
�� �#���2���������@�� ��� � 8�����$������������������������ �$��� �!!��� ����������!����� ������� ����� �
5� ��������� � ��� �!!��� &���� ���!�����������!��������� HHHHH ������ ���� L��������� ��$� �$��� �� �� 6� �HHHHH �� (�� 6� �� (7I�����!!�������9
3������ �� 6� 7��6,�9(����������������!�������!!���HHHHHHHHHH�!!��� �� (7*:2:(:(A*�,,(B�(F�33:>(29
����%�
��$��� �� 6� 7��6,�9(���������������� �$��� �!!���HHHHHHHHHH�!!��� �� (7*:2:(,<2�33:>(2264,9
2��� �� 6� 7��6,�9(����������������!�������!!���HHHHHHHHHH5�� �� �� (7*:2:(,<2�33:>(2264,9
����%�
4 �:���!�#(������ �� 6� 7��6,�9(����������������!�������!!���HHHHHHHHHH��$��� 3����� �� (7*:2:(,<2�33:>(2264,9
:����
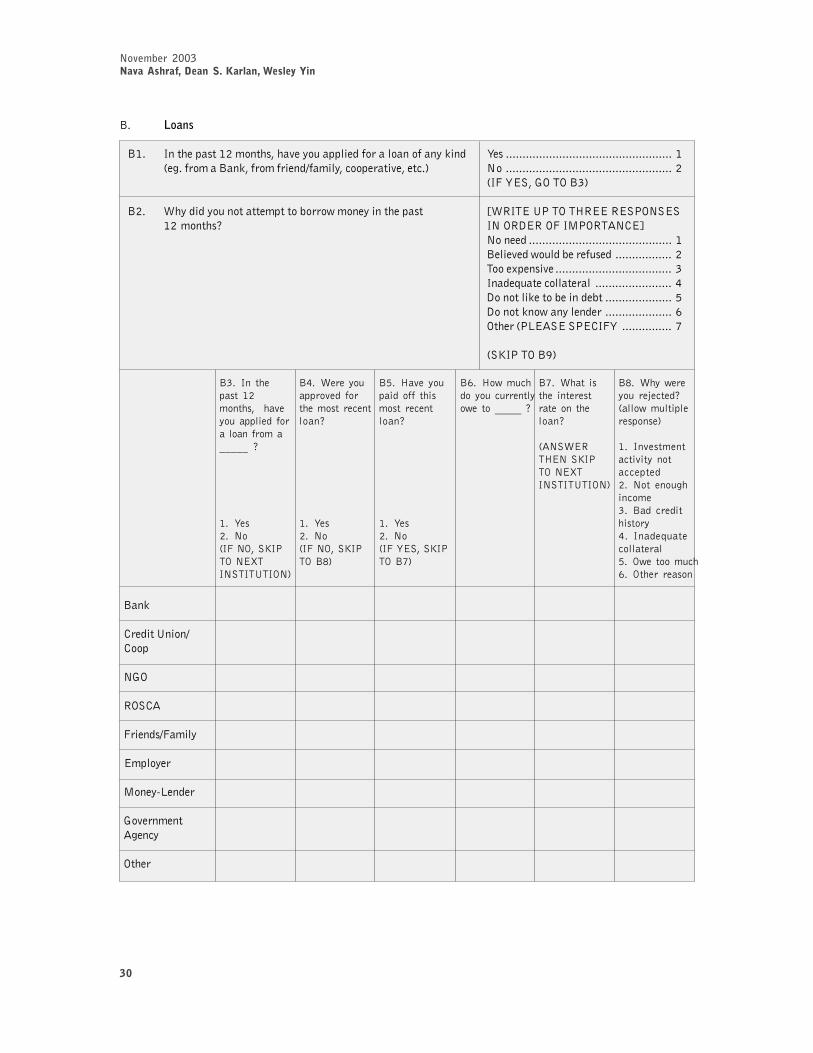
November 2003Nava Ashraf, Dean S. Karlan, Wesley Yin
30
B� �����
B�� ������� ������� "��$��������������������8��� 6� �������������������������������������������������� �7�������B��8"���������#������"!������$�"��!�9 ( �������������������������������������������������� �
7��6,�"*:2:B%9
B�� &�������������������������������� � ;&��2,>42:2��,,�,�4:(�,������� �(:�5,�:���4:�2�(3,?
(���� ������������������������������������������� �B����$������������ �� ����������������� �2����� �$� ����������������������������������� %�����@����!�������� ����������������������� '5����8���������� �������������������� +5��8����������� �������������������� -:����74=,��,�4,3��6 ��������������� .
7�F�42:B09
B��8
3�����>���#3�
(*:
�:�3�
������ #������
,������
����A=�����
*$�����������!�
:����
<#� %�� ������� 5��������� � ������� ������ ��� ���� ����@@@@@� 3
5� 9���� 2��%��2'��"G%6!'�2+C!%2"!%!?!%'2�
<7� 1���� ����������� ������ ����� ���������3
5� 9���� 2��%��2'��"G%6!'�<B�
<8� ;��� ������ � � �������� ���������3
5� 9���� 2��%��9+"��"G%6!'�<=�
<:� ;��� ������� ���� ������������� ��� @@@@@� 3
<=� 1��� ����� ����������� ��� ������3
��2"1+>!;+2�"G%6!'�2+C!%2"!%!?!%'2�
<B� 1����������� �� �����3������ ����������������
5� %��������������� ������������ 2��� �����������#� <�� �����������7� %���/�����������8� '��� ���� ����:� '����� �����
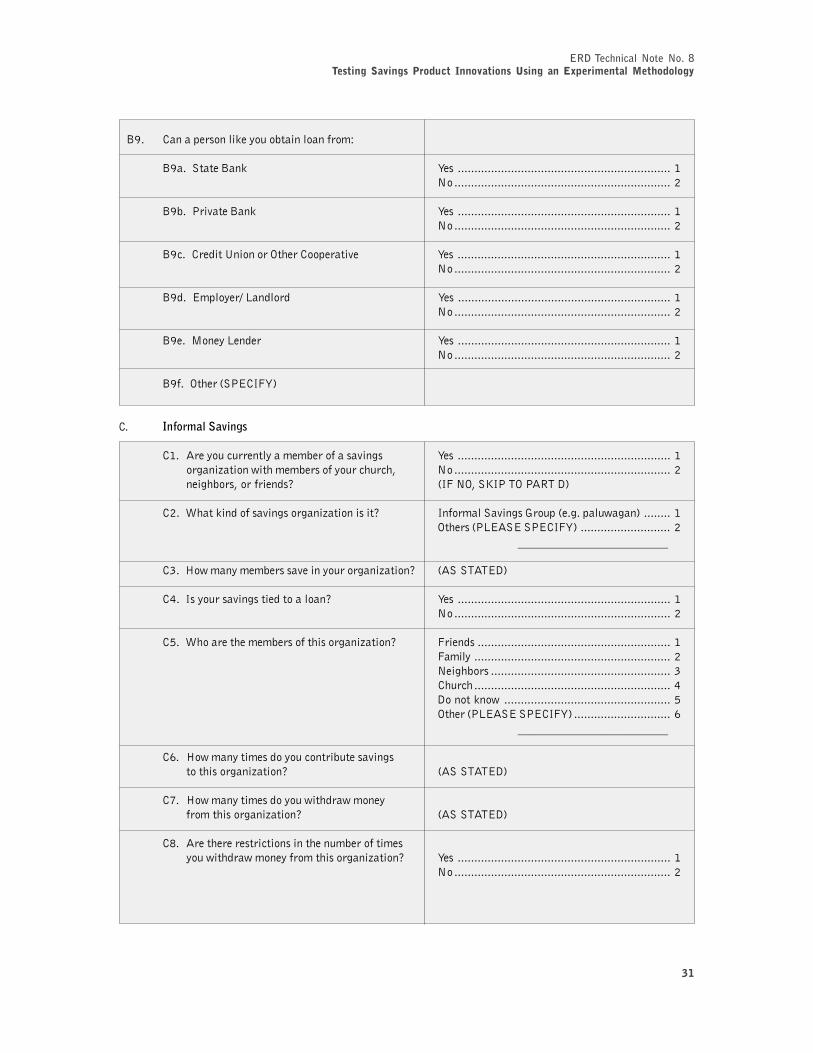
ERD Technical Note No. 8��������������� ������ ����������������� ������ ������������������
31
B0� 3������ ���8��������������C
B0�� �����B��8 6� ���������������������������������������������������������������� �( ����������������������������������������������������������������� �
B0�� 4��$���B��8 6� ���������������������������������������������������������������� �( ����������������������������������������������������������������� �
B0!� 3�����>����:����3������$� 6� ���������������������������������������������������������������� �( ����������������������������������������������������������������� �
B0�� ,������#=������ 6� ���������������������������������������������������������������� �( ����������������������������������������������������������������� �
B0�� ����=����� 6� ���������������������������������������������������������������� �( ����������������������������������������������������������������� �
B0�� :����7�4,3��69
3� ��&������ �#���
3�� �����!����������������� �$��� 6� ���������������������������������������������������������������� ������E�������������� ����!���!�" ( ����������������������������������������������������������������� �������� "������� 7��(:"�F�42:4��259
3�� &���8���� �$��� �����E����� �� ���������$��� *���7�������������9 �������� �:���� 74=,��,�4,3��69 ��������������������������� �HHHHHHHHHHHHHHHHHHHHHHHHH
3%� ������������ �$�����������E���� 7���2�2,59
3'� � ��� �$��� ��������� 6� ���������������������������������������������������������������� �( ����������������������������������������������������������������� �
3+� &������������� ���� �����E���� ������ ���������������������������������������������������������� ������� ����������������������������������������������������������� �(������ ������������������������������������������������������ %3���!� ����������������������������������������������������������� '5��8�� �������������������������������������������������� +:����74=,��,�4,3��69 ����������������������������� -HHHHHHHHHHHHHHHHHHHHHHHHH
3-� ���������� ���!�������� �$��� ���� �����E���� 7���2�2,59
3.� ���������� ��������������������� �����E���� 7���2�2,59
3/� ���������� ���!��� ���������������� �������������������� �����E���� 6� ���������������������������������������������������������������� �
( ����������������������������������������������������������������� �

November 2003Nava Ashraf, Dean S. Karlan, Wesley Yin
32
3� ����������
5�� ������� ������� "�� ����� ����� 6� ���������������������������������������������������������������� ������� ������ ��!��$���������� ( ����������������������������������������������������������������� ��� ������ � ������������� 7��(:"�F�42:�,32�:(19������ ���� ���������C��������$� ��$����� ������"!���� ������������"���������� ��������
5�� �������������$���$��� � ���!�������� ������ ����������� �������
A#� %�� ���� ���� 5��������� ���� ������ ����� ����������� � � �������������� ������� ���� @@@@@� 3
�?��� ����/������� � � �.)��� ��������� ����������� �������������
A7� %�� ����������� ����� ��@@@@@� ����� ��� ���� �� ������� � ���� ���������3
5� 9���� 2�
A8� ;��� �����������������@@@@@� ����� ����������3
A:� 1��� �� ������ ������ ���@@@@@� ����� ����������3
5� 0���� "�������� +�������+$������#� ,����+$������7� 1�����8� ������:� %���������� �;�����������������=� 6������� � � ������� � ����B� '����
A=� ,���� ������������� �������� �������� ������� @@@@@@@@@� 3
5� 9���� 2�
A�����5
A������
A�����#

ERD Technical Note No. 8��������������� ������ ����������������� ������ ������������������
33
1�� ������' �(��� ������7:(=6�:��,��=,�,�4:(5,(2�9�����������
�� %������
��� ����������������� ������ 7���2�2,59HHHHHHHHHHHHHHHHHH
B� )��������������� �(��
3�� &���!��� ����������� � ���� 6���� ���� :��������� :�������� � ;���,�4:(�,��B:2���FC������������ ����M ��!� �����!��!���������!� �� �����!����!�"�� ���!� ���������$��� ?
7��B:2�9&� �5�!� ��&���4��$���
&��� ������������������ � &��� ������������������ ��� ���� ������������ � �� ���� ����������� �
&�5�!��� B�� ������������������ % B�� ����������������� %:���� ���������������� ' :���� ��������������� '
�� &���������������8��������!8������������
�� &�������������� �$������ ������� ���� �!�� ����"21"��!�
!� ������!����������$��
�� &������������������������ ��
�� *�$����� � ���!���� ������������ "��A��� " ������ ��!�
�� B��������� ����� ����������
�� ������������������� �������� �!�� L��������"!��"�� �"������!�
L� &�8����� �������� �����
8� ������������� ��$�!� �� ��$����

November 2003Nava Ashraf, Dean S. Karlan, Wesley Yin
34
�� ������
Angrist, J., and A. Krueger, 2001. “Instrumental Variables and the Search for Identification: FromSupply and Demand to Natural Experiments.” Journal of Economic Perspectives 15(4):69-87.
Angrist, J., E. Bettinger, E. Bloom, E. King, and M. Kremer, 2002. “Vouchers for Private Schoolingin Colombia: Evidence from a Randomized Natural Experiment.” American Economic Re-view 92(5):1535-58.
Banerjee, A., 2002. The Uses of Economic Theory: Against a Purely Positive Interpretation ofTheoretical Results. MIT Department of Economics Working Paper.
Ben-Zion, U., A. Rapoport, and J. Yagil, 1989. “Discount Rates Inferred from Decisions: An Experi-mental Study.” Management Science 35:270-84.
Boruch, R. F., 1996. Randomized Experiments for Planning and Evaluation: A Practical Guide,Volume 44. University of Pennsylvania, Philadelphia, SAGE Publications.
Boruch, R. F., no year. “Randomized Experiments for Planning and Evaluation: A Practical Guide.”In Applied Social Research Methods Series, Vol. 44. University of Pennsylvania, Philadel-phia, SAGE Publications.
Duflo, E., and E. Saez, 2003. “The Role of Information and Social Interactions in Retirement PlanDecisions: Evidence from a Randomized Experiment.” Mimeo.
Frederick, S., G. Loewenstein, and T. O’Donoghue, 2002. “Time Discounting and Time Preference ACritical Review.” Journal of Economic Literature XL:351-401.
Glewwe, P., M. Kremer, S. Moulin, and E. Zitzewitz, 2000. Retrospective vs. Prospective Analyses ofSchool Inputs: The Case of Flip Charts in Kenya. NBER Working Paper 8018, NationalBureau of Economic Research, Massachusetts. Forthcoming in Journal of DevelopmentEconomics.
Grosh, M., and P. Glewwe, eds, 2000. Designing Household Survey Questionnaires for DevelopingCountries: Lessons from 15 years of the Living Standards Measurement Study. Interna-tional Bank for Reconstruction and Development/the World Bank Group, Washington, D. C.
Katz, K., and J. Liebman, 2001. “Moving to Opportunity in Boston.” Quarterly Journal of EconomicsMay.
Kremer, M., 2003. “”Randomized Evaluations of Educational Programs in Developing Countries:Some Lessons.” Forthcoming in American Economic Review Papers and Proceedings.
Matin, I.,2002. New Thinking and New Forms of Microfinancial Service Provision in Bangladesh: AComparative Study of ASA, SafeSave and Gono Bima. Finance and Development WorkingPaper No. 37.
MDRC, 2001. “MDRC Working Papers on Research Methodology Extending the Reach of Random-ized Social Experiments: New Directions in Evaluations of American Welfare-to-Work.”Available: www.mdrc.org/Reports2001/newdirections-methodologywrkppr/Methodology-NewDirections.pdf.
Meyer, B. D., 1995. “Natural and Quasi-experiments in Economics.” Journal of Business and Eco-nomic Statistics 13(2):151-61.
Miguel, E., and M. Kremer, 2001. Worms: Identifying Impacts on Education and Health in thePresence of Treatment Externalities. NBER Working Paper 8481, National Bureau of Eco-nomic Research, Massachusetts. Forthcoming in Econometrica.

ERD Technical Note No. 8��������������� ������ ����������������� ������ ������������������
35
Robinson, M. S, 2002. The Microfinance Revolution Volume 2: Lessons from Indonesia. World Bank,Washington, D. C.
Shelley, M. K., 1993. “Outcome Signs, Question Frames and Discount Rates.” Management Science39:806-15.
Tversky, A., and D. Kahneman, 1991. “Loss Aversion in Riskless Choice: A Reference DependentModel.” Quarterly Journal of Economics 106:1039-61.
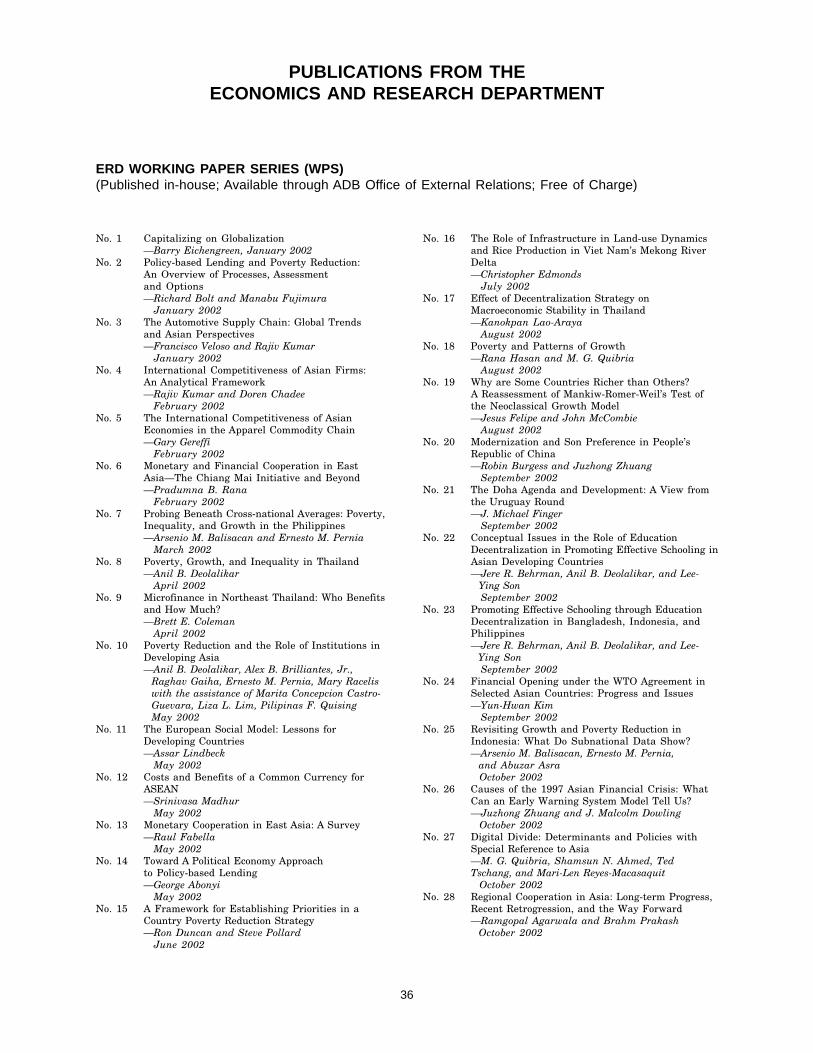
36
PUBLICATIONS FROM THEECONOMICS AND RESEARCH DEPARTMENT
ERD WORKING PAPER SERIES (WPS)(Published in-house; Available through ADB Office of External Relations; Free of Charge)
No. 1 Capitalizing on Globalization—Barry Eichengreen, January 2002
No. 2 Policy-based Lending and Poverty Reduction:An Overview of Processes, Assessmentand Options—Richard Bolt and Manabu Fujimura
January 2002No. 3 The Automotive Supply Chain: Global Trends
and Asian Perspectives—Francisco Veloso and Rajiv Kumar
January 2002No. 4 International Competitiveness of Asian Firms:
An Analytical Framework—Rajiv Kumar and Doren Chadee
February 2002No. 5 The International Competitiveness of Asian
Economies in the Apparel Commodity Chain—Gary Gereffi
February 2002No. 6 Monetary and Financial Cooperation in East
Asia—The Chiang Mai Initiative and Beyond—Pradumna B. Rana
February 2002No. 7 Probing Beneath Cross-national Averages: Poverty,
Inequality, and Growth in the Philippines—Arsenio M. Balisacan and Ernesto M. Pernia
March 2002No. 8 Poverty, Growth, and Inequality in Thailand
—Anil B. DeolalikarApril 2002
No. 9 Microfinance in Northeast Thailand: Who Benefitsand How Much?—Brett E. Coleman
April 2002No. 10 Poverty Reduction and the Role of Institutions in
Developing Asia—Anil B. Deolalikar, Alex B. Brilliantes, Jr.,
Raghav Gaiha, Ernesto M. Pernia, Mary Raceliswith the assistance of Marita Concepcion Castro-Guevara, Liza L. Lim, Pilipinas F. QuisingMay 2002
No. 11 The European Social Model: Lessons forDeveloping Countries—Assar Lindbeck
May 2002No. 12 Costs and Benefits of a Common Currency for
ASEAN—Srinivasa Madhur
May 2002No. 13 Monetary Cooperation in East Asia: A Survey
—Raul FabellaMay 2002
No. 14 Toward A Political Economy Approachto Policy-based Lending—George Abonyi
May 2002No. 15 A Framework for Establishing Priorities in a
Country Poverty Reduction Strategy—Ron Duncan and Steve Pollard
June 2002
No. 16 The Role of Infrastructure in Land-use Dynamicsand Rice Production in Viet Nam’s Mekong RiverDelta—Christopher Edmonds
July 2002No. 17 Effect of Decentralization Strategy on
Macroeconomic Stability in Thailand—Kanokpan Lao-Araya
August 2002No. 18 Poverty and Patterns of Growth
—Rana Hasan and M. G. QuibriaAugust 2002
No. 19 Why are Some Countries Richer than Others?A Reassessment of Mankiw-Romer-Weil’s Test ofthe Neoclassical Growth Model—Jesus Felipe and John McCombie
August 2002No. 20 Modernization and Son Preference in People’s
Republic of China—Robin Burgess and Juzhong Zhuang
September 2002No. 21 The Doha Agenda and Development: A View from
the Uruguay Round—J. Michael Finger
September 2002No. 22 Conceptual Issues in the Role of Education
Decentralization in Promoting Effective Schooling inAsian Developing Countries—Jere R. Behrman, Anil B. Deolalikar, and Lee-
Ying SonSeptember 2002
No. 23 Promoting Effective Schooling through EducationDecentralization in Bangladesh, Indonesia, andPhilippines—Jere R. Behrman, Anil B. Deolalikar, and Lee- Ying Son
September 2002No. 24 Financial Opening under the WTO Agreement in
Selected Asian Countries: Progress and Issues—Yun-Hwan Kim
September 2002No. 25 Revisiting Growth and Poverty Reduction in
Indonesia: What Do Subnational Data Show?—Arsenio M. Balisacan, Ernesto M. Pernia, and Abuzar Asra October 2002
No. 26 Causes of the 1997 Asian Financial Crisis: WhatCan an Early Warning System Model Tell Us?—Juzhong Zhuang and J. Malcolm Dowling October 2002
No. 27 Digital Divide: Determinants and Policies withSpecial Reference to Asia—M. G. Quibria, Shamsun N. Ahmed, TedTschang, and Mari-Len Reyes-Macasaquit October 2002
No. 28 Regional Cooperation in Asia: Long-term Progress,Recent Retrogression, and the Way Forward—Ramgopal Agarwala and Brahm Prakash
October 2002

37
ERD TECHNICAL NOTE SERIES (TNS)(Published in-house; Available through ADB Office of External Relations; Free of Charge)
No. 1 Contingency Calculations for EnvironmentalImpacts with Unknown Monetary Values—David Dole February 2002
No. 2 Integrating Risk into ADB’s Economic Analysisof Projects—Nigel Rayner, Anneli Lagman-Martin,
and Keith Ward June 2002
No. 3 Measuring Willingness to Pay for Electricity—Peter Choynowski July 2002
No. 4 Economic Issues in the Design and Analysis of aWastewater Treatment Project—David Dole
July 2002
No. 5 An Analysis and Case Study of the Role ofEnvironmental Economics at the AsianDevelopment Bank—David Dole and Piya Abeygunawardena
September 2002No. 6 Economic Analysis of Health Projects: A Case Study
in Cambodia—Erik Bloom and Peter Choynowski
May 2003No. 7 Strengthening the Economic Analysis of Natural
Resource Management Projects—Keith Ward
September 2003No. 8 Testing Savings Product Innovations Using an
Experimental Methodology—Nava Ashraf, Dean S. Karlan, and Wesley Yin
November 2003
No. 29 How can Cambodia, Lao PDR, Myanmar, and VietNam Cope with Revenue Lost Due to AFTA TariffReductions?—Kanokpan Lao-Araya
November 2002No. 30 Asian Regionalism and Its Effects on Trade in the
1980s and 1990s—Ramon Clarete, Christopher Edmonds, andJessica Seddon Wallack
November 2002No. 31 New Economy and the Effects of Industrial
Structures on International Equity MarketCorrelations—Cyn-Young Park and Jaejoon Woo
December 2002No. 32 Leading Indicators of Business Cycles in Malaysia
and the Philippines—Wenda Zhang and Juzhong Zhuang
December 2002No. 33 Technological Spillovers from Foreign Direct
Investment—A Survey—Emma Xiaoqin Fan
December 2002No. 34 Economic Openness and Regional Development in
the Philippines—Ernesto M. Pernia and Pilipinas F. Quising
January 2003No. 35 Bond Market Development in East Asia:
Issues and Challenges—Raul Fabella and Srinivasa Madhur
January 2003No. 36 Environment Statistics in Central Asia: Progress
and Prospects—Robert Ballance and Bishnu D. Pant
March 2003No. 37 Electricity Demand in the People’s Republic of
China: Investment Requirement andEnvironmental Impact—Bo Q. Lin
March 2003No. 38 Foreign Direct Investment in Developing Asia:
Trends, Effects, and Likely Issues for the
Forthcoming TWO Negotiations—Douglas H. Brooks, Emma Xiaoqin Fan,and Lea R. Sumulong
April 2003No. 39 The Political Economy of Good Governance for
Poverty Alleviation Policies—Narayan Lakshman
April 2003No. 40 The Puzzle of Social Capital
A Critical Review—M. G. Quibria
May 2003No. 41 Industrial Structure, Technical Change, and the
Role of Government in Development of theElectronics and Information Industry inTaipei,China—Yeo Lin
May 2003No. 42 Economic Growth and Poverty Reduction
in Viet Nam—Arsenio M. Balisacan, Ernesto M. Pernia, andGemma Esther B. Estrada
June 2003No. 43 Why Has Income Inequality in Thailand
Increased? An Analysis Using 1975-1998 Surveys—Taizo Motonishi
June 2003No. 44 Welfare Impacts of Electricity Generation Sector
Reform in the Philippines—Natsuko Toba
June 2003No. 45 A Review of Commitment Savings Products in
Developing Countries—Nava Ashraf, Nathalie Gons, Dean S. Karlan,and Wesley Yin
July 2003No. 46 Local Government Finance, Private Resources,
and Local Credit Markets in Asia—Roberto de Vera and Yun-Hwan Kim
October 2003July 2003

38
ERD POLICY BRIEF SERIES (PBS)(Published in-house; Available through ADB Office of External Relations; Free of charge)
No. 1 Is Growth Good Enough for the Poor?—Ernesto M. Pernia, October 2001
No. 2 India’s Economic ReformsWhat Has Been Accomplished?What Remains to Be Done?—Arvind Panagariya, November 2001
No. 3 Unequal Benefits of Growth in Viet Nam—Indu Bhushan, Erik Bloom, and Nguyen MinhThang, January 2002
No. 4 Is Volatility Built into Today’s World Economy?—J. Malcolm Dowling and J.P. Verbiest,February 2002
No. 5 What Else Besides Growth Matters to PovertyReduction? Philippines—Arsenio M. Balisacan and Ernesto M. Pernia,February 2002
No. 6 Achieving the Twin Objectives of Efficiency andEquity: Contracting Health Services in Cambodia—Indu Bhushan, Sheryl Keller, and BradSchwartz,March 2002
No. 7 Causes of the 1997 Asian Financial Crisis: WhatCan an Early Warning System Model Tell Us?—Juzhong Zhuang and Malcolm Dowling,June 2002
No. 8 The Role of Preferential Trading Arrangementsin Asia—Christopher Edmonds and Jean-Pierre Verbiest,July 2002
No. 9 The Doha Round: A Development Perspective—Jean-Pierre Verbiest, Jeffrey Liang, and LeaSumulong
July 2002No. 10 Is Economic Openness Good for Regional
Development and Poverty Reduction? ThePhilippines—E. M. Pernia and P. F. Quising
October 2002No. 11 Implications of a US Dollar Depreciation for Asian
Developing Countries—Emma Fan
July 2002
No. 12 Dangers of Deflation—D. Brooks and P. F. Quising
December 2002No. 13 Infrastructure and Poverty Reduction—
What is the Connection?—I. Ali and E. Pernia
January 2003No. 14 Infrastructure and Poverty Reduction—
Making Markets Work for the Poor—Xianbin Yao
May 2003No. 15 SARS: Economic Impacts and Implications
—Emma Xiaoqin FanMay 2003
No. 16 Emerging Tax Issues: Implications of Globalizationand Technology—Kanokpan Lao Araya
May 2003No. 17 Pro-Poor Growth: What is It and Why is It
Important?—Ernesto M. Pernia
May 2003No. 18 Public–Private Partnership for Competitiveness
—Jesus FelipeJune 2003
No. 19 Reviving Asian Economic Growth Requires FurtherReforms—Ifzal Ali
June 2003No. 20 The Millennium Development Goals and Poverty:
Are We Counting the World’s Poor Right?—M. G. Quibria
July 2003No. 21 Trade and Poverty: What are the Connections?
—Douglas H. BrooksJuly 2003
No. 22 Adapting Education to the Global Economy—Olivier DupriezSeptember 2003
SERIALS(Co-published with Oxford University Press; Available commercially through Oxford University PressOffices, Associated Companies, and Agents)
1. Asian Development Outlook (ADO; annual)$36.00 (paperback)
2. Key Indicators of Developing Asian and Pacific Countries (KI; annual)$35.00 (paperback)
JOURNAL(Published in-house; Available commercially through ADB Office of External Relations)
1. Asian Development Review (ADR; semiannual)$5.00 per issue; $8.00 per year (2 issues)

39
MONOGRAPH SERIES(Published in-house; Available through ADB Office of External Relations; Free of charge)
EDRC REPORT SERIES (ER)
No. 1 ASEAN and the Asian Development Bank—Seiji Naya, April 1982
No. 2 Development Issues for the Developing Eastand Southeast Asian Countriesand International Cooperation—Seiji Naya and Graham Abbott, April 1982
No. 3 Aid, Savings, and Growth in the Asian Region—J. Malcolm Dowling and Ulrich Hiemenz,
April 1982No. 4 Development-oriented Foreign Investment
and the Role of ADB—Kiyoshi Kojima, April 1982
No. 5 The Multilateral Development Banksand the International Economy’s MissingPublic Sector—John Lewis, June 1982
No. 6 Notes on External Debt of DMCs—Evelyn Go, July 1982
No. 7 Grant Element in Bank Loans—Dal Hyun Kim, July 1982
No. 8 Shadow Exchange Rates and StandardConversion Factors in Project Evaluation—Peter Warr, September 1982
No. 9 Small and Medium-Scale ManufacturingEstablishments in ASEAN Countries:Perspectives and Policy Issues—Mathias Bruch and Ulrich Hiemenz,
January 1983No. 10 A Note on the Third Ministerial Meeting of GATT
—Jungsoo Lee, January 1983No. 11 Macroeconomic Forecasts for the Republic
of China, Hong Kong, and Republic of Korea—J.M. Dowling, January 1983
No. 12 ASEAN: Economic Situation and Prospects—Seiji Naya, March 1983
No. 13 The Future Prospects for the DevelopingCountries of Asia—Seiji Naya, March 1983
No. 14 Energy and Structural Change in the Asia-Pacific Region, Summary of the ThirteenthPacific Trade and Development Conference—Seiji Naya, March 1983
No. 15 A Survey of Empirical Studies on Demandfor Electricity with Special Emphasis on PriceElasticity of Demand—Wisarn Pupphavesa, June 1983
No. 16 Determinants of Paddy Production in Indonesia:1972-1981–A Simultaneous Equation ModelApproach—T.K. Jayaraman, June 1983
No. 17 The Philippine Economy: EconomicForecasts for 1983 and 1984—J.M. Dowling, E. Go, and C.N. Castillo,
June 1983No. 18 Economic Forecast for Indonesia
—J.M. Dowling, H.Y. Kim, Y.K. Wang,and C.N. Castillo, June 1983
No. 19 Relative External Debt Situation of AsianDeveloping Countries: An Applicationof Ranking Method—Jungsoo Lee, June 1983
No. 20 New Evidence on Yields, Fertilizer Application,and Prices in Asian Rice Production—William James and Teresita Ramirez, July 1983
No. 21 Inflationary Effects of Exchange RateChanges in Nine Asian LDCs—Pradumna B. Rana and J. Malcolm Dowling, Jr., December 1983
No. 22 Effects of External Shocks on the Balanceof Payments, Policy Responses, and DebtProblems of Asian Developing Countries—Seiji Naya, December 1983
No. 23 Changing Trade Patterns and Policy Issues:The Prospects for East and Southeast AsianDeveloping Countries—Seiji Naya and Ulrich Hiemenz, February 1984
No. 24 Small-Scale Industries in Asian EconomicDevelopment: Problems and Prospects—Seiji Naya, February 1984
No. 25 A Study on the External Debt IndicatorsApplying Logit Analysis—Jungsoo Lee and Clarita Barretto, February 1984
No. 26 Alternatives to Institutional Credit Programsin the Agricultural Sector of Low-IncomeCountries—Jennifer Sour, March 1984
No. 27 Economic Scene in Asia and Its Special Features—Kedar N. Kohli, November 1984
No. 28 The Effect of Terms of Trade Changes on theBalance of Payments and Real NationalIncome of Asian Developing Countries—Jungsoo Lee and Lutgarda Labios, January 1985
No. 29 Cause and Effect in the World Sugar Market:Some Empirical Findings 1951-1982—Yoshihiro Iwasaki, February 1985
No. 30 Sources of Balance of Payments Problemin the 1970s: The Asian Experience—Pradumna Rana, February 1985
No. 31 India’s Manufactured Exports: An Analysisof Supply Sectors—Ifzal Ali, February 1985
No. 32 Meeting Basic Human Needs in AsianDeveloping Countries—Jungsoo Lee and Emma Banaria, March 1985
No. 33 The Impact of Foreign Capital Inflowon Investment and Economic Growthin Developing Asia—Evelyn Go, May 1985
No. 34 The Climate for Energy Developmentin the Pacific and Asian Region:Priorities and Perspectives—V.V. Desai, April 1986
No. 35 Impact of Appreciation of the Yen onDeveloping Member Countries of the Bank—Jungsoo Lee, Pradumna Rana, and Ifzal Ali,
May 1986No. 36 Smuggling and Domestic Economic Policies
in Developing Countries—A.H.M.N. Chowdhury, October 1986
No. 37 Public Investment Criteria: Economic InternalRate of Return and Equalizing Discount Rate—Ifzal Ali, November 1986
No. 38 Review of the Theory of Neoclassical PoliticalEconomy: An Application to Trade Policies—M.G. Quibria, December 1986
No. 39 Factors Influencing the Choice of Location:Local and Foreign Firms in the Philippines—E.M. Pernia and A.N. Herrin, February 1987
No. 40 A Demographic Perspective on DevelopingAsia and Its Relevance to the Bank—E.M. Pernia, May 1987
No. 41 Emerging Issues in Asia and Social CostBenefit Analysis—I. Ali, September 1988

40
No. 42 Shifting Revealed Comparative Advantage:Experiences of Asian and Pacific DevelopingCountries—P.B. Rana, November 1988
No. 43 Agricultural Price Policy in Asia:Issues and Areas of Reforms—I. Ali, November 1988
No. 44 Service Trade and Asian Developing Economies—M.G. Quibria, October 1989
No. 45 A Review of the Economic Analysis of PowerProjects in Asia and Identification of Areasof Improvement—I. Ali, November 1989
No. 46 Growth Perspective and Challenges for Asia:Areas for Policy Review and Research—I. Ali, November 1989
No. 47 An Approach to Estimating the PovertyAlleviation Impact of an Agricultural Project—I. Ali, January 1990
No. 48 Economic Growth Performance of Indonesia,the Philippines, and Thailand:The Human Resource Dimension—E.M. Pernia, January 1990
No. 49 Foreign Exchange and Fiscal Impact of a Project:A Methodological Framework for Estimation—I. Ali, February 1990
No. 50 Public Investment Criteria: Financialand Economic Internal Rates of Return—I. Ali, April 1990
No. 51 Evaluation of Water Supply Projects:An Economic Framework—Arlene M. Tadle, June 1990
No. 52 Interrelationship Between Shadow Prices, ProjectInvestment, and Policy Reforms:An Analytical Framework—I. Ali, November 1990
No. 53 Issues in Assessing the Impact of Projectand Sector Adjustment Lending—I. Ali, December 1990
No. 54 Some Aspects of Urbanizationand the Environment in Southeast Asia—Ernesto M. Pernia, January 1991
No. 55 Financial Sector and EconomicDevelopment: A Survey
—Jungsoo Lee, September 1991No. 56 A Framework for Justifying Bank-Assisted
Education Projects in Asia: A Reviewof the Socioeconomic Analysisand Identification of Areas of Improvement—Etienne Van De Walle, February 1992
No. 57 Medium-term Growth-StabilizationRelationship in Asian Developing Countriesand Some Policy Considerations—Yun-Hwan Kim, February 1993
No. 58 Urbanization, Population Distribution,and Economic Development in Asia—Ernesto M. Pernia, February 1993
No. 59 The Need for Fiscal Consolidation in Nepal:The Results of a Simulation—Filippo di Mauro and Ronald Antonio Butiong,
July 1993No. 60 A Computable General Equilibrium Model
of Nepal—Timothy Buehrer and Filippo di Mauro,
October 1993No. 61 The Role of Government in Export Expansion
in the Republic of Korea: A Revisit—Yun-Hwan Kim, February 1994
No. 62 Rural Reforms, Structural Change,and Agricultural Growth inthe People’s Republic of China—Bo Lin, August 1994
No. 63 Incentives and Regulation for Pollution Abatementwith an Application to Waste Water Treatment—Sudipto Mundle, U. Shankar,and Shekhar Mehta, October 1995
No. 64 Saving Transitions in Southeast Asia—Frank Harrigan, February 1996
No. 65 Total Factor Productivity Growth in East Asia:A Critical Survey—Jesus Felipe, September 1997
No. 66 Foreign Direct Investment in Pakistan:Policy Issues and Operational Implications—Ashfaque H. Khan and Yun-Hwan Kim,
July 1999No. 67 Fiscal Policy, Income Distribution and Growth
—Sailesh K. Jha, November 1999

41
No. 1 International Reserves:Factors Determining Needs and Adequacy—Evelyn Go, May 1981
No. 2 Domestic Savings in Selected DevelopingAsian Countries—Basil Moore, assisted by
A.H.M. Nuruddin Chowdhury, September 1981No. 3 Changes in Consumption, Imports and Exports
of Oil Since 1973: A Preliminary Survey ofthe Developing Member Countriesof the Asian Development Bank—Dal Hyun Kim and Graham Abbott,
September 1981No. 4 By-Passed Areas, Regional Inequalities,
and Development Policies in SelectedSoutheast Asian Countries—William James, October 1981
No. 5 Asian Agriculture and Economic Development—William James, March 1982
No. 6 Inflation in Developing Member Countries:An Analysis of Recent Trends—A.H.M. Nuruddin Chowdhury and
J. Malcolm Dowling, March 1982No. 7 Industrial Growth and Employment in
Developing Asian Countries: Issues andPerspectives for the Coming Decade—Ulrich Hiemenz, March 1982
No. 8 Petrodollar Recycling 1973-1980.Part 1: Regional Adjustments andthe World Economy—Burnham Campbell, April 1982
No. 9 Developing Asia: The Importanceof Domestic Policies—Economics Office Staff under the direction
of Seiji Naya, May 1982No. 10 Financial Development and Household
Savings: Issues in Domestic ResourceMobilization in Asian Developing Countries—Wan-Soon Kim, July 1982
No. 11 Industrial Development: Role of SpecializedFinancial Institutions—Kedar N. Kohli, August 1982
No. 12 Petrodollar Recycling 1973-1980.Part II: Debt Problems and an Evaluationof Suggested Remedies—Burnham Campbell, September 1982
No. 13 Credit Rationing, Rural Savings, and FinancialPolicy in Developing Countries—William James, September 1982
No. 14 Small and Medium-Scale ManufacturingEstablishments in ASEAN Countries:Perspectives and Policy Issues—Mathias Bruch and Ulrich Hiemenz, March 1983
No. 15 Income Distribution and EconomicGrowth in Developing Asian Countries—J. Malcolm Dowling and David Soo, March 1983
No. 16 Long-Run Debt-Servicing Capacity ofAsian Developing Countries: An Applicationof Critical Interest Rate Approach—Jungsoo Lee, June 1983
No. 17 External Shocks, Energy Policy,and Macroeconomic Performance of AsianDeveloping Countries: A Policy Analysis—William James, July 1983
No. 18 The Impact of the Current Exchange RateSystem on Trade and Inflation of SelectedDeveloping Member Countries—Pradumna Rana, September 1983
No. 19 Asian Agriculture in Transition: Key Policy Issues—William James, September 1983
No. 20 The Transition to an Industrial Economy
ECONOMIC STAFF PAPERS (ES)
in Monsoon Asia—Harry T. Oshima, October 1983
No. 21 The Significance of Off-Farm Employmentand Incomes in Post-War East Asian Growth—Harry T. Oshima, January 1984
No. 22 Income Distribution and Poverty in SelectedAsian Countries—John Malcolm Dowling, Jr., November 1984
No. 23 ASEAN Economies and ASEAN EconomicCooperation—Narongchai Akrasanee, November 1984
No. 24 Economic Analysis of Power Projects—Nitin Desai, January 1985
No. 25 Exports and Economic Growth in the Asian Region—Pradumna Rana, February 1985
No. 26 Patterns of External Financing of DMCs—E. Go, May 1985
No. 27 Industrial Technology Developmentthe Republic of Korea—S.Y. Lo, July 1985
No. 28 Risk Analysis and Project Selection:A Review of Practical Issues—J.K. Johnson, August 1985
No. 29 Rice in Indonesia: Price Policy and ComparativeAdvantage—I. Ali, January 1986
No. 30 Effects of Foreign Capital Inflowson Developing Countries of Asia—Jungsoo Lee, Pradumna B. Rana,
and Yoshihiro Iwasaki, April 1986No. 31 Economic Analysis of the Environmental
Impacts of Development Projects—John A. Dixon et al., EAPI,
East-West Center, August 1986No. 32 Science and Technology for Development:
Role of the Bank—Kedar N. Kohli and Ifzal Ali, November 1986
No. 33 Satellite Remote Sensing in the Asianand Pacific Region—Mohan Sundara Rajan, December 1986
No. 34 Changes in the Export Patterns of Asian andPacific Developing Countries: An EmpiricalOverview—Pradumna B. Rana, January 1987
No. 35 Agricultural Price Policy in Nepal—Gerald C. Nelson, March 1987
No. 36 Implications of Falling Primary CommodityPrices for Agricultural Strategy in the Philippines—Ifzal Ali, September 1987
No. 37 Determining Irrigation Charges: A Framework—Prabhakar B. Ghate, October 1987
No. 38 The Role of Fertilizer Subsidies in AgriculturalProduction: A Review of Select Issues—M.G. Quibria, October 1987
No. 39 Domestic Adjustment to External Shocksin Developing Asia—Jungsoo Lee, October 1987
No. 40 Improving Domestic Resource Mobilizationthrough Financial Development: Indonesia—Philip Erquiaga, November 1987
No. 41 Recent Trends and Issues on Foreign DirectInvestment in Asian and Pacific DevelopingCountries—P.B. Rana, March 1988
No. 42 Manufactured Exports from the Philippines:A Sector Profile and an Agenda for Reform—I. Ali, September 1988
No. 43 A Framework for Evaluating the EconomicBenefits of Power Projects—I. Ali, August 1989
No. 44 Promotion of Manufactured Exports in Pakistan

42
No. 1 Poverty in the People’s Republic of China:Recent Developments and Scopefor Bank Assistance—K.H. Moinuddin, November 1992
No. 2 The Eastern Islands of Indonesia: An Overviewof Development Needs and Potential—Brien K. Parkinson, January 1993
No. 3 Rural Institutional Finance in Bangladeshand Nepal: Review and Agenda for Reforms—A.H.M.N. Chowdhury and Marcelia C. Garcia,
November 1993No. 4 Fiscal Deficits and Current Account Imbalances
of the South Pacific Countries:A Case Study of Vanuatu—T.K. Jayaraman, December 1993
No. 5 Reforms in the Transitional Economies of Asia—Pradumna B. Rana, December 1993
No. 6 Environmental Challenges in the People’s Republicof China and Scope for Bank Assistance—Elisabetta Capannelli and Omkar L. Shrestha,
December 1993No. 7 Sustainable Development Environment
and Poverty Nexus—K.F. Jalal, December 1993
No. 8 Intermediate Services and EconomicDevelopment: The Malaysian Example—Sutanu Behuria and Rahul Khullar, May 1994
No. 9 Interest Rate Deregulation: A Brief Surveyof the Policy Issues and the Asian Experience—Carlos J. Glower, July 1994
No. 10 Some Aspects of Land Administrationin Indonesia: Implications for Bank Operations—Sutanu Behuria, July 1994
No. 11 Demographic and Socioeconomic Determinantsof Contraceptive Use among Urban Women inthe Melanesian Countries in the South Pacific:A Case Study of Port Vila Town in Vanuatu—T.K. Jayaraman, February 1995
No. 12 Managing Development throughInstitution Building— Hilton L. Root, October 1995
No. 13 Growth, Structural Change, and OptimalPoverty Interventions—Shiladitya Chatterjee, November 1995
No. 14 Private Investment and MacroeconomicEnvironment in the South Pacific IslandCountries: A Cross-Country Analysis—T.K. Jayaraman, October 1996
No. 15 The Rural-Urban Transition in Viet Nam:Some Selected Issues—Sudipto Mundle and Brian Van Arkadie,
October 1997No. 16 A New Approach to Setting the Future
Transport Agenda—Roger Allport, Geoff Key, and Charles Melhuish
June 1998No. 17 Adjustment and Distribution:
The Indian Experience—Sudipto Mundle and V.B. Tulasidhar, June 1998
No. 18 Tax Reforms in Viet Nam: A Selective Analysis—Sudipto Mundle, December 1998
No. 19 Surges and Volatility of Private Capital Flows toAsian Developing Countries: Implicationsfor Multilateral Development Banks—Pradumna B. Rana, December 1998
No. 20 The Millennium Round and the Asian Economies:An Introduction—Dilip K. Das, October 1999
No. 21 Occupational Segregation and the GenderEarnings Gap—Joseph E. Zveglich, Jr. and Yana van der MeulenRodgers, December 1999
No. 22 Information Technology: Next Locomotive ofGrowth?—Dilip K. Das, June 2000
OCCASIONAL PAPERS (OP)
—Jungsoo Lee and Yoshihiro Iwasaki,September 1989
No. 45 Education and Labor Markets in Indonesia:A Sector Survey—Ernesto M. Pernia and David N. Wilson,
September 1989No. 46 Industrial Technology Capabilities
and Policies in Selected ADCs—Hiroshi Kakazu, June 1990
No. 47 Designing Strategies and Policiesfor Managing Structural Change in Asia—Ifzal Ali, June 1990
No. 48 The Completion of the Single European CommunityMarket in 1992: A Tentative Assessment of itsImpact on Asian Developing Countries—J.P. Verbiest and Min Tang, June 1991
No. 49 Economic Analysis of Investment in Power Systems—Ifzal Ali, June 1991
No. 50 External Finance and the Role of MultilateralFinancial Institutions in South Asia:Changing Patterns, Prospects, and Challenges—Jungsoo Lee, November 1991
No. 51 The Gender and Poverty Nexus: Issues andPolicies—M.G. Quibria, November 1993
No. 52 The Role of the State in Economic Development:Theory, the East Asian Experience,and the Malaysian Case—Jason Brown, December 1993
No. 53 The Economic Benefits of Potable Water SupplyProjects to Households in Developing Countries—Dale Whittington and Venkateswarlu Swarna,
January 1994No. 54 Growth Triangles: Conceptual Issues
and Operational Problems—Min Tang and Myo Thant, February 1994
No. 55 The Emerging Global Trading Environmentand Developing Asia—Arvind Panagariya, M.G. Quibria,
and Narhari Rao, July 1996No. 56 Aspects of Urban Water and Sanitation in
the Context of Rapid Urbanization inDeveloping Asia—Ernesto M. Pernia and Stella LF. Alabastro,
September 1997No. 57 Challenges for Asia’s Trade and Environment
—Douglas H. Brooks, January 1998No. 58 Economic Analysis of Health Sector Projects-
A Review of Issues, Methods, and Approaches—Ramesh Adhikari, Paul Gertler, and
Anneli Lagman, March 1999No. 59 The Asian Crisis: An Alternate View
—Rajiv Kumar and Bibek Debroy, July 1999No. 60 Social Consequences of the Financial Crisis in
Asia—James C. Knowles, Ernesto M. Pernia, and
Mary Racelis, November 1999

43
No. 1 Estimates of the Total External Debt ofthe Developing Member Countries of ADB:1981-1983—I.P. David, September 1984
No. 2 Multivariate Statistical and GraphicalClassification Techniques Appliedto the Problem of Grouping Countries—I.P. David and D.S. Maligalig, March 1985
No. 3 Gross National Product (GNP) MeasurementIssues in South Pacific Developing MemberCountries of ADB—S.G. Tiwari, September 1985
No. 4 Estimates of Comparable Savings in SelectedDMCs—Hananto Sigit, December 1985
No. 5 Keeping Sample Survey Designand Analysis Simple—I.P. David, December 1985
No. 6 External Debt Situation in AsianDeveloping Countries—I.P. David and Jungsoo Lee, March 1986
No. 7 Study of GNP Measurement Issues in theSouth Pacific Developing Member Countries.Part I: Existing National Accountsof SPDMCs–Analysis of Methodologyand Application of SNA Concepts—P. Hodgkinson, October 1986
No. 8 Study of GNP Measurement Issues in the SouthPacific Developing Member Countries.Part II: Factors Affecting IntercountryComparability of Per Capita GNP—P. Hodgkinson, October 1986
No. 9 Survey of the External Debt Situation
STATISTICAL REPORT SERIES (SR)
in Asian Developing Countries, 1985—Jungsoo Lee and I.P. David, April 1987
No. 10 A Survey of the External Debt Situationin Asian Developing Countries, 1986—Jungsoo Lee and I.P. David, April 1988
No. 11 Changing Pattern of Financial Flows to Asianand Pacific Developing Countries—Jungsoo Lee and I.P. David, March 1989
No. 12 The State of Agricultural Statistics inSoutheast Asia—I.P. David, March 1989
No. 13 A Survey of the External Debt Situationin Asian and Pacific Developing Countries:1987-1988—Jungsoo Lee and I.P. David, July 1989
No. 14 A Survey of the External Debt Situation inAsian and Pacific Developing Countries: 1988-1989—Jungsoo Lee, May 1990
No. 15 A Survey of the External Debt Situationin Asian and Pacific Developing Countries: 1989-1992—Min Tang, June 1991
No. 16 Recent Trends and Prospects of External DebtSituation and Financial Flows to Asianand Pacific Developing Countries—Min Tang and Aludia Pardo, June 1992
No. 17 Purchasing Power Parity in Asian DevelopingCountries: A Co-Integration Test—Min Tang and Ronald Q. Butiong, April 1994
No. 18 Capital Flows to Asian and Pacific DevelopingCountries: Recent Trends and Future Prospects—Min Tang and James Villafuerte, October 1995
1. Informal Finance: Some Findings from AsiaPrabhu Ghate et. al., 1992$15.00 (paperback)
2. Mongolia: A Centrally Planned Economyin TransitionAsian Development Bank, 1992$15.00 (paperback)
3. Rural Poverty in Asia, Priority Issues and PolicyOptionsEdited by M.G. Quibria, 1994$25.00 (paperback)
4. Growth Triangles in Asia: A New Approachto Regional Economic CooperationEdited by Myo Thant, Min Tang, and Hiroshi Kakazu1st ed., 1994 $36.00 (hardbound)Revised ed., 1998 $55.00 (hardbound)
5. Urban Poverty in Asia: A Survey of Critical IssuesEdited by Ernesto Pernia, 1994$18.00 (paperback)
6. Critical Issues in Asian Development:Theories, Experiences, and PoliciesEdited by M.G. Quibria, 1995$15.00 (paperback)$36.00 (hardbound)
7. Financial Sector Development in AsiaEdited by Shahid N. Zahid, 1995$50.00 (hardbound)
8. Financial Sector Development in Asia: Country StudiesEdited by Shahid N. Zahid, 1995$55.00 (hardbound)
9. Fiscal Management and Economic Reformin the People’s Republic of ChinaChristine P.W. Wong, Christopher Heady,and Wing T. Woo, 1995$15.00 (paperback)
10. From Centrally Planned to Market Economies:The Asian ApproachEdited by Pradumna B. Rana and Naved Hamid, 1995Vol. 1: Overview$36.00 (hardbound)Vol. 2: People’s Republic of China and Mongolia$50.00 (hardbound)Vol. 3: Lao PDR, Myanmar, and Viet Nam$50.00 (hardbound)
11. Current Issues in Economic Development:An Asian PerspectiveEdited by M.G. Quibria and J. Malcolm Dowling, 1996$50.00 (hardbound)
12. The Bangladesh Economy in TransitionEdited by M.G. Quibria, 1997$20.00 (hardbound)
13. The Global Trading System and Developing AsiaEdited by Arvind Panagariya, M.G. Quibria,and Narhari Rao, 1997$55.00 (hardbound)
14. Social Sector Issues in Transitional Economies of AsiaEdited by Douglas H. Brooks and Myo Thant, 1998$25.00 (paperback)$55.00 (hardbound)
SPECIAL STUDIES, OUP (SS,OUP)(Co-published with Oxford University Press; Available commercially through Oxford University PressOffices, Associated Companies, and Agents)

44
5. Emerging Asia: Changes and ChallengesAsian Development Bank, 1997$30.00 (paperback)
6. Asian ExportsEdited by Dilip Das, 1999$35.00 (paperback)$55.00 (hardbound)
7. Development of Environment Statistics in DevelopingAsian and Pacific CountriesAsian Development Bank, 1999$30.00 (paperback)
8. Mortgage-Backed Securities Markets in AsiaEdited by S.Ghon Rhee & Yutaka Shimomoto, 1999$35.00 (paperback)
9. Rising to the Challenge in Asia: A Study of FinancialMarketsAsian Development BankVol. 1: An Overview, 2000 $20.00 (paperback)
1. Rural Poverty in Developing AsiaEdited by M.G. QuibriaVol. 1: Bangladesh, India, and Sri Lanka, 1994$35.00 (paperback)Vol. 2: Indonesia, Republic of Korea, Philippines,and Thailand, 1996$35.00 (paperback)
2. Gender Indicators of Developing Asianand Pacific CountriesAsian Development Bank, 1993$25.00 (paperback)
3. External Shocks and Policy Adjustments:Lessons from the Gulf CrisisEdited by Naved Hamid and Shahid N. Zahid, 1995$15.00 (paperback)
4. Indonesia-Malaysia-Thailand Growth Triangle:Theory to PracticeEdited by Myo Thant and Min Tang, 1996$15.00 (paperback)
SPECIAL STUDIES, ADB (SS, ADB)(Published in-house; Available commercially through ADB Office of External Relations)
1. Improving Domestic Resource Mobilization ThroughFinancial Development: Overview September 1985
2. Improving Domestic Resource Mobilization ThroughFinancial Development: Bangladesh July 1986
3. Improving Domestic Resource Mobilization ThroughFinancial Development: Sri Lanka April 1987
4. Improving Domestic Resource Mobilization ThroughFinancial Development: India December 1987
5. Financing Public Sector Development Expenditurein Selected Countries: Overview January 1988
6. Study of Selected Industries: A Brief ReportApril 1988
7. Financing Public Sector Development Expenditurein Selected Countries: Bangladesh June 1988
8. Financing Public Sector Development Expenditurein Selected Countries: India June 1988
9. Financing Public Sector Development Expenditurein Selected Countries: Indonesia June 1988
10. Financing Public Sector Development Expenditurein Selected Countries: Nepal June 1988
11. Financing Public Sector Development Expenditurein Selected Countries: Pakistan June 1988
12. Financing Public Sector Development Expenditurein Selected Countries: Philippines June 1988
13. Financing Public Sector Development Expenditurein Selected Countries: Thailand June 1988
14. Towards Regional Cooperation in South Asia:ADB/EWC Symposium on Regional Cooperationin South Asia February 1988
15. Evaluating Rice Market Intervention Policies:Some Asian Examples April 1988
16. Improving Domestic Resource Mobilization ThroughFinancial Development: Nepal November 1988
17. Foreign Trade Barriers and Export GrowthSeptember 1988
18. The Role of Small and Medium-Scale Industries in theIndustrial Development of the PhilippinesApril 1989
19. The Role of Small and Medium-Scale ManufacturingIndustries in Industrial Development: The Experience ofSelected Asian CountriesJanuary 1990
20. National Accounts of Vanuatu, 1983-1987January 1990
21. National Accounts of Western Samoa, 1984-1986February 1990
22. Human Resource Policy and EconomicDevelopment: Selected Country StudiesJuly 1990
23. Export Finance: Some Asian ExamplesSeptember 1990
24. National Accounts of the Cook Islands, 1982-1986September 1990
25. Framework for the Economic and Financial Appraisal ofUrban Development Sector Projects January 1994
26. Framework and Criteria for the Appraisaland Socioeconomic Justification of Education ProjectsJanuary 1994
27. Guidelines for the Economic Analysis ofTelecommunications ProjectsAsian Development Bank, 1997
28. Guidelines for the Economic Analysis of Water Supply ProjectsAsian Development Bank, 1998
29. Investing in AsiaCo-published with OECD, 1997
30. The Future of Asia in the World EconomyCo-published with OECD, 1998
31. Financial Liberalisation in Asia: Analysis and ProspectsCo-published with OECD, 1999
32. Sustainable Recovery in Asia: Mobilizing Resources forDevelopmentCo-published with OECD, 2000
33. Technology and Poverty Reduction in Asia and the PacificCo-published with OECD, 2001
34. Asia and EuropeCo-published with OECD, 2002
SPECIAL STUDIES, COMPLIMENTARY (SSC)(Published in-house; Available through ADB Office of External Relations; Free of Charge)
45
Vol. 2: Special Issues, 1999 $15.00 (paperback)Vol 3: Sound Practices, 2000 $25.00 (paperback)Vol. 4: People’s Republic of China, 1999 $20.00(paperback)Vol. 5: India, 1999 $30.00 (paperback)Vol. 6: Indonesia, 1999 $30.00 (paperback)Vol. 7: Republic of Korea, 1999 $30.00 (paperback)Vol. 8: Malaysia, 1999 $20.00 (paperback)Vol. 9: Pakistan, 1999 $30.00 (paperback)Vol. 10: Philippines, 1999 $30.00 (paperback)Vol. 11: Thailand, 1999 $30.00 (paperback)Vol. 12: Socialist Republic of Viet Nam, 1999 $30.00(paperback)
10. Corporate Governance and Finance in East Asia:A Study of Indonesia, Republic of Korea, Malaysia,Philippines and ThailandJ. Zhuang, David Edwards, D. Webb,& Ma. Virginita CapulongVol. 1: A Consolidated Report, 2000 $10.00 (paperback)Vol. 2: Country Studies, 2001 $15.00 (paperback)
11. Financial Management and Governance IssuesAsian Development Bank, 2000Cambodia $10.00 (paperback)People’s Republic of China $10.00 (paperback)Mongolia $10.00 (paperback)Pakistan $10.00 (paperback)Papua New Guinea $10.00 (paperback)Uzbekistan $10.00 (paperback)Viet Nam $10.00 (paperback)Selected Developing Member Countries $10.00 (paperback)
12. Government Bond Market Development in AsiaEdited by Yun-Hwan Kim, 2001$25.00 (paperback)
13. Intergovernmental Fiscal Transfers in Asia: Current Practiceand Challenges for the FutureEdited by Paul Smoke and Yun-Hwan Kim, 2002$15.00 (paperback)
14. Guidelines for the Economic Analysis of ProjectsAsian Development Bank, 1997$10.00 (paperback)
15. Handbook for the Economic Analysis of Water Supply ProjectsAsian Development Bank, 1999$10.00 (hardbound)
16. Handbook for the Economic Analysis of Health Sector ProjectsAsian Development Bank, 2000$10.00 (paperback)
17. Handbook for Integrating Risk Analysis in the EconomicAnalysis of ProjectsAsian Development Bank, 2002$10.00 (paperback)
18. Handbook for Integrating Povery Impact Assessment inthe Economic Analysis of ProjectsAsian Development Bank, 2001$10.00 (paperback)
19. Guidelines for the Financial Governance andManagement of Investment Projects Financed by theAsian Development BankAsian Development Bank, 2002$10.00 (paperback)
20. Handbook on Environment StatisticsAsian Development Bank, 2002, Forthcoming
21. Economic Analysis of Policy-based Operations: KeyDimensionsAsian Development Bank, 2003