erd working paper no. 51 - asian development bank · · 2014-09-29erd working paper no. 51...
TRANSCRIPT
ERD Working Paper No. 51
POVERTY ESTIMATES IN INDIA: SOME KEY ISSUES
SAVITA SHARMA
May 2004
Savita Sharma is Director of the Perspective Planning Division, Planning Commission, India. This paper was preparedfor RETA 5917: Building a Poverty Database under the Development Indicators Policy Research Division of the Economicsand Research Department, Asian Development Bank.
Asian Development BankP.O. Box 7890980 ManilaPhilippines
©2004 by Asian Development BankMay 2004ISSN 1655-5252
The views expressed in this paperare those of the author(s) and do notnecessarily reflect the views or policiesof the Asian Development Bank.
FOREWORD
The ERD Working Paper Series is a forum for ongoing and recentlycompleted research and policy studies undertaken in the Asian DevelopmentBank or on its behalf. The Series is a quick-disseminating, informalpublication meant to stimulate discussion and elicit feedback. Paperspublished under this Series could subsequently be revised for publicationas articles in professional journals or chapters in books.
CONTENTS
Abstract vii
I. INTRODUCTION 1
II. DATA SOURCES 2
A. Household Surveys 2B. Consumer Expenditure Surveys 2
III. POVERTY INDICATORS 3
A. Methodology 3B. Subnational Indicators 8
IV. CONSUMPTION EXPENDITURE 12
A. Per Capita Consumption Expenditure 12B. Distribution of Expenditure 13
V. QUALITY OF DATA 17
A. Changes in Recall Period 17B. The Sources of Data 19
VI. NONINCOME INDICATORS 26
A. Education 26B. Health 26
REFERENCES 31
ABSTRACT
The paper provides an overview of the methodologies used by the IndianPlanning Commission in the past 30 years. Using the Planning Commission povertyline, the paper computes poverty and inequality indices from the large samplesurveys of NSS consumer expenditure data and demonstrates that the intertemporalchanges in the poverty ratio has been more influenced by the changes in percapita consumption rather than class distribution. Interpersonal inequality inthe consumption distribution, measured by the Lorenz ratio, remained fairly stablefor a pretty long period, but showed signs of decline recently. The paper dwellson the quality of data on private consumption obtained from the National SampleSurveys on household consumer expenditure vis-à-vis the private consumptionexpenditure in the National Accounts Statistics, particularly the recent changesin the method of data collection in the former. The paper also discusses theimportance of nonincome indicators such as infant mortality rate and schoolenrolment in the assessment of living standards.

I. INTRODUCTION
The well-being of its people has been the prime concern of the Government of India since1947. A number of policies have been formulated to help those sections of the population whohave been left behind in the overall growth process to catch up with the rest of the people. However,till the mid-1970s, the approach had essentially been that the growth process will take care ofreducing poverty. But this did not happen significantly. Therefore, the late 1970s and early 1980switnessed a sea change in the strategy for poverty alleviation. The government decided to attackpoverty directly rather than depend on general growth alone. This gave birth to the concept of“growth with redistribution”—the use of special schemes for the direct generation of income forthe poor along with the promotion of general growth—to achieve a faster reduction in poverty.
Keeping the objective of eradicating poverty in mind as well as the goal of promoting thegeneral welfare, the Statistical Organization of India, since its inception in 1950, led by the NationalSample Survey Organization (NSSO), has kept up the work of collecting various kinds of statisticalinformation for the use of policymakers, program implementers, and other people involved in theeradication of poverty and the improvement of general welfare in the country.
This paper gives an analytical description of the poverty database in India. Section II discussesthe data sources used for the estimation of poverty and its various dimensions. It focuses onhousehold surveys and household consumer expenditure surveys, highlighting the periodicity,sample size, scope, and purpose of these surveys.
Section III discusses the evolution of the poverty line over time, beginning with the definitionput forward by the Planning Commission first in 1962 by a Working Group and then in 1979 bya Task Force. It then reports on the methodology presently used by the Planning Commission basedon the recommendations of the Expert Group. This section also describes broad trends in povertyratios estimated with the use of poverty lines based on the Expert Group methodology and NSSOdata on household consumer expenditure. The section outlines the poverty situation from the nationalto the subnational level, the various states.
Section IV provides consumption expenditure data to provide the empirical basis of povertyestimates. The section also shows the distribution of consumption expenditures.
Section V discusses special data issues, focusing, first, on the changes in the recall periodsof the consumer expenditure surveys and, second, on the divergence between estimates ofconsumption expenditures derived from household surveys and those based on the national incomeaccounts. As pointed out in this section, which estimates of consumption expenditures one considersin computing poverty can have important implications for poverty estimates.
Section VI discusses nonincome indicators such as infant mortality rate and school enrolmentin the assessment of the level of living. It brings in indicators at the state level.
The paper concludes with a few remarks on the continuing challenge of poverty alleviationin India.

2 MAY 2004
POVERTY ESTIMATES IN INDIA: SOME KEY ISSUES
SAVITA SHARMA
II. DATA SOURCES
A. Household Surveys
Among developing countries, India probably has one of the soundest databases for addressingsocioeconomic issues. All the Ministries publish yearbooks that contain information on theperformance of the programs and schemes they implement. A large amount of data is generatedas a by-product of their administration. Besides this, the NSSO regularly conducts surveys coveringimportant socioeconomic aspects of life in rural and urban areas. These data are available at nationaland state levels. Some of them are also available at the substate level.
The NSSO covers a wide range of subjects. These can be classified under four categories:household surveys on socioeconomic subjects; surveys on landholding, livestock, and agriculture;establishment and enterprise surveys; and village surveys. Of these surveys, the most relevant forpoverty analysis is the survey on household consumer expenditure.
Through household surveys, data is collected on population, births, deaths, migration, fertility,family planning, morbidity, disability, employment and unemployment, household consumerexpenditure, housing condition, and utilization of public services in health, education, etc.—justabout all the statistical information required in poverty analysis.
B. Consumer Expenditure Surveys
Surveys on household consumer expenditure yield data for the estimation of the incidenceof poverty and the assessment of levels of living at national and subnational levels. Consumerexpenditure data are deemed more appropriate for analysis of levels of living and poverty thanthose on income, for a number of reasons. For example, current income may be subject to largefluctuations due to seasonal factors, especially in economies with large rural and informal sectors.Since households may be able to access credit markets or household savings and thereby smooththeir consumptions to some degree, consumption expenditures may be able to provide a betterbasis for determining a household’s actual standard of living. Moreover, income in kind is oftenvalued at producer’s prices rather than purchaser’s prices, resulting in the underestimation of people’sactual level of well-being.
Since its beginning in 1950 and until its 28th round (1973-1974), the NSSO has collecteddata on consumer expenditure every year. After the 26th round of the survey (1971-1972), theGoverning Council of NSSO decided to undertake the surveys on consumer expenditure andemployment–unemployment together from a large sample once in five years. Accordingly,quinquennial surveys on consumer expenditure and employment–unemployment have been conductedin the 27th (1972-1973), 32nd (1977-1978), 38th (1983), 43rd (1987-1988), 50th (1993-1994),and 55th (1999-2000) rounds of NSS.
In a later decision, from its 42nd Round, 1986-1987, the NSSO reintroduced the collectionof consumer expenditure data annually though on a reduced scale. This was done in order to maintaincontinuity in the consumer expenditure data, which seemed essential for monitoring intertemporalchanges in the levels of living. These thin surveys were spread over a period ranging from six monthsto one year and generated data that have been useful in the estimation of levels of well-being.
3ERD WORKING PAPER SERIES NO. 51
SECTION IIIPOVERTY INDICATORS
The data collected referred to more than 300 items comprising cereals, vegetables, fruits,pulses, milk and milk products, edible oil, meat, egg and fish, sugar, salt, spices, beverages, pan,tobacco, and intoxicants in a very detailed manner. Data on clothing, fuel and light, footwear,medical expenses, education, entertainment, goods for personal care, sundry articles, durable goods,conveyance, and other miscellaneous goods and services is also collected.
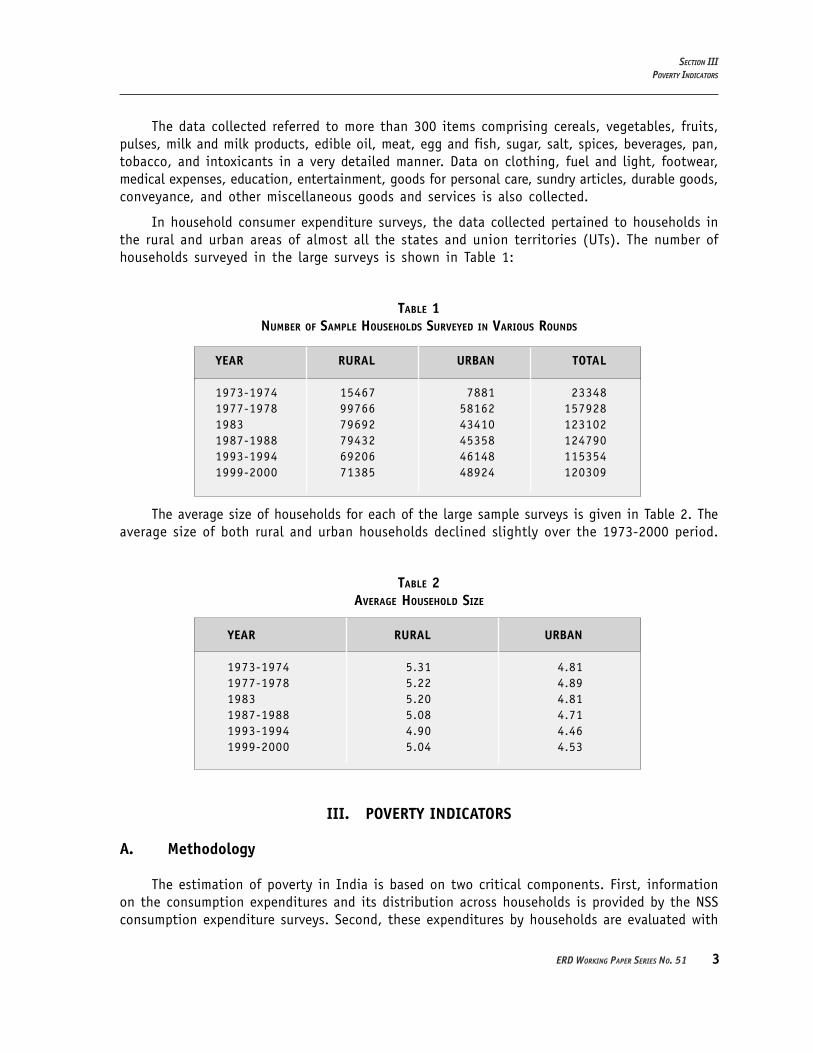
In household consumer expenditure surveys, the data collected pertained to households inthe rural and urban areas of almost all the states and union territories (UTs). The number ofhouseholds surveyed in the large surveys is shown in Table 1:
TABLE 1NUMBER OF SAMPLE HOUSEHOLDS SURVEYED IN VARIOUS ROUNDS
YEAR RURAL URBAN TOTAL
1973-1974 15467 7881 233481977-1978 99766 58162 1579281983 79692 43410 1231021987-1988 79432 45358 1247901993-1994 69206 46148 1153541999-2000 71385 48924 120309
The average size of households for each of the large sample surveys is given in Table 2. Theaverage size of both rural and urban households declined slightly over the 1973-2000 period.
TABLE 2AVERAGE HOUSEHOLD SIZE
YEAR RURAL URBAN
1973-1974 5.31 4.811977-1978 5.22 4.891983 5.20 4.811987-1988 5.08 4.711993-1994 4.90 4.461999-2000 5.04 4.53
III. POVERTY INDICATORS
A. Methodology
The estimation of poverty in India is based on two critical components. First, informationon the consumption expenditures and its distribution across households is provided by the NSSconsumption expenditure surveys. Second, these expenditures by households are evaluated with

4 MAY 2004
POVERTY ESTIMATES IN INDIA: SOME KEY ISSUES
SAVITA SHARMA
reference to a given poverty line. Households with consumption expenditures below the povertyline are deemed poor. The remaining are the nonpoor.
1. Poverty Lines
The first step in estimating poverty is to define and quantify a poverty line. The idea of povertyline was first mooted by the Indian Labour Conference in 1957. The poverty line in India wasquantified for the first time in 1962 by a Working Group of the Planning Commission in termsof a minimum requirement (food and nonfood) of individuals for healthy living. The money valueof the minimum requirement was set as per capita consumption expenditure of Rs.20 per monthat 1960-1961 prices and was termed as the poverty line.
The Task Force on Projection of Minimum Needs and Effective Consumption Demand constitutedby the Planning Commission in 1979 defined the poverty line as per capita consumption expenditurelevel, which meets the average per capita daily calorie requirement of 2400 kcal per capita perday in rural areas and 2100 kcal per capita per day in urban areas along with a minimum of nonfoodexpenditure. It used the age-sex-activity specific calorie allowances recommended by the NutritionExpert Group (1968) to estimate the average daily per capita requirement for rural and urban areasusing the age-sex-occupational structure of their respective population.
The Task Force used the 28th Round (1973-1974) National Sample Survey (NSS) data onhousehold consumption both in quantitative and value terms in order to compute the monetaryequivalent of these calorie norms. Based on the observed consumer behavior in 1973-1974 it wasestimated that, on average, consumer expenditure of Rs. 49.09 per capita per month meets thecalorie requirement of 2400 kcal per capita per day in rural areas, and Rs. 56.64 per capita permonth with an intake of 2100 kcal per capita per day in urban areas. These poverty lines expressedin terms of per capita consumption expenditure conform to a consumption basket, which satisfiesthe above calorie norm and meets a minimum of nonfood requirements, such as clothing, shelter,transport, etc. Thus, the concept of poverty line used here was partly normative and partly behavioral.
The poverty lines for later years were estimated by updating the 1973-1974 poverty line initiallyby the Wholesale Price Index (WPI). The use of WPI became controversial as it comprised a rangeof items (about half of its weight) that are not meant for private consumption at all. Besides,consumers buy goods at retail and not at wholesale prices. The Study Group on Estimation of PovertyLine, constituted by the Planning Commission during the Seventh Five Year Plan (1985-1990),recommended use of private consumption deflator of the CSO to update the 1973-1974 povertylines for later years.
The same poverty line defined at national level (separately for rural and urban areas) wasused in all the States/Union Territories (UTs).
The Task Force’s methodology for quantifying poverty lines was regarded by some asinappropriate and even inadequate in giving a representative picture of the incidence of povertyin India. The main points of the criticism, insofar as the poverty line was concerned, included:1
1 The Task Force had also recommended an adjustment of consumption expenditures derived from the NSS surveys byusing information on private consumption from the National Income Accounts. This procedure of adjusting expendituresalso came under criticism. See Section IV below.
5ERD WORKING PAPER SERIES NO. 51
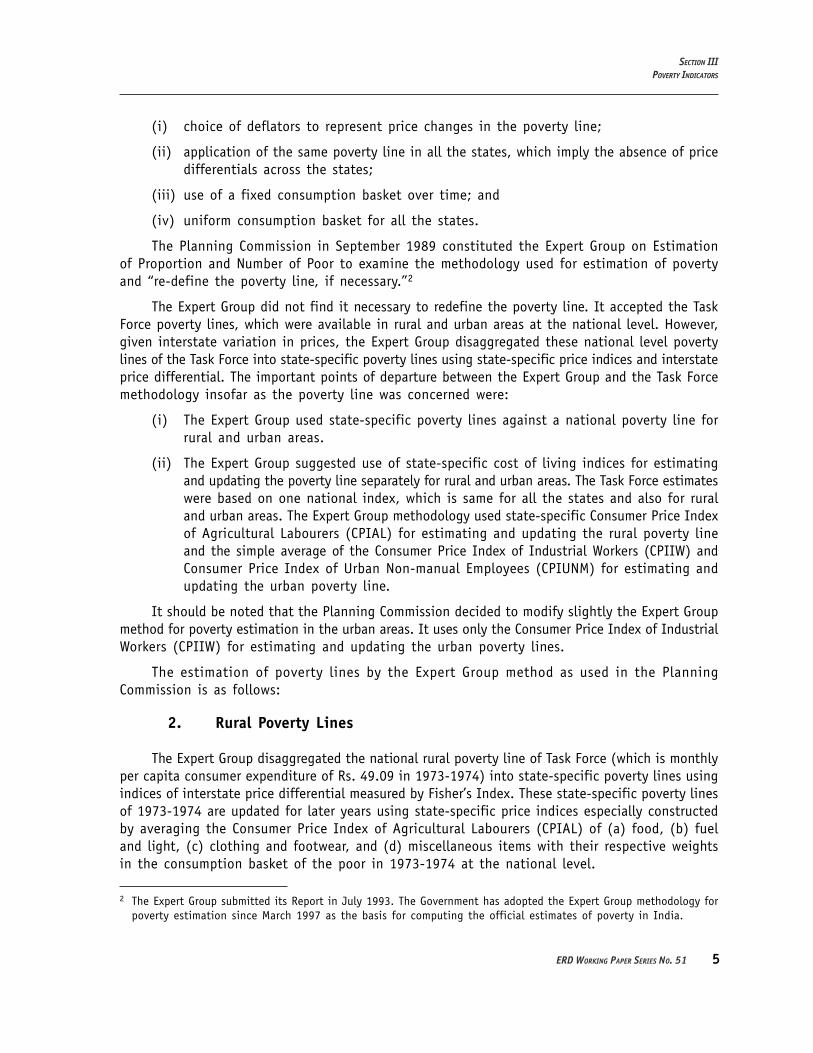
(i) choice of deflators to represent price changes in the poverty line;
(ii) application of the same poverty line in all the states, which imply the absence of pricedifferentials across the states;
(iii) use of a fixed consumption basket over time; and
(iv) uniform consumption basket for all the states.
The Planning Commission in September 1989 constituted the Expert Group on Estimationof Proportion and Number of Poor to examine the methodology used for estimation of povertyand “re-define the poverty line, if necessary.”2
The Expert Group did not find it necessary to redefine the poverty line. It accepted the TaskForce poverty lines, which were available in rural and urban areas at the national level. However,given interstate variation in prices, the Expert Group disaggregated these national level povertylines of the Task Force into state-specific poverty lines using state-specific price indices and interstateprice differential. The important points of departure between the Expert Group and the Task Forcemethodology insofar as the poverty line was concerned were:
(i) The Expert Group used state-specific poverty lines against a national poverty line forrural and urban areas.
(ii) The Expert Group suggested use of state-specific cost of living indices for estimatingand updating the poverty line separately for rural and urban areas. The Task Force estimateswere based on one national index, which is same for all the states and also for ruraland urban areas. The Expert Group methodology used state-specific Consumer Price Indexof Agricultural Labourers (CPIAL) for estimating and updating the rural poverty lineand the simple average of the Consumer Price Index of Industrial Workers (CPIIW) andConsumer Price Index of Urban Non-manual Employees (CPIUNM) for estimating andupdating the urban poverty line.
It should be noted that the Planning Commission decided to modify slightly the Expert Groupmethod for poverty estimation in the urban areas. It uses only the Consumer Price Index of IndustrialWorkers (CPIIW) for estimating and updating the urban poverty lines.
The estimation of poverty lines by the Expert Group method as used in the PlanningCommission is as follows:
2. Rural Poverty Lines
The Expert Group disaggregated the national rural poverty line of Task Force (which is monthlyper capita consumer expenditure of Rs. 49.09 in 1973-1974) into state-specific poverty lines usingindices of interstate price differential measured by Fisher’s Index. These state-specific poverty linesof 1973-1974 are updated for later years using state-specific price indices especially constructedby averaging the Consumer Price Index of Agricultural Labourers (CPIAL) of (a) food, (b) fueland light, (c) clothing and footwear, and (d) miscellaneous items with their respective weightsin the consumption basket of the poor in 1973-1974 at the national level.
2 The Expert Group submitted its Report in July 1993. The Government has adopted the Expert Group methodology forpoverty estimation since March 1997 as the basis for computing the official estimates of poverty in India.
SECTION IIIPOVERTY INDICATORS
6 MAY 2004
POVERTY ESTIMATES IN INDIA: SOME KEY ISSUES
SAVITA SHARMA
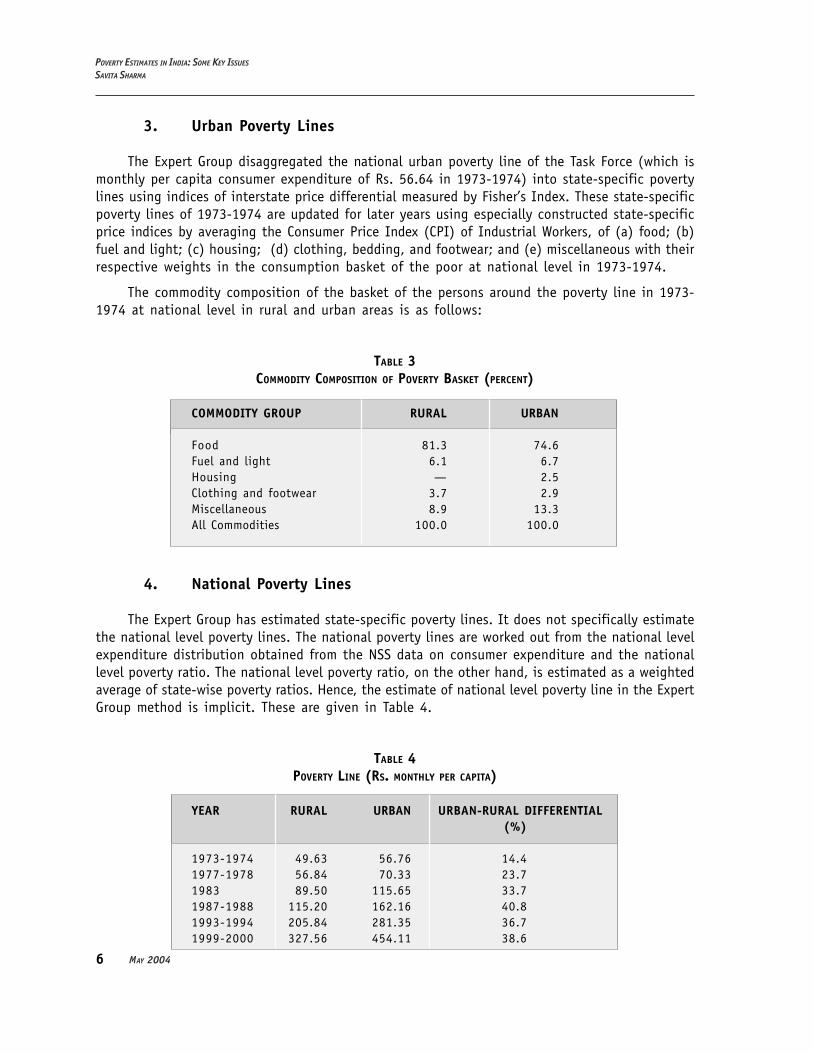
3. Urban Poverty Lines
The Expert Group disaggregated the national urban poverty line of the Task Force (which ismonthly per capita consumer expenditure of Rs. 56.64 in 1973-1974) into state-specific povertylines using indices of interstate price differential measured by Fisher’s Index. These state-specificpoverty lines of 1973-1974 are updated for later years using especially constructed state-specificprice indices by averaging the Consumer Price Index (CPI) of Industrial Workers, of (a) food; (b)fuel and light; (c) housing; (d) clothing, bedding, and footwear; and (e) miscellaneous with theirrespective weights in the consumption basket of the poor at national level in 1973-1974.
The commodity composition of the basket of the persons around the poverty line in 1973-1974 at national level in rural and urban areas is as follows:
TABLE 3COMMODITY COMPOSITION OF POVERTY BASKET (PERCENT)
COMMODITY GROUP RURAL URBAN
Food 81.3 74.6Fuel and light 6.1 6.7Housing — 2.5Clothing and footwear 3.7 2.9Miscellaneous 8.9 13.3All Commodities 100.0 100.0
4. National Poverty Lines
The Expert Group has estimated state-specific poverty lines. It does not specifically estimatethe national level poverty lines. The national poverty lines are worked out from the national levelexpenditure distribution obtained from the NSS data on consumer expenditure and the nationallevel poverty ratio. The national level poverty ratio, on the other hand, is estimated as a weightedaverage of state-wise poverty ratios. Hence, the estimate of national level poverty line in the ExpertGroup method is implicit. These are given in Table 4.
TABLE 4POVERTY LINE (RS. MONTHLY PER CAPITA)
YEAR RURAL URBAN URBAN-RURAL DIFFERENTIAL(%)
1973-1974 49.63 56.76 14.41977-1978 56.84 70.33 23.71983 89.50 115.65 33.71987-1988 115.20 162.16 40.81993-1994 205.84 281.35 36.71999-2000 327.56 454.11 38.6
7ERD WORKING PAPER SERIES NO. 51
SECTION IIIPOVERTY INDICATORS
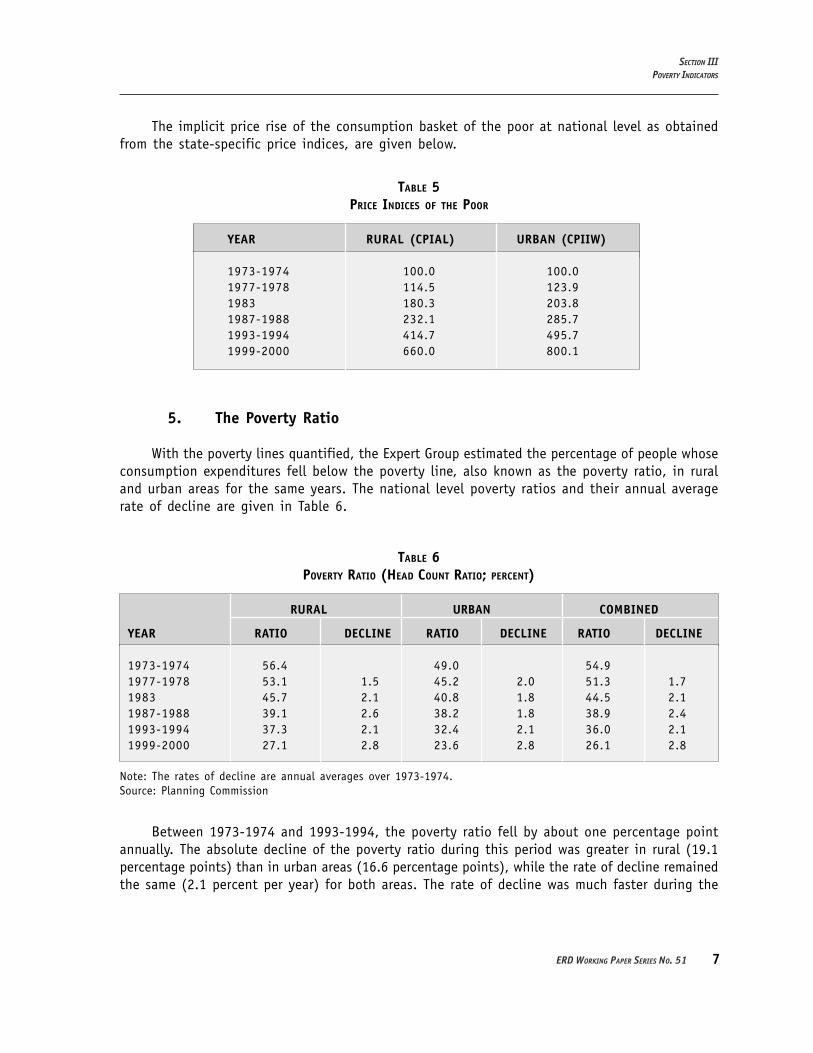
The implicit price rise of the consumption basket of the poor at national level as obtainedfrom the state-specific price indices, are given below.
TABLE 5PRICE INDICES OF THE POOR
YEAR RURAL (CPIAL) URBAN (CPIIW)
1973-1974 100.0 100.01977-1978 114.5 123.91983 180.3 203.81987-1988 232.1 285.71993-1994 414.7 495.71999-2000 660.0 800.1
5. The Poverty Ratio
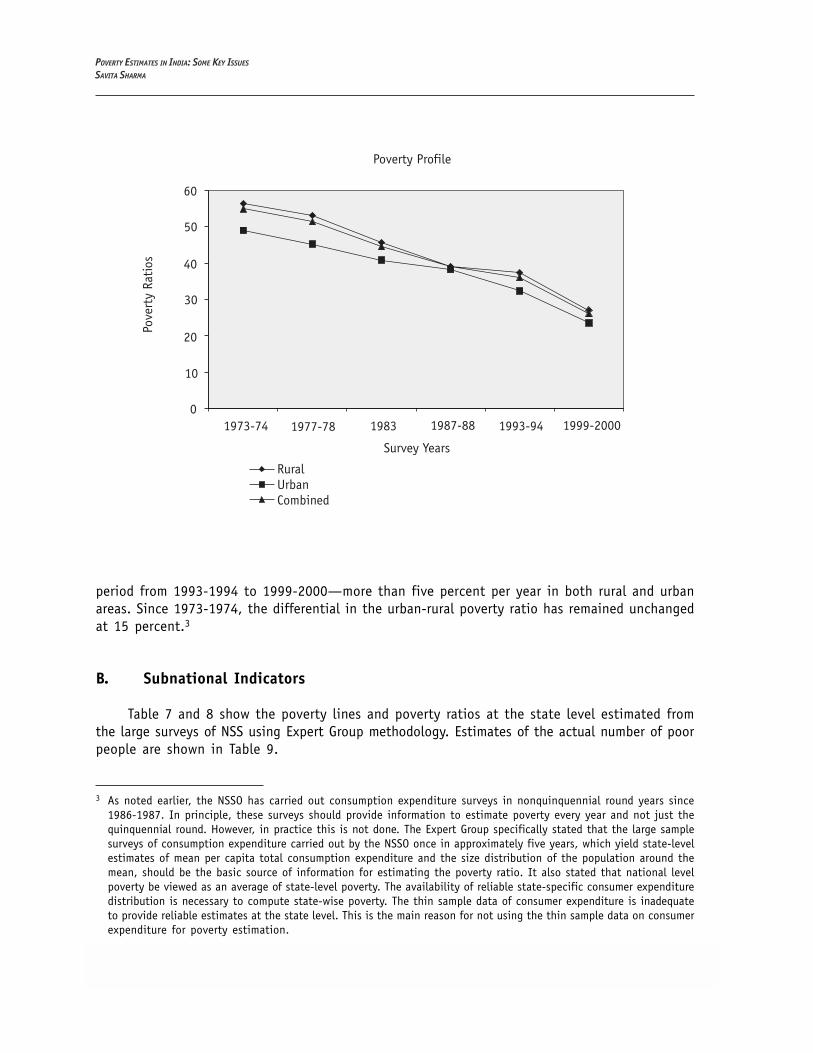
With the poverty lines quantified, the Expert Group estimated the percentage of people whoseconsumption expenditures fell below the poverty line, also known as the poverty ratio, in ruraland urban areas for the same years. The national level poverty ratios and their annual averagerate of decline are given in Table 6.
TABLE 6POVERTY RATIO (HEAD COUNT RATIO; PERCENT)
RURAL URBAN COMBINED
YEAR RATIO DECLINE RATIO DECLINE RATIO DECLINE
1973-1974 56.4 49.0 54.91977-1978 53.1 1.5 45.2 2.0 51.3 1.71983 45.7 2.1 40.8 1.8 44.5 2.11987-1988 39.1 2.6 38.2 1.8 38.9 2.41993-1994 37.3 2.1 32.4 2.1 36.0 2.11999-2000 27.1 2.8 23.6 2.8 26.1 2.8
Note: The rates of decline are annual averages over 1973-1974.Source: Planning Commission
Between 1973-1974 and 1993-1994, the poverty ratio fell by about one percentage pointannually. The absolute decline of the poverty ratio during this period was greater in rural (19.1percentage points) than in urban areas (16.6 percentage points), while the rate of decline remainedthe same (2.1 percent per year) for both areas. The rate of decline was much faster during the
8 MAY 2004
POVERTY ESTIMATES IN INDIA: SOME KEY ISSUES
SAVITA SHARMA
period from 1993-1994 to 1999-2000—more than five percent per year in both rural and urbanareas. Since 1973-1974, the differential in the urban-rural poverty ratio has remained unchangedat 15 percent.3
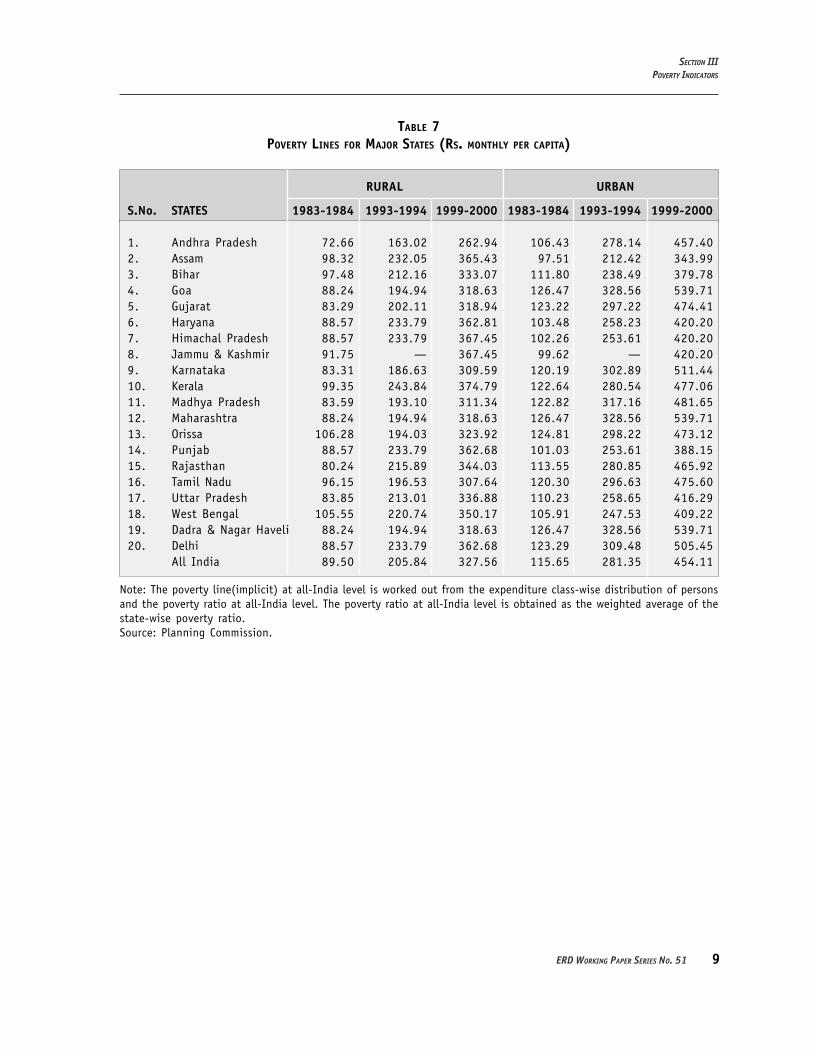
B. Subnational Indicators
Table 7 and 8 show the poverty lines and poverty ratios at the state level estimated fromthe large surveys of NSS using Expert Group methodology. Estimates of the actual number of poorpeople are shown in Table 9.
3 As noted earlier, the NSSO has carried out consumption expenditure surveys in nonquinquennial round years since1986-1987. In principle, these surveys should provide information to estimate poverty every year and not just thequinquennial round. However, in practice this is not done. The Expert Group specifically stated that the large samplesurveys of consumption expenditure carried out by the NSSO once in approximately five years, which yield state-levelestimates of mean per capita total consumption expenditure and the size distribution of the population around themean, should be the basic source of information for estimating the poverty ratio. It also stated that national levelpoverty be viewed as an average of state-level poverty. The availability of reliable state-specific consumer expendituredistribution is necessary to compute state-wise poverty. The thin sample data of consumer expenditure is inadequateto provide reliable estimates at the state level. This is the main reason for not using the thin sample data on consumerexpenditure for poverty estimation.
0
60
50
40
30
20
10
Pove
rty
Rati
os
Survey Years
1973-74 1977-78 1983 1987-88 1993-94 1999-2000
RuralUrbanCombined
Poverty Profile
9ERD WORKING PAPER SERIES NO. 51
TABLE 7POVERTY LINES FOR MAJOR STATES (RS. MONTHLY PER CAPITA)
RURAL URBAN
S.No. STATES 1983-1984 1993-1994 1999-2000 1983-1984 1993-1994 1999-2000
1. Andhra Pradesh 72.66 163.02 262.94 106.43 278.14 457.402. Assam 98.32 232.05 365.43 97.51 212.42 343.993. Bihar 97.48 212.16 333.07 111.80 238.49 379.784. Goa 88.24 194.94 318.63 126.47 328.56 539.715. Gujarat 83.29 202.11 318.94 123.22 297.22 474.416. Haryana 88.57 233.79 362.81 103.48 258.23 420.207. Himachal Pradesh 88.57 233.79 367.45 102.26 253.61 420.208. Jammu & Kashmir 91.75 — 367.45 99.62 — 420.209. Karnataka 83.31 186.63 309.59 120.19 302.89 511.4410. Kerala 99.35 243.84 374.79 122.64 280.54 477.0611. Madhya Pradesh 83.59 193.10 311.34 122.82 317.16 481.6512. Maharashtra 88.24 194.94 318.63 126.47 328.56 539.7113. Orissa 106.28 194.03 323.92 124.81 298.22 473.1214. Punjab 88.57 233.79 362.68 101.03 253.61 388.1515. Rajasthan 80.24 215.89 344.03 113.55 280.85 465.9216. Tamil Nadu 96.15 196.53 307.64 120.30 296.63 475.6017. Uttar Pradesh 83.85 213.01 336.88 110.23 258.65 416.2918. West Bengal 105.55 220.74 350.17 105.91 247.53 409.2219. Dadra & Nagar Haveli 88.24 194.94 318.63 126.47 328.56 539.7120. Delhi 88.57 233.79 362.68 123.29 309.48 505.45 All India 89.50 205.84 327.56 115.65 281.35 454.11
Note: The poverty line(implicit) at all-India level is worked out from the expenditure class-wise distribution of personsand the poverty ratio at all-India level. The poverty ratio at all-India level is obtained as the weighted average of thestate-wise poverty ratio.Source: Planning Commission.
SECTION IIIPOVERTY INDICATORS
10 MAY 2004
POVERTY ESTIMATES IN INDIA: SOME KEY ISSUES
SAVITA SHARMA
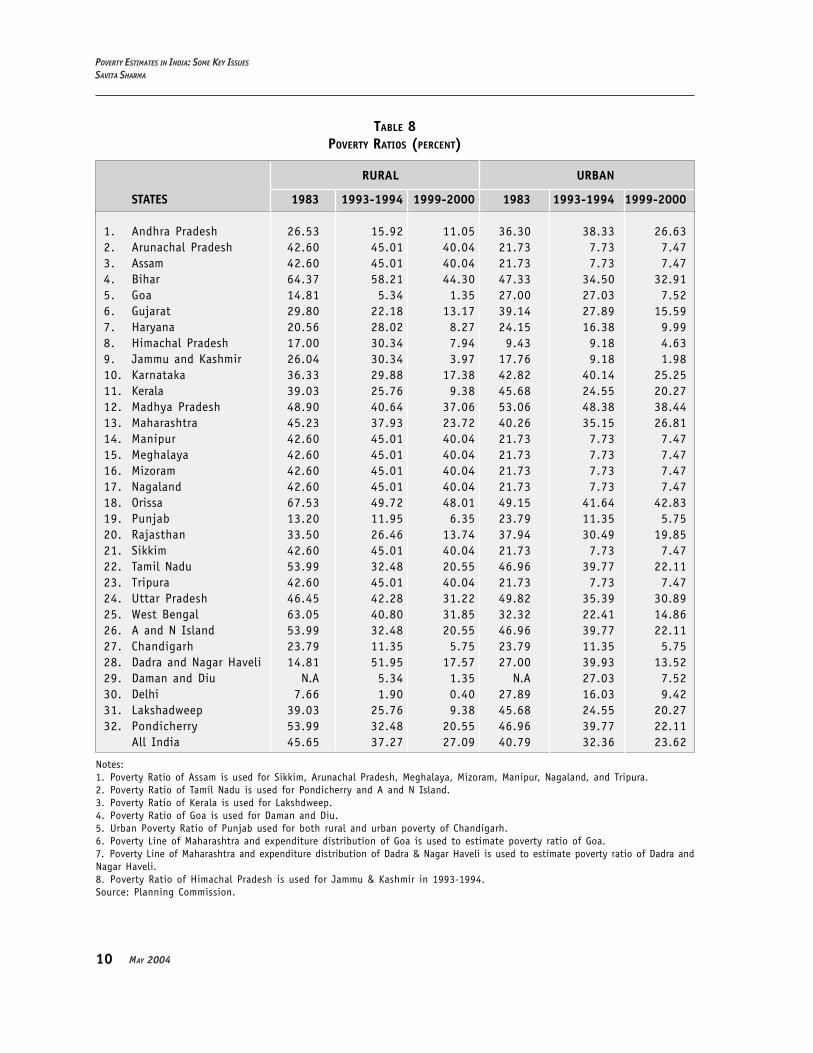
TABLE 8POVERTY RATIOS (PERCENT)
RURAL URBAN
STATES 1983 1993-1994 1999-2000 1983 1993-1994 1999-2000
1. Andhra Pradesh 26.53 15.92 11.05 36.30 38.33 26.632. Arunachal Pradesh 42.60 45.01 40.04 21.73 7.73 7.473. Assam 42.60 45.01 40.04 21.73 7.73 7.474. Bihar 64.37 58.21 44.30 47.33 34.50 32.915. Goa 14.81 5.34 1.35 27.00 27.03 7.526. Gujarat 29.80 22.18 13.17 39.14 27.89 15.597. Haryana 20.56 28.02 8.27 24.15 16.38 9.998. Himachal Pradesh 17.00 30.34 7.94 9.43 9.18 4.639. Jammu and Kashmir 26.04 30.34 3.97 17.76 9.18 1.9810. Karnataka 36.33 29.88 17.38 42.82 40.14 25.2511. Kerala 39.03 25.76 9.38 45.68 24.55 20.2712. Madhya Pradesh 48.90 40.64 37.06 53.06 48.38 38.4413. Maharashtra 45.23 37.93 23.72 40.26 35.15 26.8114. Manipur 42.60 45.01 40.04 21.73 7.73 7.4715. Meghalaya 42.60 45.01 40.04 21.73 7.73 7.4716. Mizoram 42.60 45.01 40.04 21.73 7.73 7.4717. Nagaland 42.60 45.01 40.04 21.73 7.73 7.4718. Orissa 67.53 49.72 48.01 49.15 41.64 42.8319. Punjab 13.20 11.95 6.35 23.79 11.35 5.7520. Rajasthan 33.50 26.46 13.74 37.94 30.49 19.8521. Sikkim 42.60 45.01 40.04 21.73 7.73 7.4722. Tamil Nadu 53.99 32.48 20.55 46.96 39.77 22.1123. Tripura 42.60 45.01 40.04 21.73 7.73 7.4724. Uttar Pradesh 46.45 42.28 31.22 49.82 35.39 30.8925. West Bengal 63.05 40.80 31.85 32.32 22.41 14.8626. A and N Island 53.99 32.48 20.55 46.96 39.77 22.1127. Chandigarh 23.79 11.35 5.75 23.79 11.35 5.7528. Dadra and Nagar Haveli 14.81 51.95 17.57 27.00 39.93 13.5229. Daman and Diu N.A 5.34 1.35 N.A 27.03 7.5230. Delhi 7.66 1.90 0.40 27.89 16.03 9.4231. Lakshadweep 39.03 25.76 9.38 45.68 24.55 20.2732. Pondicherry 53.99 32.48 20.55 46.96 39.77 22.11
All India 45.65 37.27 27.09 40.79 32.36 23.62
Notes:1. Poverty Ratio of Assam is used for Sikkim, Arunachal Pradesh, Meghalaya, Mizoram, Manipur, Nagaland, and Tripura.2. Poverty Ratio of Tamil Nadu is used for Pondicherry and A and N Island.3. Poverty Ratio of Kerala is used for Lakshdweep.4. Poverty Ratio of Goa is used for Daman and Diu.5. Urban Poverty Ratio of Punjab used for both rural and urban poverty of Chandigarh.6. Poverty Line of Maharashtra and expenditure distribution of Goa is used to estimate poverty ratio of Goa.7. Poverty Line of Maharashtra and expenditure distribution of Dadra & Nagar Haveli is used to estimate poverty ratio of Dadra andNagar Haveli.8. Poverty Ratio of Himachal Pradesh is used for Jammu & Kashmir in 1993-1994.Source: Planning Commission.

11ERD WORKING PAPER SERIES NO. 51
TABLE 9NUMBER OF POOR (MILLION)
RURAL URBAN
S.No. STATES/U.Ts 1983-1984 1993-1994 1999-2000 1983-1984 1993-1994 1999-2000
1. Andhra Pradesh 11.43 7.95 5.81 5.03 7.45 6.092. Arunachal Pradesh 0.27 0.36 0.38 0.01 0.01 0.023. Assam 7.34 9.43 9.22 0.43 0.20 0.244. Bihar 41.77 45.09 37.65 4.43 4.25 4.915. Goa 0.12 0.04 0.01 0.10 0.15 0.066. Gujarat 7.29 6.22 3.98 4.50 4.30 2.817. Haryana 2.20 3.66 1.19 0.76 0.73 0.548. Himachal Pradesh 0.71 1.54 0.48 0.03 0.05 0.039. Jammu and Kashmir 1.31 1.90 0.30 0.25 0.19 0.0510. Karnataka 10.05 9.60 5.99 4.93 6.05 4.4511. Kerala 8.16 5.59 2.09 2.52 2.05 2.0112. Madhya Pradesh 21.55 21.62 21.73 6.25 8.23 8.1213. Maharashtra 19.37 19.33 12.51 9.72 11.19 10.2914. Manipur 0.48 0.63 0.65 0.08 0.05 0.0715. Meghalaya 0.50 0.71 0.79 0.06 0.03 0.0316. Mizoram 0.16 0.16 0.14 0.04 0.03 0.0517. Nagaland 0.32 0.48 0.52 0.03 0.02 0.0318. Orissa 16.46 14.09 14.37 1.67 1.97 2.5419. Punjab 1.67 1.77 1.02 1.19 0.74 0.4320. Rajasthan 9.67 9.47 5.50 3.01 3.38 2.6821. Sikkim 0.12 0.18 0.20 0.01 0.003 0.0122. Tamil Nadu 18.16 12.17 8.05 7.85 8.04 5.0023. Tripura 0.83 1.14 1.25 0.06 0.04 0.0524. Uttar Pradesh 44.80 49.62 41.20 10.87 10.83 11.7925. West Bengal 26.86 20.99 18.01 5.01 4.47 3.3426. Andaman and Nicobar 0.08 0.07 0.06 0.03 0.03 0.0227. Chandigarh 0.01 0.01 0.01 0.11 0.07 0.0428. Dadra and Nagar Haveli 0.02 0.07 0.03 0.002 0.01 0.00329. Daman and Diu — 0.003 .001 — 0.02 0.0130. Delhi 0 .04 0.02 0.01 1.80 1.53 1.1431. Lakshadweep 0.01 0.01 0.003 0.01 0.01 0.0132. Pondicherry 0 .16 0.09 0.06 0.17 0.24 0.18 All India 251.96 244.03 193.24 70.94 76.34 67.01
Source: Planning Commission.
SECTION IIIPOVERTY INDICATORS
12 MAY 2004
POVERTY ESTIMATES IN INDIA: SOME KEY ISSUES
SAVITA SHARMA
The share of southern states of Andhra Pradesh, Karnataka, Kerala, and Tamil Nadu in totalnumber of poor decreased from 18 percent in 1993-1994 to 15 percent in 1999-2000 while theirshare of the population remained at 23 percent of total population. In comparison, the share ofthe states of Bihar, Orissa, Madhya Pradesh, Uttar Pradesh, and West Bengal in the total numberof poor rose from 57 percent in 1993-1994 to 63 percent in 1999-2000 as against their shareof 46 percent to total population in both years.
IV. CONSUMPTION EXPENDITURE
A. Per Capita Consumption Expenditure
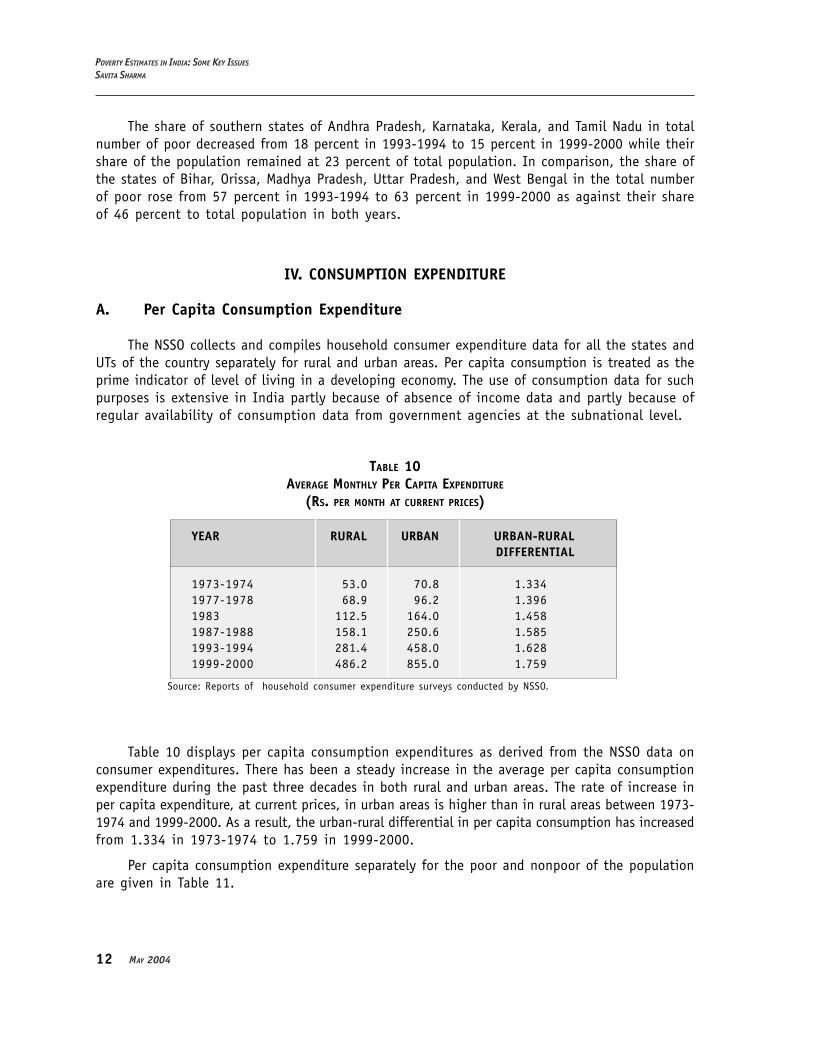
The NSSO collects and compiles household consumer expenditure data for all the states andUTs of the country separately for rural and urban areas. Per capita consumption is treated as theprime indicator of level of living in a developing economy. The use of consumption data for suchpurposes is extensive in India partly because of absence of income data and partly because ofregular availability of consumption data from government agencies at the subnational level.
TABLE 10AVERAGE MONTHLY PER CAPITA EXPENDITURE
(RS. PER MONTH AT CURRENT PRICES)
YEAR RURAL URBAN URBAN-RURALDIFFERENTIAL
1973-1974 53.0 70.8 1.3341977-1978 68.9 96.2 1.3961983 112.5 164.0 1.4581987-1988 158.1 250.6 1.5851993-1994 281.4 458.0 1.6281999-2000 486.2 855.0 1.759
Source: Reports of household consumer expenditure surveys conducted by NSSO.
Table 10 displays per capita consumption expenditures as derived from the NSSO data onconsumer expenditures. There has been a steady increase in the average per capita consumptionexpenditure during the past three decades in both rural and urban areas. The rate of increase inper capita expenditure, at current prices, in urban areas is higher than in rural areas between 1973-1974 and 1999-2000. As a result, the urban-rural differential in per capita consumption has increasedfrom 1.334 in 1973-1974 to 1.759 in 1999-2000.
Per capita consumption expenditure separately for the poor and nonpoor of the populationare given in Table 11.

13ERD WORKING PAPER SERIES NO. 51
SECTION IVCONSUMPTION EXPENDITURE
TABLE 11AVERAGE MONTHLY PER CAPITA EXPENDITURE
(RS. PER MONTH AT CURRENT PRICES)
RURAL URBAN
YEAR POOR NONPOOR POOR NONPOOR
1973-1974 35.10 76.30 41.00 97.001977-1978 39.80 101.10 50.00 134.601983 65.00 152.40 85.70 218.001987-1988 88.30 203.10 120.00 331.401993-1994 159.20 353.60 212.80 575.401999-2000 265.80 567.40 361.00 1007.30
Source: Estimated from the household consumer expenditure data of the NSS, various Rounds.
As a result of the reduction in inequality in the distribution of interpersonal consumption,the per capita consumption expenditure of the poor in rural areas increased faster than that ofthe nonpoor. The ratio of per capita consumption expenditure of poor to nonpoor increased from0.39 in 1977-1978 to 0.47 in 1999-2000 in the rural areas. In the urban areas, however, the samedeclined marginally from 0.37 to 0.36 during the same period.
B. Distribution of Expenditure
However, the increase in per capita expenditure alone is not enough to reduce poverty. Thedistribution of per capita expenditure across the income classes is equally important. The incidenceof poverty is positively associated with the Lorenz ratio, which is a measure of inequality in thedistribution of consumption expenditure. The Lorenz ratio estimated separately for rural and urbanareas for the six NSS years are given in Table 12.
TABLE 12LORENZ RATIO (GINI COEFFICIENT)
YEAR RURAL URBAN
1973-1974 0.2758 0.30131977-1978 0.3386 0.34481983 0.2976 0.33031987-1988 0.2983 0.35371993-1994 0.2819 0.34001999-2000 0.2595 0.3417
There are opposing trends in the distribution of expenditure per capita between rural andurban areas. While the distribution improved in the rural areas, with the Lorenz ratio falling from0.2758 in 1973-1974 to 0.2595 in 1999-2000, it worsened in the urban areas, with the Lorenzratio rising from 0.3013 in 1973-1974 to 0.3417 in 1999-2000.
14 MAY 2004
POVERTY ESTIMATES IN INDIA: SOME KEY ISSUES
SAVITA SHARMA
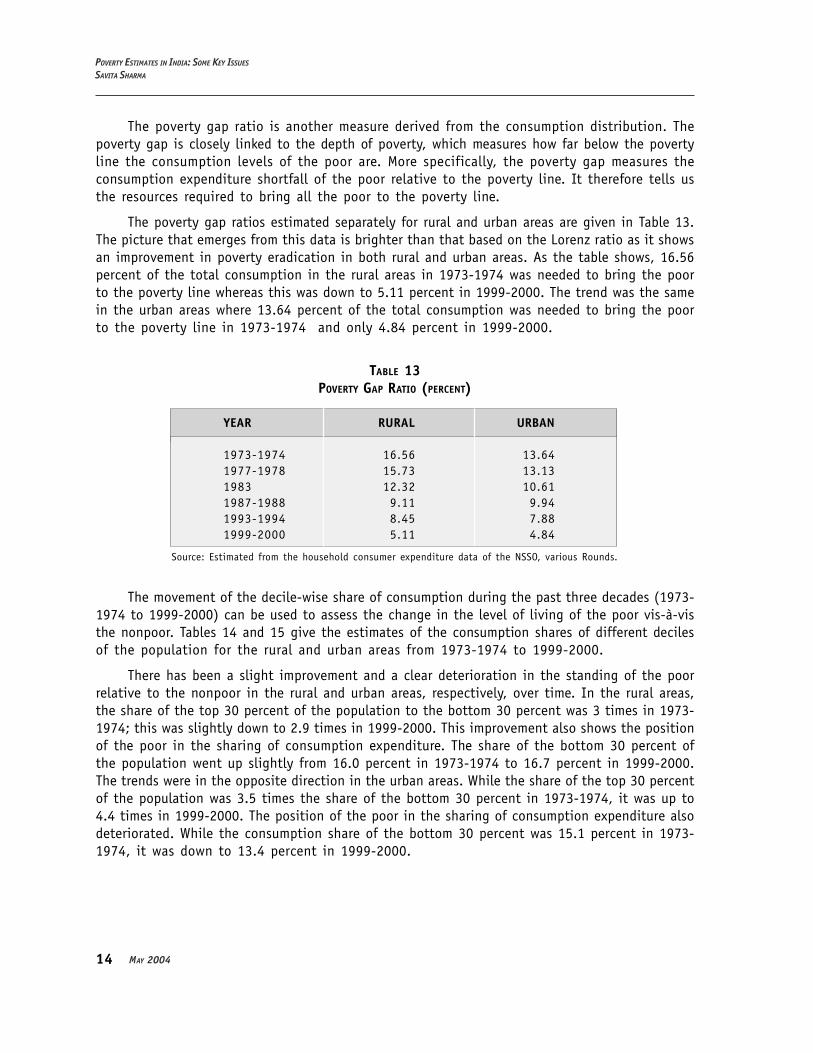
The poverty gap ratio is another measure derived from the consumption distribution. Thepoverty gap is closely linked to the depth of poverty, which measures how far below the povertyline the consumption levels of the poor are. More specifically, the poverty gap measures theconsumption expenditure shortfall of the poor relative to the poverty line. It therefore tells usthe resources required to bring all the poor to the poverty line.
The poverty gap ratios estimated separately for rural and urban areas are given in Table 13.The picture that emerges from this data is brighter than that based on the Lorenz ratio as it showsan improvement in poverty eradication in both rural and urban areas. As the table shows, 16.56percent of the total consumption in the rural areas in 1973-1974 was needed to bring the poorto the poverty line whereas this was down to 5.11 percent in 1999-2000. The trend was the samein the urban areas where 13.64 percent of the total consumption was needed to bring the poorto the poverty line in 1973-1974 and only 4.84 percent in 1999-2000.
TABLE 13POVERTY GAP RATIO (PERCENT)
YEAR RURAL URBAN
1973-1974 16.56 13.641977-1978 15.73 13.131983 12.32 10.611987-1988 9.11 9.941993-1994 8.45 7.881999-2000 5.11 4.84
Source: Estimated from the household consumer expenditure data of the NSSO, various Rounds.
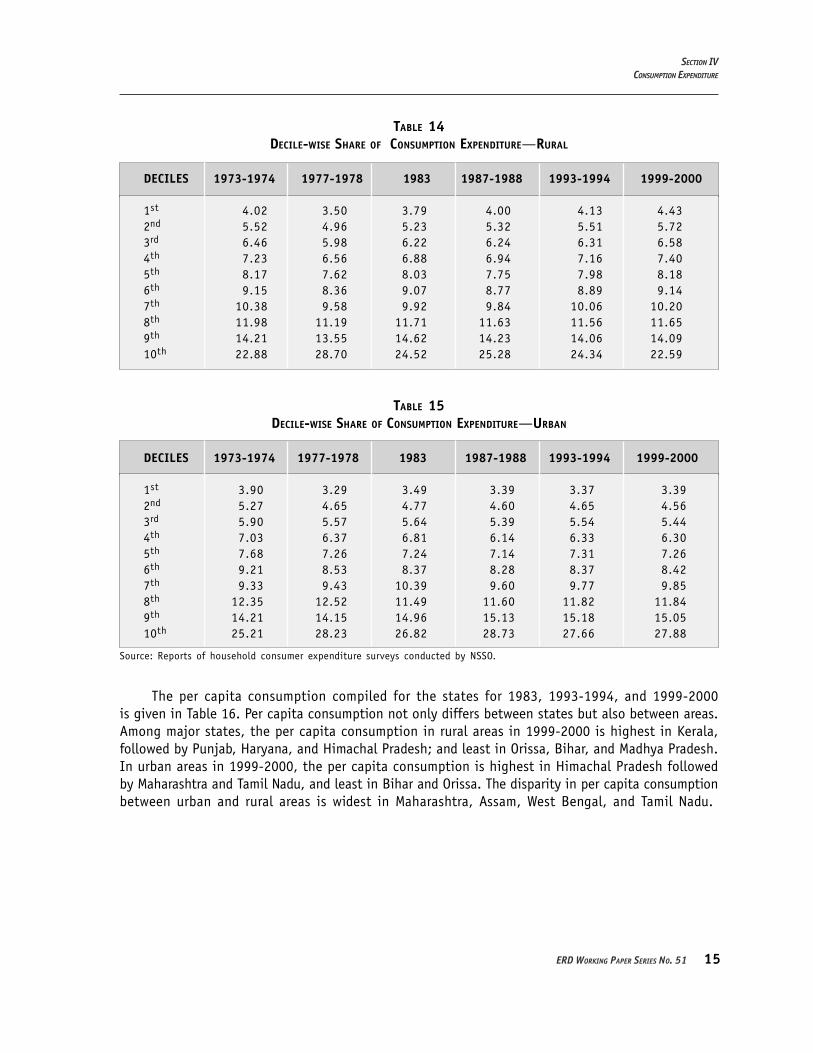
The movement of the decile-wise share of consumption during the past three decades (1973-1974 to 1999-2000) can be used to assess the change in the level of living of the poor vis-à-visthe nonpoor. Tables 14 and 15 give the estimates of the consumption shares of different decilesof the population for the rural and urban areas from 1973-1974 to 1999-2000.
There has been a slight improvement and a clear deterioration in the standing of the poorrelative to the nonpoor in the rural and urban areas, respectively, over time. In the rural areas,the share of the top 30 percent of the population to the bottom 30 percent was 3 times in 1973-1974; this was slightly down to 2.9 times in 1999-2000. This improvement also shows the positionof the poor in the sharing of consumption expenditure. The share of the bottom 30 percent ofthe population went up slightly from 16.0 percent in 1973-1974 to 16.7 percent in 1999-2000.The trends were in the opposite direction in the urban areas. While the share of the top 30 percentof the population was 3.5 times the share of the bottom 30 percent in 1973-1974, it was up to4.4 times in 1999-2000. The position of the poor in the sharing of consumption expenditure alsodeteriorated. While the consumption share of the bottom 30 percent was 15.1 percent in 1973-1974, it was down to 13.4 percent in 1999-2000.
15ERD WORKING PAPER SERIES NO. 51
SECTION IVCONSUMPTION EXPENDITURE
TABLE 14DECILE-WISE SHARE OF CONSUMPTION EXPENDITURE—RURAL
DECILES 1973-1974 1977-1978 1983 1987-1988 1993-1994 1999-2000
1st 4.02 3.50 3.79 4.00 4.13 4.432nd 5.52 4.96 5.23 5.32 5.51 5.723rd 6.46 5.98 6.22 6.24 6.31 6.584th 7.23 6.56 6.88 6.94 7.16 7.405th 8.17 7.62 8.03 7.75 7.98 8.186th 9.15 8.36 9.07 8.77 8.89 9.147th 10.38 9.58 9.92 9.84 10.06 10.208th 11.98 11.19 11.71 11.63 11.56 11.659th 14.21 13.55 14.62 14.23 14.06 14.0910th 22.88 28.70 24.52 25.28 24.34 22.59
TABLE 15DECILE-WISE SHARE OF CONSUMPTION EXPENDITURE—URBAN
DECILES 1973-1974 1977-1978 1983 1987-1988 1993-1994 1999-2000
1st 3.90 3.29 3.49 3.39 3.37 3.392nd 5.27 4.65 4.77 4.60 4.65 4.563rd 5.90 5.57 5.64 5.39 5.54 5.444th 7.03 6.37 6.81 6.14 6.33 6.305th 7.68 7.26 7.24 7.14 7.31 7.266th 9.21 8.53 8.37 8.28 8.37 8.427th 9.33 9.43 10.39 9.60 9.77 9.858th 12.35 12.52 11.49 11.60 11.82 11.849th 14.21 14.15 14.96 15.13 15.18 15.0510th 25.21 28.23 26.82 28.73 27.66 27.88
Source: Reports of household consumer expenditure surveys conducted by NSSO.
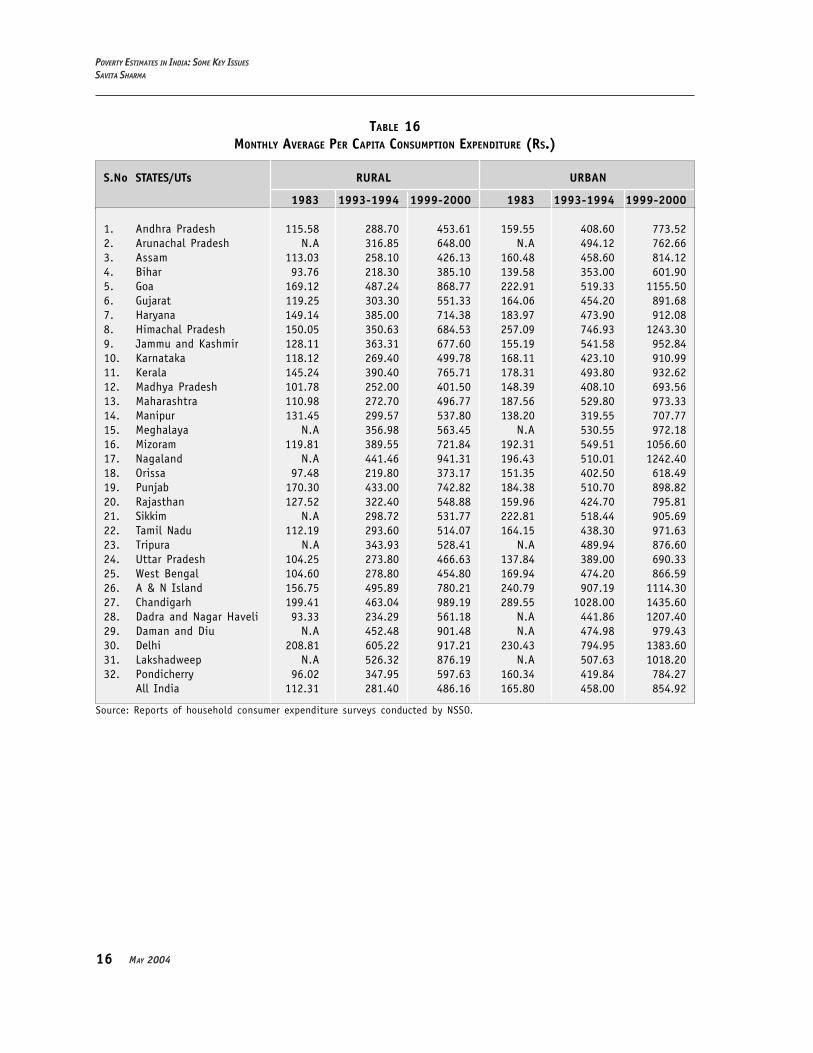
The per capita consumption compiled for the states for 1983, 1993-1994, and 1999-2000is given in Table 16. Per capita consumption not only differs between states but also between areas.Among major states, the per capita consumption in rural areas in 1999-2000 is highest in Kerala,followed by Punjab, Haryana, and Himachal Pradesh; and least in Orissa, Bihar, and Madhya Pradesh.In urban areas in 1999-2000, the per capita consumption is highest in Himachal Pradesh followedby Maharashtra and Tamil Nadu, and least in Bihar and Orissa. The disparity in per capita consumptionbetween urban and rural areas is widest in Maharashtra, Assam, West Bengal, and Tamil Nadu.
16 MAY 2004
POVERTY ESTIMATES IN INDIA: SOME KEY ISSUES
SAVITA SHARMA
TABLE 16MONTHLY AVERAGE PER CAPITA CONSUMPTION EXPENDITURE (RS.)
S.No STATES/UTs RURAL URBAN
1983 1993-1994 1999-2000 1983 1993-1994 1999-2000
1. Andhra Pradesh 115.58 288.70 453.61 159.55 408.60 773.522. Arunachal Pradesh N.A 316.85 648.00 N.A 494.12 762.663. Assam 113.03 258.10 426.13 160.48 458.60 814.124. Bihar 93.76 218.30 385.10 139.58 353.00 601.905. Goa 169.12 487.24 868.77 222.91 519.33 1155.506. Gujarat 119.25 303.30 551.33 164.06 454.20 891.687. Haryana 149.14 385.00 714.38 183.97 473.90 912.088. Himachal Pradesh 150.05 350.63 684.53 257.09 746.93 1243.309. Jammu and Kashmir 128.11 363.31 677.60 155.19 541.58 952.8410. Karnataka 118.12 269.40 499.78 168.11 423.10 910.9911. Kerala 145.24 390.40 765.71 178.31 493.80 932.6212. Madhya Pradesh 101.78 252.00 401.50 148.39 408.10 693.5613. Maharashtra 110.98 272.70 496.77 187.56 529.80 973.3314. Manipur 131.45 299.57 537.80 138.20 319.55 707.7715. Meghalaya N.A 356.98 563.45 N.A 530.55 972.1816. Mizoram 119.81 389.55 721.84 192.31 549.51 1056.6017. Nagaland N.A 441.46 941.31 196.43 510.01 1242.4018. Orissa 97.48 219.80 373.17 151.35 402.50 618.4919. Punjab 170.30 433.00 742.82 184.38 510.70 898.8220. Rajasthan 127.52 322.40 548.88 159.96 424.70 795.8121. Sikkim N.A 298.72 531.77 222.81 518.44 905.6922. Tamil Nadu 112.19 293.60 514.07 164.15 438.30 971.6323. Tripura N.A 343.93 528.41 N.A 489.94 876.6024. Uttar Pradesh 104.25 273.80 466.63 137.84 389.00 690.3325. West Bengal 104.60 278.80 454.80 169.94 474.20 866.5926. A & N Island 156.75 495.89 780.21 240.79 907.19 1114.3027. Chandigarh 199.41 463.04 989.19 289.55 1028.00 1435.6028. Dadra and Nagar Haveli 93.33 234.29 561.18 N.A 441.86 1207.4029. Daman and Diu N.A 452.48 901.48 N.A 474.98 979.4330. Delhi 208.81 605.22 917.21 230.43 794.95 1383.6031. Lakshadweep N.A 526.32 876.19 N.A 507.63 1018.2032. Pondicherry 96.02 347.95 597.63 160.34 419.84 784.27
All India 112.31 281.40 486.16 165.80 458.00 854.92
Source: Reports of household consumer expenditure surveys conducted by NSSO.
17ERD WORKING PAPER SERIES NO. 51
V. QUALITY OF DATA
Two developments impinge on the quality of data on poverty in India. The first relates tothe changes in recall periods introduced by the NSSO in its 51st to 54th Rounds of the ConsumerExpenditure Survey. As a result of these changes, the reliability of some data is put in doubt andplanners find themselves in a dilemma in the use of the collected data for making meaningfulpoverty comparisons. The second and definitely more serious development pertains to the sourceof the consumption expenditure data. The data generated by NSSO consumer expenditure surveysthat constitute the principal basis of current poverty estimates diverge from equivalent estimatesderived from the National Accounts Statistics (NAS) and the divergence seems to increase overtime. The conciliation of these diverging figures is currently the subject of serious study.
A. Changes in Recall Period
The consumer expenditure survey conducted by NSSO in 1999-2000 was a much-awaited surveyfrom the point of view of assessing the impact of economic reforms on the incidence of poverty.The NSSO in its attempt to experiment on the choice of appropriate recall period in the consumerexpenditure surveys made some changes in the method of data collection. Starting with the 51st
Round (July 1944 to June 1995) and proceeding to the 52nd (July 1995 to June 1996), 53rd
(January to December 1977), and 54th Rounds (January to June 1998) of the survey, the NSSOdivided the entire sample of households into two equal groups. In one group, the data, in conformitywith past practice, were collected with a uniform recall period of 30 days for all the items. Forthe other group of households, the recall period for different items was chosen as follows:
(i) 7-day for food, pan, tobacco, and intoxicants
(ii) 30-day for fuel and light, miscellaneous goods and services, and medical(noninstitutional)
(iii) 365-day for educational, medical (institutional), clothing, footwear, and durable goods
Thus, in this experiment the data on 30-day recall period and 7/30/365-day recall periodswere collected from two different sets of households by two different investigators independentof each other.
The experiment with recall period was extended to the large sample survey of the 55th Roundalbeit under an altered format. Instead of administering the 7-day and 30-day recall for foodexpenditure to the different groups of households as in the 51st to 54th Round, the NSSO in the55th Round collected the consumption expenditure data from the same households in the followingmanner:
(i) By collecting data on consumption of food items (including pan, tobacco, andintoxicants) using two different recall periods of 7-day and 30-day from the samehouseholds.
(ii) By collecting consumption expenditure data in respect of selected nonfood items, suchas clothing, footwear, medical (institutional), and durable goods using 365-day recallperiod.
SECTION VQUALITY OF DATA

18 MAY 2004
POVERTY ESTIMATES IN INDIA: SOME KEY ISSUES
SAVITA SHARMA
(iii) In case of the remaining nonfood items, by collecting the consumption expenditure datausing 30-day recall period.
In the process two changes took place:
(i) Monthly per capita consumption expenditure for clothing, footwear, medical(institutional), and durable goods in the 55th Round was based on 365-day recall periodwhereas it was based on 30-days in earlier large-scale surveys.
(ii) The data on food expenditure collection based on two different recall periods from thesame households in the 55th Round resulted in a mix-up of responses to the recall periodsand thus affected the comparability of this data set with the earlier ones.
The consumption expenditure data estimated from the two groups of households in the 51st
to 54th Rounds and also from the same households in the 55th Round are as follows (Tables 17aand 17b):
TABLE 17A
AVERAGE MONTHLY PER CAPITA CONSUMPTION EXPENDITURE (RS.)
PERIOD/NSS ROUND30-DAY 30-DAY 7-DAY 7-DAYRURAL URBAN RURAL URBAN
July 1994 to June 1995 (NSS 51st Round) 309.43 508.07 353.77 601.49July 1995 to June 1996 (NSS 52nd Round) 344.29 599.26 404.67 678.25January 1997 to December 1997 (NSS 53rd Round) 395.01 645.44 445.28 736.06January 1998 to June 1998 (NSS 54th Round) 382.07 684.27 451.11 774.94July 1999 to June 2000 (NSS 55th Round) 486.07 854.96 505.20 878.74
TABLE 17B
INCREASE IN PER CAPITA CONSUMPTION EXPENDITURE
(7-DAY OVER 30-DAY, PERCENT )
PERIOD/NSS ROUND RURAL URBAN
July 1994 to June 1995 (NSS 51st Round) 14.3 18.4July 1995 to June 1996 (NSS 52nd Round) 17.5 13.2January 1997 to December 1997 (NSS 53rd Round) 12.7 14.0January 1998 to June 1998 (NSS 54th Round) 18.1 13.3July 1999 to June 2000 (NSS 55th Round) 3.9 2.8
19ERD WORKING PAPER SERIES NO. 51
The above tables show two things. First, the consumption expenditure collected from the 7-day recall period in the 51st to 54th Rounds is 13 to 18 percent higher than that obtained fromthe 30-day recall period whereas this difference in the 55th Round is only 3 to 4 percent. The patternobserved in the differences of consumption expenditure due to change in the recall period duringthe 51st to 54th Round is missing in the 55th Round and perhaps can be attributed to the mix-up of responses to the recall periods. Second, since monthly expenditures are found to be higherwhen lower recall periods are used, the introduction of a 7-day recall period for some componentsof consumption in the latest large-scale round may weaken the comparability of consumptionestimates across Round 55 and the earlier large-scale rounds. These changes have left the plannersin a dilemma about the use of this data for making meaningful poverty comparisons.
B. The Sources of Data
There are two sources of consumption expenditure data in India: the NSSO surveys and NationalAccounts Statistics (NAS). The poverty estimates reported in Section III are based on consumptionexpenditures from the NSSO following the recommendations of the Expert Group on Estimationof Proportion and Number of Poor set up by the Planning Commission.4 Alternative estimates ofpoverty may be derived by taking into account consumption expenditure data obtained from theNAS. Since there may be serious differences between the two sets of poverty estimates (stemmingfrom differences in measured consumption expenditures), this section delves into some of thedetails surrounding this issue.
In India, the private final consumption expenditure (PFCE) is generated from two sources.First, as a part of the NAS, the Central Statistical Organisation (CSO) compiles annually the estimatesof private consumption. Second, the Household Consumer Expenditure Surveys (HCES) of the NSSOyields the estimates of private consumption. The former is available as a macro estimate and ascalar for the nation as a whole while the latter estimates are available separately for differentstates (provinces) in rural and urban areas, which can be aggregated to a national estimate. Theestimates of private consumption from these two sources are different, primarily as these are derivedfrom different approaches. The difference between the two has created serious problems for planningfor development in India, particularly when poverty is used as a parameter in the planning exercises.This necessitates a look at the difference, its nature, and its pattern over time.
4 The recommendations of the Expert Group regarding the construction of the poverty line (see Section III) and theexclusive reliance on NSS data for consumption expenditures were accepted by the Government in 1997. In termsof the consumption expenditure data, this meant discontinuance of the earlier procedure of adjusting NSS consumptionexpenditures (upward), which had been proposed by the Task Force on Projection of Minimum Needs and EffectiveConsumption Demand constituted by the Planning Commission in 1979, so as to ensure consistency with NAS consumptionexpenditures.
SECTION VQUALITY OF DATA
20 MAY 2004
POVERTY ESTIMATES IN INDIA: SOME KEY ISSUES
SAVITA SHARMA
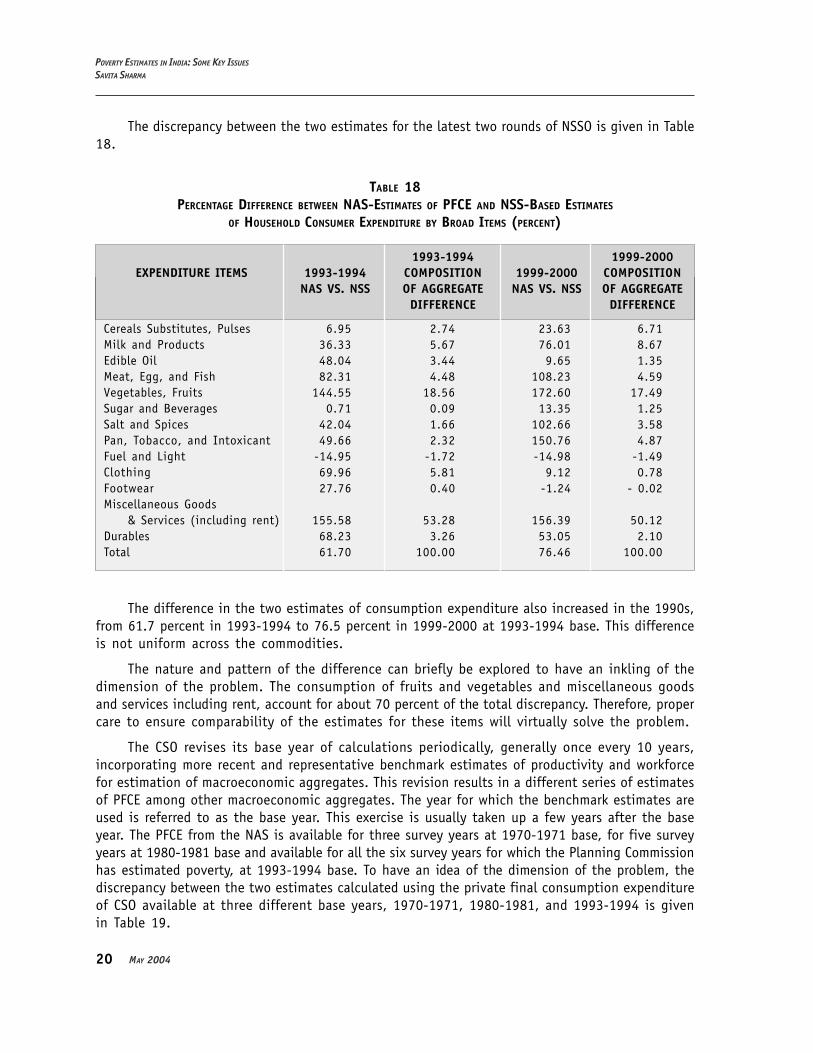
The discrepancy between the two estimates for the latest two rounds of NSSO is given in Table18.
TABLE 18PERCENTAGE DIFFERENCE BETWEEN NAS-ESTIMATES OF PFCE AND NSS-BASED ESTIMATES
OF HOUSEHOLD CONSUMER EXPENDITURE BY BROAD ITEMS (PERCENT)
1993-1994 1999-2000EXPENDITURE ITEMS 1993-1994 COMPOSITION 1999-2000 COMPOSITION
NAS VS. NSS OF AGGREGATE NAS VS. NSS OF AGGREGATEDIFFERENCE DIFFERENCE
Cereals Substitutes, Pulses 6.95 2.74 23.63 6.71Milk and Products 36.33 5.67 76.01 8.67Edible Oil 48.04 3.44 9.65 1.35Meat, Egg, and Fish 82.31 4.48 108.23 4.59Vegetables, Fruits 144.55 18.56 172.60 17.49Sugar and Beverages 0.71 0.09 13.35 1.25Salt and Spices 42.04 1.66 102.66 3.58Pan, Tobacco, and Intoxicant 49.66 2.32 150.76 4.87Fuel and Light -14.95 -1.72 -14.98 -1.49Clothing 69.96 5.81 9.12 0.78Footwear 27.76 0.40 -1.24 - 0.02Miscellaneous Goods
& Services (including rent) 155.58 53.28 156.39 50.12Durables 68.23 3.26 53.05 2.10Total 61.70 100.00 76.46 100.00
The difference in the two estimates of consumption expenditure also increased in the 1990s,from 61.7 percent in 1993-1994 to 76.5 percent in 1999-2000 at 1993-1994 base. This differenceis not uniform across the commodities.
The nature and pattern of the difference can briefly be explored to have an inkling of thedimension of the problem. The consumption of fruits and vegetables and miscellaneous goodsand services including rent, account for about 70 percent of the total discrepancy. Therefore, propercare to ensure comparability of the estimates for these items will virtually solve the problem.
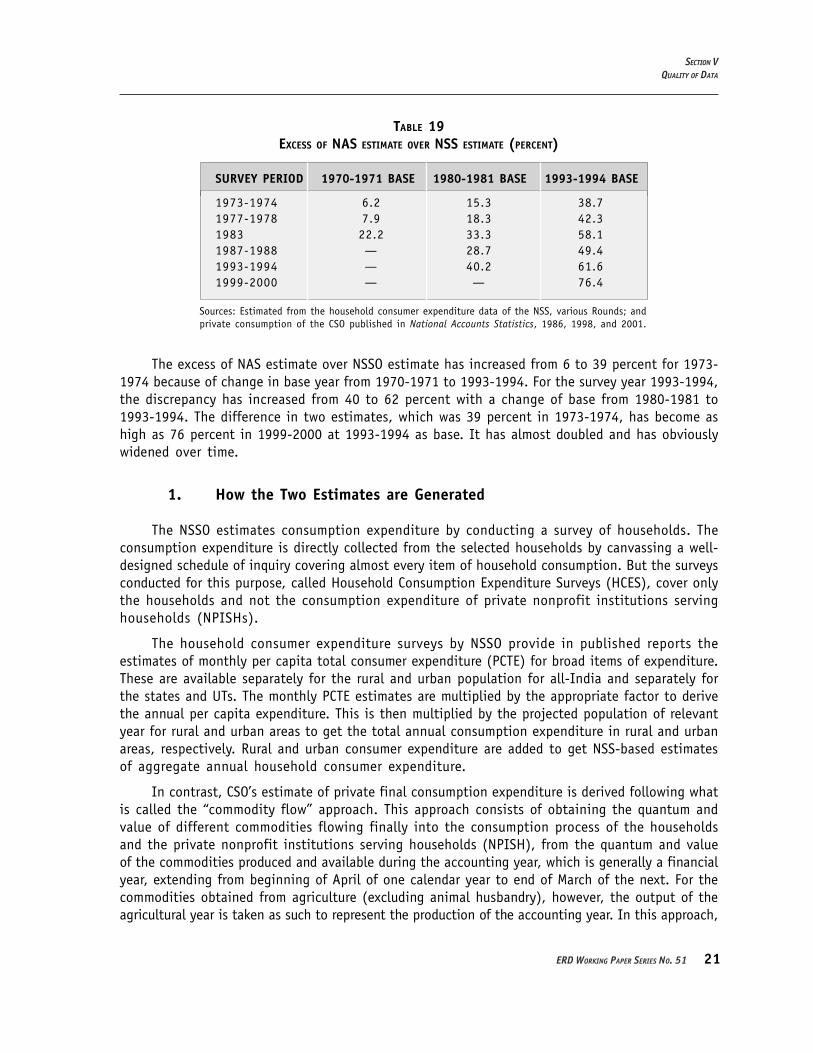
The CSO revises its base year of calculations periodically, generally once every 10 years,incorporating more recent and representative benchmark estimates of productivity and workforcefor estimation of macroeconomic aggregates. This revision results in a different series of estimatesof PFCE among other macroeconomic aggregates. The year for which the benchmark estimates areused is referred to as the base year. This exercise is usually taken up a few years after the baseyear. The PFCE from the NAS is available for three survey years at 1970-1971 base, for five surveyyears at 1980-1981 base and available for all the six survey years for which the Planning Commissionhas estimated poverty, at 1993-1994 base. To have an idea of the dimension of the problem, thediscrepancy between the two estimates calculated using the private final consumption expenditureof CSO available at three different base years, 1970-1971, 1980-1981, and 1993-1994 is givenin Table 19.
21ERD WORKING PAPER SERIES NO. 51
TABLE 19EXCESS OF NAS ESTIMATE OVER NSS ESTIMATE (PERCENT)
SURVEY PERIOD 1970-1971 BASE 1980-1981 BASE 1993-1994 BASE
1973-1974 6.2 15.3 38.71977-1978 7.9 18.3 42.31983 22.2 33.3 58.11987-1988 — 28.7 49.41993-1994 — 40.2 61.61999-2000 — — 76.4
Sources: Estimated from the household consumer expenditure data of the NSS, various Rounds; andprivate consumption of the CSO published in National Accounts Statistics, 1986, 1998, and 2001.
The excess of NAS estimate over NSSO estimate has increased from 6 to 39 percent for 1973-1974 because of change in base year from 1970-1971 to 1993-1994. For the survey year 1993-1994,the discrepancy has increased from 40 to 62 percent with a change of base from 1980-1981 to1993-1994. The difference in two estimates, which was 39 percent in 1973-1974, has become ashigh as 76 percent in 1999-2000 at 1993-1994 as base. It has almost doubled and has obviouslywidened over time.
1. How the Two Estimates are Generated
The NSSO estimates consumption expenditure by conducting a survey of households. Theconsumption expenditure is directly collected from the selected households by canvassing a well-designed schedule of inquiry covering almost every item of household consumption. But the surveysconducted for this purpose, called Household Consumption Expenditure Surveys (HCES), cover onlythe households and not the consumption expenditure of private nonprofit institutions servinghouseholds (NPISHs).
The household consumer expenditure surveys by NSSO provide in published reports theestimates of monthly per capita total consumer expenditure (PCTE) for broad items of expenditure.These are available separately for the rural and urban population for all-India and separately forthe states and UTs. The monthly PCTE estimates are multiplied by the appropriate factor to derivethe annual per capita expenditure. This is then multiplied by the projected population of relevantyear for rural and urban areas to get the total annual consumption expenditure in rural and urbanareas, respectively. Rural and urban consumer expenditure are added to get NSS-based estimatesof aggregate annual household consumer expenditure.
In contrast, CSO’s estimate of private final consumption expenditure is derived following whatis called the “commodity flow” approach. This approach consists of obtaining the quantum andvalue of different commodities flowing finally into the consumption process of the householdsand the private nonprofit institutions serving households (NPISH), from the quantum and valueof the commodities produced and available during the accounting year, which is generally a financialyear, extending from beginning of April of one calendar year to end of March of the next. For thecommodities obtained from agriculture (excluding animal husbandry), however, the output of theagricultural year is taken as such to represent the production of the accounting year. In this approach,
SECTION VQUALITY OF DATA
22 MAY 2004
POVERTY ESTIMATES IN INDIA: SOME KEY ISSUES
SAVITA SHARMA
intermediate consumption (the part used up in the process of further production), change in stocks,and exports net of imports are netted out from the value of the total output of a commodity ora commodity group to arrive at the estimate of its net availability in the domestic economy. Anamount is also discounted for the wastage of agricultural produce.
Having thus arrived at the estimate of net availability, the part used for capital formationand that used by the general government administration for current consumption are deductedfrom it to arrive at the commoditywise estimates of the value of private final consumption expenditure(PFCE) at current market prices. Hence private final consumption expenditure is derived as a residualin the national accounting system.
2. Comparability of the Two Estimates
The way they are generated, these two data sets are not strictly comparable. Apart from thedifferences in the coverage and reference time frames that are apparent, comparability of the twosets of estimates is constrained by the differences in the concepts and methods of estimation inherentin the very approaches employed by the two agencies. The differences in the concepts and methodof estimation of these two estimates are given below:
(i) NAS estimate of private financial consumption expenditure includes, in addition toconsumer expenditure by households, the current consumption expenditure bynongovernment private nonprofit institutions such as NGOs and universities; and thehomeless and the institutional population like the inhabitants of orphanages, prisons,and hospitals. The NSS estimates relate to consumption expenditure of the householdsalone.
(ii) The NAS estimates of final consumption expenditure are worked out from the productiondata of various goods and services, which are compiled primarily for estimation ofgross domestic product for the current (financial: April-March) accounting year. Sincethe data on agricultural production used for national accounting pertain to agricultural(July–June) year, the NAS estimates of consumption expenditure on agriculturalproduce essentially represent the consumption out of the current agricultural year’sproduction rather than the actual consumption during the financial year,notwithstanding the adjustments made for production flow into nonconsumption usesin the commodity-flow approach. For the HCES, on the other hand, the NSSO usuallyuses an agricultural year as the survey period, and thus the NSS estimates representthe actual consumption during the agricultural year. But since the production andconsumption of goods, particularly of agricultural produce, are events usually separatedin time by considerable gaps, whatever is produced during the agricultural year is notnecessarily consumed during the same period, nor is the current year’s consumptiondrawn entirely from the current year’s production. For reasons such as these, the NASestimates are strictly not comparable with the NSS estimates.
(iii) The two agencies use different classification schemes for grouping commodities andservices, namely, (a) expenditure on purchase and repairs of transport equipment isclassified under durables in the NSS estimate while it is included in the transport groupin the NAS estimates of PFCE; and (b) expenditure on cooked food given to the domestic
23ERD WORKING PAPER SERIES NO. 51
servants is included in the food group in the NSS. In the NAS, all the payments madeto the domestic servant are taken as expenses incurred for consumption of personalservices.
(iv) The NAS estimate of rent includes all imputed rentals of owner-occupied dwellingswhereas the NSS estimate is only the rent on dwellings actually paid.
(v) The NAS estimate of private consumption of foodgrain depends on data on output,seed, feed, wastage, imports and exports, changes in stock, government finalconsumption, and intermediate consumption. The basic data on output, based on cropestimation, are available from the Directorate of Economics and Statistics, Ministryof Agriculture. The seed and feed ratios used are based on current cost of cultivationstudies. The wastage ratios for most of the commodities are based on estimates availablefrom the Directorate of Market Intelligence (DMI). The estimated wastage ratios usedat present pertains to 1968-1969. The main source of annual data on intermediateconsumption for a number of commodities is also DMI. Data on imports and exportsare available on a regular basis from the Director General of Commercial Intelligenceand Statistics (DGCI&S), and estimates of government consumption expenditure arebased on the rates obtained from the latest input-output tables. The accuracy ofestimate of private consumption of food compiled in NAS depends on the accuracyof all the abovementioned components. The wastage ratios used are 30 years old. TheNSS estimate is the actual consumption expenditure on food during the period.
(vi) The NAS estimate of fruits and vegetables include fruit products such as pickles, sauce,jam, and jelly. NSS usually puts these in the miscellaneous food products.
(vii) In the NAS estimate of milk and milk products, milk products are overestimated becausea part of the volume of milk assumed to be used for butter and lassi production maybe used as intermediate consumption in enterprises producing other commodities likesweetmeat, tea and coffee, and hotel and restaurant services, consumption of whichare estimated separately in the NAS.
(viii) For deriving the NAS estimate of edible oil, varying ratios of intermediate consumptionare used for the different edible oils, but for vanaspati (hydrogenated oil) no adjustmentis made for its use in other industries. This appears to be an important reason forthe difference between the estimates of vanaspati consumption, since it is usedextensively in commercial establishments like halwais, hotels, and restaurants.
(ix) For meat, egg and fish, the reason for the discrepancy may be that the intermediateconsumption for most of the items of this group is taken as nil in the NAS. This appearsto be the main reason for the wide divergence between the two sets of estimates,particularly for eggs and chicken, since a large volume of these is actually used asinput in the food processing industries, hotels, and restaurants.
(x) For hotels and restaurants, the NAS estimate for hotel and restaurant is obtained fromthe estimate of gross value added (GVA), which is based on the results of EnterpriseSurvey on hotel and restaurants. For estimating private consumption for this item,first, an estimate of output of hotel and restaurants is derived from the estimate ofGVA. Out of the estimate of output, 33 percent is assumed to form part of privateconsumption. Thus, the NAS estimate obviously includes the accommodation charges
SECTION VQUALITY OF DATA
24 MAY 2004
POVERTY ESTIMATES IN INDIA: SOME KEY ISSUES
SAVITA SHARMA
in addition to the value of food served by the hotels and restaurants. Moreover, hotelsand restaurants not only serve meals to the consumers but also a variety of other fooditems like tea, snacks, and beverages. The NSSO, on the other hand, does not provideany estimate of consumption for this item-group as such. Instead it provides separateestimates of value of “cooked meals”, snacks, beverages, and “other processed food”purchased by the households. But, the entire value of the snacks, beverages, and “otherprocessed food” consumed by the households cannot be attributed to the restaurants.Thus the comparison here is restricted to the NAS estimate for ”hotels and restaurants”and the NSS estimate of purchased “cooked meals”, bearing in mind that comparabilityof these two estimates is severely constrained by the difference in coverage.
(xi) The NAS estimate of furniture, furnishings, appliances and services includes the notionalelement of nonlife insurance services, while the residual category ”miscellaneous goodsand services” includes the notional element of Financial Intermediation ServicesIndirectly Measured (FISIM) embodied in the banking and insurance services. Inclusionof these notional components in the NAS estimate of private consumption is inadherence to the standards set by the internationally accepted system of nationalaccounts. These notional components are not taken into account in the NSS estimate.
(xii) For NAS estimates on nonfood consumption, varying approaches are adopted fordifferent item-groups. The estimates for the manufactured goods are obtained by thecommodity flow approach, while those for fuel and services are derived by varyingother approaches.
(xiii) The NSS estimate of consumption expenditure on fuel and light has always been higherthan that of the NAS. In the 1993-1994 series, the NAS estimate of firewood productionis derived from the NSS estimate of household fuel wood consumption by deductingfrom it the value of agricultural waste (since it is included in the agricultural productionas by-products) and adding the estimated value of firewood used in the funerals. Clearly,the NAS bases its estimate on the presumption that agricultural wastes are includedand the firewood used for funerals are excluded from the NSS estimate, although itis not clear that such is the position on the basis of the instructions issued to thefield staff.
(xiv) The other items having large shares in the difference between the estimates of ”fueland light” are electricity, kerosene, and liquefied petroleum gas (LPG). For all theseitems, the NSS estimates of quantity consumed are substantially higher than the NASestimates. Differences between the estimates of values of consumption are morepronounced for the items ”electricity” and LPG, the implicit prices in the NSS estimatesbeing higher than the price at which the NAS estimates of quantity consumed areevaluated. The NAS estimates of quantity and value of private electricity consumptionare based on the data on electricity sold to domestic consumers and average electricityrates available from the Central Electricity Authority. For LPG and kerosene, the dataon quantity and retail prices are taken from Indian Petroleum and PetrochemicalsStatistics by the Ministry of Petroleum and Natural Gas. The prices used for evaluatingthe consumption in NAS are obtained from the official sources and thus represent theprices set by the regulatory authorities, rather than the prices actually paid by theconsumers. The prices implicit in the NSS estimates of quantity and value of electricity
25ERD WORKING PAPER SERIES NO. 51
SECTION VQUALITY OF DATA
and LPG, on the other hand, are expected to be closer estimates of average pricesactually paid by the customers, which vary not only between States but also from onearea to another.
3. Impact of the Discrepancy on Poverty Estimates
The whole debate on the discrepancy issue started when the Planning Commission, using theTask Force Methodology, estimated incidence of poverty from consumption expenditure distributionof NSS after scaling it up to the level of consumption expenditure of NAS. As long as the differencewas around 5 percent, it did not bother the academicians. But, with the change in base of theNAS series and over time, this discrepancy rose and caused alarm. Computing poverty from theexpenditure distribution of NSS after scaling it by a high proportion led to the criticism of themethodology of estimation of poverty.
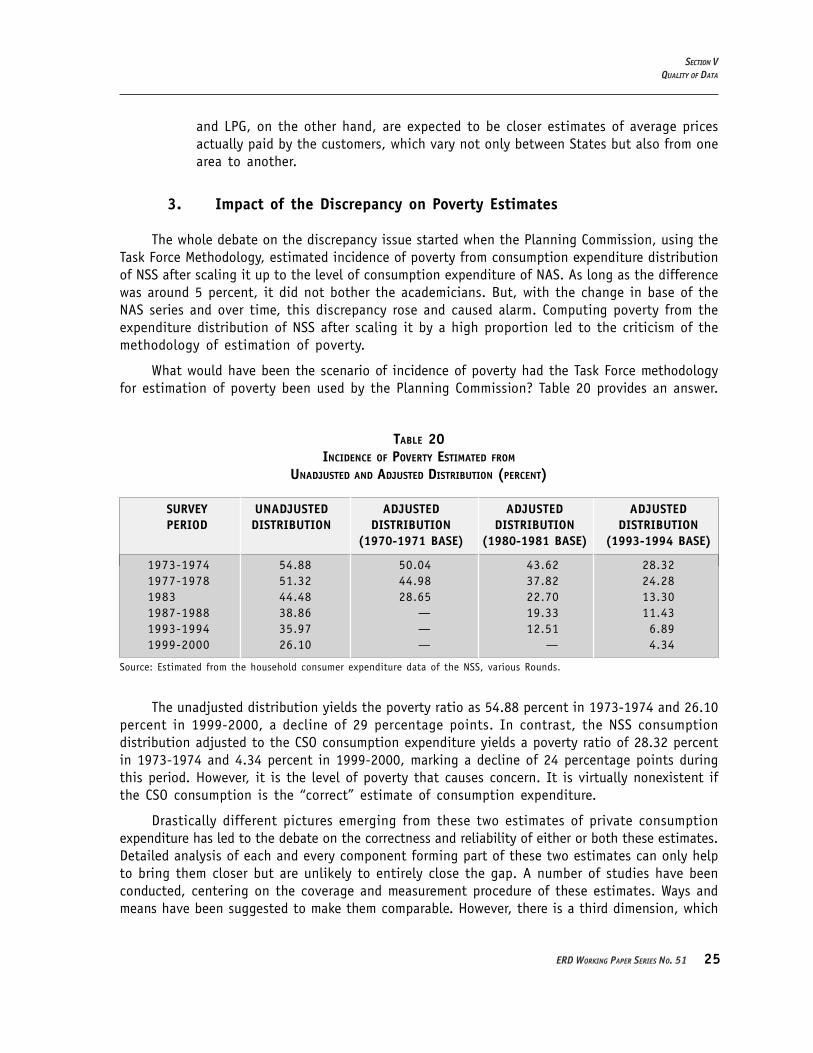
What would have been the scenario of incidence of poverty had the Task Force methodologyfor estimation of poverty been used by the Planning Commission? Table 20 provides an answer.
TABLE 20INCIDENCE OF POVERTY ESTIMATED FROM
UNADJUSTED AND ADJUSTED DISTRIBUTION (PERCENT)
SURVEY UNADJUSTED ADJUSTED ADJUSTED ADJUSTEDPERIOD DISTRIBUTION DISTRIBUTION DISTRIBUTION DISTRIBUTION
(1970-1971 BASE) (1980-1981 BASE) (1993-1994 BASE)
1973-1974 54.88 50.04 43.62 28.321977-1978 51.32 44.98 37.82 24.281983 44.48 28.65 22.70 13.301987-1988 38.86 — 19.33 11.431993-1994 35.97 — 12.51 6.891999-2000 26.10 — — 4.34
Source: Estimated from the household consumer expenditure data of the NSS, various Rounds.
The unadjusted distribution yields the poverty ratio as 54.88 percent in 1973-1974 and 26.10percent in 1999-2000, a decline of 29 percentage points. In contrast, the NSS consumptiondistribution adjusted to the CSO consumption expenditure yields a poverty ratio of 28.32 percentin 1973-1974 and 4.34 percent in 1999-2000, marking a decline of 24 percentage points duringthis period. However, it is the level of poverty that causes concern. It is virtually nonexistent ifthe CSO consumption is the “correct” estimate of consumption expenditure.
Drastically different pictures emerging from these two estimates of private consumptionexpenditure has led to the debate on the correctness and reliability of either or both these estimates.Detailed analysis of each and every component forming part of these two estimates can only helpto bring them closer but are unlikely to entirely close the gap. A number of studies have beenconducted, centering on the coverage and measurement procedure of these estimates. Ways andmeans have been suggested to make them comparable. However, there is a third dimension, which
26 MAY 2004
POVERTY ESTIMATES IN INDIA: SOME KEY ISSUES
SAVITA SHARMA
relates to the issue of prices. Use of different prices and price indices in evaluating quantitiesof commodities to obtain the value of consumption expenditure for these estimates is an areathat needs to be explored in some detail. Perhaps a major part of the problem lies here. If suchis the case, then thought will have to be given as to which of the consumption estimates shouldbe changed. The answer is not obvious, since the two measures of consumption are driven by differentconsiderations, and mindless adjustments can lead to violation of the very purpose of the measures.In such cases a possible alternative is that the poverty line itself can undergo a change.
VI. NONINCOME INDICATORS
A. Education
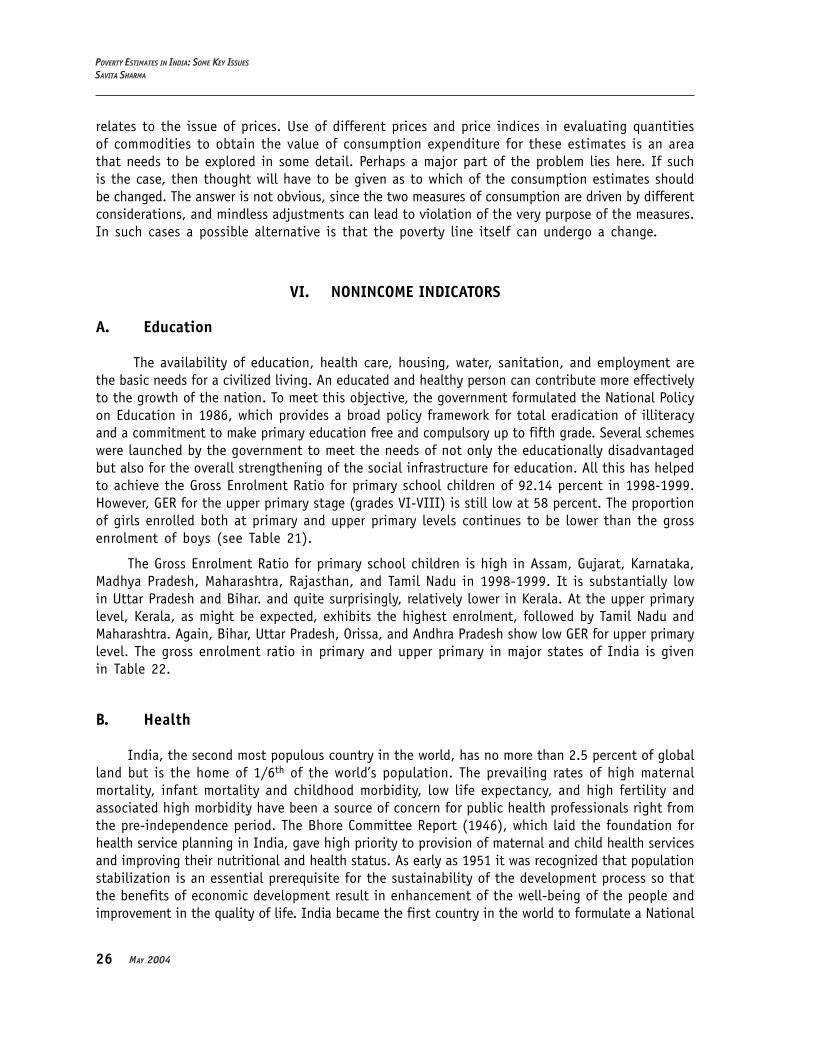
The availability of education, health care, housing, water, sanitation, and employment arethe basic needs for a civilized living. An educated and healthy person can contribute more effectivelyto the growth of the nation. To meet this objective, the government formulated the National Policyon Education in 1986, which provides a broad policy framework for total eradication of illiteracyand a commitment to make primary education free and compulsory up to fifth grade. Several schemeswere launched by the government to meet the needs of not only the educationally disadvantagedbut also for the overall strengthening of the social infrastructure for education. All this has helpedto achieve the Gross Enrolment Ratio for primary school children of 92.14 percent in 1998-1999.However, GER for the upper primary stage (grades VI-VIII) is still low at 58 percent. The proportionof girls enrolled both at primary and upper primary levels continues to be lower than the grossenrolment of boys (see Table 21).
The Gross Enrolment Ratio for primary school children is high in Assam, Gujarat, Karnataka,Madhya Pradesh, Maharashtra, Rajasthan, and Tamil Nadu in 1998-1999. It is substantially lowin Uttar Pradesh and Bihar. and quite surprisingly, relatively lower in Kerala. At the upper primarylevel, Kerala, as might be expected, exhibits the highest enrolment, followed by Tamil Nadu andMaharashtra. Again, Bihar, Uttar Pradesh, Orissa, and Andhra Pradesh show low GER for upper primarylevel. The gross enrolment ratio in primary and upper primary in major states of India is givenin Table 22.
B. Health
India, the second most populous country in the world, has no more than 2.5 percent of globalland but is the home of 1/6th of the world’s population. The prevailing rates of high maternalmortality, infant mortality and childhood morbidity, low life expectancy, and high fertility andassociated high morbidity have been a source of concern for public health professionals right fromthe pre-independence period. The Bhore Committee Report (1946), which laid the foundation forhealth service planning in India, gave high priority to provision of maternal and child health servicesand improving their nutritional and health status. As early as 1951 it was recognized that populationstabilization is an essential prerequisite for the sustainability of the development process so thatthe benefits of economic development result in enhancement of the well-being of the people andimprovement in the quality of life. India became the first country in the world to formulate a National
27ERD WORKING PAPER SERIES NO. 51
SECTION VINONINCOME INDICATORS
TABLE 22GROSS ENROLMENT RATIO IN CLASSES I-V AND VI-VIII FOR
MAJOR STATES*, 1998-1999 (PERCENT)
PRIMARY (I-V) UPPER PRIMARY (VI-VIII)
STATES/UTs BOYS GIRLS TOTAL BOYS GIRLS TOTAL
Andhra Pradesh 99.20 94.50 96.89 50.86 40.93 46.03Assam 118.78 100.16 109.63 69.41 52.42 61.12Bihar 93.20 61.51 78.02 42.43 23.13 33.55Gujarat 122.92 100.70 112.22 72.06 58.00 65.39Haryana 82.25 84.05 83.09 67.17 61.09 64.37Karnataka 111.35 104.38 107.90 70.94 61.06 66.08Kerala 88.69 87.00 87.86 97.15 93.24 95.22Madhya Pradesh 119.58 96.46 108.35 75.03 48.09 62.25Maharashtra 114.38 111.01 112.74 89.28 83.29 86.40Orissa 109.53 79.82 94.91 64.79 37.43 51.31Punjab 81.33 84.16 82.66 67.29 65.02 66.22Rajasthan 125.52 75.68 101.82 78.57 33.60 57.56Tamil Nadu 109.47 107.10 108.31 97.67 87.94 92.91Uttar Pradesh 75.97 49.31 63.35 48.88 26.41 38.57West Bengal 100.06 87.01 93.66 56.99 43.60 50.50All India 100.86 82.85 92.14 65.27 49.08 57.58
*Major States include states with population of 10 million and above as per 1991 Census.Source : Ministry of Human Resource Development.
TABLE 21GROSS ENROLMENT AS PERCENTAGE TO THE TOTAL POPULATION BY AGE AND SEX (PERCENT)
PRIMARY (AGE 6-11 YEARS) UPPER PRIMARY (AGE 11-14 YEARS)
YEAR MALE FEMALE TOTAL MALE FEMALE Total
1970-1971 92.6 59.1 76.4 46.5 20.8 34.21975-1976 95.7 62.0 79.3 47.0 23.8 35.61980-1981 95.8 64.1 80.5 54.3 28.6 41.91982-1983 103.0 69.7 86.8 58.3 31.8 45.51983-1984 106.9 72.6 90.2 60.6 33.2 47.31984-1985 110.3 76.0 93.6 61.3 34.1 48.11985-1986 111.1 79.2 95.6 61.8 35.3 49.01986-1987 111.8 79.2 96.0 66.5 39.0 53.11987-1988 113.1 81.6 97.9 68.9 40.6 55.11988-1989 115.7 82.5 99.6 70.8 42.3 57.01989-1990 109.7 81.3 95.9 72.0 42.2 57.41990-1991 113.9 85.5 100.1 76.6 47.0 62.11991-1992 112.8 86.9 100.2 75.1 49.6 62.81992-1993 118.1 92.7 105.7 80.5 53.8 67.51993-1994 115.3 92.9 104.5 79.3 55.2 67.71994-1995 114.8 92.6 104.0 79.0 55.0 67.21995-1996 114.5 93.3 104.3 79.5 55.0 67.61996-1997 98.7 81.9 90.6 70.9 52.8 62.41997-1998 97.5 81.2 89.7 66.5 49.5 58.51998-1999 100.9 82.8 92.1 65.3 49.1 57.6
Source: Ministry of Human Resource Development, Department of Education.

28 MAY 2004
POVERTY ESTIMATES IN INDIA: SOME KEY ISSUES
SAVITA SHARMA
Family Planning Programme in 1952, with the objective of reducing birth rate to the extent necessaryto stabilize the population at a level consistent with requirement of national economy. Thus, thekey elements of health care to women and children have been the focus of India’s health servicesright from the time of India’s independence.
The technological advances and improved quality and coverage of health care resulted in arapid fall in crude death rate (CDR) from 14.9 in 1971 to 9.0 in 1998 (Table 23). In contrast, thereduction in crude birth rate (CBR) has been less steep, declining from 36.9 in 1971 to 26.4 in1998. As a result, the annual exponential population growth rate has been over 2 percent duringthis period. The infant mortality rate, which is viewed as one of the important indicators of health,has improved from 129 in 1971 to 72 in 1998, but this is not yet a satisfactory level.
TABLE 23YEAR-WISE INFANT MORTALITY RATE
YEARS TOTAL RURAL URBAN YEARS TOTAL RURAL URBAN
1971 129 138 82 1985 97 107 591972 139 150 85 1986 96 105 621973 134 143 89 1987 95 104 611974 126 136 74 1988 94 102 621975 140 151 84 1989 91 98 581976 129 139 80 1990 80 86 501977 130 140 81 1991 80 87 531978 127 137 74 1992 79 85 531979 120 130 72 1993 74 82 451980 114 124 65 1994 74 80 521981 110 119 62 1995 74 80 481982 105 114 65 1996 72 77 461983 105 114 66 1997 71 77 451984 104 113 66 1998 72 77 45
Source: Office of the Registrar General, India (Sample Registration system).
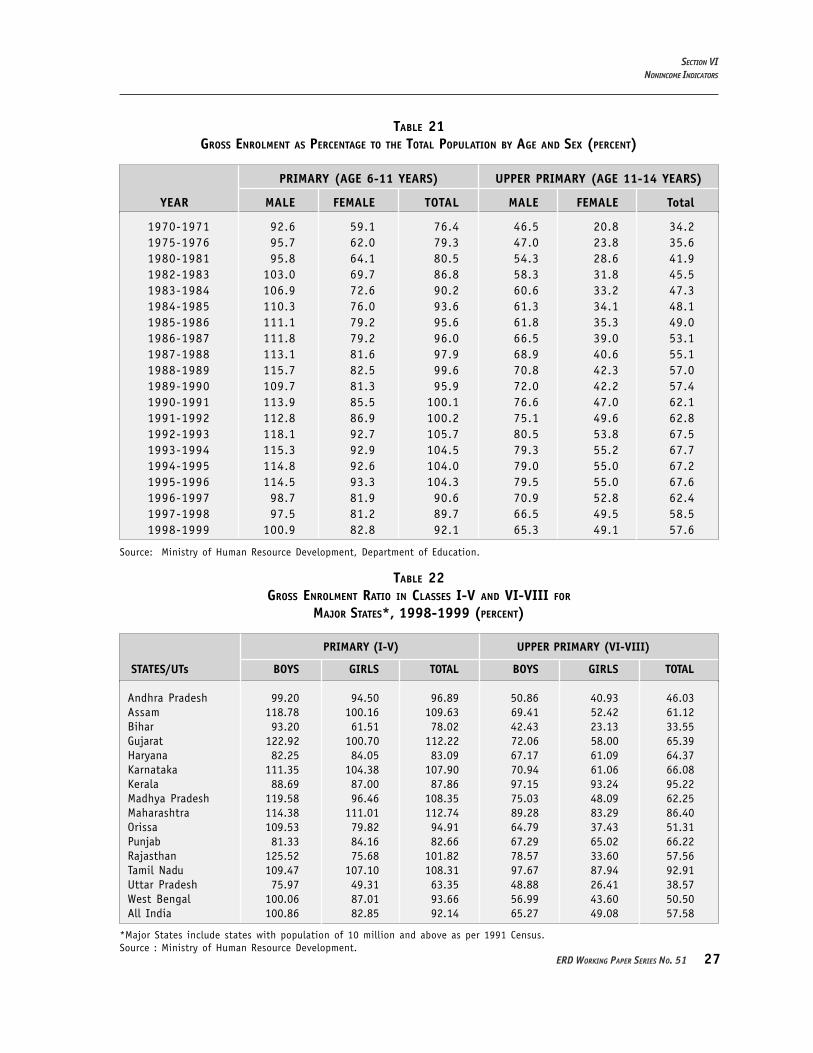
Low level of income indicators are accompanied by low level of health indicators. The infantmortality rate in Orissa is 98, Madhya Pradesh is 97, and Uttar Pradesh is 85 per thousand for1998. Incidentally the infant mortality rate in Bihar is 67, which is higher than the national averageof 72. In spite of the uniform national norms of family welfare, there are substantial differencesin fertility and mortality between states. At one end of the spectrum is Kerala with mortality andfertility rates nearly similar to those in some developed countries. At the other end, Uttar Pradesh,Bihar, Madhya Pradesh, Rajasthan, and Orissa have high infant mortality and fertility rates. State-wise infant mortality rates are given in Table 24.
29ERD WORKING PAPER SERIES NO. 51
TABLE 24STATE-WISE INFANT MORTALITY RATE, 1998 (PER THOUSAND POPULATION)
STATES/UTs TOTAL RURAL URBAN
Andhra Pradesh 66 75 38Arunachal Pradesh 44 46 10Assam 78 82 36Bihar 67 68 51Goa 23 25 22Gujarat 64 71 46Haryana 69 72 58Himachal Pradesh 64 66 39Jammu & Kashmir 45 46 44Karnataka 58 70 25Kerala 16 15 17Madhya Pradesh 97 103 56Maharashtra 49 58 32Manipur 25 22 26Meghalaya 52 54 36Mizoram 23 26 18Nagaland N.A N.A 16Orissa 98 101 66Punjab 54 58 40Rajasthan 83 87 60Sikkim 52 52 44Tamil Nadu 53 58 40Tripura 49 50 39Uttar Pradesh 85 89 65West Bengal 53 56 41A & N Island 30 37 09Chandigarh 32 44 30Dadra & Nagar Haveli 61 65 07Daman & Diu 51 43 59Delhi 36 36 36Lakshadweep 30 22 38Pondicherry 21 31 14All India 72 77 45
Source: Office of the Registrar General, India (Sample Registration system).
SECTION VINONINCOME INDICATORS
30 MAY 2004
POVERTY ESTIMATES IN INDIA: SOME KEY ISSUES
SAVITA SHARMA
VII. CONCLUDING REMARKS
Alleviation of poverty remains a major challenge before the nation. There may be disputesover the average level or the extent of reduction in the average level of poverty. But there is nodenying that poverty has come down over the last three decades. There has been a steady declinein the poverty ratio, i.e., the number of poor expressed as a percentage of the total population.But, this decline until 1993-1994 was not adequate enough to effect a reduction in the numberof poor due to increase in the population. The reduction has taken place between 1993-1994 and1999-2000 when the number of poor declined by 60 million. Also, the efforts of the governmenthave not made uniform impact across the regions. There are still some pockets in the country thatneed more attention and greater focus for the alleviation of poverty. The strategy needs to becomplimented with a focus on provision of basic services for improving the quality of life of thepeople.
Alongside the average level of poverty, some of the important socioeconomic indicators suchas literacy, education, and health have shown considerable improvement. As a result of the effortsintensified under the National Literacy Mission, the literacy rate has shown a much sharper increaseduring the 1990s compared to earlier decades. The health indicators have shown improvement,but India still lags behind many developing countries.
The progress in poverty reduction and improvement in the socioeconomic indicators in Indiahas been marked by extreme regional inequalities. The performance in this regard varies widelyacross the states and evidences suggest a variation of equal if not greater intensity between theregions within particular states. Also, within a state, the performance level of the indicators oflevel of living and quality of life measured in terms of the indicators of poverty and deprivationand socio-economic indicators varies. There are some states that have performed well in reducingthe incidence of poverty but not so well in improving the quality of life in terms of educationand health.
There is a north-south divide in the performance of poverty reduction. The four southernstates, viz., Andhra Pradesh, Karnataka, Kerala, and Tamil Nadu have performed well whereas theperformance is poor in some of the central (Uttar Pradesh, Madhya Pradesh) and eastern states(Bihar and Orissa). Unfortunately, in the current century more than 40 percent of the populationof India will be residing in Uttar Pradesh, Madhya Pradesh, Bihar, and Orissa. The performanceof these states both in respect to poverty alleviation and socioeconomic development needs tobe decisively strengthened.

31ERD WORKING PAPER SERIES NO. 51
SELECTED REFERENCES
Ahluwalia, M. S., 1978. Rural Poverty in India, 1956-57 to 1973-74. World Bank Staff Working Paper No. 279,Washington D.C.
Bardhan, P. K., 1973. “On the Incidence of Poverty in Rural India.” Economic and Political Weekly VIII(4-6,February).
Bardhan, P K., and T. N. Srinivasan, eds., 1974. Poverty and Income Distribution in India. Calcutta: StatisticalPublishing Society.
Bhalla, S. S., 2000. “Growth and Poverty in India: Myth and Reality.” Paper presented at the Conference inHonour of R.J. Chelliah, Banglore, January.
Bhattacharya, N., and G. S. Chatterjee, 1974. “Between State Variations in Consumer Prices and Per CapitaHousehold Consumption in Rural India.” In P. K. Bardhan and T. N. Srinivasan, eds., Poverty and IncomeDistribution in India. Calcutta: Statistical Publishing Society.
Bhatty, I. Z., 1974. “Inequality and Poverty in Rural India.” In P. K. Bardhan and T. N. Srinivasan, eds., Povertyand Income Distribution in India. Calcutta: Statistical Publishing Society.
Dandekar, V. M., and N. Rath, 1971, Poverty in India. Indian School of Political Economy, Pune, India.Datta, K. L., and S. Sharma, 2002. Facets of Indian Poverty. New Delhi: Concept Publishing Company.Government of India, 1979. Report of the Task Force on Projections of Minimum Needs and Effective Consumption
Demand. Perspective Planning Division, Planning Commission, New Delhi. , 1984. Report of the Second Quinquennial Survey on Consumer Expenditure, Thirty Second Round,
July 1977–June 1978. Report No. 311, National Sample Survey Organization, Department of Statistics,New Delhi. , 1985. Report of the Third Quinquennial Survey on Consumer Expenditure, Thirty Eighth Round, January–
December 1983. Report No. 319, National Sample Survey Organization, Department of Statistics, NewDelhi. , 1993. Report of the Expert Group on Estimation of Proportion and Number of Poor. Perspective Planning
Division, Planning Commission, New Delhi. , 1996. Level and Pattern of Consumer Expenditure in India, NSS 50th Round, 1993-1994. Report No.
402, National Sample Survey Organization, Ministry of Statistics and Programme Implementation, NewDelhi. , 1997. Estimate of Poverty. Press Information Bureau, New Delhi. , 2001a. Level and Pattern of Consumer Expenditure in India, NSS 55th Round, 1999-2000. Report
No. 457 (55/1.0/3), National Sample Survey Organization, Ministry of Statistics and ProgrammeImplementation, New Delhi. , 2001b. Poverty Estimates for 1999-2000. Press Information Bureau, New Delhi.
Gupta, S. P., and K. L. Datta, 1984. “Poverty Calculation in the Sixth Plan.” Economic and Political Weekly (April).Indian Council of Medical Research, 1981. “Recommended Dietary Allowances for Indians.” New Delhi.Minhas, B. S., 1988. “Validation of Large Scale Sample Survey Data—Case of NSS Estimates of Household
Consumption Expenditure.” In Sankhya Series B , Vol. 50. Indian Statistical Institute, Calcutta.Minhas, B. S., and and L. R. Jain, 1989. Incidence of Rural Poverty in Different States and All India 1970-
71 to 1983. Technical Report No. 8915, Indian Statistical Institute, New Delhi.Mukherjee, M., and G. S. Chaterjee, 1974. “On Validity of NSS estimates of Consumption Expenditure.” In P.
K. Bardhan and T. N. Srinivasan, eds., Poverty and Income Distribution in India. Calcutta: Statistical PublishingSociety.
REFERENCES
32 MAY 2004
POVERTY ESTIMATES IN INDIA: SOME KEY ISSUES
SAVITA SHARMA
Rudra, A., 1974. “Minimum Level of Living : A Statistical Examination in Poverty and Income Distribution.”In P. K. Bardhan and T. N. Srinivasan, eds., Poverty and Income Distribution in India. Calcutta: StatisticalPublishing Society.
Srinivasan, T. N., P. N. Radhakrishnan, and A. Vaidyanathan, 1974. “Data on Distribution of ConsumptionExpenditure in India: An Evaluation.” In P. K. Bardhan and T. N. Srinivasan, eds., Poverty and IncomeDistribution in India. Calcutta: Statistical Publishing Society.
33
PUBLICATIONS FROM THEECONOMICS AND RESEARCH DEPARTMENT
ERD WORKING PAPER SERIES (WPS)(Published in-house; Available through ADB Office of External Relations; Free of Charge)
No. 1 Capitalizing on Globalization—Barry Eichengreen, January 2002
No. 2 Policy-based Lending and Poverty Reduction:An Overview of Processes, Assessmentand Options—Richard Bolt and Manabu Fujimura
January 2002No. 3 The Automotive Supply Chain: Global Trends
and Asian Perspectives—Francisco Veloso and Rajiv Kumar
January 2002No. 4 International Competitiveness of Asian Firms:
An Analytical Framework—Rajiv Kumar and Doren Chadee
February 2002No. 5 The International Competitiveness of Asian
Economies in the Apparel Commodity Chain—Gary Gereffi
February 2002No. 6 Monetary and Financial Cooperation in East
Asia—The Chiang Mai Initiative and Beyond—Pradumna B. Rana
February 2002No. 7 Probing Beneath Cross-national Averages: Poverty,
Inequality, and Growth in the Philippines—Arsenio M. Balisacan and Ernesto M. Pernia
March 2002No. 8 Poverty, Growth, and Inequality in Thailand
—Anil B. DeolalikarApril 2002
No. 9 Microfinance in Northeast Thailand: Who Benefitsand How Much?—Brett E. Coleman
April 2002No. 10 Poverty Reduction and the Role of Institutions in
Developing Asia—Anil B. Deolalikar, Alex B. Brilliantes, Jr.,
Raghav Gaiha, Ernesto M. Pernia, Mary Raceliswith the assistance of Marita Concepcion Castro-Guevara, Liza L. Lim, Pilipinas F. QuisingMay 2002
No. 11 The European Social Model: Lessons forDeveloping Countries—Assar Lindbeck
May 2002No. 12 Costs and Benefits of a Common Currency for
ASEAN—Srinivasa Madhur
May 2002No. 13 Monetary Cooperation in East Asia: A Survey
—Raul FabellaMay 2002
No. 14 Toward A Political Economy Approachto Policy-based Lending—George Abonyi
May 2002No. 15 A Framework for Establishing Priorities in a
Country Poverty Reduction Strategy—Ron Duncan and Steve Pollard
June 2002
No. 16 The Role of Infrastructure in Land-use Dynamicsand Rice Production in Viet Nam’s Mekong RiverDelta—Christopher Edmonds
July 2002No. 17 Effect of Decentralization Strategy on
Macroeconomic Stability in Thailand—Kanokpan Lao-Araya
August 2002No. 18 Poverty and Patterns of Growth
—Rana Hasan and M. G. QuibriaAugust 2002
No. 19 Why are Some Countries Richer than Others?A Reassessment of Mankiw-Romer-Weil’s Test ofthe Neoclassical Growth Model—Jesus Felipe and John McCombie
August 2002No. 20 Modernization and Son Preference in People’s
Republic of China—Robin Burgess and Juzhong Zhuang
September 2002No. 21 The Doha Agenda and Development: A View from
the Uruguay Round—J. Michael Finger
September 2002No. 22 Conceptual Issues in the Role of Education
Decentralization in Promoting Effective Schooling inAsian Developing Countries—Jere R. Behrman, Anil B. Deolalikar, and Lee-
Ying SonSeptember 2002
No. 23 Promoting Effective Schooling through EducationDecentralization in Bangladesh, Indonesia, andPhilippines—Jere R. Behrman, Anil B. Deolalikar, and Lee- Ying Son
September 2002No. 24 Financial Opening under the WTO Agreement in
Selected Asian Countries: Progress and Issues—Yun-Hwan Kim
September 2002No. 25 Revisiting Growth and Poverty Reduction in
Indonesia: What Do Subnational Data Show?—Arsenio M. Balisacan, Ernesto M. Pernia, and Abuzar Asra October 2002
No. 26 Causes of the 1997 Asian Financial Crisis: WhatCan an Early Warning System Model Tell Us?—Juzhong Zhuang and J. Malcolm Dowling October 2002
No. 27 Digital Divide: Determinants and Policies withSpecial Reference to Asia—M. G. Quibria, Shamsun N. Ahmed, TedTschang, and Mari-Len Reyes-Macasaquit October 2002
No. 28 Regional Cooperation in Asia: Long-term Progress,Recent Retrogression, and the Way Forward—Ramgopal Agarwala and Brahm Prakash
October 2002
34
ERD TECHNICAL NOTE SERIES (TNS)(Published in-house; Available through ADB Office of External Relations; Free of Charge)
No. 1 Contingency Calculations for EnvironmentalImpacts with Unknown Monetary Values—David Dole February 2002
No. 2 Integrating Risk into ADB’s Economic Analysisof Projects—Nigel Rayner, Anneli Lagman-Martin,
and Keith Ward June 2002
No. 3 Measuring Willingness to Pay for Electricity—Peter Choynowski July 2002
No. 29 How can Cambodia, Lao PDR, Myanmar, and VietNam Cope with Revenue Lost Due to AFTA TariffReductions?—Kanokpan Lao-Araya
November 2002No. 30 Asian Regionalism and Its Effects on Trade in the
1980s and 1990s—Ramon Clarete, Christopher Edmonds, andJessica Seddon Wallack
November 2002No. 31 New Economy and the Effects of Industrial
Structures on International Equity MarketCorrelations—Cyn-Young Park and Jaejoon Woo
December 2002No. 32 Leading Indicators of Business Cycles in Malaysia
and the Philippines—Wenda Zhang and Juzhong Zhuang
December 2002No. 33 Technological Spillovers from Foreign Direct
Investment—A Survey—Emma Xiaoqin Fan
December 2002No. 34 Economic Openness and Regional Development in
the Philippines—Ernesto M. Pernia and Pilipinas F. Quising
January 2003No. 35 Bond Market Development in East Asia:
Issues and Challenges—Raul Fabella and Srinivasa Madhur
January 2003No. 36 Environment Statistics in Central Asia: Progress
and Prospects—Robert Ballance and Bishnu D. Pant
March 2003No. 37 Electricity Demand in the People’s Republic of
China: Investment Requirement andEnvironmental Impact—Bo Q. Lin
March 2003No. 38 Foreign Direct Investment in Developing Asia:
Trends, Effects, and Likely Issues for theForthcoming TWO Negotiations—Douglas H. Brooks, Emma Xiaoqin Fan,and Lea R. Sumulong
April 2003No. 39 The Political Economy of Good Governance for
Poverty Alleviation Policies—Narayan Lakshman
April 2003No. 40 The Puzzle of Social Capital
A Critical Review
—M. G. QuibriaMay 2003
No. 41 Industrial Structure, Technical Change, and theRole of Government in Development of theElectronics and Information Industry inTaipei,China—Yeo Lin
May 2003No. 42 Economic Growth and Poverty Reduction
in Viet Nam—Arsenio M. Balisacan, Ernesto M. Pernia, andGemma Esther B. Estrada
June 2003No. 43 Why Has Income Inequality in Thailand
Increased? An Analysis Using 1975-1998 Surveys—Taizo Motonishi
June 2003No. 44 Welfare Impacts of Electricity Generation Sector
Reform in the Philippines—Natsuko Toba
June 2003No. 45 A Review of Commitment Savings Products in
Developing Countries—Nava Ashraf, Nathalie Gons, Dean S. Karlan,and Wesley Yin
July 2003No. 46 Local Government Finance, Private Resources,
and Local Credit Markets in Asia—Roberto de Vera and Yun-Hwan Kim
October 2003July 2003
No. 47 Excess Investment and Efficiency Loss DuringReforms: The Case of Provincial-level Fixed-AssetInvestment in People’s Republic of China—Duo Qin and Haiyan Song
October 2003No. 48 Is Export-led Growth Passe? Implications for
Developing Asia—Jesus Felipe
December 2003No. 49 Changing Bank Lending Behavior and Corporate
Financing in Asia—Some Research Issues—Emma Xiaoqin Fan and Akiko Terada-Hagiwara
December 2003No. 50 Is People’s Republic of China’s Rising Services
Sector Leading to Cost Disease?—Duo Qin
March 2004No. 51 Poverty Estimates in India: Some Key Issues
—Savita SharmaMay 2004
No. 4 Economic Issues in the Design and Analysis of aWastewater Treatment Project—David Dole
July 2002No. 5 An Analysis and Case Study of the Role of
Environmental Economics at the AsianDevelopment Bank—David Dole and Piya Abeygunawardena
September 2002
35
No. 6 Economic Analysis of Health Projects: A Case Studyin Cambodia—Erik Bloom and Peter Choynowski
May 2003No. 7 Strengthening the Economic Analysis of Natural
Resource Management Projects—Keith Ward
September 2003No. 8 Testing Savings Product Innovations Using an
Experimental Methodology—Nava Ashraf, Dean S. Karlan, and Wesley Yin
November 2003
ERD POLICY BRIEF SERIES (PBS)(Published in-house; Available through ADB Office of External Relations; Free of charge)
No. 1 Is Growth Good Enough for the Poor?—Ernesto M. Pernia, October 2001
No. 2 India’s Economic ReformsWhat Has Been Accomplished?What Remains to Be Done?—Arvind Panagariya, November 2001
No. 3 Unequal Benefits of Growth in Viet Nam—Indu Bhushan, Erik Bloom, and Nguyen MinhThang, January 2002
No. 4 Is Volatility Built into Today’s World Economy?—J. Malcolm Dowling and J.P. Verbiest,February 2002
No. 5 What Else Besides Growth Matters to PovertyReduction? Philippines—Arsenio M. Balisacan and Ernesto M. Pernia,February 2002
No. 6 Achieving the Twin Objectives of Efficiency andEquity: Contracting Health Services in Cambodia—Indu Bhushan, Sheryl Keller, and Brad Schwartz,March 2002
No. 7 Causes of the 1997 Asian Financial Crisis: WhatCan an Early Warning System Model Tell Us?—Juzhong Zhuang and Malcolm Dowling,June 2002
No. 8 The Role of Preferential Trading Arrangementsin Asia—Christopher Edmonds and Jean-Pierre Verbiest,July 2002
No. 9 The Doha Round: A Development Perspective—Jean-Pierre Verbiest, Jeffrey Liang, and LeaSumulong
July 2002No. 10 Is Economic Openness Good for Regional
Development and Poverty Reduction? ThePhilippines—E. M. Pernia and P. F. Quising
October 2002No. 11 Implications of a US Dollar Depreciation for Asian
Developing Countries—Emma Fan
July 2002No. 12 Dangers of Deflation
—D. Brooks and P. F. QuisingDecember 2002
No. 13 Infrastructure and Poverty Reduction—What is the Connection?—I. Ali and E. Pernia
January 2003
No. 14 Infrastructure and Poverty Reduction—Making Markets Work for the Poor—Xianbin Yao
May 2003No. 15 SARS: Economic Impacts and Implications
—Emma Xiaoqin FanMay 2003
No. 16 Emerging Tax Issues: Implications of Globalizationand Technology—Kanokpan Lao Araya
May 2003No. 17 Pro-Poor Growth: What is It and Why is It
Important?—Ernesto M. Pernia
May 2003No. 18 Public–Private Partnership for Competitiveness
—Jesus FelipeJune 2003
No. 19 Reviving Asian Economic Growth Requires FurtherReforms—Ifzal Ali
June 2003No. 20 The Millennium Development Goals and Poverty:
Are We Counting the World’s Poor Right?—M. G. Quibria
July 2003No. 21 Trade and Poverty: What are the Connections?
—Douglas H. BrooksJuly 2003
No. 22 Adapting Education to the Global Economy—Olivier Dupriez September 2003
No. 23 Avian Flu: An Economic Assessment for SelectedDeveloping Countries in Asia—Jean-Pierre Verbiest and Charissa Castillo March 2004
No. 25 Purchasing Power Parities and the InternationalComparison Program in a Globalized World—Bishnu Pant March 2004
No. 26 A Note on Dual/Multiple Exchange Rates—Emma Xiaoqin Fan May 2004
No. 27 Inclusive Growth for Sustainable Poverty Reductionin Developing Asia: The Enabling Role ofInfrastructure Development—Ifzal Ali and Xianbin Yao May 2004
No. 9 Setting User Charges for Public Services: Policiesand Practice at the Asian Development Bank—David Dole
December 2003No. 10 Beyond Cost Recovery: Setting User Charges for
Financial, Economic, and Social Goals—David Dole and Ian Bartlett
January 2004No. 11 Shadow Exchange Rates for Project Economic
Analysis: Toward Improving Practice at the AsianDevelopment Bank—Anneli Lagman-Martin
February 2004
36
MONOGRAPH SERIES(Published in-house; Available through ADB Office of External Relations; Free of charge)
EDRC REPORT SERIES (ER)
No. 1 ASEAN and the Asian Development Bank—Seiji Naya, April 1982
No. 2 Development Issues for the Developing Eastand Southeast Asian Countriesand International Cooperation—Seiji Naya and Graham Abbott, April 1982
No. 3 Aid, Savings, and Growth in the Asian Region—J. Malcolm Dowling and Ulrich Hiemenz,
April 1982No. 4 Development-oriented Foreign Investment
and the Role of ADB—Kiyoshi Kojima, April 1982
No. 5 The Multilateral Development Banksand the International Economy’s MissingPublic Sector—John Lewis, June 1982
No. 6 Notes on External Debt of DMCs—Evelyn Go, July 1982
No. 7 Grant Element in Bank Loans—Dal Hyun Kim, July 1982
No. 8 Shadow Exchange Rates and StandardConversion Factors in Project Evaluation—Peter Warr, September 1982
No. 9 Small and Medium-Scale ManufacturingEstablishments in ASEAN Countries:Perspectives and Policy Issues—Mathias Bruch and Ulrich Hiemenz,
January 1983No. 10 A Note on the Third Ministerial Meeting of GATT
—Jungsoo Lee, January 1983No. 11 Macroeconomic Forecasts for the Republic
of China, Hong Kong, and Republic of Korea—J.M. Dowling, January 1983
No. 12 ASEAN: Economic Situation and Prospects—Seiji Naya, March 1983
No. 13 The Future Prospects for the DevelopingCountries of Asia—Seiji Naya, March 1983
No. 14 Energy and Structural Change in the Asia-Pacific Region, Summary of the ThirteenthPacific Trade and Development Conference—Seiji Naya, March 1983
No. 15 A Survey of Empirical Studies on Demandfor Electricity with Special Emphasis on PriceElasticity of Demand—Wisarn Pupphavesa, June 1983
No. 16 Determinants of Paddy Production in Indonesia:1972-1981–A Simultaneous Equation ModelApproach—T.K. Jayaraman, June 1983
No. 17 The Philippine Economy: EconomicForecasts for 1983 and 1984—J.M. Dowling, E. Go, and C.N. Castillo,
June 1983No. 18 Economic Forecast for Indonesia
—J.M. Dowling, H.Y. Kim, Y.K. Wang,and C.N. Castillo, June 1983
No. 19 Relative External Debt Situation of AsianDeveloping Countries: An Applicationof Ranking Method—Jungsoo Lee, June 1983
No. 20 New Evidence on Yields, Fertilizer Application,and Prices in Asian Rice Production—William James and Teresita Ramirez, July 1983
No. 21 Inflationary Effects of Exchange RateChanges in Nine Asian LDCs—Pradumna B. Rana and J. Malcolm Dowling, Jr., December 1983
No. 22 Effects of External Shocks on the Balanceof Payments, Policy Responses, and DebtProblems of Asian Developing Countries—Seiji Naya, December 1983
No. 23 Changing Trade Patterns and Policy Issues:The Prospects for East and Southeast AsianDeveloping Countries—Seiji Naya and Ulrich Hiemenz, February 1984
SERIALS(Co-published with Oxford University Press; Available commercially through Oxford University PressOffices, Associated Companies, and Agents)
1. Asian Development Outlook (ADO; annual)$36.00 (paperback)
2. Key Indicators of Developing Asian and Pacific Countries (KI; annual)$35.00 (paperback)
JOURNAL(Published in-house; Available commercially through ADB Office of External Relations)
1. Asian Development Review (ADR; semiannual)$5.00 per issue; $8.00 per year (2 issues)
37
No. 24 Small-Scale Industries in Asian EconomicDevelopment: Problems and Prospects—Seiji Naya, February 1984
No. 25 A Study on the External Debt IndicatorsApplying Logit Analysis—Jungsoo Lee and Clarita Barretto, February 1984
No. 26 Alternatives to Institutional Credit Programsin the Agricultural Sector of Low-IncomeCountries—Jennifer Sour, March 1984
No. 27 Economic Scene in Asia and Its Special Features—Kedar N. Kohli, November 1984
No. 28 The Effect of Terms of Trade Changes on theBalance of Payments and Real NationalIncome of Asian Developing Countries—Jungsoo Lee and Lutgarda Labios, January1985
No. 29 Cause and Effect in the World Sugar Market:Some Empirical Findings 1951-1982—Yoshihiro Iwasaki, February 1985
No. 30 Sources of Balance of Payments Problemin the 1970s: The Asian Experience—Pradumna Rana, February 1985
No. 31 India’s Manufactured Exports: An Analysisof Supply Sectors—Ifzal Ali, February 1985
No. 32 Meeting Basic Human Needs in AsianDeveloping Countries—Jungsoo Lee and Emma Banaria, March 1985
No. 33 The Impact of Foreign Capital Inflowon Investment and Economic Growthin Developing Asia—Evelyn Go, May 1985
No. 34 The Climate for Energy Developmentin the Pacific and Asian Region:Priorities and Perspectives—V.V. Desai, April 1986
No. 35 Impact of Appreciation of the Yen onDeveloping Member Countries of the Bank—Jungsoo Lee, Pradumna Rana, and Ifzal Ali,
May 1986No. 36 Smuggling and Domestic Economic Policies
in Developing Countries—A.H.M.N. Chowdhury, October 1986
No. 37 Public Investment Criteria: Economic InternalRate of Return and Equalizing Discount Rate—Ifzal Ali, November 1986
No. 38 Review of the Theory of Neoclassical PoliticalEconomy: An Application to Trade Policies—M.G. Quibria, December 1986
No. 39 Factors Influencing the Choice of Location:Local and Foreign Firms in the Philippines—E.M. Pernia and A.N. Herrin, February 1987
No. 40 A Demographic Perspective on DevelopingAsia and Its Relevance to the Bank—E.M. Pernia, May 1987
No. 41 Emerging Issues in Asia and Social CostBenefit Analysis—I. Ali, September 1988
No. 42 Shifting Revealed Comparative Advantage:Experiences of Asian and Pacific DevelopingCountries—P.B. Rana, November 1988
No. 43 Agricultural Price Policy in Asia:Issues and Areas of Reforms—I. Ali, November 1988
No. 44 Service Trade and Asian Developing Economies—M.G. Quibria, October 1989
No. 45 A Review of the Economic Analysis of PowerProjects in Asia and Identification of Areasof Improvement—I. Ali, November 1989
No. 46 Growth Perspective and Challenges for Asia:
Areas for Policy Review and Research—I. Ali, November 1989
No. 47 An Approach to Estimating the PovertyAlleviation Impact of an Agricultural Project—I. Ali, January 1990
No. 48 Economic Growth Performance of Indonesia,the Philippines, and Thailand:The Human Resource Dimension—E.M. Pernia, January 1990
No. 49 Foreign Exchange and Fiscal Impact of a Project:A Methodological Framework for Estimation—I. Ali, February 1990
No. 50 Public Investment Criteria: Financialand Economic Internal Rates of Return—I. Ali, April 1990
No. 51 Evaluation of Water Supply Projects:An Economic Framework—Arlene M. Tadle, June 1990
No. 52 Interrelationship Between Shadow Prices, ProjectInvestment, and Policy Reforms:An Analytical Framework—I. Ali, November 1990
No. 53 Issues in Assessing the Impact of Projectand Sector Adjustment Lending—I. Ali, December 1990
No. 54 Some Aspects of Urbanizationand the Environment in Southeast Asia—Ernesto M. Pernia, January 1991
No. 55 Financial Sector and EconomicDevelopment: A Survey—Jungsoo Lee, September 1991
No. 56 A Framework for Justifying Bank-AssistedEducation Projects in Asia: A Reviewof the Socioeconomic Analysisand Identification of Areas of Improvement—Etienne Van De Walle, February 1992
No. 57 Medium-term Growth-StabilizationRelationship in Asian Developing Countriesand Some Policy Considerations—Yun-Hwan Kim, February 1993
No. 58 Urbanization, Population Distribution,and Economic Development in Asia—Ernesto M. Pernia, February 1993
No. 59 The Need for Fiscal Consolidation in Nepal:The Results of a Simulation—Filippo di Mauro and Ronald Antonio Butiong,
July 1993No. 60 A Computable General Equilibrium Model
of Nepal—Timothy Buehrer and Filippo di Mauro,
October 1993No. 61 The Role of Government in Export Expansion
in the Republic of Korea: A Revisit—Yun-Hwan Kim, February 1994
No. 62 Rural Reforms, Structural Change,and Agricultural Growth inthe People’s Republic of China—Bo Lin, August 1994
No. 63 Incentives and Regulation for Pollution Abatementwith an Application to Waste Water Treatment—Sudipto Mundle, U. Shankar,and Shekhar Mehta, October 1995
No. 64 Saving Transitions in Southeast Asia—Frank Harrigan, February 1996
No. 65 Total Factor Productivity Growth in East Asia:A Critical Survey—Jesus Felipe, September 1997
No. 66 Foreign Direct Investment in Pakistan:Policy Issues and Operational Implications—Ashfaque H. Khan and Yun-Hwan Kim,
July 1999No. 67 Fiscal Policy, Income Distribution and Growth
—Sailesh K. Jha, November 1999
38
No. 1 International Reserves:Factors Determining Needs and Adequacy—Evelyn Go, May 1981
No. 2 Domestic Savings in Selected DevelopingAsian Countries—Basil Moore, assisted by
A.H.M. Nuruddin Chowdhury, September 1981No. 3 Changes in Consumption, Imports and Exports
of Oil Since 1973: A Preliminary Survey ofthe Developing Member Countriesof the Asian Development Bank—Dal Hyun Kim and Graham Abbott,
September 1981No. 4 By-Passed Areas, Regional Inequalities,
and Development Policies in SelectedSoutheast Asian Countries—William James, October 1981
No. 5 Asian Agriculture and Economic Development—William James, March 1982
No. 6 Inflation in Developing Member Countries:An Analysis of Recent Trends—A.H.M. Nuruddin Chowdhury and
J. Malcolm Dowling, March 1982No. 7 Industrial Growth and Employment in
Developing Asian Countries: Issues andPerspectives for the Coming Decade—Ulrich Hiemenz, March 1982
No. 8 Petrodollar Recycling 1973-1980.Part 1: Regional Adjustments andthe World Economy—Burnham Campbell, April 1982
No. 9 Developing Asia: The Importanceof Domestic Policies—Economics Office Staff under the direction
of Seiji Naya, May 1982No. 10 Financial Development and Household
Savings: Issues in Domestic ResourceMobilization in Asian Developing Countries—Wan-Soon Kim, July 1982
No. 11 Industrial Development: Role of SpecializedFinancial Institutions—Kedar N. Kohli, August 1982
No. 12 Petrodollar Recycling 1973-1980.Part II: Debt Problems and an Evaluationof Suggested Remedies—Burnham Campbell, September 1982
No. 13 Credit Rationing, Rural Savings, and FinancialPolicy in Developing Countries—William James, September 1982
No. 14 Small and Medium-Scale ManufacturingEstablishments in ASEAN Countries:Perspectives and Policy Issues—Mathias Bruch and Ulrich Hiemenz, March 1983
No. 15 Income Distribution and EconomicGrowth in Developing Asian Countries—J. Malcolm Dowling and David Soo, March 1983
No. 16 Long-Run Debt-Servicing Capacity ofAsian Developing Countries: An Applicationof Critical Interest Rate Approach—Jungsoo Lee, June 1983
No. 17 External Shocks, Energy Policy,and Macroeconomic Performance of AsianDeveloping Countries: A Policy Analysis—William James, July 1983
No. 18 The Impact of the Current Exchange RateSystem on Trade and Inflation of SelectedDeveloping Member Countries—Pradumna Rana, September 1983
No. 19 Asian Agriculture in Transition: Key Policy Issues—William James, September 1983
No. 20 The Transition to an Industrial Economy
ECONOMIC STAFF PAPERS (ES)
in Monsoon Asia—Harry T. Oshima, October 1983
No. 21 The Significance of Off-Farm Employmentand Incomes in Post-War East Asian Growth—Harry T. Oshima, January 1984
No. 22 Income Distribution and Poverty in SelectedAsian Countries—John Malcolm Dowling, Jr., November 1984
No. 23 ASEAN Economies and ASEAN EconomicCooperation—Narongchai Akrasanee, November 1984
No. 24 Economic Analysis of Power Projects—Nitin Desai, January 1985
No. 25 Exports and Economic Growth in the Asian Region—Pradumna Rana, February 1985
No. 26 Patterns of External Financing of DMCs—E. Go, May 1985
No. 27 Industrial Technology Developmentthe Republic of Korea—S.Y. Lo, July 1985
No. 28 Risk Analysis and Project Selection:A Review of Practical Issues—J.K. Johnson, August 1985
No. 29 Rice in Indonesia: Price Policy and ComparativeAdvantage—I. Ali, January 1986
No. 30 Effects of Foreign Capital Inflowson Developing Countries of Asia—Jungsoo Lee, Pradumna B. Rana,
and Yoshihiro Iwasaki, April 1986No. 31 Economic Analysis of the Environmental
Impacts of Development Projects—John A. Dixon et al., EAPI,
East-West Center, August 1986No. 32 Science and Technology for Development:
Role of the Bank—Kedar N. Kohli and Ifzal Ali, November 1986
No. 33 Satellite Remote Sensing in the Asianand Pacific Region—Mohan Sundara Rajan, December 1986
No. 34 Changes in the Export Patterns of Asian andPacific Developing Countries: An EmpiricalOverview—Pradumna B. Rana, January 1987
No. 35 Agricultural Price Policy in Nepal—Gerald C. Nelson, March 1987
No. 36 Implications of Falling Primary CommodityPrices for Agricultural Strategy in the Philippines—Ifzal Ali, September 1987
No. 37 Determining Irrigation Charges: A Framework—Prabhakar B. Ghate, October 1987
No. 38 The Role of Fertilizer Subsidies in AgriculturalProduction: A Review of Select Issues—M.G. Quibria, October 1987
No. 39 Domestic Adjustment to External Shocksin Developing Asia—Jungsoo Lee, October 1987
No. 40 Improving Domestic Resource Mobilizationthrough Financial Development: Indonesia—Philip Erquiaga, November 1987
No. 41 Recent Trends and Issues on Foreign DirectInvestment in Asian and Pacific DevelopingCountries—P.B. Rana, March 1988
No. 42 Manufactured Exports from the Philippines:A Sector Profile and an Agenda for Reform—I. Ali, September 1988
No. 43 A Framework for Evaluating the EconomicBenefits of Power Projects—I. Ali, August 1989
No. 44 Promotion of Manufactured Exports in Pakistan
39
No. 1 Poverty in the People’s Republic of China:Recent Developments and Scopefor Bank Assistance—K.H. Moinuddin, November 1992
No. 2 The Eastern Islands of Indonesia: An Overviewof Development Needs and Potential—Brien K. Parkinson, January 1993
No. 3 Rural Institutional Finance in Bangladeshand Nepal: Review and Agenda for Reforms—A.H.M.N. Chowdhury and Marcelia C. Garcia,
November 1993No. 4 Fiscal Deficits and Current Account Imbalances
of the South Pacific Countries:A Case Study of Vanuatu—T.K. Jayaraman, December 1993
No. 5 Reforms in the Transitional Economies of Asia—Pradumna B. Rana, December 1993
No. 6 Environmental Challenges in the People’s Republicof China and Scope for Bank Assistance—Elisabetta Capannelli and Omkar L. Shrestha,
December 1993No. 7 Sustainable Development Environment
and Poverty Nexus—K.F. Jalal, December 1993
No. 8 Intermediate Services and EconomicDevelopment: The Malaysian Example—Sutanu Behuria and Rahul Khullar, May 1994
No. 9 Interest Rate Deregulation: A Brief Surveyof the Policy Issues and the Asian Experience—Carlos J. Glower, July 1994
No. 10 Some Aspects of Land Administrationin Indonesia: Implications for Bank Operations—Sutanu Behuria, July 1994
No. 11 Demographic and Socioeconomic Determinantsof Contraceptive Use among Urban Women inthe Melanesian Countries in the South Pacific:A Case Study of Port Vila Town in Vanuatu—T.K. Jayaraman, February 1995
No. 12 Managing Development throughInstitution Building— Hilton L. Root, October 1995
No. 13 Growth, Structural Change, and OptimalPoverty Interventions—Shiladitya Chatterjee, November 1995
No. 14 Private Investment and MacroeconomicEnvironment in the South Pacific IslandCountries: A Cross-Country Analysis—T.K. Jayaraman, October 1996
No. 15 The Rural-Urban Transition in Viet Nam:Some Selected Issues—Sudipto Mundle and Brian Van Arkadie,
October 1997No. 16 A New Approach to Setting the Future
Transport Agenda—Roger Allport, Geoff Key, and Charles Melhuish
June 1998No. 17 Adjustment and Distribution:
The Indian Experience—Sudipto Mundle and V.B. Tulasidhar, June 1998
No. 18 Tax Reforms in Viet Nam: A Selective Analysis—Sudipto Mundle, December 1998
No. 19 Surges and Volatility of Private Capital Flows toAsian Developing Countries: Implicationsfor Multilateral Development Banks—Pradumna B. Rana, December 1998
No. 20 The Millennium Round and the Asian Economies:An Introduction—Dilip K. Das, October 1999
No. 21 Occupational Segregation and the GenderEarnings Gap—Joseph E. Zveglich, Jr. and Yana van der MeulenRodgers, December 1999
No. 22 Information Technology: Next Locomotive ofGrowth?—Dilip K. Das, June 2000
OCCASIONAL PAPERS (OP)
—Jungsoo Lee and Yoshihiro Iwasaki,September 1989
No. 45 Education and Labor Markets in Indonesia:A Sector Survey—Ernesto M. Pernia and David N. Wilson,
September 1989No. 46 Industrial Technology Capabilities
and Policies in Selected ADCs—Hiroshi Kakazu, June 1990
No. 47 Designing Strategies and Policiesfor Managing Structural Change in Asia—Ifzal Ali, June 1990
No. 48 The Completion of the Single European CommunityMarket in 1992: A Tentative Assessment of itsImpact on Asian Developing Countries—J.P. Verbiest and Min Tang, June 1991
No. 49 Economic Analysis of Investment in Power Systems—Ifzal Ali, June 1991
No. 50 External Finance and the Role of MultilateralFinancial Institutions in South Asia:Changing Patterns, Prospects, and Challenges—Jungsoo Lee, November 1991
No. 51 The Gender and Poverty Nexus: Issues andPolicies—M.G. Quibria, November 1993
No. 52 The Role of the State in Economic Development:Theory, the East Asian Experience,and the Malaysian Case—Jason Brown, December 1993
No. 53 The Economic Benefits of Potable Water SupplyProjects to Households in Developing Countries—Dale Whittington and Venkateswarlu Swarna,
January 1994No. 54 Growth Triangles: Conceptual Issues
and Operational Problems—Min Tang and Myo Thant, February 1994
No. 55 The Emerging Global Trading Environmentand Developing Asia—Arvind Panagariya, M.G. Quibria,
and Narhari Rao, July 1996No. 56 Aspects of Urban Water and Sanitation in
the Context of Rapid Urbanization inDeveloping Asia—Ernesto M. Pernia and Stella LF. Alabastro,
September 1997No. 57 Challenges for Asia’s Trade and Environment
—Douglas H. Brooks, January 1998No. 58 Economic Analysis of Health Sector Projects-
A Review of Issues, Methods, and Approaches—Ramesh Adhikari, Paul Gertler, and
Anneli Lagman, March 1999No. 59 The Asian Crisis: An Alternate View
—Rajiv Kumar and Bibek Debroy, July 1999No. 60 Social Consequences of the Financial Crisis in
Asia—James C. Knowles, Ernesto M. Pernia, and
Mary Racelis, November 1999
40
No. 1 Estimates of the Total External Debt ofthe Developing Member Countries of ADB:1981-1983—I.P. David, September 1984
No. 2 Multivariate Statistical and GraphicalClassification Techniques Appliedto the Problem of Grouping Countries—I.P. David and D.S. Maligalig, March 1985
No. 3 Gross National Product (GNP) MeasurementIssues in South Pacific Developing MemberCountries of ADB—S.G. Tiwari, September 1985
No. 4 Estimates of Comparable Savings in SelectedDMCs—Hananto Sigit, December 1985
No. 5 Keeping Sample Survey Designand Analysis Simple—I.P. David, December 1985
No. 6 External Debt Situation in AsianDeveloping Countries—I.P. David and Jungsoo Lee, March 1986
No. 7 Study of GNP Measurement Issues in theSouth Pacific Developing Member Countries.Part I: Existing National Accountsof SPDMCs–Analysis of Methodologyand Application of SNA Concepts—P. Hodgkinson, October 1986
No. 8 Study of GNP Measurement Issues in the SouthPacific Developing Member Countries.Part II: Factors Affecting IntercountryComparability of Per Capita GNP—P. Hodgkinson, October 1986
No. 9 Survey of the External Debt Situation
STATISTICAL REPORT SERIES (SR)
in Asian Developing Countries, 1985—Jungsoo Lee and I.P. David, April 1987
No. 10 A Survey of the External Debt Situationin Asian Developing Countries, 1986—Jungsoo Lee and I.P. David, April 1988
No. 11 Changing Pattern of Financial Flows to Asianand Pacific Developing Countries—Jungsoo Lee and I.P. David, March 1989
No. 12 The State of Agricultural Statistics inSoutheast Asia—I.P. David, March 1989
No. 13 A Survey of the External Debt Situationin Asian and Pacific Developing Countries:1987-1988—Jungsoo Lee and I.P. David, July 1989
No. 14 A Survey of the External Debt Situation inAsian and Pacific Developing Countries: 1988-1989—Jungsoo Lee, May 1990
No. 15 A Survey of the External Debt Situationin Asian and Pacific Developing Countries: 1989-1992—Min Tang, June 1991
No. 16 Recent Trends and Prospects of External DebtSituation and Financial Flows to Asianand Pacific Developing Countries—Min Tang and Aludia Pardo, June 1992
No. 17 Purchasing Power Parity in Asian DevelopingCountries: A Co-Integration Test—Min Tang and Ronald Q. Butiong, April 1994
No. 18 Capital Flows to Asian and Pacific DevelopingCountries: Recent Trends and Future Prospects—Min Tang and James Villafuerte, October 1995
FROM OXFORD UNIVERSITY PRESS:Oxford University Press (China) Ltd18th Floor, Warwick House EastTaikoo Place, 979 King’s RoadQuarry Bay, Hong KongTel (852) 2516 3222Fax (852) 2565 8491E-mail: [email protected]: www.oupchina.com.hk
1. Informal Finance: Some Findings from AsiaPrabhu Ghate et. al., 1992$15.00 (paperback)
2. Mongolia: A Centrally Planned Economyin TransitionAsian Development Bank, 1992$15.00 (paperback)
3. Rural Poverty in Asia, Priority Issues and PolicyOptionsEdited by M.G. Quibria, 1994$25.00 (paperback)
4. Growth Triangles in Asia: A New Approachto Regional Economic CooperationEdited by Myo Thant, Min Tang, and Hiroshi Kakazu1st ed., 1994 $36.00 (hardbound)Revised ed., 1998 $55.00 (hardbound)
5. Urban Poverty in Asia: A Survey of Critical IssuesEdited by Ernesto Pernia, 1994$18.00 (paperback)
6. Critical Issues in Asian Development:
Theories, Experiences, and PoliciesEdited by M.G. Quibria, 1995$15.00 (paperback)$36.00 (hardbound)
7. Financial Sector Development in AsiaEdited by Shahid N. Zahid, 1995$50.00 (hardbound)
8. Financial Sector Development in Asia: Country StudiesEdited by Shahid N. Zahid, 1995$55.00 (hardbound)
9. Fiscal Management and Economic Reformin the People’s Republic of ChinaChristine P.W. Wong, Christopher Heady,and Wing T. Woo, 1995$15.00 (paperback)
10. From Centrally Planned to Market Economies:The Asian ApproachEdited by Pradumna B. Rana and Naved Hamid, 1995Vol. 1: Overview$36.00 (hardbound)Vol. 2: People’s Republic of China and Mongolia$50.00 (hardbound)Vol. 3: Lao PDR, Myanmar, and Viet Nam$50.00 (hardbound)
11. Current Issues in Economic Development:An Asian PerspectiveEdited by M.G. Quibria and J. Malcolm Dowling, 1996$50.00 (hardbound)
12. The Bangladesh Economy in TransitionEdited by M.G. Quibria, 1997
SPECIAL STUDIES, OUP (SS,Comm)(Co-published titles; Available commercially through Oxford University Press Offices, Edward ElgarPublishing, and Palgrave MacMillan)
41
1. Improving Domestic Resource Mobilization ThroughFinancial Development: Overview September 1985
2. Improving Domestic Resource Mobilization ThroughFinancial Development: Bangladesh July 1986
3. Improving Domestic Resource Mobilization ThroughFinancial Development: Sri Lanka April 1987
4. Improving Domestic Resource Mobilization ThroughFinancial Development: India December 1987
5. Financing Public Sector Development Expenditurein Selected Countries: Overview January 1988
6. Study of Selected Industries: A Brief ReportApril 1988
7. Financing Public Sector Development Expenditurein Selected Countries: Bangladesh June 1988
8. Financing Public Sector Development Expenditurein Selected Countries: India June 1988
9. Financing Public Sector Development Expenditurein Selected Countries: Indonesia June 1988
10. Financing Public Sector Development Expenditurein Selected Countries: Nepal June 1988
11. Financing Public Sector Development Expenditurein Selected Countries: Pakistan June 1988
12. Financing Public Sector Development Expenditurein Selected Countries: Philippines June 1988
13. Financing Public Sector Development Expenditurein Selected Countries: Thailand June 1988
14. Towards Regional Cooperation in South Asia:ADB/EWC Symposium on Regional Cooperationin South Asia February 1988
15. Evaluating Rice Market Intervention Policies:Some Asian Examples April 1988
16. Improving Domestic Resource Mobilization ThroughFinancial Development: Nepal November 1988
17. Foreign Trade Barriers and Export GrowthSeptember 1988
18. The Role of Small and Medium-Scale Industries in theIndustrial Development of the PhilippinesApril 1989
19. The Role of Small and Medium-Scale ManufacturingIndustries in Industrial Development: The Experience ofSelected Asian CountriesJanuary 1990
20. National Accounts of Vanuatu, 1983-1987January 1990
21. National Accounts of Western Samoa, 1984-1986February 1990
22. Human Resource Policy and EconomicDevelopment: Selected Country StudiesJuly 1990
23. Export Finance: Some Asian ExamplesSeptember 1990
24. National Accounts of the Cook Islands, 1982-1986September 1990
25. Framework for the Economic and Financial Appraisal ofUrban Development Sector Projects January 1994
26. Framework and Criteria for the Appraisaland Socioeconomic Justification of Education ProjectsJanuary 1994
27. Guidelines for the Economic Analysis ofTelecommunications ProjectsAsian Development Bank, 1997
28. Guidelines for the Economic Analysis of Water Supply ProjectsAsian Development Bank, 1998
29. Investing in AsiaCo-published with OECD, 1997
30. The Future of Asia in the World EconomyCo-published with OECD, 1998
31. Financial Liberalisation in Asia: Analysis and ProspectsCo-published with OECD, 1999
32. Sustainable Recovery in Asia: Mobilizing Resources forDevelopmentCo-published with OECD, 2000
33. Technology and Poverty Reduction in Asia and the PacificCo-published with OECD, 2001
34. Asia and EuropeCo-published with OECD, 2002
SPECIAL STUDIES, COMPLIMENTARY (SSC)(Published in-house; Available through ADB Office of External Relations; Free of Charge)
$20.00 (hardbound)13. The Global Trading System and Developing Asia
Edited by Arvind Panagariya, M.G. Quibria,and Narhari Rao, 1997$55.00 (hardbound)
14. Social Sector Issues in Transitional Economies of AsiaEdited by Douglas H. Brooks and Myo Thant, 1998$25.00 (paperback)$55.00 (hardbound)
FROM EDWARD ELGAR:Marston Book Services LimitedPO Box 269, AbingdonOxon OX14 4YNUnited KingdomTel +44 1235 465500Fax +44 1235 465555Email: [email protected]: www.marston.co.uk
1. Reducing Poverty in Asia: Emerging Issues in Growth,Targeting, and MeasurementEdited by Christopher M. Edmonds, 2003
FROM PALGRAVE MACMILLAN:Palgrave Macmillan LtdHoundmillsBasingstokeHampshire RG21 6XSUnited KingdomTel: +44 (0)1256 329242Fax: +44 (0)1256 479476Email: [email protected]: www.palgrave.com/home/
1. Poverty, Growth, and Institutions in Developing AsiaEdited by Ernesto M. Pernia and Anil B. Deolalikar,2003
42
1. Rural Poverty in Developing AsiaEdited by M.G. QuibriaVol. 1: Bangladesh, India, and Sri Lanka, 1994$35.00 (paperback)Vol. 2: Indonesia, Republic of Korea, Philippines,and Thailand, 1996$35.00 (paperback)
2. Gender Indicators of Developing Asianand Pacific CountriesAsian Development Bank, 1993$25.00 (paperback)
3. External Shocks and Policy Adjustments:Lessons from the Gulf CrisisEdited by Naved Hamid and Shahid N. Zahid, 1995$15.00 (paperback)
4. Indonesia-Malaysia-Thailand Growth Triangle:Theory to PracticeEdited by Myo Thant and Min Tang, 1996$15.00 (paperback)
5. Emerging Asia: Changes and ChallengesAsian Development Bank, 1997$30.00 (paperback)
6. Asian ExportsEdited by Dilip Das, 1999$35.00 (paperback)$55.00 (hardbound)
7. Development of Environment Statistics in DevelopingAsian and Pacific CountriesAsian Development Bank, 1999$30.00 (paperback)
8. Mortgage-Backed Securities Markets in AsiaEdited by S.Ghon Rhee & Yutaka Shimomoto, 1999$35.00 (paperback)
9. Rising to the Challenge in Asia: A Study of FinancialMarketsAsian Development BankVol. 1: An Overview, 2000 $20.00 (paperback)Vol. 2: Special Issues, 1999 $15.00 (paperback)Vol 3: Sound Practices, 2000 $25.00 (paperback)Vol. 4: People’s Republic of China, 1999 $20.00(paperback)Vol. 5: India, 1999 $30.00 (paperback)Vol. 6: Indonesia, 1999 $30.00 (paperback)Vol. 7: Republic of Korea, 1999 $30.00 (paperback)Vol. 8: Malaysia, 1999 $20.00 (paperback)Vol. 9: Pakistan, 1999 $30.00 (paperback)Vol. 10: Philippines, 1999 $30.00 (paperback)Vol. 11: Thailand, 1999 $30.00 (paperback)Vol. 12: Socialist Republic of Viet Nam, 1999 $30.00(paperback)
10. Corporate Governance and Finance in East Asia:A Study of Indonesia, Republic of Korea, Malaysia,Philippines and ThailandJ. Zhuang, David Edwards, D. Webb,& Ma. Virginita CapulongVol. 1: A Consolidated Report, 2000 $10.00 (paperback)Vol. 2: Country Studies, 2001 $15.00 (paperback)
11. Financial Management and Governance IssuesAsian Development Bank, 2000Cambodia $10.00 (paperback)People’s Republic of China $10.00 (paperback)Mongolia $10.00 (paperback)Pakistan $10.00 (paperback)Papua New Guinea $10.00 (paperback)Uzbekistan $10.00 (paperback)Viet Nam $10.00 (paperback)Selected Developing Member Countries $10.00 (paperback)
12. Government Bond Market Development in AsiaEdited by Yun-Hwan Kim, 2001$25.00 (paperback)
13. Intergovernmental Fiscal Transfers in Asia: Current Practiceand Challenges for the FutureEdited by Paul Smoke and Yun-Hwan Kim, 2002$15.00 (paperback)
14. Guidelines for the Economic Analysis of ProjectsAsian Development Bank, 1997$10.00 (paperback)
15. Guidelines for the Economic Analysis ofTelecommunications ProjectsAsian Development Bank, 1997$10.00 (paperback)
16. Handbook for the Economic Analysis of Water Supply ProjectsAsian Development Bank, 1999$10.00 (hardbound)
17. Handbook for the Economic Analysis of Health Sector ProjectsAsian Development Bank, 2000$10.00 (paperback)
18. Handbook for Integrating Povery Impact Assessment inthe Economic Analysis of ProjectsAsian Development Bank, 2001$10.00 (paperback)
19. Handbook for Integrating Risk Analysis in the EconomicAnalysis of ProjectsAsian Development Bank, 2002$10.00 (paperback)
20. Guidelines for the Financial Governance andManagement of Investment Projects Financed by theAsian Development BankAsian Development Bank, 2002$10.00 (paperback)
21. Handbook on Environment StatisticsAsian Development Bank, 2002$10.00 (hardback)
22. Defining an Agenda for Poverty Reduction, Volume 1Edited by Christopher Edmonds and Sara Medina, 2002$15.00 (paperback)
23. Defining an Agenda for Poverty Reduction, Volume 2Edited by Isabel Ortiz, 2002$15.00 (paperback)
24. Economic Analysis of Policy-based Operations: KeyDimensionsAsian Development Bank, 2003$10.00 (paperback)
SPECIAL STUDIES, ADB (SS, ADB)(Published in-house; Available commercially through ADB Office of External Relations)