erik juto - linköping university · driving simulator development and performance study...
TRANSCRIPT

Institutionen för systemteknikDepartment of Electrical Engineering
Examensarbete
Driving Simulator Development and PerformanceStudy
Examensarbete utfört i Fordonssystemvid Tekniska högskolan i Linköping
av
Erik Juto
LiTH-ISY-EX--10/4293--SE
Linköping 2010
Department of Electrical Engineering Linköpings tekniska högskolaLinköpings universitet Linköpings universitetSE-581 83 Linköping, Sweden 581 83 Linköping


Driving Simulator Development and PerformanceStudy
Examensarbete utfört i Fordonssystemvid Tekniska högskolan i Linköping
av
Erik Juto
LiTH-ISY-EX--10/4293--SE
Handledare: Erik Hellströmisy, Linköpings universitet
Anders AnderssonStatens väg- och transportforskningsinstitut
Björn PetersStatens väg- och transportforskningsinstitut
Laban KällgrenStatens väg- och transportforskningsinstitut
Examinator: Jan Åslundisy, Linköpings universitet
Linköping, 19 April, 2010


Avdelning, InstitutionDivision, Department
Vehicular SystemsDepartment of Electrical EngineeringLinköpings universitetSE-581 83 Linköping, Sweden
DatumDate
2010-04-19
SpråkLanguage
� Svenska/Swedish� Engelska/English
�
�
RapporttypReport category
� Licentiatavhandling� Examensarbete� C-uppsats� D-uppsats� Övrig rapport�
�
URL för elektronisk versionhttp://www.vehicular.isy.liu.se/
http://urn.kb.se/resolve?urn=urn:nbn:se:liu:diva-ZZZZ
ISBN—
ISRNLiTH-ISY-EX--10/4293--SE
Serietitel och serienummerTitle of series, numbering
ISSN—
TitelTitle
Utveckling och utvärdering av personbilssimulatorDriving Simulator Development and Performance Study
FörfattareAuthor
Erik Juto
SammanfattningAbstract
The driving simulator is a vital tool for much of the research performed at theSwedish National Road and Transport Institute (VTI). Currently VTI posses threedriving simulators, two high fidelity simulators developed and constructed by VTI,and a medium fidelity simulator from the German company Dr.-Ing. Reiner Fo-erst GmbH. The two high fidelity simulators run the same simulation software,developed at VTI. The medium fidelity simulator runs a proprietary simulationsoftware.
At VTI there is a wish to integrate the medium fidelity Foerst Trainer simulatorhardware into the VTI simulation software environment. This would increaseresearch, development and maintanance flexibility and simulator availability sincedevelopment and research could be performed on one additional simulator. Anintegration would lead to a homogenous software environment that also decreasesdevelopment, maintanance and training costs.
To integrate the Foerst Trainer simulator and the VTI simulation software tocommunicate a program that translates and relays input and output between thetwo was developed. An assessment of the hardware-software integration was per-formed through an experiment where the high fidelity Simulator 3 and the mediumfidelity Foerst Trainer simulator were compared. The experiment was designed tomeasure the participants driving performances and the perceived realism of thesimulator.
The results of the experiment shows that there is suprisingly small differencesbetween the simulators, but more research is needed for more conclusive results.
NyckelordKeywords driving simulator, VTI, Foerst


AbstractThe driving simulator is a vital tool for much of the research performed at theSwedish National Road and Transport Institute (VTI). Currently VTI posses threedriving simulators, two high fidelity simulators developed and constructed by VTI,and a medium fidelity simulator from the German company Dr.-Ing. Reiner Fo-erst GmbH. The two high fidelity simulators run the same simulation software,developed at VTI. The medium fidelity simulator runs a proprietary simulationsoftware.
At VTI there is a wish to integrate the medium fidelity Foerst Trainer simulatorhardware into the VTI simulation software environment. This would increaseresearch, development and maintanance flexibility and simulator availability sincedevelopment and research could be performed on one additional simulator. Anintegration would lead to a homogenous software environment that also decreasesdevelopment, maintanance and training costs.
To integrate the Foerst Trainer simulator and the VTI simulation software tocommunicate a program that translates and relays input and output between thetwo was developed. An assessment of the hardware-software integration was per-formed through an experiment where the high fidelity Simulator 3 and the mediumfidelity Foerst Trainer simulator were compared. The experiment was designed tomeasure the participants driving performances and the perceived realism of thesimulator.
The results of the experiment shows that there is suprisingly small differencesbetween the simulators, but more research is needed for more conclusive results.
v


Acknowledgments
Many people have been involved in making this thesis possible. In no particu-lar order, I would like thank Anders Andersson, Albert Kircher, Laban Källgrenand Björn Peters at VTI; and Erik Hellström at Linköpings Universitet for theirsupervision. A special thank you to Anders for your help with the software im-plementations before the experiment and to Björn for helping with the statisticalanalysis of the questionnaires.
Thank you to Mats Lidström and Björn Blissing for your help with the Visualsoftware and Håkan Sehammar for your help with the audio software.
Last but not least, I would like to thank my family for their loving support!
vii


Contents
1 Introduction 11.1 Background . . . . . . . . . . . . . . . . . . . . . . . . . . . . . . . 11.2 Objectives . . . . . . . . . . . . . . . . . . . . . . . . . . . . . . . . 21.3 Limitations . . . . . . . . . . . . . . . . . . . . . . . . . . . . . . . 31.4 Related Work . . . . . . . . . . . . . . . . . . . . . . . . . . . . . . 31.5 Thesis Structure . . . . . . . . . . . . . . . . . . . . . . . . . . . . 31.6 Thesaurus . . . . . . . . . . . . . . . . . . . . . . . . . . . . . . . . 4
2 The Simulator Systems 52.1 Hardware . . . . . . . . . . . . . . . . . . . . . . . . . . . . . . . . 5
2.1.1 Simulator 3 . . . . . . . . . . . . . . . . . . . . . . . . . . . 52.1.2 The Foerst Trainer Simulator . . . . . . . . . . . . . . . . . 6
2.2 VTI Simulation Software . . . . . . . . . . . . . . . . . . . . . . . . 92.2.1 Framework . . . . . . . . . . . . . . . . . . . . . . . . . . . 92.2.2 Scenarios . . . . . . . . . . . . . . . . . . . . . . . . . . . . 102.2.3 Interfaces . . . . . . . . . . . . . . . . . . . . . . . . . . . . 102.2.4 Other Software . . . . . . . . . . . . . . . . . . . . . . . . . 11
3 System Integration and Software Development 133.1 Background . . . . . . . . . . . . . . . . . . . . . . . . . . . . . . . 133.2 Translation and Relaying Program . . . . . . . . . . . . . . . . . . 143.3 Audio and Video . . . . . . . . . . . . . . . . . . . . . . . . . . . . 163.4 Implemented Interfaces . . . . . . . . . . . . . . . . . . . . . . . . 173.5 Experiment Preparations . . . . . . . . . . . . . . . . . . . . . . . 18
3.5.1 GUI Application . . . . . . . . . . . . . . . . . . . . . . . . 183.5.2 Scenarios . . . . . . . . . . . . . . . . . . . . . . . . . . . . 19
3.6 Summary . . . . . . . . . . . . . . . . . . . . . . . . . . . . . . . . 19
4 Experiment - Method 214.1 Design . . . . . . . . . . . . . . . . . . . . . . . . . . . . . . . . . . 21
4.1.1 Hypothesis . . . . . . . . . . . . . . . . . . . . . . . . . . . 214.2 Scenarios . . . . . . . . . . . . . . . . . . . . . . . . . . . . . . . . 21
4.2.1 Lateral Positioning . . . . . . . . . . . . . . . . . . . . . . . 214.2.2 Speed Estimation . . . . . . . . . . . . . . . . . . . . . . . . 224.2.3 Car Following . . . . . . . . . . . . . . . . . . . . . . . . . . 22
ix

x Contents
4.2.4 Controlled Stop . . . . . . . . . . . . . . . . . . . . . . . . . 234.2.5 Double Lane Change . . . . . . . . . . . . . . . . . . . . . . 23
4.3 Participants . . . . . . . . . . . . . . . . . . . . . . . . . . . . . . . 244.4 Procedure . . . . . . . . . . . . . . . . . . . . . . . . . . . . . . . . 244.5 Measures . . . . . . . . . . . . . . . . . . . . . . . . . . . . . . . . 25
4.5.1 Objective Measures . . . . . . . . . . . . . . . . . . . . . . . 254.5.2 Subjective Measures . . . . . . . . . . . . . . . . . . . . . . 27
4.6 Data Analysis . . . . . . . . . . . . . . . . . . . . . . . . . . . . . . 284.6.1 Statistical Analysis . . . . . . . . . . . . . . . . . . . . . . . 284.6.2 Data Extraction . . . . . . . . . . . . . . . . . . . . . . . . 28
5 Experiment - Results 315.1 Objective Measures . . . . . . . . . . . . . . . . . . . . . . . . . . . 31
5.1.1 Lateral Positioning . . . . . . . . . . . . . . . . . . . . . . . 325.1.2 Speed Estimation . . . . . . . . . . . . . . . . . . . . . . . . 325.1.3 Car Following . . . . . . . . . . . . . . . . . . . . . . . . . . 335.1.4 Controlled Stop . . . . . . . . . . . . . . . . . . . . . . . . . 335.1.5 Double Lane Change . . . . . . . . . . . . . . . . . . . . . . 34
5.2 Subjective Measures . . . . . . . . . . . . . . . . . . . . . . . . . . 395.2.1 Simulator Sickness . . . . . . . . . . . . . . . . . . . . . . . 395.2.2 Workload . . . . . . . . . . . . . . . . . . . . . . . . . . . . 395.2.3 Simulator Realism . . . . . . . . . . . . . . . . . . . . . . . 39
6 Discussion 436.1 System Integration and Software Development . . . . . . . . . . . 43
6.1.1 Simulator Development . . . . . . . . . . . . . . . . . . . . 436.1.2 Experiment Preparations . . . . . . . . . . . . . . . . . . . 44
6.2 Experiment . . . . . . . . . . . . . . . . . . . . . . . . . . . . . . . 446.2.1 Scenarios . . . . . . . . . . . . . . . . . . . . . . . . . . . . 456.2.2 Subjective Measures . . . . . . . . . . . . . . . . . . . . . . 47
6.3 Future Work . . . . . . . . . . . . . . . . . . . . . . . . . . . . . . 48
7 Conclusions 49
Bibliography 51
A Questionnaires 53A.0.1 Background Information Questionnaire . . . . . . . . . . . 53A.0.2 Workload Questionnaire . . . . . . . . . . . . . . . . . . . . 54A.0.3 Simulator Sickness Screening Questionnaire . . . . . . . . . 55A.0.4 Simulator Sickness Symptom Questionnaire . . . . . . . . . 56A.0.5 Realism Questionnaire . . . . . . . . . . . . . . . . . . . . . 56

Chapter 1
Introduction
1.1 BackgroundThe Swedish National Road and Transport Institute (VTI) is an independentand internationally recognized research institute that investigates many aspects oftraffic related research. An important tool in the research is the driving simulators.They provide a cost-effective and safe way to perform traffic and vehicular research,such as traffic safety, vehicle dynamics, driving behaviors, and evaluation of newvehicle technology.
A driving simulator typically consists of a driver cabin, systems for audio andvideo feedback from the simulation, and motion system which provides force feed-back from the simulation to the driver. The specific configuration of a simulatordepends on its intended usage and development budget. A basic and cheap drivingsimulator can consist of a standard PC with a simulation software, for examplea car racing game. A driving simulator can also be an advanced and expensivemachine with a real car cabin, 360 degrees field of view, and force feedback from amotion base not only capable of pitching, rolling and shaking the car, but also ex-erting almost 1 g of force along the car’s lateral and longitudinal axes, all controlledby a distributed computer system.
A driving simulator provides a controlled environment where experimental con-ditions can be reproduced and the data from the experiments are easily available.The simulator also provides a safe experimental environment where research thatotherwise could be potentially dangerous, to the driver and other traffic, can beperformed. Examples of such experiments are: Driving under the influence ofalcohol or medication, very tired drivers, or traffic situations with intense sunglare.
VTI currently posses three driving simulators; Simulator 2, a high-fidelityheavy vehicle simulator; Simulator 3, a high-fidelity simulator mainly used tosimulate passenger cars, but have the capability of heavy vehicle simulations andthe Foerst Trainer simulator, a medium-fidelity car simulator. All simulators arelocated in Linköping, Sweden. A fourth simulator, Simulator 4, is currently underdevelopment and will be built at VTI in Göteborg, Sweden [1].
1

2 Introduction
The Simulator 2 and Simulator 3 are of the same basic design. The motionsystem consists of a linear motion base for the simulation of lateral forces duringshorter time periods. The motion base tilts the simulator cabin for simulation ofadditional lateral and longitudinal forces or forces acting on the vehicle duringlonger time periods. A vibration table simulates the contact with the road. Sim-ulator 3’s motion base also has the capability to turn the cabin 90 degrees so thatthe linear motion base simulates longitudinal forces. This gives a more accuratesimulation of accelerating and braking forces. The driver sits in a real vehiclecabin in front of a projector screen providing the driver with a 120 degree forwardview. Monitors in the rear view mirrors lets the driver see what happens behindthe vehicle.
The Foerst Trainer simulator is a commercial driving simulator developed byDr.-Ing Reiner Foerst GmbH, Germany. The system runs a proprietary simulationsoftware and consists of a basic driver cab, three 40 inch monitors, two channelaudio system and a basic motion system that pitches and rolls the cab to simulateforces acting on the vehicle.
Simulator 2, Simulator 3, and in the future Simulator 4, run the same sim-ulation software, developed at the VTI department of Vehicle Technology andSimulation. The modular design of the software allows one to substitute sub-systems, both hardware and software, of the simulator with minimal changes tothe rest of the simulator. Only the substituted sub-system’s software need to bere-programmed, the rest of the simulation software is unaffected. Some of the ad-vantages of running the same software on all the simulators are that all simulatorcan take benefit from improvements of the general software, smaller staff trainingcosts and reuse of scenarios is very simple, at least from a technical point of view.
If the Foerst Trainer simulator is integrated into VTI’s simulation softwareenvironment the utilization of all of the simulators can increase. The integrationgives a homogeneous software environment allowing development and testing ofVTI simulation software and scenarios on the Foerst simulator, thus increasingthe time available for research in the other VTI simulators. An integration alsoeliminates the need of the extra training required for scenario development onmultiple platforms, increases the ability of cross-simulator research and reusing ofscenarios.
1.2 Objectives
This thesis work’s objective is two folded. The first part is to integrate the FoerstTrainer simulator into VTI’s simulation environment so that it’s possible to runa simulation using the Foerst Trainer simulator hardware and the VTI simulationsoftware. The second part is to compare the driving performance and perceivedrealism of Simulator 3 and the Foerst Trainer simulator.

1.3 Limitations 3
1.3 Limitations
The main limitations of this thesis where time and budget. The software imple-mentation time affected the time that was left for the performance study. Budgetlimitations restricted hardware purchases; only hardware that’s available at VTIwas used.
1.4 Related Work
In [2] the problem of driving simulator scenario portability is studied. The paperdiscusses the issues of replicating research and comparing performance variablesmeasured during drives in different simulators due to differences in fidelity, cues,audio feedback and visual rendering.
Peters and Lidström propose a method for driving simulator fidelity assessmentin [3]. The paper suggests that the fidelity should be measured through both objec-tive and subjective measures, i.e. driving data and questionnaires. To get relevantdriving data the authors propose several driving sub-tasks (called scenarios in thisthesis) and measures to evaluate the drivers perception of the vehicle’s position,speed, acceleration, vehicle control and the environment. The suggested subjec-tive measures are questionnaires to measure the driver’s perception of simulatorrealism and simulator sickness.
1.5 Thesis Structure
Chapter 2: The Simulator Systems. In this chapter the hardware and softwareof Simulator 3 and the Foerst Trainer simulator is presented.
Chapter 3: System Integration and Software Development. The work requiredto integrate the two simulators into the VTI-F simulator and to run theexperiments is presented.
Chapter 4: Experiment - Method. A presentation of the experiments method,including participants, driving scenarios, questionnaires and measures.
Chapter 5: Experiment - Results. The results of the experiment are presented.
Chapter 6: Discussion. The system integration and the experiments are dis-cussed. Future work and improvements are suggested.
Chapter 7: Conclusions. A conclusive summary of the thesis work.

4 Introduction
1.6 ThesaurusFollowing abbreviations and notations are used in this thesis work.
ANOVA Analysis of varianceCAN Controller-area networkFoerst GmbH Dr.-Ing. Reiner Foerst GmbHGUI Graphical user interfaceHID (USB) Human interface deviceI/O Input/outputLCD Liquid crystal displayMFC Microsoft foundation class librarymmTTC mean of minimum of TTCNoCKO Number of cones knocked overPC Personal computerScramNet Shared common random access memory networkSDK Software development kitSDLP Standard deviation of the lateral position of the car.SDS Standard deviation of speedSSQ Simulator sickness questionnaireTARP Translation and Relaying ProgramTFT Thin film transistor liquid crystal displayTHWY Time headwayTTC Time to collisionUDP User datagram protocolUSB Universal serial busVTI Swedish national road and transport research institute

Chapter 2
The Simulator Systems
The two simulator systems used in this thesis work, Simulator 3 and the FoerstTrainer simulator, are presented in this chapter. The simulators’ hardware config-urations is described in section 2.1 and the VTI simulation software, relevant inthe scope of this thesis, is briefly described in section 2.2.
2.1 Hardware2.1.1 Simulator 3In 2004 the Simulator 3 was taken in use after several years of development. Thesimulator consists of an vehicle cabin mounted on top of a motion system. Simula-tor 3 is mainly used as a passenger car simulator, but the cabin can be exchangedto suit simulations of lorries, busses or trains. In front of the cabin an archedprojection screen provides the forward view. An illustration of Simulator 3 can befound in figure 2.1.
The Simulator 3 motion system consists of a motion base and a vibration table.The motion base simulates forces acting on the vehicle by tilting the cabin andthrough linear motion along the lateral or longitudinal axis of the vehicle. Thetilting and translating actions of the motion base supplement each other, the tiltingmotion best simulates forces that are constant or changes with low frequency, thetranslation is best suited to simulate forces that changes with a high frequency [4].If an experiment requires more realistic acceleration and braking forces than lateralforces, the cabin can be rotated so that the linear motion base provides longitudinalforces instead of lateral. The vibration table is responsible of providing small highfrequency translations, rotations and vibrations of the cabin. The arrows in figure2.1 shows possible movements of the simulator motion system and table 2.1 showsthe motion system specifications.
The visual system of Simulator 3 consists of three projectors, an arched pro-jection screen providing the driver with a 120 degree forward view and three smallTFT monitors, mounted in the rear view mirrors, provides the driver with rearview. The audio is supplied by an 8 channel audio system.
5

6 The Simulator Systems
Motion base Tilting motion Pitch angle: -9 to +14 degreesRoll angle: ±24 degrees
Linear motion Maximum amplitude: ±3.75 mMaximum velocity:±4.0 m/sMaximum acceleration: ±0.8 g
Vibration table Vertical movement: ±6.0 cmLongitudinal movement: ± 6.0 cmRoll angle: ±6 degreesPitch angle: ±3 degrees
Table 2.1: Simulator 3 motion system specifications.
The computer cluster that is responsible for the simulation in the Simulator 3consists of standard PCs running either Windows XP or the GNU/Linux distribu-tion OpenSUSE. The computers have specific tasks, such as rendering a graphicschannel, controlling the motion system or synthesizing audio. The computers areconnected to the simulation kernel via ethernet, CAN-busses and ScramNet. Seefigure 2.3 for an schematic view of the system architecture.
2.1.2 The Foerst Trainer Simulator
The Foerst simulator is a commercial driving simulator developed for driver train-ing by the German company Dr.-Ing Reiner Foerst GmbH. The simulator wasacquired by VTI when participating in a research project funded by the EU. TheFoerst Trainer simulator consists of a basic car cockpit mock up, a simple motionsystem, three 40 inch TFT monitors and an audio system [5].
The simulator cockpit consists of parts from a Ford Focus. All controls requiredfor driving a car are available, i.e. steering wheel, pedals, dashboard, etc. Thepedals are spring loaded for a realistic resistance in the pedals, and the steeringwheel have a constant base resistance when the simulator is switched on.
The motion system of the Foerst Trainer simulator is a simple motion basecapable of pitching and rolling the cab ±6 degrees to simulate longitudinal andlateral forces [5].
The video system consists of three 40 inch widescreen LCD-monitors. Themonitors are responsible for showing the forward view, the rear view mirrors andthe parts of the car body that’s visible from the driver seat. The audio systemsupplies 2-channel audio to a 5.1 surround sound system.
The Foerst simulator utilizes one computer for rendering software, audio andmotion cues. The computer is a standard PC, with a rather powerful, two channel,graphics card. A video splitter is used to split up one of the two channels so thatthree monitors can be used.
Figure 2.2 shows a picture of a Foerst Trainer simulator running the Foerstsimulation software.

2.1 Hardware 7
Figure 2.1: The illustration shows the Simulator 3, consisting of motion base,cabin and operator console. The arrows shows possible movement of the Simulator3 cabin. Illustration: ARIOM reklambyrå.

8 The Simulator Systems
Figure 2.2: Photo of the Foerst Trainer simulator. Photo: Dr.-Ing Foerst GmbH.

2.2 VTI Simulation Software 9
Figure 2.3: VTI Simulation system architecture [6].
2.2 VTI Simulation SoftwareThe VTI simulation software run on a distributed computer system. The com-puters are standard PC’s with Windows XP, or the OpenSUSE operating system.The software consists of a several programs, each responsible for different parts ofthe simulation. The core of the simulation software is the simulation kernel. Ithandles simulation calculations and data routing. Other parts of the simulationsoftware sends data and/or receives data from the kernel to be able to perform it’stask, such as displaying graphics, playing sound or controlling the motion system.See figure 2.3 for a schematic view of the system architecture.
Parts of the VTI simulation software relevant to the objectives of this thesis isdescribed below in section 2.2.1 - 2.2.4.
Unless stated otherwise information in this section, and sub-sections, is col-lected from [6].
2.2.1 FrameworkThe VTI simulation kernel is built upon a software framework developed at VTI.The framework is developed in C++ and utilizes third-party libraries and frame-works such as Boost, OpenDrive and Qt. The framework provides a unified codebase for all simulators of VTI. Figure 2.4 shows an illustration of the kernel archi-tecture.
The framework has two central classes, the singleton Router class, and theabstract base class SimObject. The Router handles data routing between objectsinherited from the SimObject base class. An class derived from a SimObject inher-its functionality to send and receive Interactions to and from other SimObjectderived classes.

10 The Simulator Systems
Figure 2.4: VTI Simulation kernel architecture [6].
An Interaction is basically a message containing a recipient and a message.The Interaction is sent from the sender object via the Router to the recipient.
2.2.2 ScenariosThe following definition of scenario is used in this thesis:
Scenario: The complete set of events1 and interactions controlling the completesimulation experience from the start to the end of a driving task, see section4.2 for a description of the scenarios.
The scenarios is controlled by actions from a scenario module. Actions canbe triggered either manually by the operator or automatically by a measurementin the simulated environment, such as vehicle position or speed. An example ofpossible actions is the starting of an event or repositioning of the simulated vehicle.
2.2.3 InterfacesThe software interfaces provides a specification of methods that allows separatemodules of the simulator software exchange data in a well specified manner. Asoftware module can easily be exchanged, and a new module integrated with thesimulation software by implementing the suiting interface.
Interfaces that is relevant in the scope of this thesis is:1Events are detailed specifications of situations in a scenario. An event is a state machine
that changes state when a specified trigger, e.g. speed, lane position, et.c. is set. Triggers areset by the simulated vehicle’s state.

2.2 VTI Simulation Software 11
The facility interface: Specifies the methods required to let the simulator ker-nel/motion system exchange data.
The cabin interface: Specifies the methods of the simulator kernel/cabin com-munication.
The driver interface: Specifies the methods of the driver/cabin communication.
2.2.4 Other SoftwareVisual is the software responsible for rendering the graphical output of the sim-ulation. The software is developed at VTI and is used both in Simulator 2 andSimulator 3.
PCLjudsystem is an audio software developed at VTI. PCLjudsystem modelsthe different driving sounds using, for example the engine speed to model theengine sound.


Chapter 3
System Integration andSoftware Development
This chapter presents the work that was made for an integration of the Foerst sim-ulator hardware and the VTI simulation software. In section 3.1 a brief descriptionis given on system details considered before settling for a solution. Sections 3.2-3.4gives an description of the software development needed to integrate the FoerstTrainer simulator into the VTI simulation environment. The scenarios is presentedin 4.2 and software developed especially for the experiment is presented in section3.5.
3.1 BackgroundOn the original configuration of the Foerst simulator the hardware sends I/O tothe Windows XP simulation computer through a USB cable. The USB interfaceis a virtual serial port on top of which a filter driver has been implemented. Thefilter driver makes the Foerst simulator hardware to appear as several USB HID’son the connected computer. The HID’s are accessible through a SDK suppliedby Dr.-Ing. Foerst GmbH, DirectX or by using Microsoft Windows built-in HIDdrivers.
The desired solution was to connect the Foerst simulator USB directly to theGNU/Linux computer running the VTI simulation kernel. The simulator was de-tected as a virtual serial device on the GNU/Linux computer, but the lack ofGNU/Linux drivers made the HID programming approach unaccessible. Com-munication over the virtual serial port was examined and a successful connectionwas made. The serial communication approach was however discarded after acall to Dr.-Ing Foerst GmbH regarding the protocol of the communication sinceit appeared to time consuming to complete within the time limits of this thesiswork.
The only feasible solution was to use a Windows XP computer as a relay. Therelay computer communicates with the Foerst Trainer simulator over USB and
13

14 System Integration and Software Development
relays data, via a local network, to the GNU/Linux computer that runs the VTIsimulation kernel. However, communication over a network will introduce sometime lag. The simulation demands that the software may not delay executionmore than 5 ms, or else the driver might notice the latency. Due to this real-time demand; the time delays of the network communication were investigated.A simple client and echo-server was implemented using the Python programminglanguage. The client started a clock, sent a string of characters to the server andthe server echoed the string back to the client. When the string was received theclock was stopped. Both the UDP and the TCP/IP protocols were evaluated.Surprisingly, the UDP communication was slower than the TCP/IP1, see figure3.1 and table 3.1. Even though the UDP protocol was slower it was decided tobe used since the VTI simulation kernel uses UDP as the standard protocol whencommunicating over network.
The latency introduced by the network in a relay solution, as described above,was considered to be tolerable, as the simulation deadline of 5 ms could be met.The implementation is presented in section 3.2, and a schematic view of the re-sulting system can be seen in figure 3.2.
64 bytes 1023 bytesUnit UDP TCP/IP UDP TCP/IP
Mean Latency ms 0.75 0.48 2.50 2.51Minimum Latency ms 0.47 0.44 2.42 2.38Maximum Latency ms 18.30 1.35 27.40 19.00Standard Deviation ms 0.59 0.08 0.37 0.61
Table 3.1: Network latency data. The table shows the results of the latencytests with different packet sizes, 64 and 1023 bytes, and the two different networkcommunication protocols, UDP and TCP/IP.
3.2 Translation and Relaying ProgramTo be able to use the Foerst Trainer simulator hardware with the VTI simulationframework it must be possible to send data between the two different systems.Also, the data representation on the two system differ, therefore a translationbetween the two data formats is needed.
A program, Translation and Relaying Program (TARP), responsible for datatranslation and relaying, was developed using Microsoft Visual C++, MicrosoftFoundation Classes (MFC) and the Foerst Software Development Kit (SDK). Theprogram receives data from the Foerst simulator, translate and relays it to thesimulation kernel, and vice versa.
The data translation is in most cases a straight forward typecast. The Fo-erst SDK uses several different data types to represent the data sent to and from
1UDP is supposed to have lower latency than TCP/IP. The UDP protocol have minimaloverhead as it is connectionless and have no error checking mechanisms [7].

3.2 Translation and Relaying Program 15
500
1000
00.4 0.5 0.6 0.7 0.8 0.9
[ms]
[No.
pac
kets
]
Figure 3.1: Histogram of the network latency. This histogram shows the latencyof the TCP/IP protocol, 5000 packets, 64 bytes each. The latency of the othertests (see table 3.1) had the same principal shape with most packets in the lowertime span and a few packets with higher latency.
the simulator. The data types is Microsoft specific such as WORD, DWORD, BYTE,etc. These are actually type definitions derived from ordinary C++ data types[7],unsigned short, unsigned long, unsigned char, etc. The VTI Simulation soft-ware exclusively uses floats in the cabin to simulation kernel communication.
A simple code example of a data conversion can be seen below. The VTIsimulation kernel expects the clutch pedal to deliver a value between 0 and 1,where 1 equals a fully depressed pedal. The Foerst SDK delivers the clutch pedalposition as a value between 0 and 255, where 255 is fully depressed.
// Convert clutch pedal position from Foerst to kernel formatfloat clutch_pedal_to_kernel = (float)clutch_pedal_foerst/255;
In the case of the accelerator pedal a typecast was not sufficient. The ac-celerator pedal was very sensitive in the top position. A simple function wasimplemented to give the pedal a bit of play. A sketch of the function can be seen

16 System Integration and Software Development
«SIMGRAFIK-10»Windows XP
Visual
«SIMGRAFIK-12»Windows XP
Visual
«Foerst1040»Windows XP
TARP
Visual
«FOERST-LJUD»Windows XP
PCLjudSystem
«simserver»openSUSE
Simulation Kernel
UDP
UDP
USB
Foerst Trainersimulator hardware
Screen
Screen
Screen
VGA
VGA
VGA
Figure 3.2: Illustration of the VTI-F simulator. The computers are drawn likeboxes with a «computer name», operating system and which programs they exe-cute.
in figure 3.3. The implemented function gave the accelerator pedal a more naturalfeeling.
When the Foerst simulator hardware sends output, the data is received bythe device driver. The driver notifies the TARP, through Window messages, thatdata has been received. As soon the data has been loaded into the TARP, it istranslated and sent to the VTI simulation kernel through a UDP network socket.
When data is received from the simulation kernel the receiving network socket’smember function OnReceive is called by the MFC framework. The OnReceivemember collects the data received, converts it to the correct data types and tem-porarily stores the data. When the TARP receives a WM_TIMER message, the storeddata is sent to the Foerst simulator. The WM_TIMER message is emitted once every15 ms.2 Figure 3.4 shows a state diagram of the TARP.
3.3 Audio and VideoThe audio system of Simulator 3 is an 8 channel system and the computer availablefor this thesis only had a 2 channel audio card. The audio software PCLjudsys-tem (see section 2.2.4) was therefore modified to play 2 channel audio. The twochannels playing engine sound was kept and the remaining six audio channels were
2The timer’s period was based on empirical testing. See section 6.1.1 for a more detailedexplanation of the timer period.

3.4 Implemented Interfaces 17
Ped
al p
ositi
on to
sim
ulat
ion
kern
el
Physical pedal position
Figure 3.3: Sketch of the implemented accelerator pedal function
removed. The removed channels contained the audio of road noise, rain and othersound effects.
The video program, Visual, was used almost unmodified. The only modifica-tion was a removal of data printouts that disturbed the visual impression of thesimulation in the Foerst simulator hardware. In Simulator 3 the printouts is inthe video feed, but it is projected out of the driver’s view.
Visual was configured so that the drivers eyes and horizon were at the sameheight and so that the graphic distortion is minimized when shown over the seamof two monitors.
3.4 Implemented InterfacesIn this section a short presentation of the implemented interfaces is made. Thedescription will be general and in the context of the communication between theFoerst simulator and the simulator kernel. Implementation details will be held toa minimum.
The cabin interface is actually split up into two parts. One interface handlesinput to the cabin and one handles output. The output interface only neededto send speedometer and tachometer values to the Foerst simulator. The outputinterface also can receive an Interaction from the GUI application (see section3.5.1) used to control the simulation. The Interaction sets the speedometer andtachometer to zero, so that the speed estimation scenario (see 4.2.2) could beperformed.
The input interface receives data from the Foerst simulator, via the TARP.The received data is:
• pedal positions
• gear number

18 System Integration and Software Development
Waiting
Translating
Sending data to:VTI-F Simulator
Sending data to:Simulation Kernel
Translating
[timer]
[receive data from VTI-F]
[receive data fromsimulation kernel]
[done][done]
[done]
[done]
Figure 3.4: State diagram of the TARP. The figure shows the states of the programand the events that trigger a state change. When receiving data from the VTI-Fsimulator the data is buffered. The buffered data is sent to the simulation kernelon a WM_TIMER window message.
• steering wheel angle
• turn indicator
When the data is received it is sent through the input interface where it undergoesintegrity checks and type casts and conversions. The data is then sent to thevehicle model which provides output for the next time step of the simulation.
The driver interfaces was not changed as the functionality of the supplied codewas sufficient.
No facility interface was implemented3 and the Foerst simulator was used as afixed base simulator during the experiments.
3.5 Experiment PreparationsAfter the system integration was completed software for the experiments still wasneeded. The software implemented for the experiments is briefly presented in thissection.
3.5.1 GUI ApplicationThe GUI application is used by the test leader to select driving scenario, controlscenario specific settings and set markers in the data. The GUI application wasimplemented using the Qt framework and was based on software developed at VTIfor similar tasks.
3When the simulator software is started with a “no motion system” switch; the simulatorkernel use an empty facility interface.

3.6 Summary 19
3.5.2 ScenariosThe driving scenarios were implemented in an existing scenario module calledDemo2008. The scenarios were implemented so that they matched the demandsfrom the experiment. See section 4.2 for a description of the scenarios.
3.6 SummaryThe implemented TARP and kernel interfaces allowed the Foerst Trainer simulatorto communicate with the VTI simulation kernel. Figure 3.2 shows the a schematicsketch over the resulting system, from here on called the VTI-F simulator. Theimplemented GUI application and scenarios allowed the performance evaluation,through experiments, to start.


Chapter 4
Experiment - Method
After the software implementation, described in chapter 3, the simulators were ableto run the same software and scenarios. A simulator experiment was planned andconducted with the objective to determine if there were any differences betweenthe two simulators in terms of driving performance and perceived realism.
The simulator experiment was designed to get objective as well as subjectivemeasures of the driver’s performance and experience of the simulator. The experi-ment included five scenarios that were driven by all participants. Driving scenariosand questionnaires were taken from [3].
The Simulator 3 drives took place in June of 2009, and the VTI-F simulatordrives in September of 2009.
4.1 DesignThe design of the experiment was a between-group design with two groups of fivepersons each. One group drove all scenarios in the VTI-F simulator and one groupdrove in Simulator 3.
4.1.1 HypothesisThe hypothesis to be tested was that there should be no differences between Sim-ulator 3 and the VTI-F simulator.
4.2 ScenariosThe rationale and description of included driving scenarios is presented in thissection. The scenarios did not include any other traffic except for a lead vehiclein the car following scenario, see 4.2.3.
4.2.1 Lateral PositioningRationale: Measure driver perception and control of the vehicle’s lateral position.
21

22 Experiment - Method
Description: The lateral positioning scenario took place on a long straight road.The driver was instructed to accelerate to 50 km/h. When the speed wasreached the driver was asked to drive the vehicle with the left wheel pair onthe road’s center line. The driver was then instructed to drive with the rightwheel pair on the road’s right lane markers. Each of the positions was to beheld for 10 s.The scenario was repeated once so that more data could be collected. Thelane width was 3.75 m and the lane markers was 10 cm wide.
Instructions to the driver: The driver was informed about the scenario andasked to inform the test leader when he/she had complied with each in-struction, and hold their position until instructed otherwise. The followinginstructions were given to the driver during the drive:
1. Accelerate to 50 km/h.2. Drive with the left wheel pair on the road’s center markers!3. Drive with the right wheel pair on the road’s right lane markers!4. Drive with the left wheel pair on the road’s center markers!5. Drive with the right wheel pair on the road’s right lane markers!
4.2.2 Speed EstimationRationale: Measure the driver’s longitudinal speed perception and control.
Description: The scenario was set to a rural road with no sharp turns. With thesimulator’s speedometer and tachometer set to zero, the driver was instructedto drive at a speed that the driver estimated to be 50 km/h, 70 km/h and90 km/h. Each of the speeds should be held for about 15 seconds.
Instructions to the driver: The driver was informed about the scenario andwas told to inform the test leader when the estimated speed was reached,and hold that speed until instructed otherwise. The instructions during thedrive was:
1. Drive at the speed that you estimate to be 50 km/h!2. Drive at the speed that you estimate to be 70 km/h!3. Drive at the speed that you estimate to be 90 km/h!
4.2.3 Car FollowingRationale: Measure the driver’s distance keeping, longitudinal speed perception
and control when following a car.
Description: On a rural road with no sharp turns; the driver was instructed tofollow a car at a close but safe distance. The driver follows the car for about3 minutes. The lead car’s speed was varied according to a sinusoidal functionwith a mean speed of 70 km/h, a period of 60 seconds, and an amplitude of5 km/h.

4.2 Scenarios 23
Instructions to the driver: The scenario was explained and the driver was in-structed to inform the test leader when the correct distance reached and holdthat distance until instructed otherwise. The instruction at the start of thedrive was: Follow the car at a close but safe distance!
4.2.4 Controlled Stop
Rationale: Measure the driver’s perception of the longitudinal road position.
Description: The scenario was set to an urban environment with two road cross-ings, speed limit 50 km/h. At each crossing the driver was instructed to stopat a stop sign placed in front of the crossing. The scenario was driven twotimes.
Instructions to the driver: The driver was instructed to drive at 50 km/h andto stop at the stop sign!
4.2.5 Double Lane Change
Rationale: Standardized maneuvering performance measure.
Description: The scenario was set to a straight road with a cone track. Thecones were positioned according to the ISO 3888-1 standard, a standardizedmaneuvering performance test. The cone track was driven three times, aftera training session of two passes over the track. The cone track can be seenin figure 4.1.
Instructions to the driver: The driver was informed about the scenario andinstructed to drive through the cone track with a constant speed of 50 km/h,knocking over as few cones as possible.
Figure 4.1: The double lane change maneuver. Lane widths A: 1.1 · w + 0.25, B:1.2 · w + 0.25, C: 1.3 · w + 0.25. w is the car width [8].
24 Experiment - Method
Unit Simulator 3 VTI-FAge year 29 ± 5 31 ± 16Licence holding time year 10±4 13 ± 16Driving experience (last 12 months) km 4400 ± 8700 5000 ± 4800Driving experience (since licensed) 1000 km 288 ± 541 92 ± 173
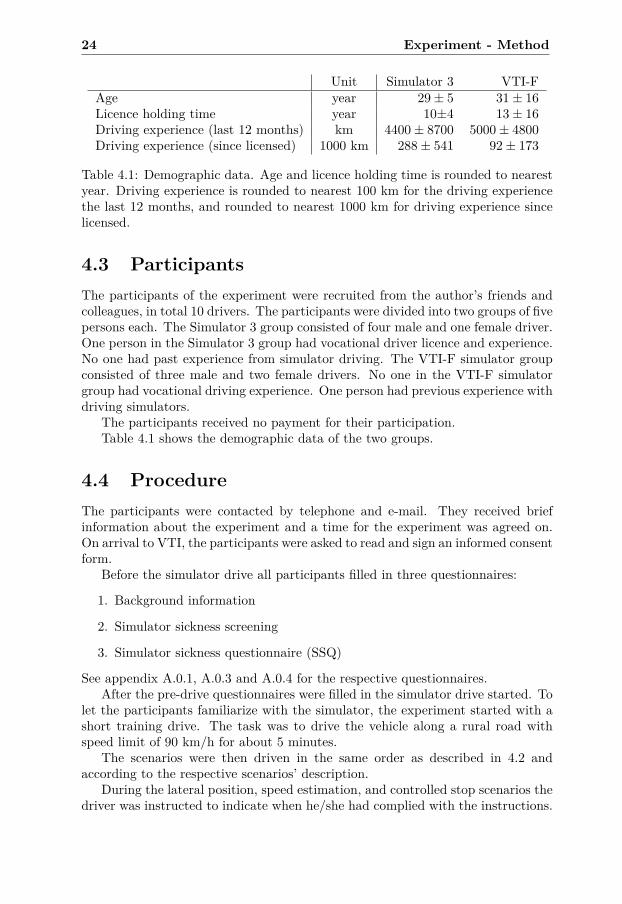
Table 4.1: Demographic data. Age and licence holding time is rounded to nearestyear. Driving experience is rounded to nearest 100 km for the driving experiencethe last 12 months, and rounded to nearest 1000 km for driving experience sincelicensed.
4.3 ParticipantsThe participants of the experiment were recruited from the author’s friends andcolleagues, in total 10 drivers. The participants were divided into two groups of fivepersons each. The Simulator 3 group consisted of four male and one female driver.One person in the Simulator 3 group had vocational driver licence and experience.No one had past experience from simulator driving. The VTI-F simulator groupconsisted of three male and two female drivers. No one in the VTI-F simulatorgroup had vocational driving experience. One person had previous experience withdriving simulators.
The participants received no payment for their participation.Table 4.1 shows the demographic data of the two groups.
4.4 ProcedureThe participants were contacted by telephone and e-mail. They received briefinformation about the experiment and a time for the experiment was agreed on.On arrival to VTI, the participants were asked to read and sign an informed consentform.
Before the simulator drive all participants filled in three questionnaires:
1. Background information
2. Simulator sickness screening
3. Simulator sickness questionnaire (SSQ)
See appendix A.0.1, A.0.3 and A.0.4 for the respective questionnaires.After the pre-drive questionnaires were filled in the simulator drive started. To
let the participants familiarize with the simulator, the experiment started with ashort training drive. The task was to drive the vehicle along a rural road withspeed limit of 90 km/h for about 5 minutes.
The scenarios were then driven in the same order as described in 4.2 andaccording to the respective scenarios’ description.
During the lateral position, speed estimation, and controlled stop scenarios thedriver was instructed to indicate when he/she had complied with the instructions.

4.5 Measures 25
When the driver indicated a comply, a data marker was set by the test leader. Thedata marker was later used to extract relevant data for the statistical analysis. Seesection 4.6.2 for further description of the data extraction.
After each scenario a workload questionnaire with 3 questions was filled. Thequestionnaire can be seen in appendix A.0.2.
When the simulator drive was finished all participants were asked to fill in twomore questionnaires:
1. Simulator sickness questionnaire (same as before the drive)
2. Simulator realism (see appendix A.0.5)The experiment took about 45 minutes for each participant.
4.5 MeasuresThe measures used in the experiment is divided into objective and subjectivemeasures. The subjective data was captured by questionnaires and the objectivemeasures were driving behavior data recorded during the drive..
4.5.1 Objective MeasuresThe objective data were measured in the simulator environment during the exper-iment, such as vehicle position, speed or accelerations. Some objective data werealso calculated from recorded data, such as TTC and THWY. Driving behaviordata were recorded with a sampling rate of 50 Hz.
Table 4.2 shows the objective measures used in the analysis of the differentscenarios. A short description of the different objective measures:Lateral Position: The distance from the road’s center to the center of the ve-
hicle’s front axle (r). However, the following derived measures were used inthe analysis; mean distance between the left front wheel and center of theleft lane marker (rl) and the mean distance between the right front wheeland the center of the right lane marker (rr). See figure 4.2 for an illustrationof the lateral position measures.
SDLP: Standard deviation of the lateral position. A measure of the vehicle’sswerving.
Speed: Mean speed of the subject’s vehicle during a drive.
SDS: Standard deviation of speed. A measure of the variability of the vehicle’sspeed.
Distance Between Cars: The distance between the center point of the subject’svehicle front to the center point of the rear end of the lead vehicle.
Distance to Stop Line: The longitudinal distance from the center of the vehi-cle’s front axle to the stop line.
NoCKO: Number of Cones Knocked Over.

26 Experiment - Method
r = 0r = 3.15 r = -3.15
r
rrrl
rl < 0rr > 0
rl > 0 rr < 0
Figure 4.2: The Lateral position measure. The figure shows a schematic sketchof a road with a vehicle driving in the right lane (upwards = forward). r = themeasured lateral position, rl = distance between left wheel pair and the road’scenter line, rr = distance between right wheel pair and the road’s right lanemarkers. rl and rr is the measures used to present the results of the lateralposition scenario in chapter 5.
Time To Collision
Time to collision (TTC) is the time to a collision with a lead vehicle. TTC ismeasured in seconds and is calculated as:
Ttc(t) = d(t)vlead(t) − vfv(t) (4.1)
where d(t) is the distance between the lead vehicles rear end and the followingvehicles front end, vlead(t) is the velocity of the lead vehicle and vfv(t) is thevelocity of the following vehicle, all at the time t.
The TTC measure is analyzed through the mean of minimums of the absolutevalue of TTC (mmTTC).

4.5 Measures 27
ScenariosMeasure Unit LP SE CF CS DLCLateral position m XSDLP m XSpeed km/h XSDS km/h XDistance between cars m XDistance to stop line m XNoCKO 1 XTTC s XTHWY s X
Table 4.2: Measures that were used in the different scenarios (LP=LateralPositioning, SE=Speed Estimation, CF=Car Following, CS=Controlled Stop,DLC=Double Lane Change).
Time Headway
Time headway (THWY) is a measure that represents the time gap to a lead vehicle.THWY is measured in seconds and is calculated as:
Thwy(t) = d(t)vfv(t) (4.2)
d(t) and vfv(t) same as for TTC.THWY is used in two different ways:
Mean THWY: Reflects the safety margin to the lead vehicle and is a part ofthe subject’s car following strategy[9].
Minimum THWY: If the minimum THWY is below 1 s there is a high risk ofa collision [10].
4.5.2 Subjective Measures
The subjective measures of the experiment consisted of three questionnaires. Thepurpose of the questionnaires was to evaluate the experienced workload, simulatorsickness and the realism of the simulators. All questionnaires except the workloadand SSQ questionnaire was taken from [3].
Workload
The workload questionnaire was used as a tool to evaluate the perceived work-load of a scenario. A workload questionnaire was filled after every scenario. Thequestionnaire can be seen in appendix A.0.2.

28 Experiment - Method
Simulator Sickness
Two simulator sickness questionnaires was used in the experiment. A simulatorsickness screening questionnaire was used before the simulator drive to see if theparticipant are easily affected by simulator sickness, see appendix A.0.3. A simu-lator sickness symptom questionnaire (SSQ) was answered pre- and post-drive todetect simulator sickness[11], see appendix A.0.4.
Simulator Realism
This questionnaire was used to measure the perceived realism of the simulators.The simulator realism questionnaire can be found in appendix A.0.5.
4.6 Data AnalysisIn this section the data handling and analysis is presented. Section 4.6.1 presentsthe statistical analysis of both subjective and objective measures. In section 4.6.2the procedure of the data extraction is explained.
4.6.1 Statistical AnalysisThe objective data, collected during the simulator drives, were assumed to havethe properties to be tested with a one-way ANOVA [12]. The assumed propertiesare:
• The observed data is normally distributed.
• The groups have the same variance.
• Observations are mutually independent.
The statistical analysis of the objective data was conducted in Matlab versionr2009b.
The subjective data, supplied by the workload and realism questionnaires, wasordinal data and thus analyzed with a non-parametric Mann-Whitney test. Thescalar SSQ data was analyzed with a one-way ANOVA. SPSS version 16 was usedfor the analysis of the subjective data.
All analyzes were performed at 5% significance level. Trends were looked at10% significance.
4.6.2 Data ExtractionDuring the scenarios the drivers were instructed to inform the test leader whenhe/she complied with an instruction. When the driver informed the test leaderthat he/she had e.g. the right speed or right position; the test leader set a datamarker with a button in the GUI application to mark the start of a data interval.Just before a new instruction was given to the driver, the test leader set another

4.6 Data Analysis 29
3000 4000 5000 6000 7000 8000
−3
−2.5
−2
−1.5
−1[m
]
Sample No.
Figure 4.3: Lateral positioning raw data and data markers (vertical lines). Betweenthe data markers (first and second, third and fourth, etc) the data analyzed isfound. On the y-axis; the lateral position where the center of the road = 0 andcenter of right lane markers = -3.15.
data marker to mark the end of the data interval. The intervals between the datamarkers was used to extract data for the statistical analysis.
Figures 4.3 and 4.4 shows examples of raw data for one drive from the lateralpositioning and the speed estimation scenarios. The data markers can be seen asdouble vertical lines in the figures.

30 Experiment - Method
1000 1500 2000 2500 3000 3500 4000 4500 5000 5500 6000 65000
10
20
30
40
50
60
70
80
90
Sample No.
[km
/h]
Figure 4.4: Speed estimation raw data and data markers. Between the data mark-ers (first and second, third and fourth, etc) the analyzed data is found. Vehiclespeed on the y-axis.

Chapter 5
Experiment - Results
The results from the simulator experiment and statistical analysis is presented inthis chapter. The results from the scenarios is presented separately and in anconcise manner, further discussion on the results can be found in chapter 6.
5.1 Objective MeasuresThe results of the analysis are presented in the form of box plots. The edges ofthe boxes marks the 25th and 75th percentile, the whiskers in the plots extendsto the extreme values that is not considered outliers. Outliers are marked with aplus sign. The notches in the box plots marks a 95% confidence interval for themedian of a group. See figure 5.1 for an example. In all the box plots’ the notchesextend past at least one of the percentiles, this is a result of a small sample size[13].
Simulator 3 VTI−F
40
45
50
55
60
65
[km
/h]
75th percentile
Mean
25th percentile
Min. value
Max. value
Med
ian
conf
iden
ce in
terv
al (
95%
)
Med
ian
conf
iden
ce in
terv
al (
95%
)
Figure 5.1: Box plot explanation.
31

32 Experiment - Results
5.1.1 Lateral PositioningThe lateral position is presented using the rl and rr measures as defined in 5.1. Azero value in the plot means that the wheel’s center line coincides with the lanemarker’s center line. If the measure is negative the wheel’s center line is on theleft side of the marking’s center line. A positive value means that the wheel is onthe right side of the lane marker, see figure 4.2. Left and right is defined relativethe direction of travel.
The drivers of Simulator 3 succeeded significantly better to keep the car’s leftwheel pair on the road’s center line than the VTI-F simulator drivers (p < 0.05).Simulator 3 group mean deviation was 12 cm to the left of the center line markingsand the VTI-F simulator group mean is -47 cm. There was a also a significantdifference for the SDLP between the groups when driving on the center line (p <0.05). Mean SDLP is 6 cm for the Simulator 3 group and 10 cm for the VTI-Fsimulator group.
No significant differences between the groups, in either of the measures, couldbe found when driving on the right side lane markers.
The descriptive data for lateral positioning scenario data can be seen in figure5.2 and 5.3.
Simulator 3 VTI−F
−1
−0.8
−0.6
−0.4
−0.2
0
0.2
0.4
0.6
[m]
(a)
Simulator 3 VTI−F
−1
−0.8
−0.6
−0.4
−0.2
0
0.2
0.4
0.6
[m]
(b)
Figure 5.2: Lateral positioning scenario, lateral position: rl, driving with left wheelpair positioned on the road’s center line (a). rr, driving with right wheel pair onthe right lane marking (b).
5.1.2 Speed EstimationIn the speed estimation scenario both groups succeeded well in estimating 50 km/h,the means of the groups was very accurate. The group means is 51 km/h for theSimulator 3 group and 50 km/h for the VTI-F group.
In estimating 70 km/h the means of the two groups is both just under 67km/h. When estimating 90 km/h the two groups both misjudged the speed about10 km/h to slow. See figure 5.4 for the ANOVA plots of the speed.

5.1 Objective Measures 33
Simulator 3 VTI−F
0.04
0.05
0.06
0.07
0.08
0.09
0.1
0.11
0.12
0.13
[m]
(a)
Simulator 3 VTI−F
0.04
0.05
0.06
0.07
0.08
0.09
0.1
0.11
0.12
0.13
[m]
(b)
Figure 5.3: Lateral positioning, SDLP: Driving with left wheel pair positioned onthe road’s center line (a). Driving with right wheel pair on the right lane marker(b).
The descriptive data plots of the SDS measure, figure 5.5, shows that thedrivers held their estimated speed fairly well during the speed estimations. Thegroup means is within about 1-2.5 km/h for all speed estimations.
No significant differences between the groups could be found in either speed orSDS. However, a trend could be found for the SDS measure when the drivers triedto estimate 90 km/h (p < 0.10), the VTI-F group had lower SDS group mean andless in-group variation than the Simulator 3 group.
5.1.3 Car Following
Figure 5.6 shows the descriptive data for minimum and mean THWY. The groupmean for mean and minimum THWY was 2.6 s respectively 1.6 s for the Simulator3 group, and 2.0 s respectively 1.4 s for the VTI-F group.
Figure 5.7 shows the mean of minimums of TTC (mmTTC). The group meansof the mmTTC was approximately 100 s. The range was quite large for bothgroups, about 100 s for the Simulator 3 group and about 150 s for the VTI-Fgroup.
No significant differences or trends could be found in either of minimum THWY,mean THWY or mmTTC.
5.1.4 Controlled Stop
The results from the controlled stop scenario can be viewed in figure 5.8. Themeans of the groups is 4.8 m for the Simulator 3 group, and 5.2 m for the VTI-Fgroup.
No significant difference or trend in the distance to the stop line could be found.

34 Experiment - Results
5.1.5 Double Lane ChangeThe results from the double lane change scenario can be seen in figure 5.9. Thefigure shows the group means of the averaged cone track passage. Average NoCKOwas 7.8 for the Simulator 3 group and 7 for the VTI-F group.
No significant or tentative difference between the groups could be established.

5.1 Objective Measures 35
Simulator 3 VTI−F
40
45
50
55
60
65
[km
/h]
(a) Estimated 50 km/h
Simulator 3 VTI−F
50
55
60
65
70
75
80
85
90
95
[km
/h]
(b) Estimated 70 km/h
Simulator 3 VTI−F
65
70
75
80
85
90
95
100
105
[km
/h]
(c) Estimated 90 km/h
Figure 5.4: Speed estimation, speed.

36 Experiment - Results
Simulator 3 VTI−F0
0.5
1
1.5
2
2.5
3
3.5
4
4.5
5
[km
/h]
(a) Estimated 50 km/h
Simulator 3 VTI−F0
0.5
1
1.5
2
2.5
3
3.5
4
4.5
5
[km
/h]
(b) Estimated 70 km/h
Simulator 3 VTI−F0
0.5
1
1.5
2
2.5
3
3.5
4
4.5
5
[km
/h]
(c) Estimated 90 km/h
Figure 5.5: Speed estimation, SDS.

5.1 Objective Measures 37
Simulator 3 VTI−F
0.5
1
1.5
2
2.5
3
3.5
[s]
(a)
Simulator 3 VTI−F
0.5
1
1.5
2
2.5
3
3.5
[s]
(b)
Figure 5.6: Car following: Mean THWY (a), minimum THWY (b).
Simulator 3 VTI−F20
40
60
80
100
120
140
160
180
200
220
[s]
Figure 5.7: Car following: TTC, mean of minimums.

38 Experiment - Results
Simulator 3 VTI−F
−9
−8
−7
−6
−5
−4
−3
−2
[m]
Figure 5.8: Controlled stop, distance to stop line.
Simulator 3 VTI−F
4
5
6
7
8
9
10
NoK
OC
Figure 5.9: Double lane change, number of knocked over cones.

5.2 Subjective Measures 39
5.2 Subjective Measures5.2.1 Simulator SicknessNo significant differences could be found between the pre-drive and post-drivesimulator sickness measures for the VTI-F drives.
Almost all measures in the Simulator 3 group at least doubled from pre- topost-drive, but the standard deviations was large. The only significant differencefound was that the disorientation SSQ score was higher post-drive for the Simulator3 drivers. Furthermore, there was a tentative difference in the total SSQ score.It can be noted that the mean total SSQ score was almost 40 post-drive, whichmeans that the Simulator 3 drivers were really affected. There was one subject inthe VTI-F group who had a SSQ total > 20 pre-drive and two in the Simulator 3group.
See figure 5.10 for a diagram of the SSQ measures.
5.2.2 WorkloadIn the workload questionnaire one significant difference could be found and thatwas for the effort measure in the controlled stop scenario. All other measures werequite similar.
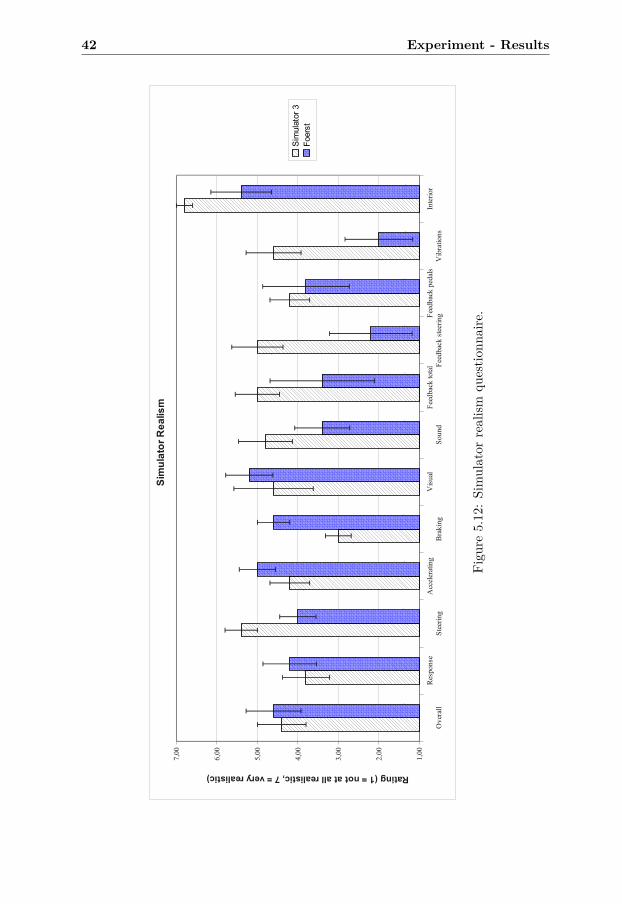
5.2.3 Simulator RealismIn the realism questionnaire a significant difference was found in the answers ofthe braking realism questions. Three tentative differences could be found in theanswers of the steering, feedback steering and vibration realism questions. As canbe seen in figure 5.12; the Simulator 3 group scored steering, feedback steeringand vibrations realism higher, and braking realism lower than the VTI-F group.

40 Experiment - Results
Nausea Oculomotor Disorientation Total0,00
10,00
20,00
30,00
40,00
50,00
60,00
70,00
SSQ Simulator 3
Pre-drivePost-drive
(a)
Nausea Oculomotor Disorientation Total0,00
10,00
20,00
30,00
40,00
50,00
60,00
70,00
SSQ VTI-F
Pre-drivePost-drive
(b)
Figure 5.10: Simulator SSQ results. VTI-F simulator (a), Simulator 3 (b).

5.2 Subjective Measures 41
Difficulty Performance Effort1,00
2,00
3,00
4,00
5,00
6,00
7,00
Lateral positioning
Simulator 3VTI-F
Su
bje
ctiv
e ra
tin
g (
1 to
7)
(a)
Difficulty Performance Effort1,00
2,00
3,00
4,00
5,00
6,00
7,00
Speed estimation
Simulator 3VTI-F
Su
bje
ctiv
e ra
tin
g (
1 to
7)
(b)
Difficulty Performance Effort1,00
2,00
3,00
4,00
5,00
6,00
7,00
Car following
Simulator 3VTI-F
Su
bje
ctiv
e ra
tin
g (
1 to
7)
(c)
Difficulty Performance Effort1,00
2,00
3,00
4,00
5,00
6,00
7,00
Controlled stop
Simulator 3VTI-F
Su
bje
cti
ve
ra
tin
g (
1 t
o 7
)
(d)
Difficulty Performance Effort1,00
2,00
3,00
4,00
5,00
6,00
7,00
Double lane change
Simulator 3VTI-F
Su
bje
cti
ve
ra
tin
g (
1 t
o 7
)
(e)
Figure 5.11: Workload questionnaire results.
42 Experiment - Results
Ove
rall
Res
pons
eS
teer
ing
Acc
eler
atin
gB
raki
ngV
isua
lS
ound
Fee
dbac
k to
tal F
eedb
ack
stee
ringF
eedb
ack
peda
lsV
ibra
tions
Inte
rior
1,00
2,00
3,00
4,00
5,00
6,00
7,00
Sim
ula
tor
Re
alis
m
Sim
ulat
or 3
Foe
rst
Rating (1 = not at all realistic, 7 = very realistic)
Figu
re5.12:Simulator
realism
questio
nnaire.

Chapter 6
Discussion
This chapter provides a discussion about the results presented in chapter 3 andchapter 5. The VTI-F simulator, that is the result from the integration of theFoerst Trainer simulator hardware and the VTI simulation software, is discussedin section 6.1. The experiment is discussed in section 6.2. Suggestions for furtherdevelopment and future work is presented in section 6.3.
6.1 System Integration and Software DevelopmentThe VTI-F simulator’s overall performance during the experiments was good, andthis was confirmed by the experiment results. The software performance is eval-uated implicitly by the subjective measures collected during the experiments, es-pecially the simulator realism questionnaire. The realism questionnaire providesinformation about the drivers’ perception of the VTI-F simulator performance (see6.2).
6.1.1 Simulator DevelopmentThe resulting simulator system performed satisfactorily but there are refinementsthat can be made:
• The steering wheel feeling of the VTI-F simulator was rough when the TARPwas relaying data between the simulator and the VTI simulation kernel. Thislack of smoothness was irregular in that it appeared with different intensitiesevery time the simulator was started, however, the intensity was constantuntil the simulator and the TARP was restarted. The suspected cause of thisproblem was the timer used in the TARP for sending output to the simulatorkernel. This suspicion is based on the fact that a WM_TIMER window messageis non-deterministic and is not really suitable for a system with real-timedemands [7]. The timer resolution may also be to low. Setting the timer inthe TARP to 15 ms seemed to minimize the unsmoothness of the steeringwheel. This problem should be further investigated.
43

44 Discussion
• When the VTI simulation software was executed with the VTI-F simula-tor hardware there was no vehicle cabin (virtual or real) to act as a visualreference of the vehicles outer dimensions. In Simulator 3 there is an realvehicle cabin, and in the Foerst Trainer simulator, when running the Foerstsimulation software, there is a software rendered, virtual cabin shown on themonitors (see figure 2.2). Despite the absence of a visual cabin reference;the VTI-F simulator group did not perform significantly different from theSimulator 3 drivers in almost all of the scenarios where this might be con-sidered a problem. The exception was in the lateral positioning scenario,when positioning the car’s left wheel pair on the road’s center line. See 6.2for further discussion on the experiment results.
• Another imperfection related to the lack of a vehicle cabin was that therewas no rear view mirrors. As described in chapter 2 the Simulator 3 havesmall monitors installed in the rear view mirrors of the vehicle cabin. TheFoerst Trainer simulator solves this by rendering rear view mirrors on themonitors. The impact on the results from the lack of rear view mirrors isunclear: No rear view mirrors was explicitly needed in any scenarios, butthe realism of the VTI-F simulator is negatively affected.
6.1.2 Experiment PreparationsThe software implementation for the experiments was satisfactory. The Demo2008scenario module provided an excellent environment for the scenarios, with excep-tion for the controlled stop scenario which had to be run twice to get sufficientamount of data.
6.2 ExperimentThe experiment’s results showed few differences between the two simulators. Thisshows that the integration was successful and the VTI-F simulator’s performancewas satisfactory. However, the results from the experiment suffer from two weak-nesses:
1. The number of participants were low. This contributes to a lack of power ofthe statistical analysis.
2. The scenarios and/or measures might have been too trivial. This couldobscure possible differences between the simulators which could be revealedduring more advanced scenarios. In other words: The lack of differencesbetween the simulators does not necessarily mean that there does not existany.
3. The data markers was set manually during the experiment with the effectthat all data intervals had different length. All data was averaged before thestatistical analysis so no data had more weight because of the sample length,however, the means will carry a unknown error.

6.2 Experiment 45
In the following sections the results of the scenarios and subjective measuresare discussed.
6.2.1 ScenariosLateral Positioning
In this scenario the only significant differences found was that when the drivers wasasked to position the car’s left wheel pair on the road’s center line. The differencewas both in lateral position and SDLP. Mean lateral position for the Simulator3 group was significantly closer the road center line than what was found for theVTI-F group. Furthermore the Simulator 3 group’s swerving was significantlysmaller. This might be a result of, in no particular order:
1. Simulator 3 had an more realistic car cabin than the VTI-F simulator.
2. The Simulator 3 drivers got motion feedback from the Simulator 3’s motionsystem, while the VTI-F simulator drivers did not get motion feedback.
3. The Simulator 3 drivers utilized the rear view mirrors to position the car.The VTI-F drivers had no rear view mirrors.
Items 1 and 2 are both related to simulator realism. A more realistic simulatorshould enable the drivers to utilize past real driving experience in a more naturalway than a less realistic simulator. The car body in Simulator 3 could also havebeen a visual reference when positioning the car. Furthermore, the steering wasperceived as more realistic by the Simulator 3 drivers.
Item 3 allows the Simulator 3 drivers to use the rear view mirrors when aligningthe car with the road markers. If it ever happened is however uncertain, noexplicit questions about the rear view mirrors was asked, and only one driver(VTI-F driver) comment were received1. If the rear view mirrors were used itcould explain the significantly smaller SDLP and the better lateral position, butit would also been seen on the right lane markers drive, which it was not.
None of the explanations, items 1-3 can alone explain how the center line driveresults are significantly different for the two groups. Thus, this should be furtherinvestigated with more participants and possibly additional measures.
Speed Estimation
The two groups both had very similar results in the speed estimation scenario andno significant differences could be found at the 0.05 level. A trend (p < 0.10) couldbe found in the SDS measure at the estimation of 90 km/h.
The accurate values at the 50 km/h and 70 km/h speed estimates could beexplained with the manual gear box. An approach that could have been usedfor estimating 50 km/h is: Drive at third gear with medium RPM, alternatively:
1The comment was received on the 12th question of the realism questionnaire: “Was theinternal environment (car body) realistic?” Comment: “No A-pillars, no rear view mirrors, etc[translated from Swedish]”.

46 Discussion
Drive at fourth gear with low RPM. Same algorithms could be used for estimating70 km/h but with one gear higher.
When driving at 90 km/h the drivers estimates was about 10 km/h to low.This might be explained with that there are no easy way to tell when one drivesat 90 km/h since it’s a speed that is suited for fifth gear at medium-high engineRPM.
There is no obvious explanations of the trend found in the SDS measure. Ascan be seen in figure 5.5 there is no clear pattern in how the SDS extreme valuerange changes for the different speed estimates for the two groups. The mean isquite steady over the different speed estimates for the VTI-F group, and morevariating for the Simulator 3 group.
The trend could be an effect of low number of participants. A driver that variesthe speed a lot have a large impact on the analysis. A moment of unconcentrationof one of the Simulator 3 drivers, coincidental with the VTI-F simulator group’sgood performance, might very well be the explanation of the trend. The outlierin 5.5b gives further support to this explanation. However, further investigationwith more participants is needed before a conclusion can be drawn.
Car Following
The car following scenario did not show any significant differences between thetwo groups in any of the used measures.
Minimum and mean THWY does not differ much, about 1 s difference for theSimulator 3 group and even less for the VTI-F group. The car following strategy(mean THWY) was a distance of approximately 2.0 s for the VTI-F group and 2.5s for the Simulator 3 group. When the distance decreased to around 1.5 s it wasconsidered unsafe (minimum THWY) by both groups. In [10] a cautious driver isdefined as a driver “who usually follows at 2 s time headway” and a risky driver“has a normal following headway of less than 1 s”. Using these definitions bothgroups perceived the “close but safe” distance well.
The interpretation of the results of this scenario is difficult because of the leadcar’s variating speed. The interpretation would have been easier if the lead carhad held an constant speed [9]. The thought behind this scenario was to have away of measuring the visual impression in the simulation in relation to an movingobject. A better scenario setup might have been a constant lead vehicle speedand the instrumentation turned off, and keeping the distance with visual referenceonly, as in the speed estimation scenario.
Controlled Stop
No significant differences, or trends, between the two groups were found in thecontrolled stop scenario. It was surprising that the drivers of both groups stoppedat the relatively long distance of 5 m from the stop line. This might be a resultof driver uncertainty because of the instruction: “Stop at the stop sign!” It ispossible that the measured value does not represents the drivers’ impression ofthe car’s outer dimensions. The measured value might be the drivers’ notion of acorrect stopping distance, the drivers’ interpretation of what were asked of them,

6.2 Experiment 47
or something else. If the instructions were clarified to: “Stop with the cars frontat the stop line!”, the correct measure would be obtained.
Dual Lane Change
No significant or tentative difference was found in this scenario. One would thinkthat the Simulator 3 group would do better in this scenario than the VTI-F group,considering that the motion system should provide a better control and betterfeeling of the vehicle dynamics. The motion of the Simulator 3 might also havebeen a disadvantage in this scenario, considering that it is rather forceful andmight disturb the drivers if they are unfamiliar with such maneuvers. The VTI-Fsimulator drivers did not have a motion system so the vehicle dynamics feelingis surely lower, but on the other hand, no forceful motions were applied. Theadvantages and disadvantages of the two simulators may equalize the results ofthe NoCKO measure.
The NoCKO measure used was probably too simple to accurately evaluate thisscenario. For example, reduced speed through the cone track would have a greatimpact on the result. The results would gain strength from using more measures,such as velocities and/or accelerations at different parts of the cone track, e.g. atthe turns, and at the entrance and the exit of the cone track.
In the Simulator 3 group the two drivers that was most affected by simulatorsickness, total SSQ score was 97 and 71 (the third most affected driver had a totalSSQ score of 15), was the two that knocked over most cones in that group. Inthe VTI-F group the NoKOC was rather evenly distributed between the drivers,even though the SSQ scores ranged from approximately 4 to 49. The Simulator3 drivers driving during this scenario might have been affected by the simulatorsickness.
6.2.2 Subjective MeasuresNeither pre- or post-drive SSQ scores had significant or tentative differences be-tween the groups (and the pre-drive scores should not have any differences). Post-drive, all of the Simulator 3 group mean scores are almost double of that of theVTI-F group. The standard deviation of the scores was however quite large so nosignificant change or trends could be found.
In the workload questionnaires; one significant difference between the two sim-ulators could be found. It was in the effort question of the controlled stop. TheSimulator 3 group experienced that a significantly higher effort was required tocomplete the controlled stop scenario than the VTI-F group. This result is re-flected in the realism questionnaire where the Simulator 3 group gave the brakingrealism question a significantly lower score than the VTI-F group. The brakingrealism was commented by all Simulator 3 drivers and the comments were eitherthat there was to little force feedback from the deceleration, or that the car stoppedto fast. In other words: The cue from the motion system was experienced as tosmall in relation to how fast they were stopping.
Apart from the significant difference in braking realism, trends was found in the

48 Discussion
realism of steering, feedback steering and vibrations. The trend in the steering andfeedback steering realism can be explained by the problem with the unsmoothnessin the steering wheel mentioned in 6.1.1. The trend in vibrations score can beexplained by the non-existent vibrations in the VTI-F simulator.
Considering all the realism scores it can be concluded that the two simulators’realism probably were judged by different scales. The VTI-F group was moreliberal in their realism scoring and the Simulator 3 group was more strict.
The results from the realism questionnaire shows that the VTI-F simulatorimplementation was satisfactory. No comments were given on latency or otherdeficiencies than the steering wheel.
6.3 Future WorkIn this section suggestions of improvements of the VTI-F simulator is presented.Suggestions for software and hardware improvements are:
• Investigate the steering wheel problem mentioned in section 6.1.
• Investigate the possibility of integrating rear view mirrors.
• Implement the motion system.
• Improve the sound quality of the simulator. Obtain hardware, or writesoftware, so that it is possible to use the same sounds, e.g. road and windnoise, as the Simulator 3.
• Obtain hardware so that it’s possible to easily switch the hardware configura-tion between the original Foerst Trainer simulator and the VTI-F simulator.
• If possible, reduce the noise of the computers in the room where the VTI-F/Foerst Trainer simulator is located.
To improve on the experiment the following improvements are suggested:
• Larger scale on the experiment with more participants.
• Simplify the car following scenario by using a steady state following situationas suggested in [9].
• Clarify the instructions on the controlled stop scenario.
• Make a more in depth analysis of the dual lane change scenario.

Chapter 7
Conclusions
The integration of the Foerst Trainer simulator and the VTI simulation environ-ment was successfully realized resulting in the VTI-F simulator. However, thereis a need of further improvements if the VTI-F simulator is to be used in research.In the current state it is possible to use the simulator for software developmentand scenario testing. This may release time on VTI’s more advanced simulatorsso that it is possible to increase the simulators’ degree of research utilization.
The performance evaluation was conducted through an experiment consistingof five scenarios. The scenarios were intended to measure the driving performanceand the drivers perceived realism of the VTI-F simulator. The evaluation was con-ducted successfully as a between-group experiment with ten participants dividedin two equally sized groups. One group drove the VTI-F simulator and one groupdrove Simulator 3.
Not many significant differences were found, and the differences that were foundmay not be very reliable. Further evaluation is needed for conclusive results. Evenso, the obtained results shows that the VTI-F simulator performs rather good, atleast at simple driving tasks, when compared to VTI’s Simulator 3.
49


Bibliography
[1] Jonas Jansson, Pontus Matstroms, Staffan Nordmark, and Håkan Sehammar.Förutsättningar för en avancerad körsimulator i göteborg. Technical report,VTI, 2008.
[2] Papelis Y., Ahmad O., and Watson G. Driving simulation scenario definitionbased on performance measures, 2005. Driving Simulation Conference-NorthAmerica 2005.
[3] Björn Peters and Mats Lidström. Driving simulator functional validity as-sessment methodology. Technical report, TRAIN-ALL, 2009.
[4] Lena Nilsson. VTI driving simulator : description of a research tool. Technicalreport, VTI, Linköping, 1989.
[5] Albert Kircher. Foerst simulator VTI, 2009. Internal VTI document.
[6] Laban Källgren. VTI vehicle simulator software framework, kernel andproject design, 2009. Internal VTI document.
[7] Microsoft developer network (msdn), November 2009.http://msdn.microsoft.com/.
[8] Passenger cars - test track for severe lane-change manoeuvre. part 1: Doublelane-change, 1999. ISO Standard No. 3888-1.
[9] Joakim Östlund, Björn Peters, Birgitta Thorslund, Gustav Markkula, An-dreas Keinath, Dorit Horst, Susann Juch, Stefan Mattes, and Uli Foehl. Driv-ing performance assessment methods and metrics. Technical report, AIDE,2005.
[10] K. A. Brookhuis, D. DE. Waard, and S. H. Fairclough. Criteria for driverimpairment. Ergonomics, 46(5):433–445, 2003.
[11] R.S. Kennedy, N.E. Lane, K.S. Berbaum, and M.G. Lilienthal. Simulator sick-ness questionnaire: an enhanced method for quantifying simulator sickness.International Journal of Aviation Psychology, 3(3):203–220, 1993.
[12] David J. Weiss. Analysis of Variance and Functional Measurement: A prac-tical guide. Oxford University Press, Incorporated, 2005.
51

52 Bibliography
[13] Matlab documentation. Matlab version R2009b.

Appendix A
Questionnaires
A.0.1 Background Information Questionnaire1. Fill in your age: ___
2. Gender: Male � Female �
3. Do you have a driving licence? Yes � (No �)If yes, what type and when? (fill in the year when granted)__A,__B,__C,__D,__BE,__CE,__DE
4. Are you a professional driver? Yes � No � (go to 7)If yes, what is your profession:
5. Did you receive any vocational driver training? Yes � No �If yes, did it include driving simulator training? Yes � No �
6. Driving experience:a. How much did you drive in the past 12 months? _______ kmb. How much total driving experience do you have? _______ km (sincelicensed)
7. Do you have experience from driving in a simulator? Yes � No �If so, what type of simulator? (indicate all relevant types)� Low-level system (a) (Pc monitor. Car seat. Videogame-like steeringwheel and pedals. No motion system)� Static/semi-dynamic system (b) (Multiscreen. Car seat. Simplemockup with a dashboard. Steering wheel and pedals with simple forcefeedback. No or limited motion)� Fixed driving simulator (c) (Multi- och semi-circular screen. Real ve-hicle. Real steering and pedals with force feedback. No or limited motion)� Dynamic or advanced simulator (d) (Semi-circular or circular screen.
53

54 Questionnaires
Real vehicle. Real steering and pedals with force feedback. Advanced mo-tion platform)� Virtual reality simulator (e) (HMD or CAVE c©simulator)
A.0.2 Workload Questionnaire
Hur lätt eller svår var köruppgiften som du nyss gjorde?Mycketlätt
Mycketsvår
1 2 3 4 5 6 7Hur bra tycker du att det gick?Mycketdåligt
Mycketbra
1 2 3 4 5 6 7Hur ansträngande var köruppgiften?Inteansträn-gandealls
Mycketansträn-gande
1 2 3 4 5 6 7

55
A.0.3 Simulator Sickness Screening Questionnaire
Strongly disagree Strongly agree1 2 3 4 5 6 7 NA
I like to sit in the front rows when I goto the movies.I have no problems reading a book ora map in a car while somebody else isdrivingI like playing computer games.I play computer games with interactivesimulations oftenI feel dizzy or uncomfortable duringplaying interactive computer games.I feel dizzy or uncomfortable when Iwatch somebody else playing interac-tive computer games.I like watching wide screen TVI suffer from sea-sickness/ motion sick-ness? E.g. Airplane, boat, car (back-seat).I am very interested in technology andnew technological developments.I get sick in roller coasters or in otherentertainment machines.I am able to stand in a 180 degree or 360degree angle of view surround cinemadome.In my past, I experienced SimulatorSickness during a simulator drive/fly.

56 Questionnaires
A.0.4 Simulator Sickness Symptom Questionnaire
# Symptom SeverityNone Slight Moderate Severe
1 General discomfort2 Fatigue3 Headache4 Eye strain5 Difficulty focusing6 Salivation increased7 Sweating8 Nausea9 Difficulty concentrating10 ”Fullness of the head”11 Blurred vision12 Dizziness with eyes open13 Dizziness with eyes closed14 *Vertigo15 **Stomach awareness16 Burping* Vertigo is experienced as loss of orientation with respect to vertical upright.** Stomach awareness is usually used to indicate a feeling of discomfort which isjust short of nausea.
A.0.5 Realism QuestionnaireThe questionnaire have several questions where the answer to the questions is givenin a scale from 1-7. For a more compact presentation, the scale and questions hasbeen separated. In the questionnaire the scale can be seen after each question.
Questions
1. How realistic was the drive in the simulator?
2. Where the vehicle responses to your control actions realistic?
3. Was the steering realistic?
4. Was the acceleration realistic?
5. Was the braking realistic?
6. Was the visual impression in the simulator realistic?
7. Was the sound impression in the simulator realistic?
8. Was the force feedback (whole car) sufficiently realistic?

57
9. Was the force feedback in the steering wheel realistic?
10. Was the force feedback in the pedals realistic?
11. Where the vibrations in the car realistic?
12. Was the internal environment (car body) realistic?
13. Was there anything in particular that you missed in the simulator?If yes, please specify:
14. Do you have any suggestions on how the simulation can be made mor real-istic?
Scale
Not at all realistic Rather realistic Very realistic1 2 3 4 5 6 7