erp appendixes my 1949 3
TRANSCRIPT

Appendix CSurveys of Actual and Intended Business Investment
ContentsPage
Business investment as measured in the Nation's Economic Budget . 75Nonfarm plant and equipment outlays 77Equipment orders and construction contracts and permits as measures
of prospective business investment activity 79Business investment surveys by the McGraw-Hill Publishing Co . . 80Business surveys by Dun & Bradstreet 81Other private investment surveys 83
Tables
C-l. Gross private domestic investment and its components,1929-49 76
G-2. Manufacturers' sales and new and unfilled orders in selecteddurable-goods industries, January-May 1948 and 1949 . . 79
C-3. Outlays for new plant and equipment, 1948-53, as estimated byMcGraw-Hill 1948 survey 81
C-4. Percentage changes in actual and expected plant and equip-ment outlays and inventories, 1948—49, as reported in Dun& Bradstreet May survey 82
73
Digitized for FRASER http://fraser.stlouisfed.org/ Federal Reserve Bank of St. Louis

Digitized for FRASER http://fraser.stlouisfed.org/ Federal Reserve Bank of St. Louis
Appendix CSurveys of Actual and Intended Business Investment
The crucial importance of business investment outlays in maintainingeconomic activity and promoting increased productivity is generally recog-nized. In recent years private and public statistical agencies have devotedincreasing effort to determining how much business investment is currentlybeing made and how much is planned.
Several fairly comprehensive reports on investment activity are nowestablished on a periodic basis, in addition to numerous one-time one-indus-try and local surveys. A variety of approaches is justifiable in a field wheremeasurement is at best rough and uncertain and the survey techniques arestill in process of experimental development.
The consensus of recent investment surveys has already been indicatedin those sections of the review referring to business investment. The totallevel of such investment in the first half of 1949 showed a considerabledecline from the 1948 levels, primarily on account of a cessation of inventorygrowth. Plant and equipment outlays exceeded those of the first half of1948. Businessmen reported plans for a somewhat lower rate of outlaysin the second half of 1949 than in the second half of 1948, and informationon their advance commitments in the form of plant construction contractsand equipment orders lends credence to that outlook. The size and dura-tion of the decline, however, are still quite uncertain. There is a substantial"shelf" of contemplated private investment for the next several years,though plans so far ahead cannot be regarded as either firm or complete.
In interpreting investment survey results it is important to be aware ofthe special features of the various approaches and their relations to oneanother. This appendix describes the nature and scope of some of the majorcomprehensive periodic surveys.
Business investment as measured in the Nation's Economic Budget
The expenditures side of the business account of the Nation's EconomicBudget (see appendix table A-3) constitutes that part of the gross na-tional product known as gross private domestic investment. Estimatesof this item are prepared quarterly by the Department of Commerce andare released about 8 weeks after the end of the quarter. Preliminary esti-mates appear somewhat earlier in the first issue of Economic Indicatorsafter the end of the quarter.
75
Digitized for FRASER http://fraser.stlouisfed.org/ Federal Reserve Bank of St. Louis
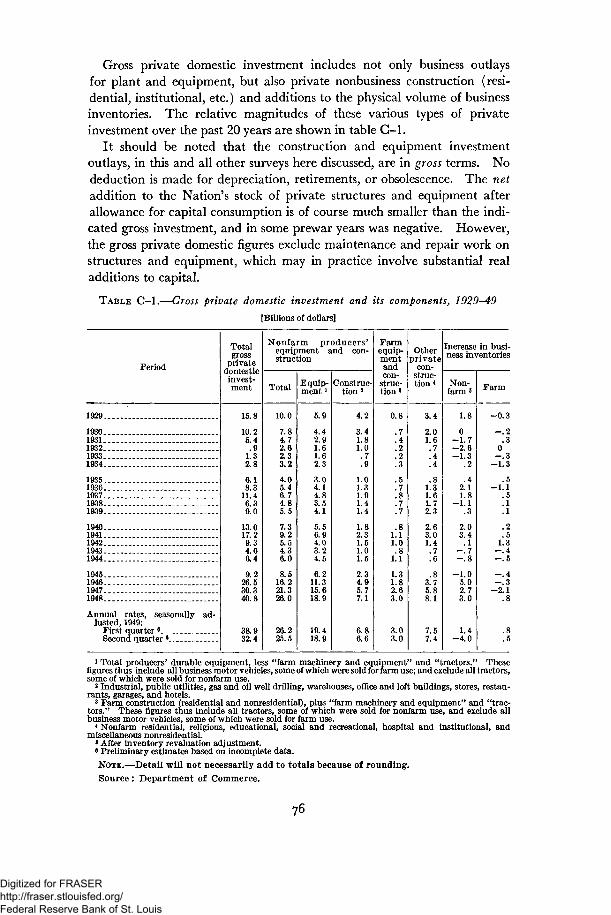
Gross private domestic investment includes not only business outlaysfor plant and equipment, but also private nonbusiness construction (resi-dential, institutional, etc.) and additions to the physical volume of businessinventories. The relative magnitudes of these various types of privateinvestment over the past 20 years are shown in table C-l .
It should be noted that the construction and equipment investmentoutlays, in this and all other surveys here discussed, are in gross terms. Nodeduction is made for depreciation, retirements, or obsolescence. The netaddition to the Nation's stock of private structures and equipment afterallowance for capital consumption is of course much smaller than the indi-cated gross investment, and in some prewar years was negative. However,the gross private domestic figures exclude maintenance and repair work onstructures and equipment, which may in practice involve substantial realadditions to capital.
TABLE G—1.—Gross private domestic investment and its components, 1929-49
[Billions of dollars]
Period
1929
193019311932 . . .19331934
19351936.193719381939_ „
1940. .194119421943.1944
194519461947 _ -1948
Annual rates, seasonally ad-justed, 1949:
First quarter 6
Second quarter 6
Totalgross
privatedomesticinvest-ment
15.8
10.25.4
. 91.32.8
6.18.3
11.46.39.0
13.017.29.34.66.4
9.226.530.340.8
38.932.4
Nonfarm producers'equipment and con-struction
Total
10.0
7.84.72.62.33.2
4.05.46.74.85.5
7.39.25.54.36.0
8.516.221.326.0
26.225.5
Equip-ment 1
5.9
4.42.91.61.62.3
3.04.14.83.54.1
5.56.94.03.24.56.2
11.315.618.9
19.418.9
Construc-tion 2
4.2
3.41.81.0.7.9
1.01.31.91.41.4
1.82.31.51.01.5
2.34.95.77.1
6.86.6
Farmequip-mentandcon-
struc-tions
0.8
.7
.4
. 2
.2
.3
.5
.7
.8
.7
.7
.81.11.0.8
1.1
1.31.82.63.0
3.03.0
Otherprivate
con-struc-tion 4
3.4
2.01.6. 7.4.4
.81.31.61.72.3
2.63.01.4.7.6
.83.75.88.1
7.57.4
Increase in busi-ness inventories
Non-farm 8
1.8
0—1.7-2 .6- 1 . 3
.2
.42.11.8
-1 .1.3
2.03.4
. 1- . 7- . 8
-1 .05.02.73.0
1.4-4 .0
Farm
- 0 . 3
- . 2. 3
0- . 3
—1.3
. 5- 1 . 1
.5
. 1
.1
.2
. 51.3
—.4—.5
- . 4- . 3
- 2 . 1. 8
.8
.5
1 Total producers' durable equipment, less "farm machinery and equipment" and "tractors." Thesefigures thus include all business motor vehicles, some of which were sold for farm use; and exclude all tractors,some of which were sold for nonfarm use.
2 Industrial, public utilities, gas and oil well drilling, warehouses, office and loft buildings, stores, restau-rants, garages, and hotels.
3 Farm construction (residential and nonresidential), plus "farm machinery and equipment" and "trac-tors." These figures thus include all tractors, some of which were sold for nonfarm use, and exclude allbusiness motor vehicles, some of which were sold for farm use.
4 Nonfarm residential, religious, educational, social and recreational, hospital and institutional, andmiscellaneous nonresidential.
6 After inventory revaluation adjustment.«Preliminary estimates based on incomplete data.
NOTE.—Deta i l will not necessarily add to tota ls because of rounding.
Source : Depar tment of Commerce.
Digitized for FRASER http://fraser.stlouisfed.org/ Federal Reserve Bank of St. Louis
The inventory accumulation item, on the other hand, does represent anet accretion of goods in stock—the excess of additions over withdrawalsfor the period. This difference in treatment as between fixed-capital andinventory outlays calls for caution in interpreting the total private invest-ment figures. Another difference is that the fixed-capital outlays representessentially voluntary decisions to invest, whereas inventory accumulationis frequently (as in the first quarter of 1949) involuntary.
The nonfarm inventory figures included in table C-l and in the Nation'sEconomic Budget tabulations are shown after "revaluation adjustment."That is, they show the physical change in stocks (valued at average prices forthe period) rather than the change in book values, which would reflect alsothe change in prices at which stocks were carried on the books. Farminventory changes are estimated directly in terms of changes in physicalquantities valued at average current prices, and are thus comparable with-out revaluation adjustment to the adjusted nonfarm inventory changes.
Nonfarm plant and equipment outlays
The second, third and fourth columns of table C-l show the new con-struction and equipment outlays (i. e., the gross investment in facilities)by nonfarm business, as estimated on the basis of construction contractawards and shipments of equipment and included in the totals of grossprivate domestic investment and the gross national product.
Another approach to measurement of nonfarm plant and equipmentoutlays uses a quarterly questionnaire survey addressed to a sample of non-agricultural business concerns. This survey is a joint undertaking of twoFederal agencies, the Securities and Exchange Commission canvassing mostof the corporations registered with the Commission while the Office of Busi-ness Economics of the Department of Commerce canvasses a sample ofunregistered manufacturing concerns. It is somewhat similar to the officialGovernment survey made annually in Canada, though coverage is muchmore comprehensive in the latter.
The questionnaires are filled out, for the most part, in the middle monthof each quarter; results are jointly released by the two agencies shortly beforethe end of that quarter. Questions cover (1) the expected outlays for newplant and for new equipment during the next quarter; (2) the estimatedoutlays during the current quarter, and (3) the actual outlays during theprevious quarter. For each quarter's outlays there are then three successivereports at 3-month intervals: expected outlays (released a fortnight or sobefore the quarter begins), estimated outlays (released a fortnight or sobefore the quarter ends), and reported past outlays (released about 2^4months after the quarter has ended). The latest available results are shownin appendix table D-15.
Although these surveys cover nearly the same concept of nonfarm plantand equipment as the corresponding gross national product components in
77
Digitized for FRASER http://fraser.stlouisfed.org/ Federal Reserve Bank of St. Louis

the second column of table C-l , above, the correspondence is not exact.The three most important conceptual differences are:
1. The SEG-Commerce survey estimates do not allow for the initialfacilities outlays of firms newly established during the period covered,whereas the GNP items do. This can be a sizable item in periods whenmany new firms are being started, particularly in the manufacturing andtrade fields where the turn-over of firms is relatively rapid.1
2. Outlays charged as current expense are omitted in the SEG-Commercesurveys but covered in the GNP series.
3. The GNP estimates of producers' durable equipment include an allow-ance for automobiles bought by individuals but used wholly or in part forbusiness purposes. Such purchases do not appear in the outlays reportedin the SEG-Commerce surveys.
In addition to the regular questions on investment outlays for the previous,current and next quarters, the SEC-Commerce questionnaire has in recentyears inquired annually as to expected investment and expected sales for awhole calendar year. These questions, last answered in February 1949,showed that nonfarm business as a whole expected virtually the same levelof dollar sales in 1949 as in 1948 and about 5 percent less dollar invest-ment.2
Discrepancies between levels of investment outlay reported in advanceas anticipations and those reported later as actually realized may arisefrom: (1) changes in business plans as to physical volume of facilities ex-pansion and improvement, (2) errors in businessmen's forecasts of the rateat which work will proceed on projects already planned, (3) errors inbusinessmen's forecasts of the cost of projects under way or planned, asconstruction costs and equipment prices change, and (4) the lack of com-plete accuracy and representativeness with which any sample survey mustreckon. It is not yet possible to evaluate each of these bases of discrepancywell enough to make definite adjustments for them in interpreting currentlyreported anticipations, though analysis of accumulated survey data willeventually throw much light on this problem. During the postwar period,actual investment outlays have tended to run moderately higher than antici-pated outlays, particularly in the case of the anticipations for a whole yearin advance. This is probably due in part to the rising trend of constructionand equipment costs through 1948, and in part to the fact that someoutlays only tentatively planned or scheduled for a following period arelikely to be omitted from reported anticipations. It remains to be seenhow these survey biases will operate during a phase of constant or declininglevels of cost and total investment.
1 For further details see Capital Requirements of New Trade Firms, Survey of CurrentBusiness, December 1948.
2 For further details of this survey, see Plant and Equipment Programs and Sales Ex-pectations in 1949, Survey of Current Business, April 1949.
78
Digitized for FRASER http://fraser.stlouisfed.org/ Federal Reserve Bank of St. Louis
Equipment orders and construction contracts and permits as measures ofprospective business investment activity
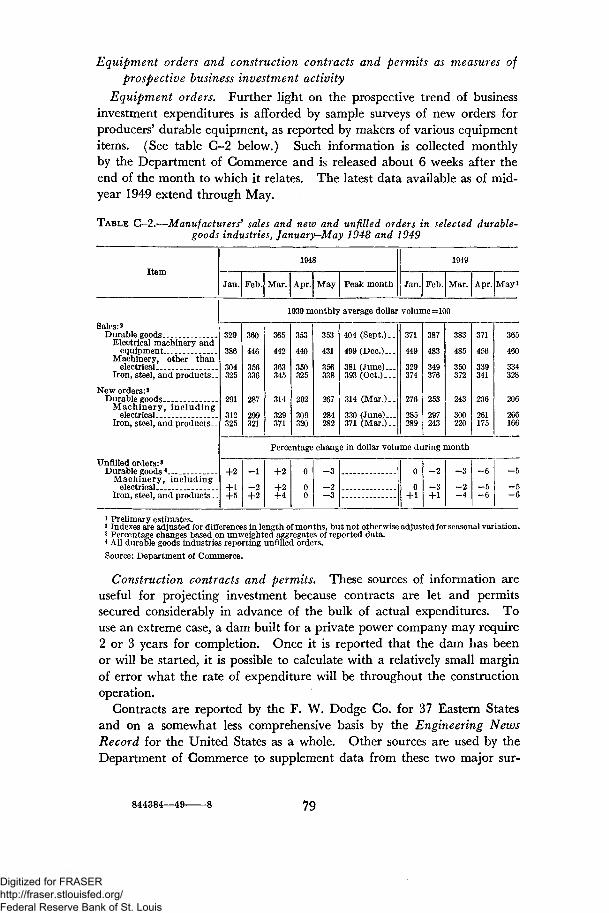
Equipment orders. Further light on the prospective trend of businessinvestment expenditures is afforded by sample surveys of new orders forproducers' durable equipment, as reported by makers of various equipmentitems. (See table C-2 below.) Such information is collected monthlyby the Department of Commerce and is released about 6 weeks after theend of the month to which it relates. The latest data available as of mid-year 1949 extend through May.
TABLE C-2.—Manufacturers3 sales and new and unfilled orders in selected durable-goods industries, January—May 1948 and 1949
Item1948
Jan. Feb. Mar. Apr. May Peak month
1949
Jan. Feb. Mar. Apr. May1
1939 monthly average dollar volume=100
Sales:2
Durable goodsElectrical machinery and
equipmentMachinery, other than
electrical _Iron, steel, and products..
New orders:2
Durable goodsMachinery, including
electricalIron, steel, and products..
Unfilled orders:8Durable goods4
Machinery, includingelectrical __
Iron, steel, and products.-
329
386
304325
291
312325
360
446
356336
287
299321
365
442
363345
314
329371
353
440
350325
292
309320
353
431
356338
267
284282
404 (Sept.)..
499 (Dec.)__.
381 (June) —393 (Oct.).._
314 (Mar.) . .
330 (June)...371 (Mar.). .
276 253
383
485
350372
243
300220
206
365
460
334328
206
266166
Percentage change in dollar volume during month
+2
+2+4
- 3 - 3
- 4
- 5
- 5
1 Prelimary estimates.2 Indexes are adjusted for differences in length of months, but not otherwise adjusted for seasonal variation.3 Percentage changes based on unweighted aggregates of reported data.4 All durable goods industries reporting unfilled orders.
Source: Department of Commerce.
Construction contracts and permits. These sources of information areuseful for projecting investment because contracts are let and permitssecured considerably in advance of the bulk of actual expenditures. Touse an extreme case, a dam built for a private power company may require2 or 3 years for completion. Once it is reported that the dam has beenor will be started, it is possible to calculate with a relatively small marginof error what the rate of expenditure will be throughout the constructionoperation.
Contracts are reported by the F. W. Dodge Co. for 37 Eastern Statesand on a somewhat less comprehensive basis by the Engineering NewsRecord for the United States as a whole. Other sources are used by theDepartment of Commerce to supplement data from these two major sur-
844384—49 79
Digitized for FRASER http://fraser.stlouisfed.org/ Federal Reserve Bank of St. Louis
veys, and adjustments are made for undercoverage and errors in report-ing. The resulting material is then translated into a forecast of nonresi-dential private construction activity 6 to 12 months in advance. The scopeof these estimates is wider than that of the SEG-Commerce survey dis-cussed in the section on nonfarm plant and equipment in this appendix,since it includes private institutional building contracts. Equipment out-lays, however, are not covered.
The Department of Commerce construction expenditures figures as shownin appendix table D-14 are not strictly comparable by categories with theSEG-Gommerce survey figures because of different classification procedure.One series reports according to function, the other according to ownership.If a utility company, for example, lets a contract for a residential or com-mercial structure, the contract series will report that activity as residentialor commercial, while the SEG-Commerce series will report it as utilityinvestment.
Figures for private nonfarm residential construction are derived by theDepartment of Labor principally from reported building permits (adjustedfor lapses, for time lags between permit issuance and start of work, and forunderreporting of permit evaluation), supplemented by sample fieldsurveys in nonpermit-issuing areas.
Projections of rates of residential activity from these sources are made in afashion similar to that for nonresidential construction. These figures arecurrently more reliable than the historical series for 1930 through 1944, be-cause of improvements in sources of data and methods of collection. Thisshould be borne in mind in comparing the current series with the publisheddata for this 15-year period. The series does not include data for housingactivity in the field of conversions or remodeling. In some periods in thebusiness cycle, or during wartime, conversion or remodeling may account fora sizable proportion of the total volume of residential units provided.
The construction forecasts are reliable for one quarter in advance. Theirreliability diminishes beyond that point. The margin of error for the thirdquarter ahead has been as much as 20 percent. The magnitude of the errorwill vary first with any divergence from the assumptions regarding the busi-ness cycle and second with unforeseen changes in the rate of expenditures inthe construction field itself.
Business investment surveys by the McGraw-Hill Publishing Co.
Late in 1948 the economic staff of the McGraw-Hill Publishing Go. con-ducted a sample interview study of larger concerns in the fields of manufac-turing, mining, and transportation. This was combined with similar surveysin the electric and gas utility fields by the Electrical World magazine andthe American Gas Association to yield a set of estimates of total plant andequipment investment plans for business in general (exclusive of farming,trade, and services). The results were released in January 1949.
8o
Digitized for FRASER http://fraser.stlouisfed.org/ Federal Reserve Bank of St. Louis
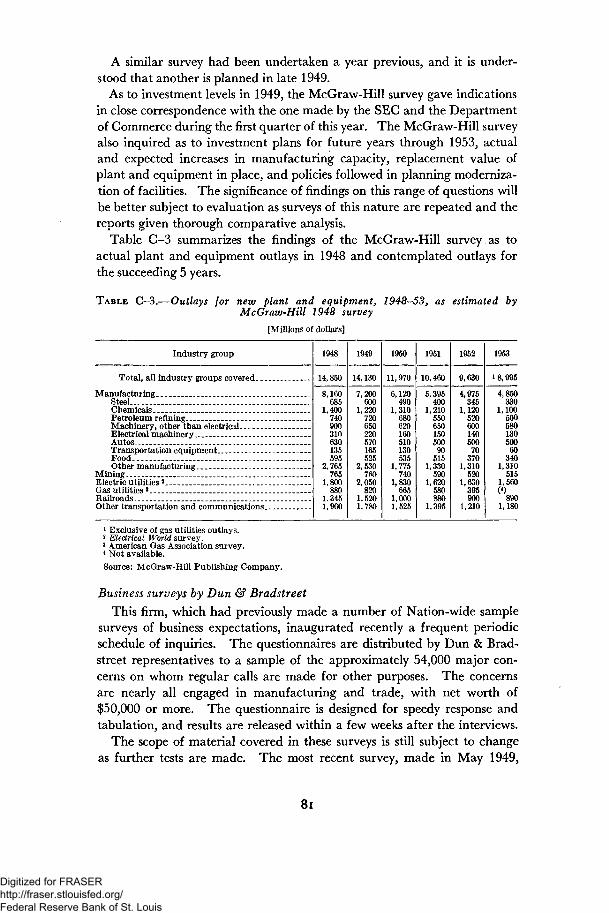
A similar survey had been undertaken a year previous, and it is under-stood that another is planned in late 1949.
As to investment levels in 1949, the McGraw-Hill survey gave indicationsin close correspondence with the one made by the SEC and the Departmentof Commerce during the first quarter of this year. The McGraw-Hill surveyalso inquired as to investment plans for future years through 1953, actualand expected increases in manufacturing capacity, replacement value ofplant and equipment in place, and policies followed in planning moderniza-tion of facilities. The significance of findings on this range of questions willbe better subject to evaluation as surveys of this nature are repeated and thereports given thorough comparative analysis.
Table G-3 summarizes the findings of the McGraw-Hill survey as toactual plant and equipment outlays in 1948 and contemplated outlays forthe succeeding 5 years.
TABLE G-3.—Outlays for new plant and equipment, 1948-53, as estimated byMcGraw-Hill 1948 survey
[Millions of dollars]
Industry group
Total, all industry groups covered
Manufacturing _SteelChemicalsPetroleum refiningMachinery, other than electricalElectrical machinery _ _ _ _ _ _AutosTransportation equipmentFoodOther manufacturing
Mining __ __.Electric utilities2
Gas utilities 3 . . . . . .RailroadsOther transportation and communications
1948
14,850
8,160685
1,400740900310630135595
2,765765
1,800880
1.3451,900
1949
14,130
7,200600
1,220720650220570165525
2,530760
2,050820
1,5201,780
1950
11,970
6,120490
1,310680620160510130535
1,775740
1,830665
1,0001,525
1951
10,460
5,395400
1,21055065015050090
5151,330
5901,620
580880
1,395
1952
9,630
4,975345
1,12052060014050070
3701,310
5201,630
395900
1,210
1953
18,995
4,850330
1,10050058013050060
3401,310
5151,560(*)
8901,180
1 Exclusive of gas utilities outlays.2 Electrical World survey.3 American Gas Association survey.* Not available.
Source: McGraw-Hill Publishing Company.
Business surveys by Dun & Bradstreet
This firm, which had previously made a number of Nation-wide samplesurveys of business expectations, inaugurated recently a frequent periodicschedule of inquiries. The questionnaires are distributed by Dun & Brad-street representatives to a sample of the approximately 54,000 major con-cerns on whom regular calls are made for other purposes. The concernsare nearly all engaged in manufacturing and trade, with net worth of$50,000 or more. The questionnaire is designed for speedy response andtabulation, and results are released within a few weeks after the interviews.
The scope of material covered in these surveys is still subject to changeas further tests are made. The most recent survey, made in May 1949,
8i
Digitized for FRASER http://fraser.stlouisfed.org/ Federal Reserve Bank of St. Louis

included questions on sales, new and unfilled orders, volume of production,plant and equipment outlays, employment, and inventories. For each item,respondents were asked to compare (1) the previous 4 months, (2) thecurrent month, and (3) the next 6 months with the corresponding periodsof last year. In addition to these percentage changes, respondents alsostated their 1948 sales and tangible net worth, and their plant and equip-ment outlays in 1948 and in the second half of that year.
The latest results relating to investment items (plant and equipmentoutlays and inventories) are summarized in table C-4.
TABLE C-4.—Percentage changes in actual and expected plant and equipment out-lays and inventories, 1948—49, as reported in Dun & Bradstreet May survey
All concerns (manu-facturing and trade)
ManufacturingDurable goodsNondurable goods
WholesaleRetail....
All concerns (manu-facturing and trade)
ManufacturingDurable goodsNondurable goods
WholesaleRetail...
Plant and equipment outlays
January-April May July-De-
cember
Inventories'(book value at end ofmonth)
April May December
Median percentage change from period in 1948 to corresponding period in 1949
+0.1
+.4+.6+.1+.2—.1
-0.3
- . 4- . 2- . 80
- . 3
-0.3
- . 6- .4- . 9+.1+.1
-1.4
+.2+2.8-2.6-2.9-3.5
-1.9
-1.1+1.5-3.8-2.3-4.5
-6.4
-5.7-4.9-6.5-6.3
-10.5
Range of percentage changes covered by middle 50 percent of replies
- 5 to +5
- 5 to +6- 5 to +6- 5 to +5-4 to +4- 5 to +4
- 5 to +4
- 5 to +4- 5 to +4- 5 to +4-4 to +4-4 to +4
- 5 to +4
- 6 to +5- 5 to +5- 6 to +4-4 to +4- 4 to +4
-13 to +9
-12 to +14-9 to +7
-16 to +9-14 to +6-14 to +6
-12 to +6
-13 to +9- 8 to +15-16 to +5-12 to +5-15 to +4
-17 to +2
-17 to +3-17 to +3-18 to +2-16 to +2
-18 to 0
Source: Dun & Bradstreet.
In interpreting these results, two technical features of the survey shouldbe taken particularly into account, though it is not yet possible to indicatethe amount of error or bias involved:
1. The tabulated results are unweighted medians and quartiles ofreported percentage changes. Although the degree of coverage ishigher for larger concerns, it does not appear to be sufficiently higher togive their replies a weight corresponding to the relative importance ofsuch concerns in investment outlays. The result is an emphasis on theposition of concerns at the small end of the range covered. However,an opposite bias is presumably introduced by the omission of concernswith net worth less than $50,000.
2. A substantial proportion of concerns presumably reported nochange in plant and equipment outlays because such outlays in both
Digitized for FRASER http://fraser.stlouisfed.org/ Federal Reserve Bank of St. Louis

of the two periods compared were zero or negligible. Inclusion ofthese reports inflates the middle group in the distribution and reducesthe median change in either direction.
Other private investment surveysInterest in current and prospective business investment trends is so
lively that a considerable number of independent surveys have been maderecently, most of them covering only certain lines of business. The greatestsignificance attaches to some of those which are made on a regular periodicbasis, with relatively full coverage, and which inquire as to expected futureinvestment outlays as well as those of the past year. Among those worthyof mention are the surveys conducted by trade associations in the electricpower, gas, and steel industries. In the industries just named (but in fewothers), related capacity estimates are also obtainable.
Digitized for FRASER http://fraser.stlouisfed.org/ Federal Reserve Bank of St. Louis

Digitized for FRASER http://fraser.stlouisfed.org/ Federal Reserve Bank of St. Louis