errata for solidification (second edition,...
TRANSCRIPT

Errata for SOLIDIFICATION(Second Edition, 2016)
J. A. Dantzig and M. Rappaz
September 6, 2017
NomenclatureThere are several minor typographical errors in this table. Please download thecorrected version from http://www.solidification.org, located under “THEBOOK” tab.
Chapter 1: Overview• Page 12, second paragraph after Key Concept 1.4, line 2: “latter two processes”
should be “latter process”
• Page 21, three lines after Eq. (1.5): the definition of r should have a square root.i.e., r = (ξ2 + y2 + z2)1/2
Chapter 2: Thermodynamics• No corrections at this time.
Chapter 3: Phase Diagrams• No corrections at this time.
Chapter 4: Balance Equations• Page 116, just after Eq. (4.7): “indecial” should be “indicial”
1

Chapter 5: Analytical Solutions• Page 169, Eq. (5.26): the second term in the opening curly braces should have a
“+” sign, rather than a “-” sign. The corrected equation reads as follows:φ exp(φ2)
+cps(T∞ − Tf )
Lf√π
exp ([1− αs/α`]φ2)
erfc(φ√αs/α`
) √k`ρ`cp`ksρscps
×{erf (φ) +
√ksρscpskmρmcpm
}=cps(Tf − T0)
Lf√π
=Ste√π
• Pages 170-171, Example 5.1: The error in the previous item continues in thisexample. The equation under the table should read:{
φ exp(φ2)
+ 0.041exp (−0.968φ2)
erfc (1.403φ)
}· {erf (φ) + 1.310} = f(φ) = 1.079
The correct value of φ is 0.636, and Tms = 453◦C. The corrected form of the fourequations at the top of Page 171:
x∗(t) = 1.06× 10⁻²√t
Tm = 453 + 428 erf
(96.7
x√t
)Ts = 453 + 327.5 erf
(60.02
x√t
)T` = 700− 190.5 erfc
(84.17
x√t
)Finally, the graphs shown at the end of the example change slightly as well:
0 0.1 0.2 0.3 0.4 0.5 0.6 0.7φ
-1.5
-1
-0.5
0
0.5
f(φ
) - S
te / π
1/2
-0.06 -0.04 -0.02 0 0.02 0.04 0.06Distance from mold-solid interface [m]
0
100
200
300
400
500
600
700
Tem
pera
ture
[o C]
Graphitemold
Solid Liquid
2

Chapter 6: Numerical Methods• No corrections at this time.
Part II: Microstructure• No corrections at this time.
Chapter 7: Nucleation• No corrections at this time.
Chapter 8: Dendritic Growth• Page 356, Figure 8.22 and the text line just above it: “1.5 K” should be “1.0 K”
(a) Tip radius, Rtip
C0 [Wt% Cu]
∆T = 0.5 K∆T = 1.0 KRtip = 20.34 C0
0.25/∆T 1.25
∆T = 0.5 K∆T = 1.0 Kv* = 49.14 ∆T 2.5/C0
1.5
Rtip
[µm
]
v* [µ
m/s
]
0
100
80
60
40
20
0
104
103
102
101
100
10–11 2 3 4 0 1 2 3 4
C0 [Wt% Cu]
(b) Tip velocity, v*
Fig. 8.22 Values of Rtip and v∗, computed with Eqs. (8.91) and (8.94), for Al-Cu alloysat two undercoolings. The dashed lines represent the approximate forms consideringonly the solute, given in Eqs. (99) and (100), valid at low undercooling for compositionsthat are not too small.
• Page 361, Key Concept 8.13: Equation (8.105) should read as follows:
λ1 =
(72π2Γs`D`(∆T
′0)
2
k0∆T0
)1/4
(v∗)−1/4G−1/2
3
and Equation (8.106) should read:
λ1 =
(72π2Γs`D`∆T0
k0
)1/4
(v∗)−1/4G−1/2
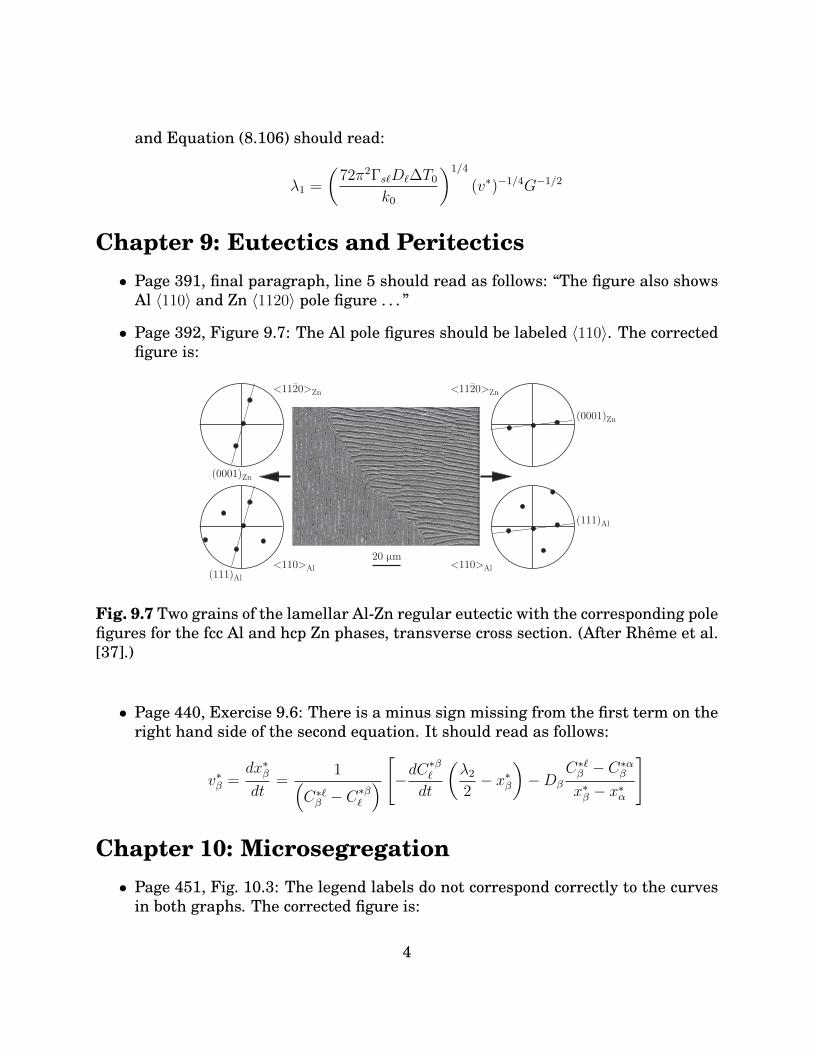
Chapter 9: Eutectics and Peritectics• Page 391, final paragraph, line 5 should read as follows: “The figure also shows
Al 〈110〉 and Zn 〈1120〉 pole figure . . . ”
• Page 392, Figure 9.7: The Al pole figures should be labeled 〈110〉. The correctedfigure is:
<1120>Zn
(0001)Zn
(0001)Zn
(111)Al
(111)Al
<1120>Zn
<110>Al20 mm
<110>Al
Fig. 9.7 Two grains of the lamellar Al-Zn regular eutectic with the corresponding polefigures for the fcc Al and hcp Zn phases, transverse cross section. (After Rheme et al.[37].)
• Page 440, Exercise 9.6: There is a minus sign missing from the first term on theright hand side of the second equation. It should read as follows:
v∗β =dx∗βdt
=1(
C∗`β − C∗β`) [−dC∗β`
dt
(λ22− x∗β
)−Dβ
C∗`β − C∗αβx∗β − x∗α
]
Chapter 10: Microsegregation• Page 451, Fig. 10.3: The legend labels do not correspond correctly to the curves
in both graphs. The corrected figure is:
4

(a) Solid fraction vs. temperature
Lever ruleGulliver-Scheil
Lever ruleGulliver-Scheil
Non-equilibrium eutectic
dT/dt = –5 K min–1
dT/dt = –10 K min–1
Solid fraction gs
Tem
pera
ture
[°C
]
gs(b) Microsegregation profiles
640
620
600
580
560
540
520
10
8
6
4
2
0
33.2
0 0.2 0.4 0.6 0.8 1 0 0.2 0.4 0.6 0.8 1
Cs [w
t% C
u]Fig. 10.3 (a) Computed fraction solid vs. temperature curves for an Al-4.5 wt% Cualloy, using the lever rule and the Gulliver-Scheil equation. The experimental datawere obtained by DTA experiments. [8] (b) The corresponding microsegregation pat-terns for the two solidification models.
• Page 460, Eq. (10.43): There is a minus sign missing from the first term on theright hand side. The equation should read as follows:
(C∗`β − C∗`
) dx∗βdt
= −dC∗`
dt
(λ22− x∗β(t)
)−Dβ
∂Cβ∂x
∣∣∣∣x∗β
Chapter 11: Macro-micro Modeling• No corrections at this time.
Chapter 12: Porosity• No corrections at this time.
Chapter 13: Mechanical Behavior and Hot Tearing• No corrections at this time.
5

Chapter 14: Macrosegregation• Page 670, Figure 14.17: Replace the printed image with the following one, which
has higher resolution.
Fig. 14.17 Snapshots of dendritic structure and composition field obtained from insitu X-ray radiography of an In-75wt%Ga alloy solidified against gravity at −0.01 K/sin a gradient G = 1.1 K/mm (i.e. vT = 9.1 µm/s). [34]
• There are typos in Exercises 14.3, 14.4, 14.5 and 14.8. The corrected problemstatements for these three exercises are as follows:
Exercise 14.3. Mean weight composition in Flemings’ criterion .Using the Gulliver-Scheil microsegregation model and the steady staterelationship between liquid fraction and liquid concentration (Eq. 14.32), showthat the mean composition 〈C〉M during solidification is given by Eq. (14.33):
〈C〉M = C0gk0` (ρ` − ρs) + ρsρs(1− g`) + ρ`g`
(1)
Start from Eq. (14.21), replace v`x by −βvT and integrate the equation know-ing that vT∂/∂x = −∂/∂t under steady state conditions. The mean volumetricconcentration 〈ρC〉 has to be integrated first using the Gulliver-Scheil relation.
Exercise 14.4. Flemings’ criterion with lever rule .
6

Assuming lever rule for microsegregation, show that Flemings’ criterion formacrosegregation (Eqs. (14.19) and (14.22)) becomes:
dg`g`
= − ρ`ρs(1− k0)
(1 + k0
ρsgsρ`g`− v` · ∇T
vT · ∇T
)dC`C`
Exercise 14.5. Flemings’ criterion with lever rule: steady state .Under 1D steady state conditions, for which v` · ∇T = −βvT · ∇T , show thatFlemings’ criterion derived in the previous exercise recovers the lever rule:
C` =C0
g`(1− k0) + k0(2)
Start with Eq. (14.21), then show that the mean weight composition 〈C〉M isgiven by
〈C〉MC0
=ρ`g` + k0ρs(1− g`)
(ρs(1− g`) + ρ`g`)(g`(1− k0) + k0)(3)
or:〈ρC〉C0
=ρ`g` + k0ρs(1− g`)g`(1− k0) + k0
(4)
Compare and discuss this result, illustrated in the figure below with that ob-tained using the Gulliver-Scheil model shown in Fig. 14.8.
0 0.2 0.4 0.6 0.8 1Liquid fraction, g
0.95
0.96
0.97
0.98
0.99
1.00
〈CM〉/C
0
k0 = 0.8
k0 = 0.5
k0 = 0.3
Mean weight composition 〈C〉M normalized with the nominal composition C0 duringsteady state directional solidification as a function of the fraction of liquid g` for thelever rule approximation and three values of the partition coefficient.
Exercise 14.8. Grain movement- and deformation-inducedmacrosegregation .Using the definition of the derivative Ds〈·〉/Dt = ∂〈·〉/∂t + vs · ∇〈·〉defined in Sect. 14.6, derive Eq. (14.44) from the average mass balance (Eq.
7
(14.22)) and the average solute balance (Eq. (14.21)). Under the assumptionρ` = cst, derive Eq. (14.45). Then combine this result with Eq. (14.21) to finallyobtain the various contributions to macrosegregation given in Eq. (14.46).
Index• No corrections at this time.
8