error-aware density-based clustering of imprecise ...07.pdferror-aware density-based clustering of...
TRANSCRIPT

Error-Aware Density-Based Clustering of Imprecise Measurement Values
Dirk Habich, Peter B. VolkWolfgang Lehner
Dresden University of TechnologyDatabase Technology Group
Ralf Dittmann, Clemens UtznyAdvanced Mask Technology Center
Dresden, Germany{ralf.dittmann, clemens.utzny}@amtc-dresden.com
Abstract
Manufacturing process development is under constantpressure to achieve a good yield for stable processes. Thedevelopment of new technologies, especially in the field ofphotomask and semiconductor development, is at its phys-ical limits. In this area, data, e.g. sensor data, has to becollected and analyzed for each process in order to ensureprocess quality. With increasing complexity of manufactur-ing processes, the volume of data that has to be evaluatedrises accordingly. The complexity and data volume exceedsthe possibility of a manual data analysis. At this point, datamining techniques become interesting. The application ofcurrent techniques is complex because most of the data iscaptured with sensor measurement tools. Therefore, everymeasured value contains a specific error. In this paper wepropose an error-aware extension of the density-based al-gorithm DBSCAN. Furthermore, we present some qualitymeasures which could be utilized for further interpretationof the determined clustering results. With this new clusteralgorithm, we can ensure that masks are classified into thecorrect cluster with respect to the measurement errors, thusensuring a more likely correlation between the masks.
1. Introduction
Current technology development is driving measurementtechnology to the border of physics and engineering. Es-pecially in the field of semiconductors and its photolitho-graphic mask production, the race for the smallest struc-tures drives sensor technology to new dimensions. Pho-tolithographic masks are used to imprint the structures onthe wafer for chip production. Chips consist of multiplelayers, and for each layer, a unique mask is needed. Ide-ally, masks are produced exactly once for every chip de-sign. Wafer manufacturers are eager to receive a mask asperfect as possible, since every variance in the structureson the mask is reflected on every chip produced with the
mask. Therefore, wafer manufacturers define the tolerancevalues of the target mask structures for the mask very tight.Current technology specifies a tolerance value of no morethan 2.5% of the actual structure size. With tools being ableto measure with an accuracy of 0.25% of the actual struc-ture size, the difference between specified structure size andmeasured structure size may suffer from an uncertainty ofup to 10% of the tolerance value. The difference of spec-ified and measured size is a major attribute for the qualityof a mask. Mask development always tries to optimize theprocesses against these process quality measures.
Almost every process step for mask manufacturing is in-fluenced by the structures on the mask. Cleaning fluids,for example react differently for masks with only a smallnumber of structures. For processes to settle, chip manu-facturers can produce multiple wafers and tune process pa-rameters with every new wafer until the correct setting hasbeen found for this product. Ideally, a mask shop producesexactly one mask per order that can be shipped to the cus-tomer. Therefore, rules for the determination of manufac-turing parameters must be built on the basis of historicalmasks. To be able to create rules for process parameters,masks with similar behavior must be found and grouped.
In general, clustering is defined as the problem of par-titioning multiple data objects into groups. Objects in thesame group have strong similarities with each other, whileobjects in different clusters bear weaker or no similaritiessat all. This definition requires a well-defined distance mea-sure between data objects that captures intra-cluster simi-larity. Then, clustering becomes the problem of groupingdata objects. With the help of such clustering algorithms,the necessary mask equivalence groups can be found. Theselection of attributes used for clustering is one of the keyfactors for success of the clustering techniques. The num-ber of dimensions for clustering used for mask productioncan fluctuate from only a few to several hundred, dependingon the specific use case. Most of these values are measure-ments from sensors containing a specific uncertainty.
Due to the subsequent use of the clustering results in
important processing steps, the uncertainty included in thedata must be taken into consideration when applying clus-tering algorithms. For this reason, this paper proposes aseamless error-aware extension of the density-based clus-tering technique DBSCAN[3]. Fundamentally, an impor-tant aspect within this area is the definition of a distancemeasure between two uncertain data objects. This defini-tion is usually of complex nature and in general, one singledistance measure is difficult to determine. Therefore, ourapproach creates the opportunity to adjust the used similar-ity for the clustering in a well-defined way. The advantageof this approach is that each application is able to specifya desired similarity measure based on uncertainy. Asidefrom presenting this seamless extension, we propose fur-ther means of quality measures for clusters. These qualitymeasures enable a more detailed insight into uncertain dataand the computed clustering results. Based on one qualitymeasure, we propose an extended clustering algorithm in-cluding a novel similarity measure.
The remainder of the paper is structured as follows: Inthe following section, we give a more detailed specificationof the problem. In Section 3, we present our basic error-aware extension of the density-based clustering algorithmDBSCAN. In Section 4, we propose new quality measuresand present an approach on how they could be efficientlyused for further data analysis. The paper closes with somepreliminary evaluation results in Section 5, an overview ofrelated work in Section 6 and with a conclusion in Section7.
2. Problem Specification
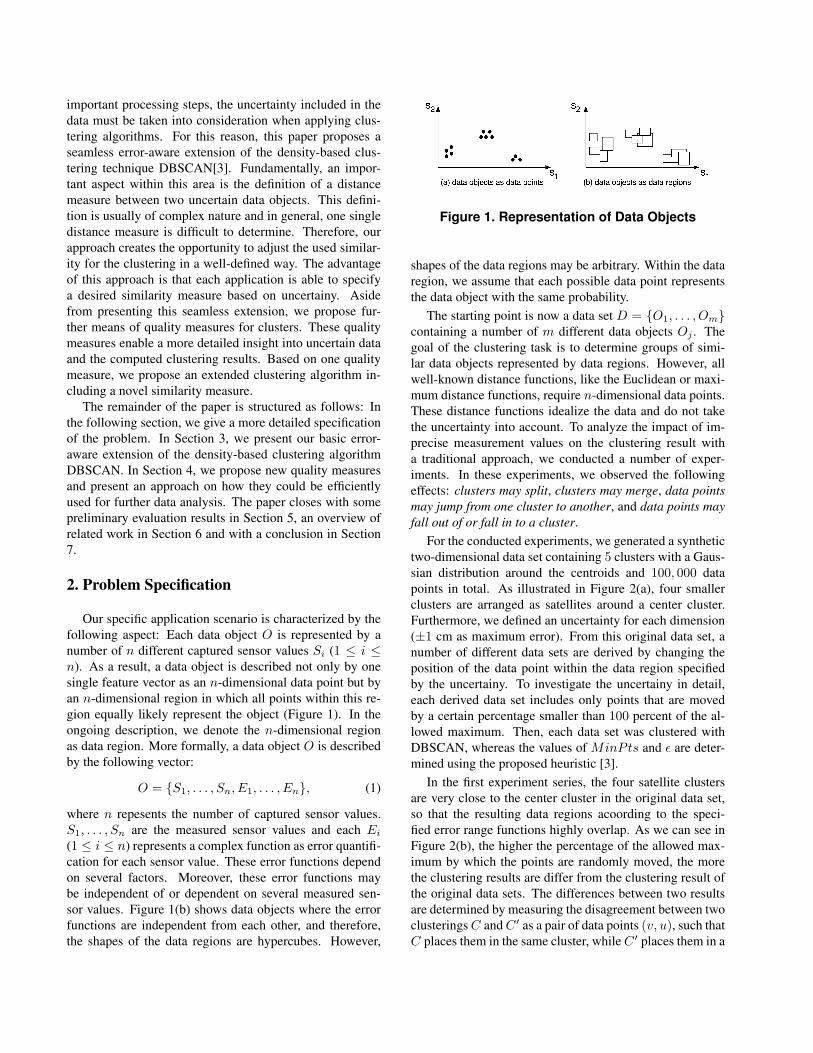
Our specific application scenario is characterized by thefollowing aspect: Each data object O is represented by anumber of n different captured sensor values Si (1 ≤ i ≤n). As a result, a data object is described not only by onesingle feature vector as an n-dimensional data point but byan n-dimensional region in which all points within this re-gion equally likely represent the object (Figure 1). In theongoing description, we denote the n-dimensional regionas data region. More formally, a data object O is describedby the following vector:
O = {S1, . . . , Sn, E1, . . . , En}, (1)
where n repesents the number of captured sensor values.S1, . . . , Sn are the measured sensor values and each Ei(1 ≤ i ≤ n) represents a complex function as error quantifi-cation for each sensor value. These error functions dependon several factors. Moreover, these error functions maybe independent of or dependent on several measured sen-sor values. Figure 1(b) shows data objects where the errorfunctions are independent from each other, and therefore,the shapes of the data regions are hypercubes. However,
Figure 1. Representation of Data Objects
shapes of the data regions may be arbitrary. Within the dataregion, we assume that each possible data point representsthe data object with the same probability.
The starting point is now a data set D = {O1, . . . , Om}containing a number of m different data objects Oj . Thegoal of the clustering task is to determine groups of simi-lar data objects represented by data regions. However, allwell-known distance functions, like the Euclidean or maxi-mum distance functions, require n-dimensional data points.These distance functions idealize the data and do not takethe uncertainty into account. To analyze the impact of im-precise measurement values on the clustering result witha traditional approach, we conducted a number of exper-iments. In these experiments, we observed the followingeffects: clusters may split, clusters may merge, data pointsmay jump from one cluster to another, and data points mayfall out of or fall in to a cluster.
For the conducted experiments, we generated a synthetictwo-dimensional data set containing 5 clusters with a Gaus-sian distribution around the centroids and 100, 000 datapoints in total. As illustrated in Figure 2(a), four smallerclusters are arranged as satellites around a center cluster.Furthermore, we defined an uncertainty for each dimension(±1 cm as maximum error). From this original data set, anumber of different data sets are derived by changing theposition of the data point within the data region specifiedby the uncertainy. To investigate the uncertainy in detail,each derived data set includes only points that are movedby a certain percentage smaller than 100 percent of the al-lowed maximum. Then, each data set was clustered withDBSCAN, whereas the values of MinPts and ε are deter-mined using the proposed heuristic [3].
In the first experiment series, the four satellite clustersare very close to the center cluster in the original data set,so that the resulting data regions acoording to the speci-fied error range functions highly overlap. As we can see inFigure 2(b), the higher the percentage of the allowed max-imum by which the points are randomly moved, the morethe clustering results are differ from the clustering result ofthe original data sets. The differences between two resultsare determined by measuring the disagreement between twoclusteringsC andC ′ as a pair of data points (v, u), such thatC places them in the same cluster, whileC ′ places them in a
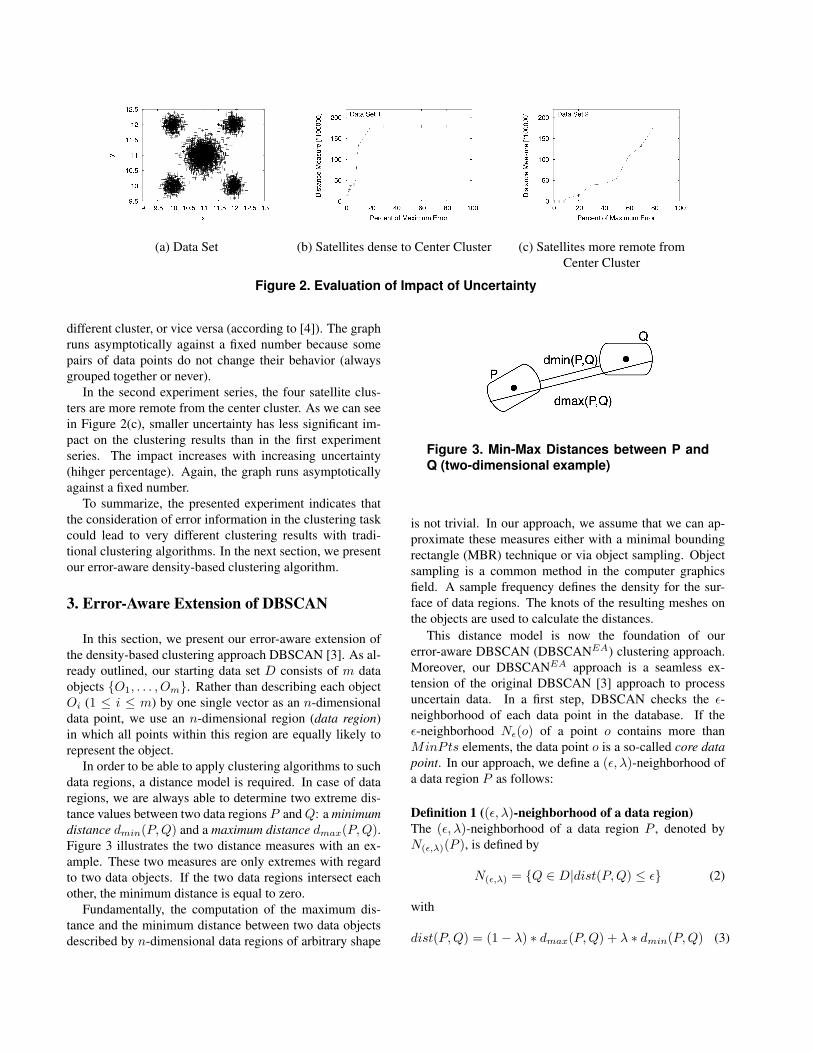
(a) Data Set (b) Satellites dense to Center Cluster (c) Satellites more remote fromCenter Cluster
Figure 2. Evaluation of Impact of Uncertainty
different cluster, or vice versa (according to [4]). The graphruns asymptotically against a fixed number because somepairs of data points do not change their behavior (alwaysgrouped together or never).
In the second experiment series, the four satellite clus-ters are more remote from the center cluster. As we can seein Figure 2(c), smaller uncertainty has less significant im-pact on the clustering results than in the first experimentseries. The impact increases with increasing uncertainty(hihger percentage). Again, the graph runs asymptoticallyagainst a fixed number.
To summarize, the presented experiment indicates thatthe consideration of error information in the clustering taskcould lead to very different clustering results with tradi-tional clustering algorithms. In the next section, we presentour error-aware density-based clustering algorithm.
3. Error-Aware Extension of DBSCAN
In this section, we present our error-aware extension ofthe density-based clustering approach DBSCAN [3]. As al-ready outlined, our starting data set D consists of m dataobjects {O1, . . . , Om}. Rather than describing each objectOi (1 ≤ i ≤ m) by one single vector as an n-dimensionaldata point, we use an n-dimensional region (data region)in which all points within this region are equally likely torepresent the object.
In order to be able to apply clustering algorithms to suchdata regions, a distance model is required. In case of dataregions, we are always able to determine two extreme dis-tance values between two data regions P andQ: a minimumdistance dmin(P,Q) and a maximum distance dmax(P,Q).Figure 3 illustrates the two distance measures with an ex-ample. These two measures are only extremes with regardto two data objects. If the two data regions intersect eachother, the minimum distance is equal to zero.
Fundamentally, the computation of the maximum dis-tance and the minimum distance between two data objectsdescribed by n-dimensional data regions of arbitrary shape
Figure 3. Min-Max Distances between P andQ (two-dimensional example)
is not trivial. In our approach, we assume that we can ap-proximate these measures either with a minimal boundingrectangle (MBR) technique or via object sampling. Objectsampling is a common method in the computer graphicsfield. A sample frequency defines the density for the sur-face of data regions. The knots of the resulting meshes onthe objects are used to calculate the distances.
This distance model is now the foundation of ourerror-aware DBSCAN (DBSCANEA) clustering approach.Moreover, our DBSCANEA approach is a seamless ex-tension of the original DBSCAN [3] approach to processuncertain data. In a first step, DBSCAN checks the ε-neighborhood of each data point in the database. If theε-neighborhood Nε(o) of a point o contains more thanMinPts elements, the data point o is a so-called core datapoint. In our approach, we define a (ε, λ)-neighborhood ofa data region P as follows:
Definition 1 ((ε, λ)-neighborhood of a data region)The (ε, λ)-neighborhood of a data region P , denoted byN(ε,λ)(P ), is defined by
N(ε,λ) = {Q ∈ D|dist(P,Q) ≤ ε} (2)
with
dist(P,Q) = (1− λ) ∗ dmax(P,Q) + λ ∗ dmin(P,Q) (3)

Figure 4. Clustering Results with Different Values for λ
This (ε, λ)-neighborhood definition is of complex na-ture and introduces a novel correlation parameter λ. Dueto our distance model, we have two extreme distance mea-sures dmax(P,Q) and dmin(P,Q) between two data re-gions P and Q. The first measure can be seen as a pes-simistic distance, while the second measure is a very op-timistic distance measure for the similarity of two consid-ered data regions. In general, each value in the range of[distmin(P,Q), distmax(P,Q)] is also a possible similar-ity measure. Therefore, our newly introduced parameter λenables users to specify a correlation factor to be used in thedetermination of the similarity.
Definition 2 (correlation factor λ) The correlation factor,denoted by λ, is defined as {λ ∈ <|0 < λ < 1}. In thisway, a correlation factor of λ = 1 corresponds to a high(optimistic) correlation between two data regions, while acorrelation factor of λ = 0 signifies a low (pessimistic) ap-proach.
The idea behind this correlation factor is to give usersa specialized factor they can easily use to adjust the anal-ysis to their requirements. Furthermore, the complexity ofDBSCANEA is similar to the orginal DBSCAN approach.The remaining definitions for the density-based clusteringare as follows:
Definition 3 (directly density-reachable) A data regionQ is directly density-reachable from a data region P withrespect to ε, λ and MinPts if
1. Q ∈ Nε,λ(P ), and
2. |Nε,λ(P )| > MinPts (core data region condition).
Definition 4 (density-reachable) A data region Q isdensity-reachable from a data region P with respect to ε, λand MinPts if there is a chain of data regions Q1, . . . , Qksuch that Q1 = P and Qk = Q and Qi+1 is directlydensity-reachable from Qi for 1 ≤ i ≤ k.
Definition 5 (density-connected) A data region Q isdensity-connected to a data region P with respect to ε, λand MinPts if there is a data region R such that both Qand P are density-reachable fromR with respect to ε, λ andMinPts.
Definition 5 (density-based cluster region) Let D be adatabase of data regions. A cluster region CR in D withrespect to ε, λ and MinPts is a non-empty subset of Dsatisfying the following conditions:
1. ∀P,Q ∈ D: if P ∈ CR and Q is density reachablefrom P with respect to ε, λ and MinPts, then Q ∈CR
2. ∀P,Q ∈ CR: P is density-connected to Q with re-spect to ε, λ and MinPts.
Definition 6 (noise) Let CR1, . . . , CRk be the clusters ofthe data set D with respect to ε, MinPts, and λ. Then wedefine the noise as the set of data regions in the data set Dnot belonging to any cluster CRi:
noise = {P ∈ D|∀i(1 ≤ i ≤ k) : P /∈ CRi} (4)
Figure 4 depicts example results of our clustering withfour different values for the correlation factor λ. The er-ror model was created as a hypercube (symmetric errorsfor all dimensions). With an increasing correlation fac-tor (pessimistic to optimistic), the satellites around C2 (seeFigure4a) in the investigated data set turn into their ownclusters. Since the satellites represent major biasing effectsduring a measurement, the clusters make sense. On theother hand, a drift is recognised as a cluster C1 (see Figure4(a,b)) with a correlation factor of 0 − 0.50. Beyond thisrange, the drift splits into two clusters C1 and C4 (see Fig-ure 4(c,d)). The parameters ε and MinPts are determinedaccording to the proposed heuristic in [3].
4. Quality Measures
Our presented DBSCANEA algorithm has three input pa-rameters: ε, MinPts, and λ. That means the clustering re-
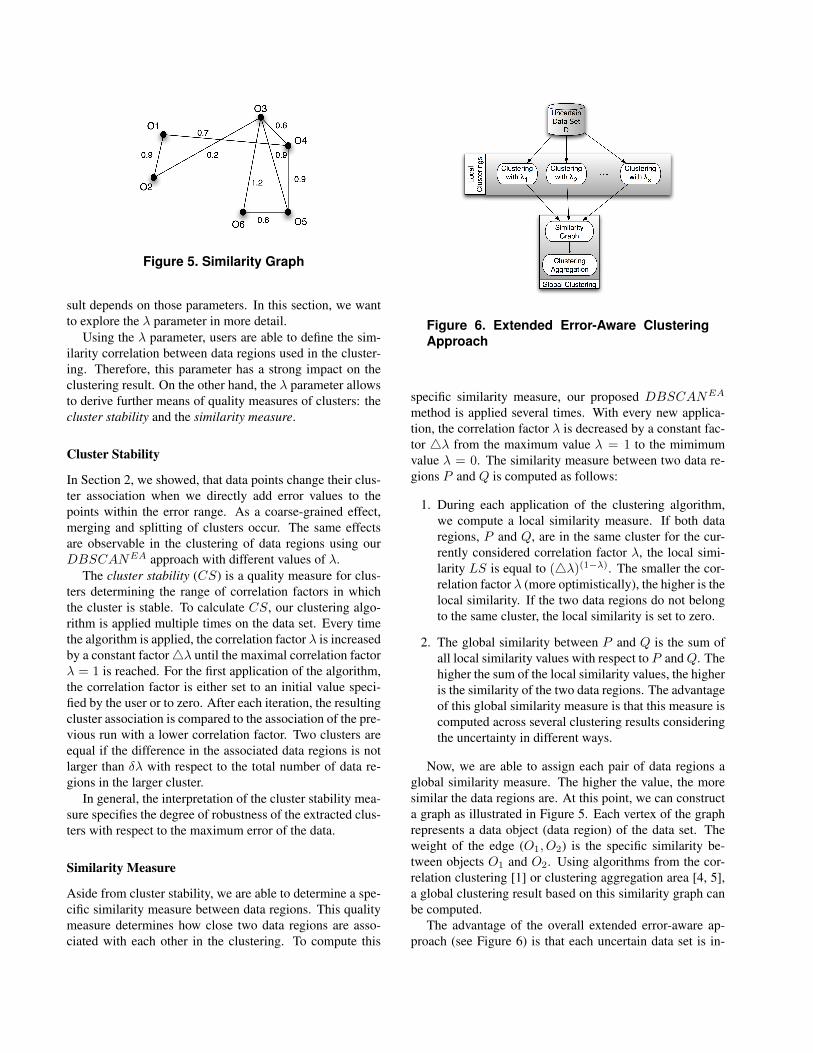
Figure 5. Similarity Graph
sult depends on those parameters. In this section, we wantto explore the λ parameter in more detail.
Using the λ parameter, users are able to define the sim-ilarity correlation between data regions used in the cluster-ing. Therefore, this parameter has a strong impact on theclustering result. On the other hand, the λ parameter allowsto derive further means of quality measures of clusters: thecluster stability and the similarity measure.
Cluster Stability
In Section 2, we showed, that data points change their clus-ter association when we directly add error values to thepoints within the error range. As a coarse-grained effect,merging and splitting of clusters occur. The same effectsare observable in the clustering of data regions using ourDBSCANEA approach with different values of λ.
The cluster stability (CS) is a quality measure for clus-ters determining the range of correlation factors in whichthe cluster is stable. To calculate CS, our clustering algo-rithm is applied multiple times on the data set. Every timethe algorithm is applied, the correlation factor λ is increasedby a constant factor4λ until the maximal correlation factorλ = 1 is reached. For the first application of the algorithm,the correlation factor is either set to an initial value speci-fied by the user or to zero. After each iteration, the resultingcluster association is compared to the association of the pre-vious run with a lower correlation factor. Two clusters areequal if the difference in the associated data regions is notlarger than δλ with respect to the total number of data re-gions in the larger cluster.
In general, the interpretation of the cluster stability mea-sure specifies the degree of robustness of the extracted clus-ters with respect to the maximum error of the data.
Similarity Measure
Aside from cluster stability, we are able to determine a spe-cific similarity measure between data regions. This qualitymeasure determines how close two data regions are asso-ciated with each other in the clustering. To compute this
Figure 6. Extended Error-Aware ClusteringApproach
specific similarity measure, our proposed DBSCANEA
method is applied several times. With every new applica-tion, the correlation factor λ is decreased by a constant fac-tor 4λ from the maximum value λ = 1 to the mimimumvalue λ = 0. The similarity measure between two data re-gions P and Q is computed as follows:
1. During each application of the clustering algorithm,we compute a local similarity measure. If both dataregions, P and Q, are in the same cluster for the cur-rently considered correlation factor λ, the local simi-larity LS is equal to (4λ)(1−λ). The smaller the cor-relation factor λ (more optimistically), the higher is thelocal similarity. If the two data regions do not belongto the same cluster, the local similarity is set to zero.
2. The global similarity between P and Q is the sum ofall local similarity values with respect to P andQ. Thehigher the sum of the local similarity values, the higheris the similarity of the two data regions. The advantageof this global similarity measure is that this measure iscomputed across several clustering results consideringthe uncertainty in different ways.
Now, we are able to assign each pair of data regions aglobal similarity measure. The higher the value, the moresimilar the data regions are. At this point, we can constructa graph as illustrated in Figure 5. Each vertex of the graphrepresents a data object (data region) of the data set. Theweight of the edge (O1, O2) is the specific similarity be-tween objects O1 and O2. Using algorithms from the cor-relation clustering [1] or clustering aggregation area [4, 5],a global clustering result based on this similarity graph canbe computed.
The advantage of the overall extended error-aware ap-proach (see Figure 6) is that each uncertain data set is in-

Figure 7. Influence of the λ Parameter on theNumber of Clusters
vestigated with several local DBSCANEA algorithms con-sidering the uncertainty in different ways. These local in-formation are aggregated together to determine a global re-sult. Our next research tasks focus on the refinement of thisextended error-aware clustering process, including the fol-lowing steps:
• investigating the parameterization of the localDBSCANEA algorithms in the context of our wholeapproach,• development and evaluation of several local similarity
functions,• evaluation of the influence of the value4λ, and• integration of arbitrary probalitity-density functions
(further specification of data regions) in the determi-nation process of4λ
5. EvaluationIn this section, we present some evaluation results.
Due to the current early phase of our overall ExtendedError-Aware Clustering Approach (see Figure 6), we canonly show some preliminary evaluation results regardingDBSCANEA. Figure 7 illustrates the influence of the λ pa-rameter on the number of detected clusters within the dataset. In this experiment, we used the illustrated data set ofFigure 4(a). As depicted, the number of clusters increases ifthe value of the λ parameter increases. Due to our seamlessextension to DBSCAN, our DBSCANEA shows the sameefficiency as the orginal approach. In general, the perfor-mance depends on the approximation of the mimimum andmaximum distance.
6. Related WorkAn overview of state-of-the-art data clustering ap-
proaches is given by Jain et al. in [6]. Well-known al-gorithms are k-means [2] and DBSCAN [3]. K-meansbelongs to the class of partitioning algorithms, while DB-SCAN is an example of a density-based clustering ap-proach. However, most of the published data clustering
techniques do not consider data objects with imprecise val-ues. Kriegel and Pfeile presented a density-based [7] anda hierarchical density-based clustering approach [8] for un-certain data. They proposed a fuzzy distance function tomeasure the similarity between fuzzy objects. This functiondoes not express the similarity by a single numerical value.Instead, the similarity is expressed by means of probabilityfunctions, which assign a numerical value to each distancevalue. Based on this fuzzy distance function, we proposedan extension of the DBSCAN algorithm. Ngai et al. [9] pre-sented an extension of the k-means algorithm for uncertaindata.
7. Conclusion
In this paper, we presented our basic error-aware exten-sion to the density-based clustering algorithm DBSCAN tocluster uncertain data. Moreover, we proposed a novel qual-ity measure to interpret the clustering results. Furthermore,we presented a method on how to use a resulting qualitymeasure to determine a global clustering result. All thesepresented concepts are implemented and tested in the fieldof mask manufacturing. The first application on real datashowed a significant improvement for the manufacturingyield in comparison to applications using the classical DB-SCAN algorithm. Our next steps include (i) the exhaustivecomparison with other algorithms, like [7, 9], and (ii) therefinement of our Extended Error-Aware Clustering algo-rithm.
References
[1] N. Bansal, A. Blum, and S. Chawla. Correlation clustering.In Proc. of FOCS, 2002.
[2] E. Forgy. Cluster analysis of multivariate data: Efficiency vs.interpretability of classifcations. Biometrics, 21:768, 1965.
[3] M. Ester, H.-P. Kriegel, J. Sander, and X. Xu. A density-basedalgorithm for discovering clusters in large spatial databaseswith noise. In Proc. of KDK, 1996.
[4] A. Gionis, H. Mannila, and P. Tsaparas. Clustering aggrega-tion. In Proc. of ICDM, 2005.
[5] D. Habich, T. Wachter, W. Lehner, and C. Pilarsky. Two-phase clustering strategy for gene expression data sets. InProc. of SAC, 2006.
[6] A. K. Jain, M. N. Murty, and P. J. Flynn. Data clustering:a review. ACM Computing Surveys (CSUR), 31(3):264–323,1999.
[7] H.-P. Kriegel and M. Pfeifle. Density-based clustering of un-certain data. In Proc. of KDD, New York, NY, USA, 2005.ACM Press.
[8] H.-P. Kriegel and M. Pfeifle. Hierarchical density-based clus-tering of uncertain data. In Proc. of ICDM, 2005.
[9] W. K. Ngai, B. Kao, C. K. Chui, R. Cheng, M. Chau, andK. Y. Yip. Efficient clustering of uncertain data. In Proc. ofICDM, 2006.