er&sd "skeleton" presentation
TRANSCRIPT
CNU Emergency Response & Street Design Initiative
Emergency Response & Street Design Initiative
October 1, 2009: Centers for Disease Control
CNU Emergency Response & Street Design Initiative
Traffic related issues;
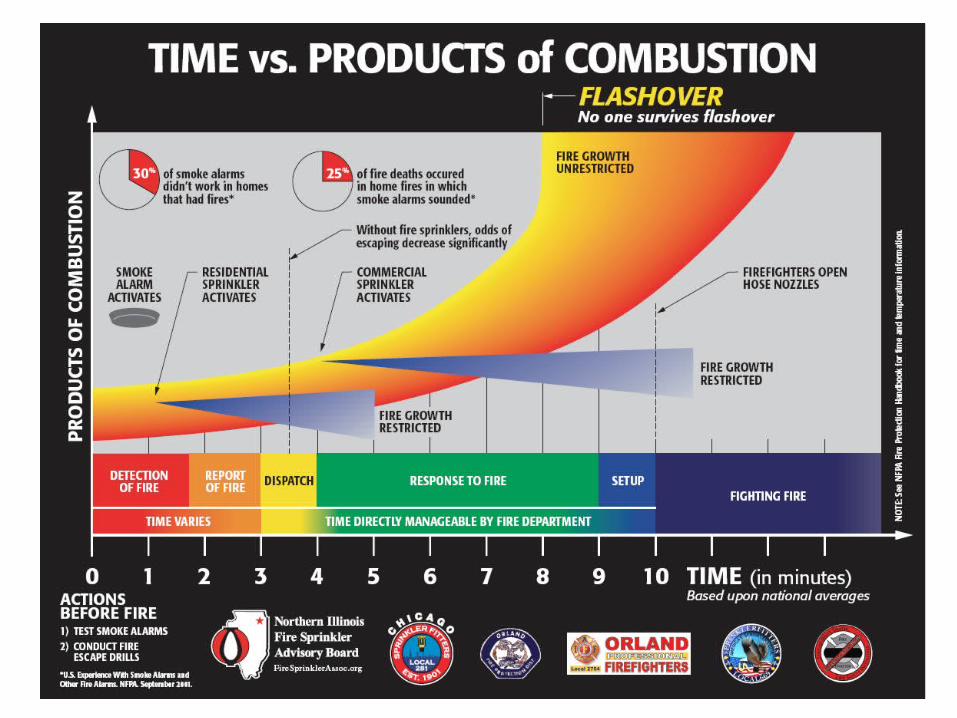
Fire Related Issues;
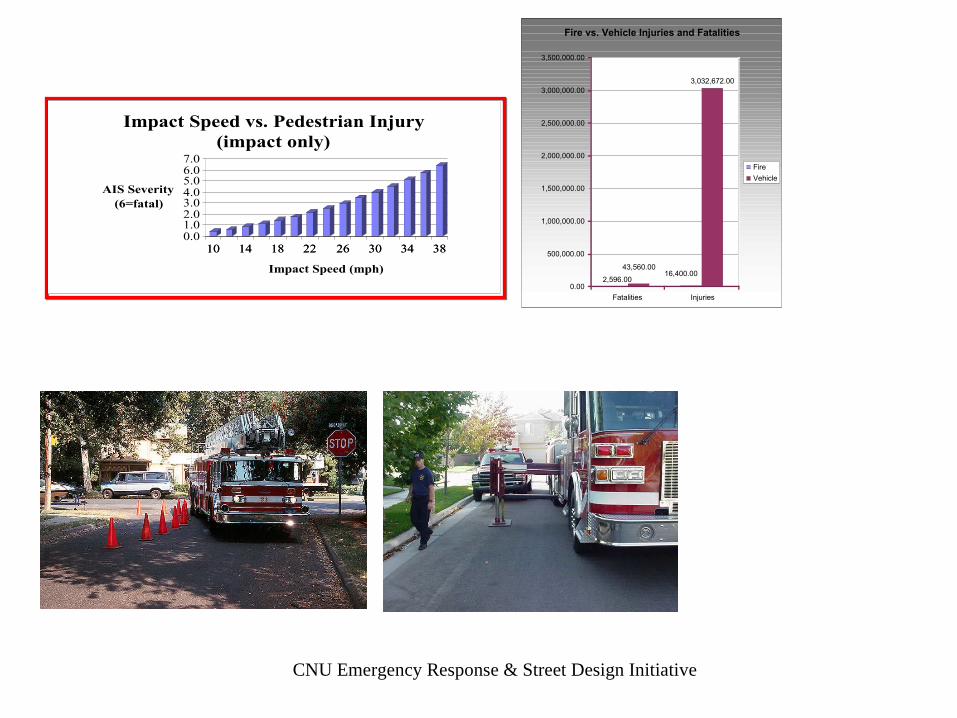
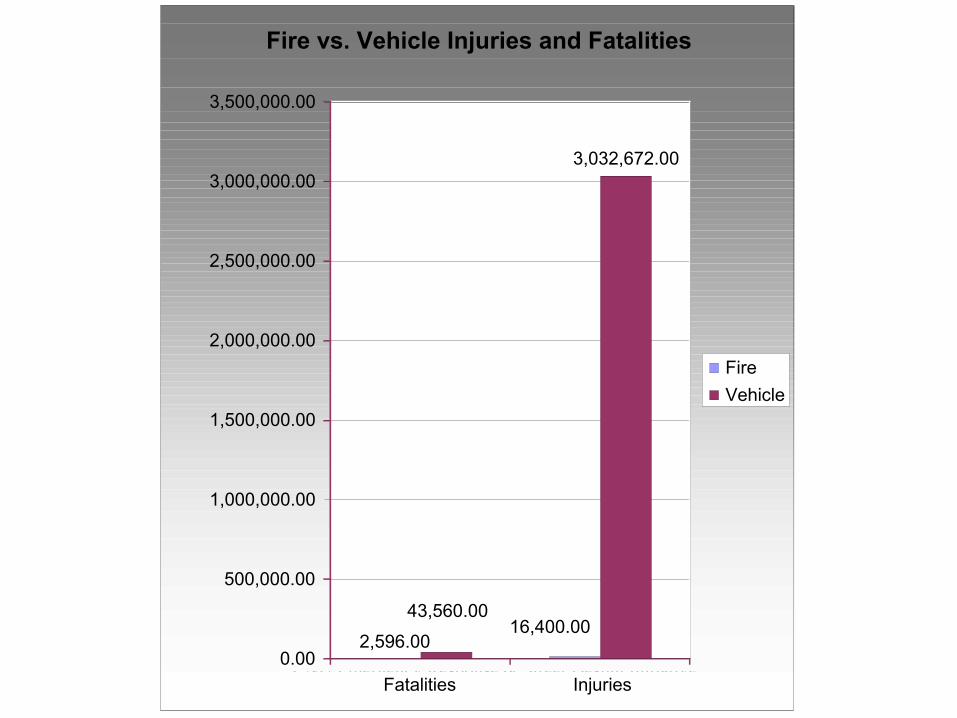
Fire vs. Vehicle Injuries and Fatalities
2,596.00
3,032,672.00
16,400.0043,560.00
0.00
500,000.00
1,000,000.00
1,500,000.00
2,000,000.00
2,500,000.00
3,000,000.00
3,500,000.00
Fatalities Injuries
Incidents per Year
Fire
Vehicle
10 14 18 22 26 30 34 380.01.02.03.04.05.06.07.0
AIS Severity (6=fatal)
10 14 18 22 26 30 34 38
Impact Speed (mph)
Impact Speed vs. Pedestrian Injury (impact only)
CNU Emergency Response & Street Design Initiative
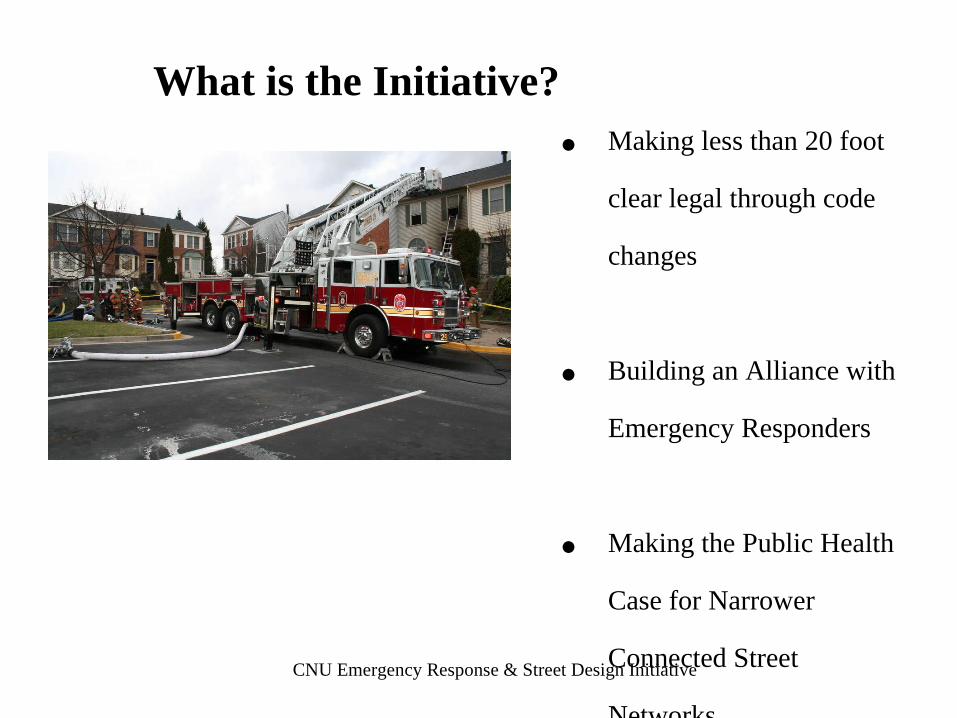
What is the Initiative?
• Making less than 20 foot
clear legal through code
changes
• Building an Alliance with
Emergency Responders
• Making the Public Health
Case for Narrower
Connected Street
Networks
CNU Emergency Response & Street Design Initiative
2.4 7.6(per 500’ block)
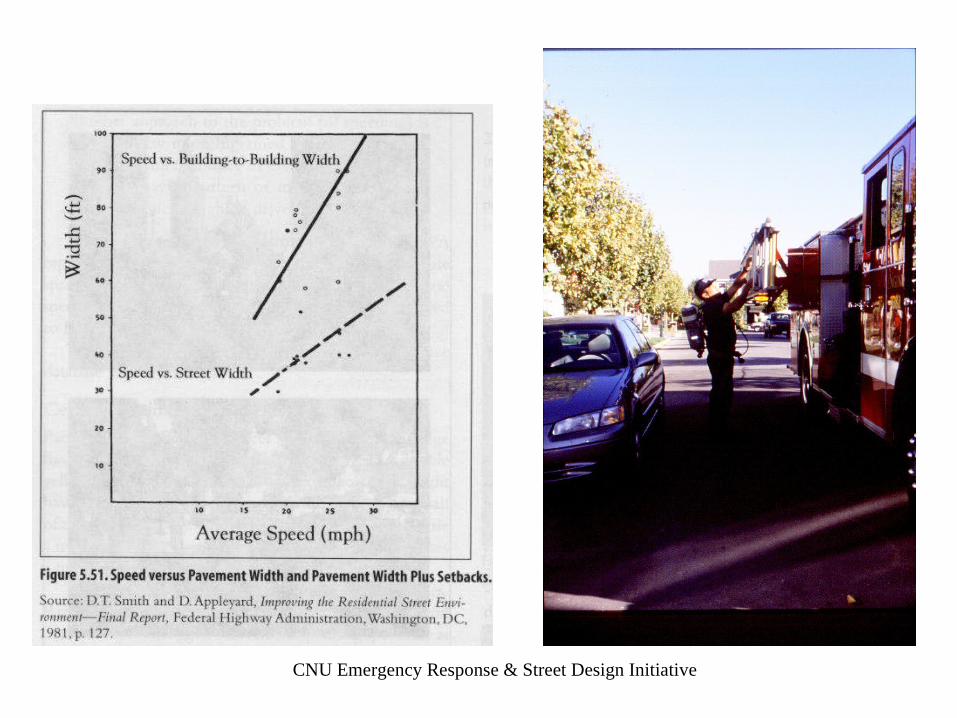
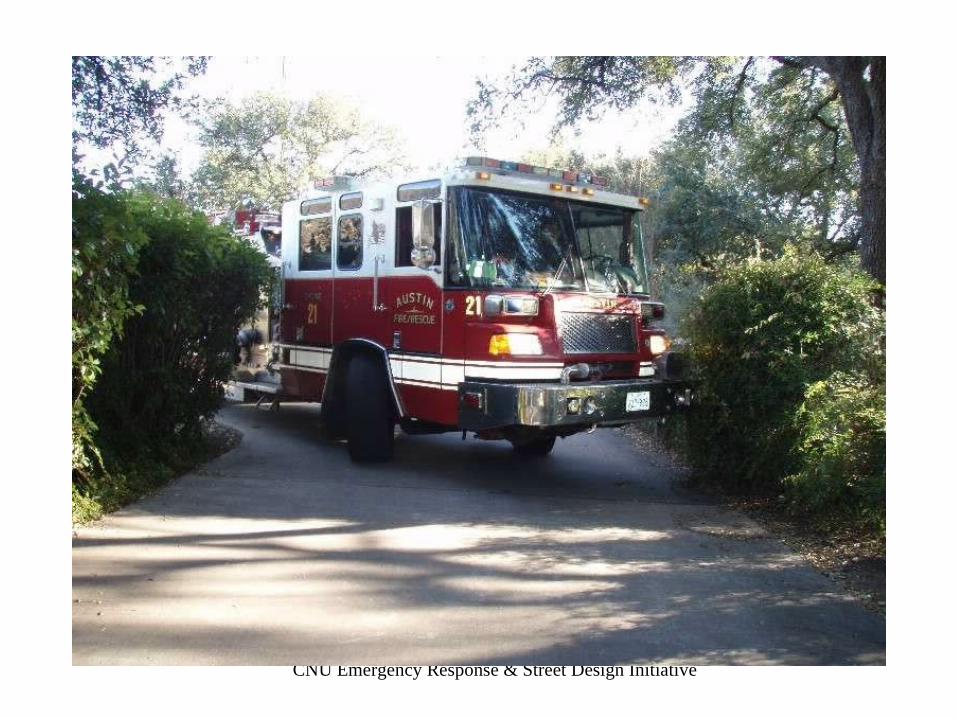
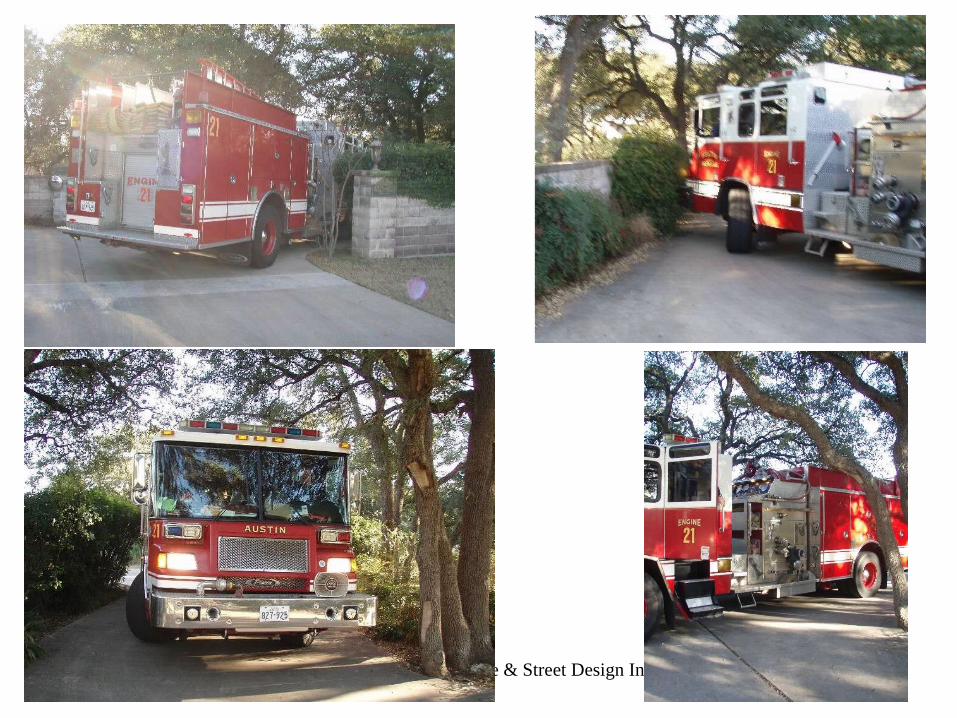
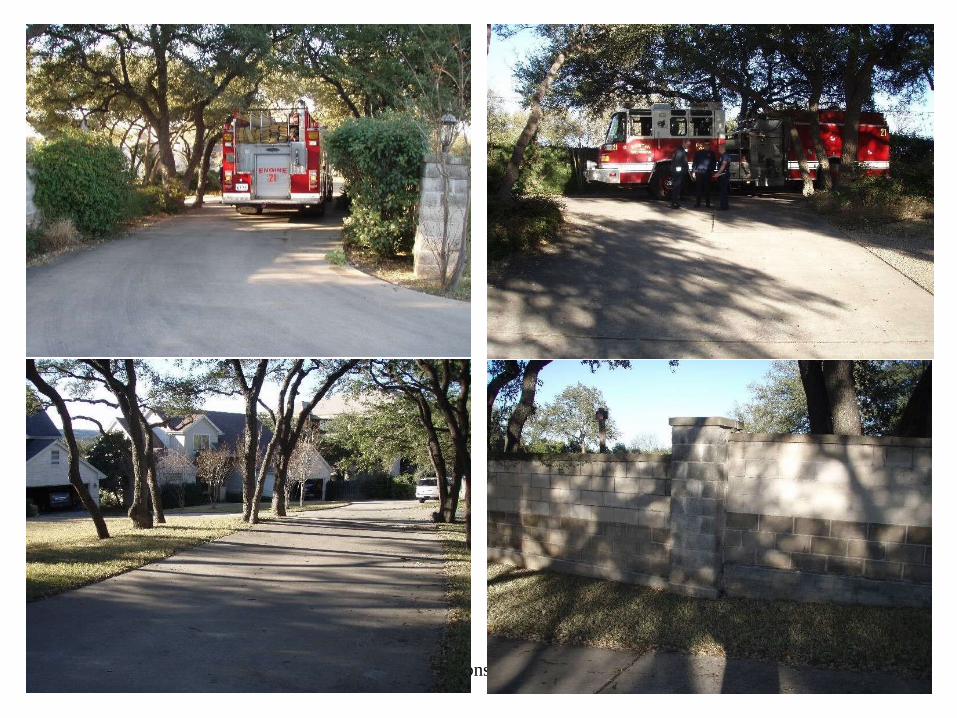
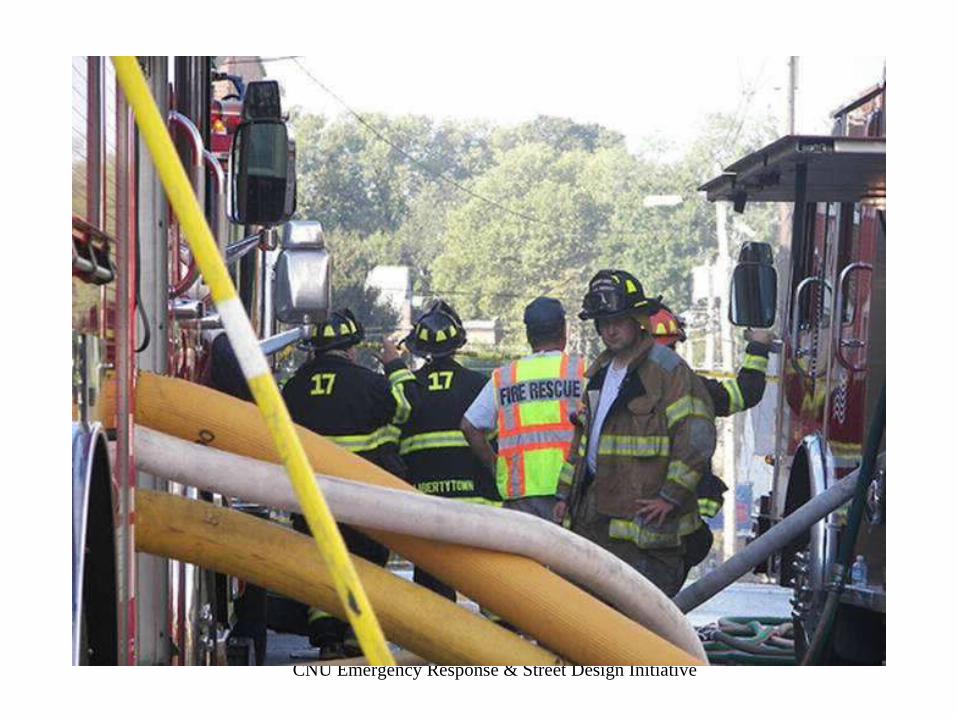
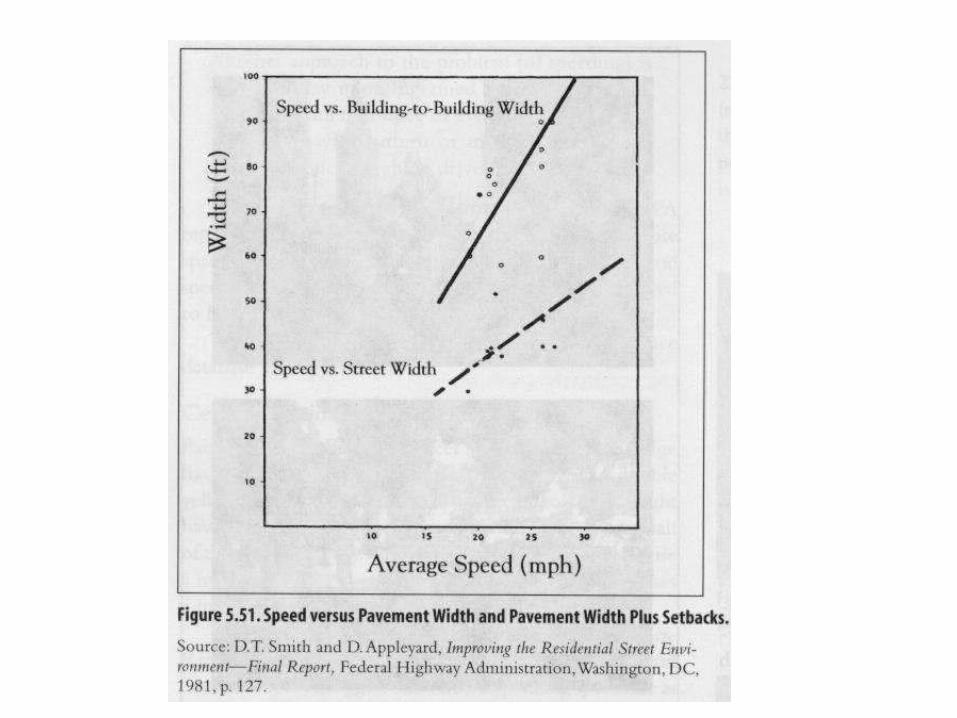
Narrower streets are safer streets, butFire operations must be accommodated
CNU Emergency Response & Street Design Initiative
CNU Emergency Response & Street Design Initiative
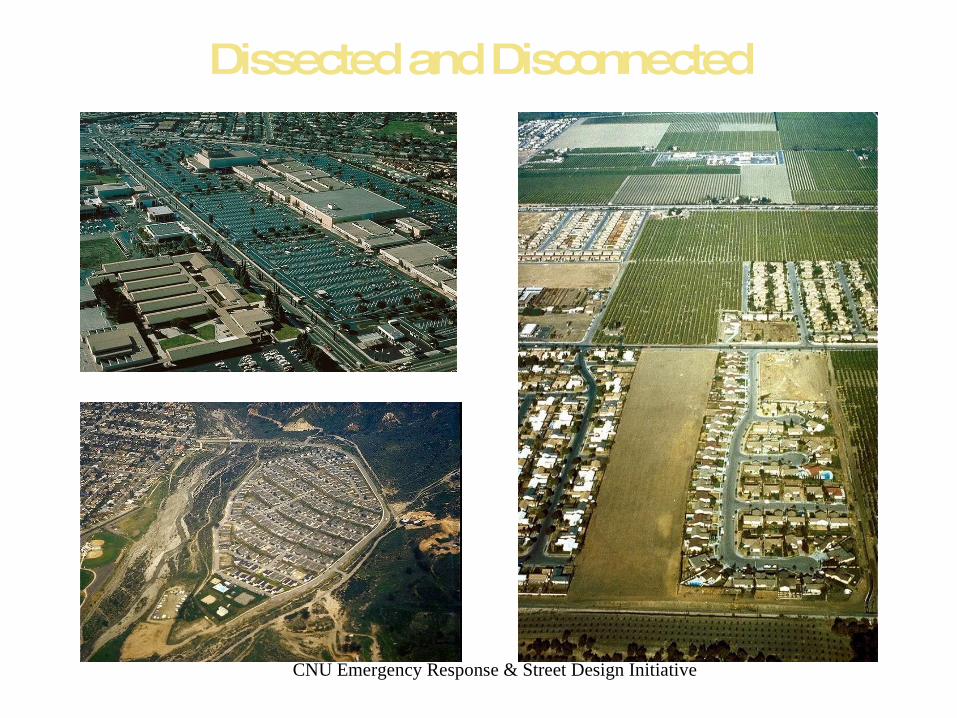
Dissected and Disconnected
CNU Emergency Response & Street Design Initiative
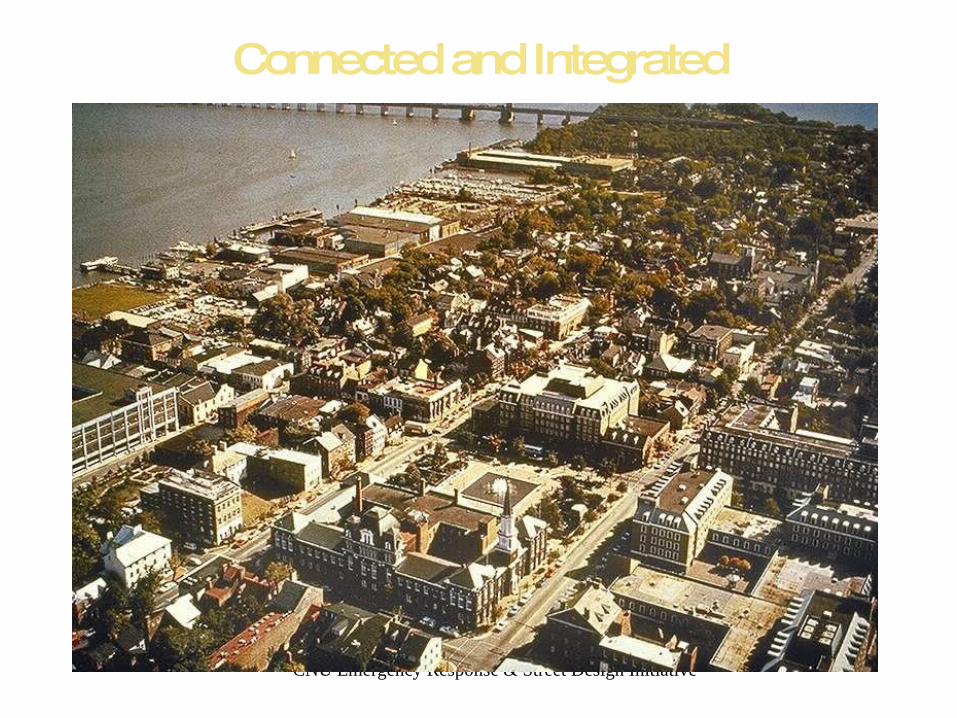
Connected and Integrated
CNU Emergency Response & Street Design Initiative
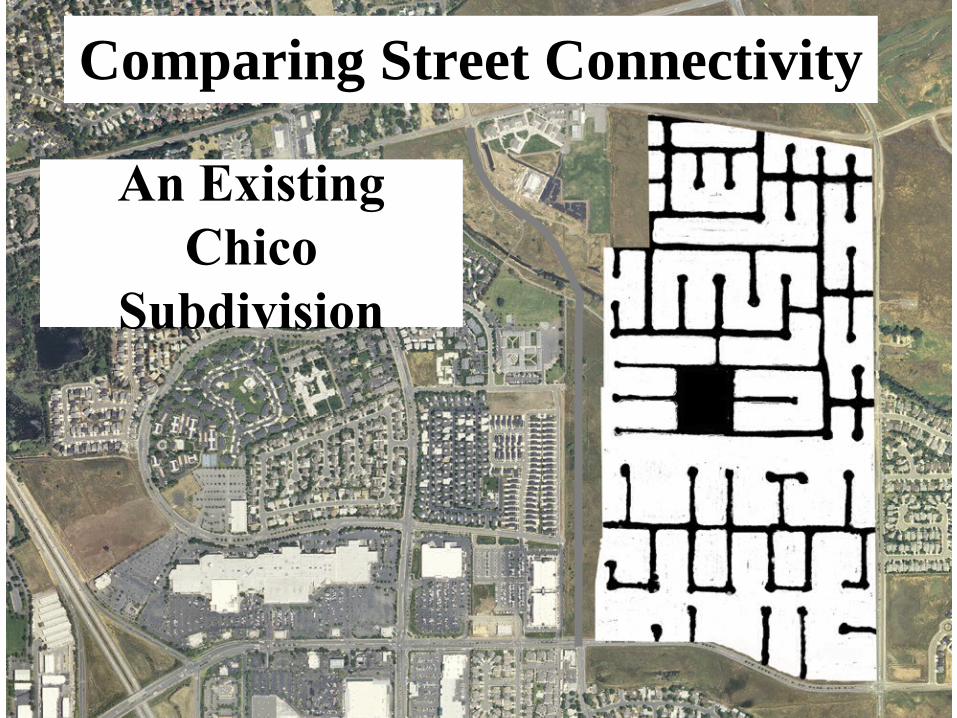
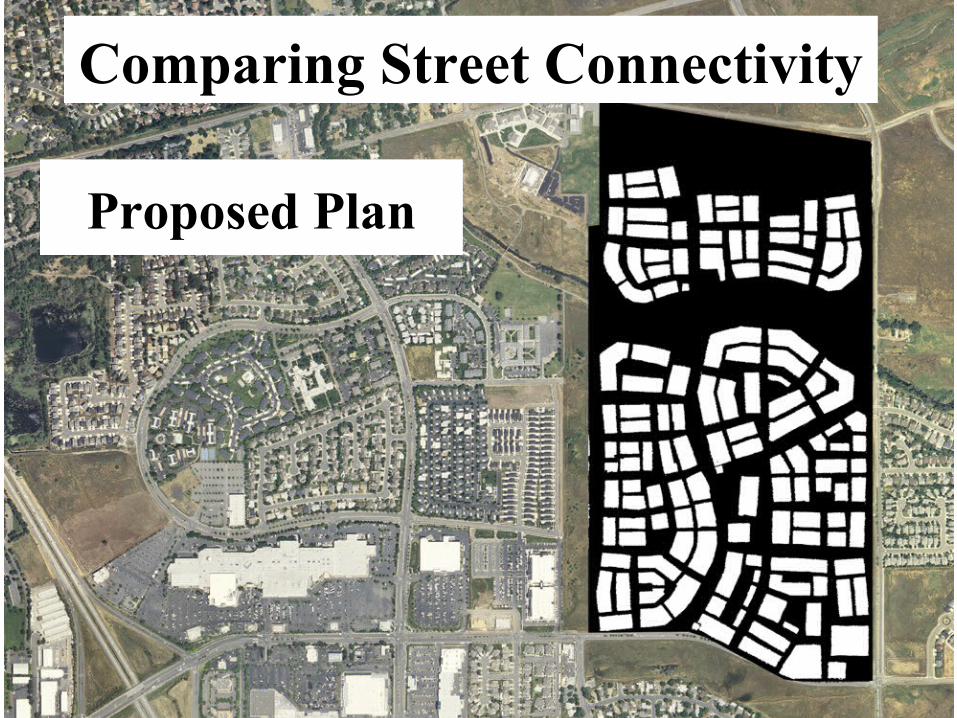
Comparing Street Connectivity
An Existing Chico
Subdivision
CNU Emergency Response & Street Design Initiative
Comparing Street Connectivity
Proposed Plan

CNU Emergency Response & Street Design Initiative
Long, slow routes Short, direct routes
CNU Emergency Response & Street Design Initiative
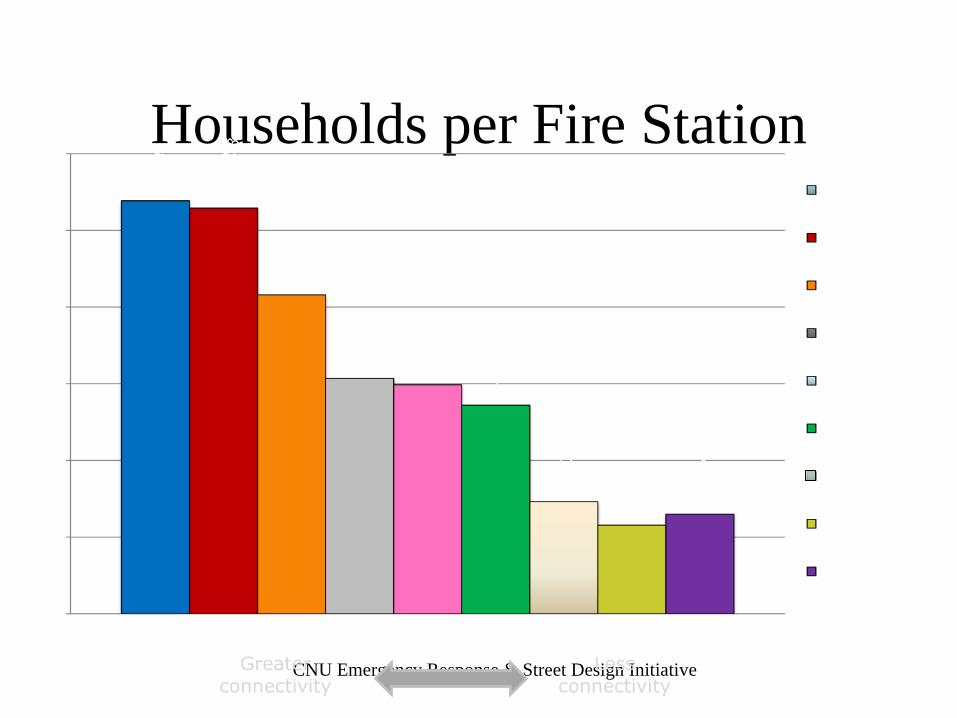
Households per Fire Station
CNU Emergency Response & Street Design Initiative
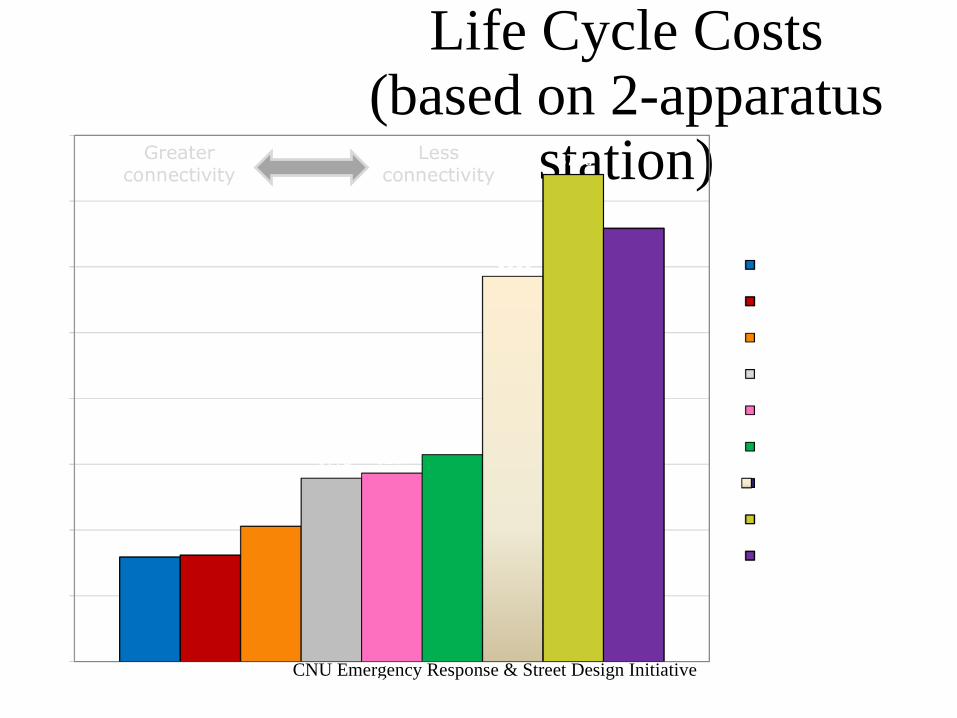
Annualized Per-Capita Life Cycle Costs
(based on 2-apparatus station)
CNU Emergency Response & Street Design Initiative
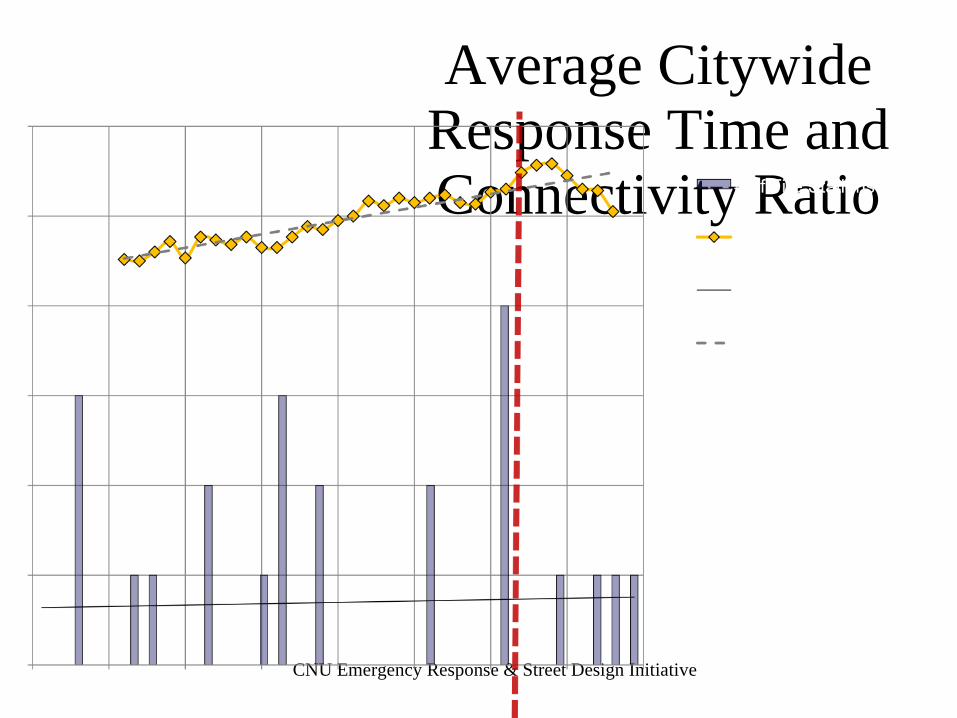
Average Citywide Response Time and Connectivity Ratio
CNU Emergency Response & Street Design Initiative
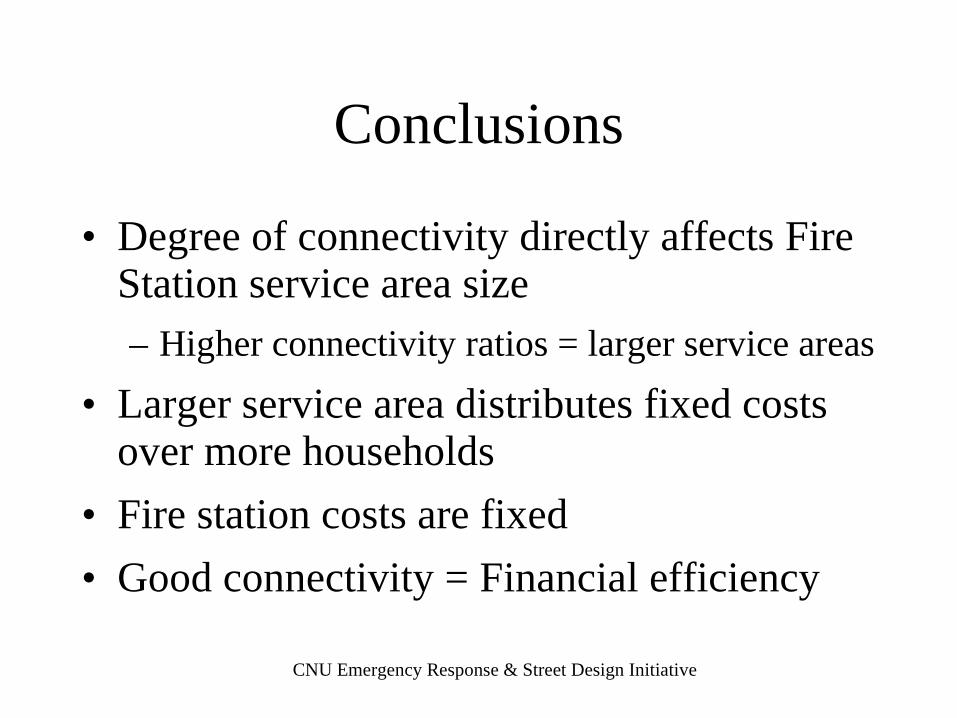
Conclusions
• Degree of connectivity directly affects Fire Station service area size– Higher connectivity ratios = larger service areas
• Larger service area distributes fixed costs over more households
• Fire station costs are fixed
• Good connectivity = Financial efficiency
CNU Emergency Response & Street Design Initiative
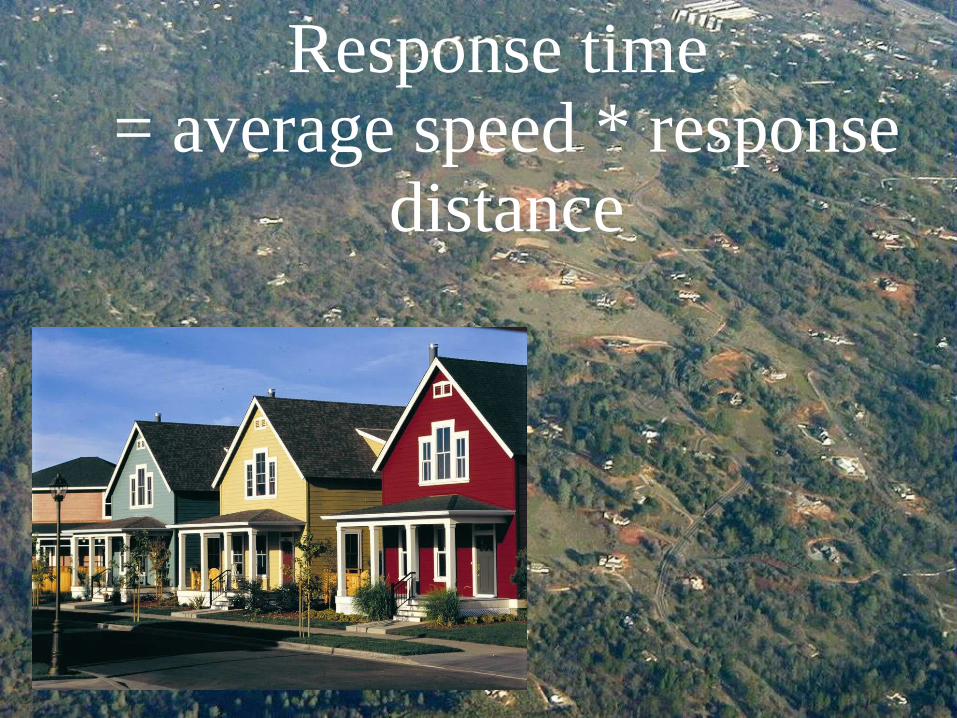
Response time = average speed * response
distance
CNU Emergency Response & Street Design Initiative
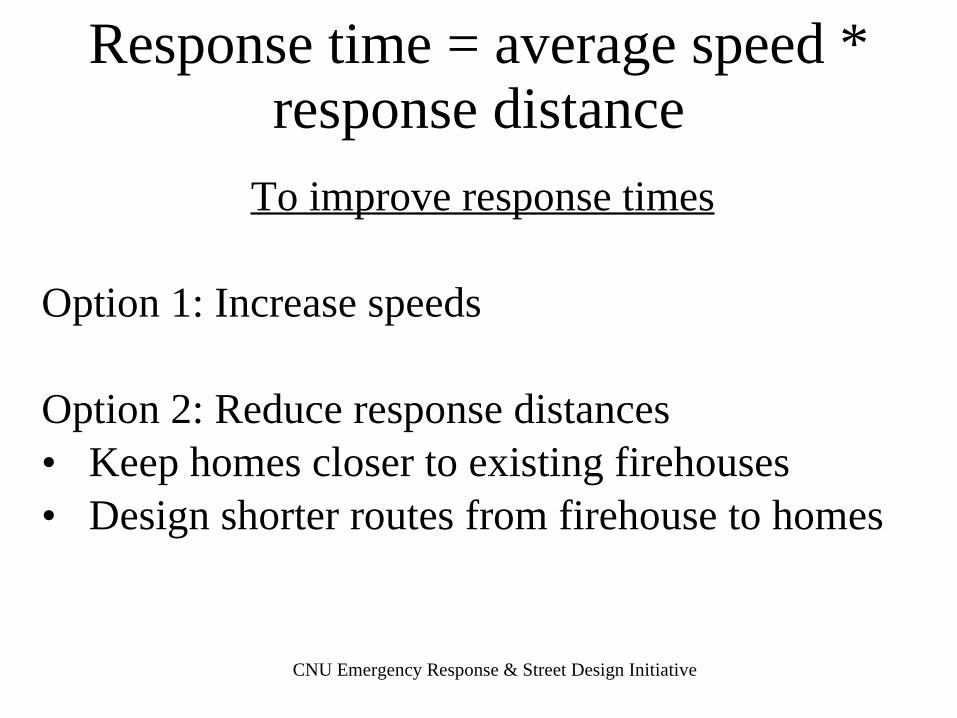
Response time = average speed * response distance
To improve response times
Option 1: Increase speeds
Option 2: Reduce response distances• Keep homes closer to existing firehouses• Design shorter routes from firehouse to homes
CNU Emergency Response & Street Design Initiative
CNU Emergency Response & Street Design Initiative
CNU Emergency Response & Street Design Initiative
CNU Emergency Response & Street Design Initiative
CNU Emergency Response & Street Design Initiative
CNU Emergency Response & Street Design Initiative
Fire vs. Vehicle Injuries and Fatalities
2,596.00
3,032,672.00
16,400.0043,560.00
0.00
500,000.00
1,000,000.00
1,500,000.00
2,000,000.00
2,500,000.00
3,000,000.00
3,500,000.00
Fatalities Injuries
Incidents per Year
Fire
Vehicle
CNU Emergency Response & Street Design Initiative
2.4 7.6(per 500’ block)
CNU Emergency Response & Street Design Initiative
“Broad is the road that leads to destruction
…narrow is the road that leads to life.”
-Jesus
(Matthew 7:13-14)New International Version