es 05 executive summary 24 cfr 91.200(c), 91.220(b) 1....executive summary es‐05 executive ......
TRANSCRIPT

Consolidated Plan ANCHORAGE 1
OMB Control No: 2506‐0117 (exp. 07/31/2015)
Executive Summary
ES‐05 Executive Summary ‐ 24 CFR 91.200(c), 91.220(b)
1. Introduction
The Municipality of Anchorage (MOA) is a participating jurisdiction that is eligible to receive U.S. Department of Housing and Urban Development (HUD) monies for Community Development Block Grants (CDBG), HOME Investment Partnerships Program (HOME), and Emergency Solutions Grant (ESG). The MOA is required to submit a Consolidated Plan that covers a five‐year period that outlines the intended distribution of these dollars. To meet this requirement, the MOA is submitting this Consolidated Plan, 2013‐2017. This Plan introduces data‐based and market‐driven strategies that address the needs of the community over the next five years. The format of this Plan is different from prior years. In 2012, HUD provided the MOA with a template for the Consolidated Plan that included three distinct sections: Needs Assessment, Market Analysis, and Strategic Plan. The Needs Assessment required the MOA to draw from data related to housing problems such as overcrowding, lacking kitchen or bathroom, substandard, or cost burdened. This section also reviews the scope of homelessness and community service needs. The Market Analysis reviews current economic conditions, housing stock, labor pool and future viable economic opportunities. The Strategic Plan uses the first two steps to build effective data‐driven goals and objectives. This Consolidated Plan features local data and builds on recommendations offered through public meetings held with the Housing and Neighborhood Development Commission and its Oversight Subcommittee on Homelessness. This report provides a clear vision of the jurisdiction's needs related to (affordable housing, community development, and homelessness). Analysis points to the lack of affordable housing for both owners and renters, the importance of safe and viable neighborhoods for all geographical areas, and the increasing need for housing and supportive services to respond to the homeless. The overall goal of the programs covered by this Consolidated Plan (CP) is to develop viable urban communities by providing decent housing and a suitable living environment and expanding economic opportunities principally for low and moderate income persons. The primary means towards this end is to extend and strengthen partnerships among all levels of government and private sectors, including for‐profit and non‐profit organizations, in the production and operation of affordable housing. This CP presents the MOA plan to pursue these goals through continued community planning and development strategies. The 2013 AP describes how the MOA intends to invest its CDBG, HOME, and ESG funds for the 2013 program year: January 1, 2013 through December 31, 2013. It also outlines actions the MOA plus state and community organizations will pursue to implement strategies in the Municipality of Anchorage Housing and Community Development Consolidated Plan for 2013‐2017 CP. In order to be eligible to receive CDBG, HOME, and ESG funds, the Municipality must submit a Consolidated Plan to the Department of Housing and Urban Development (HUD) every five years, and is required to update that plan annually. The Consolidated Plan is an assessment and analysis of local social and economic conditions and issues related to housing, homelessness, community development, and development. Utilizing a comprehensive outreach and citizen participation process, the Consolidated Plan describes priority needs facing the community and develops strategies to address those needs. The related 2013 Action Plan is the first of five required annual‐updates to the 2013‐2017 Consolidated Plan, and incorporates the Municipality's plan to expend CDBG, HOME and ESG monies.
2. Summary of the objectives and outcomes identified in the Plan Needs Assessment Overview
HUD requires grantees to incorporate a standardized performance measurement system. The system is designed to enable HUD to aggregate results of its programs and report to Congress and the public on a more outcome‐oriented system (March 7, 2006 Notice in Federal Register).
Each activity in the 2013 Action Plan will correspond to one of the following three objectives.
*Suitable Living Environment
*Decent Affordable Housing
*Creating Economic Opportunities
In addition, each activity must also choose an outcome category that best reflects what the participating jurisdiction is seeking to achieve. The three outcome categories consist of the following.

Consolidated Plan ANCHORAGE 2
OMB Control No: 2506‐0117 (exp. 07/31/2015)
*Availability/Accessibility
*Affordability
*Sustainability: Promoting Livable or Viable Communities
The AP‐35 Projects section of the 2013 Action Plan, details respective objectives and outcomes for each of the activities proposed. The following tables provide objectives, strategies, and proposed projects in 2013. It also lays out the performance measures to gauge program status and effectiveness.
ES 05 Additional information Page 1
ES 05 Additional information Page 2
ES 05 Additional information Page 3
ES 05 Additional information Page 4
ES 05 Additional information Page 5

Consolidated Plan ANCHORAGE 3
OMB Control No: 2506‐0117 (exp. 07/31/2015)
ES 05 Tables ‐ Objectives and Strategies Page 1 of 3
ES 05 Tables ‐ Objectives and Strategies Page 2 of 3
ES 05 Tables ‐ Objectives and Strategies Page 3 of 3
3. Evaluation of past performance
An evaluation of past performance assisted the MOA to choose its goals and projects for this Consolidated Plan, 2013‐2017. For more than a decade the MOA has conducted a community survey to identify community priorities. The community survey was the basis in setting priorities for distributing CDBG, HOME, and ESG monies. The MOA determined that more data, community meetings, and input would help out a picture of community need to set priorities. Consequently, the MOA took the following additional steps: 1) The MOA analyzed several data sets from HUDs Comprehensive Housing Affordability Strategy data, as well as state and local data from local providers; 2) Over an eleven‐month period several meetings were held by the HAND Commission and the Commissions Oversight Subcommittee on Homelessness to take in comment and recommendations regarding data findings and significance; 3) An Assembly work session, with interested community members in the audience, was held to help identify specific projects that met goals in the Plan. From this community context, the Plans goals, strategies, and measures of evaluation were developed.
The following projects are identified as meeting community need and are outlined in the Plan: CHDO Rental Development; Minor Repair Program, Affordable Housing Program, Mobile Home Repair Program, Homeless Prevention and Rapid Re‐Housing services, and Maintenance and Operations monies for shelters.
4. Summary of citizen participation process and consultation process
The 2013‐2017 CP process developed and followed a Citizen Participation Plan as outlined and recommended by HUD. A revised Citizen Participation Plan is included in the 2013 Action Plan and specific information included in Appendices. The key annual activities designed to encourage citizen participation are to hold at least four public hearings during the program year, offer public comment periods for the draft versions of each annual plan, consult with various groups to review the needs, strategies, actions, projects, and performance, distribute review copies of the draft plans to agencies, residents, the Federation of Community Councils, and the HAND Commission, and provide the public with notice of citizen participation programs. A discussion with the opportunity for public comment to gather ideas for the 2013 Action Plan was held at the regularly scheduled HAND Commission meeting on November 2, 2011. Comments on the draft 2013 Action Plan were accepted from May 28, 2013 to 10:00 AM on June 28, 2013. A public hearing was held at the June 5, 2013 meeting of the Housing and Neighborhood Development (HAND) Commission held between 4 PM to 5:30 PM in the Assembly Conference Room, 632 W. 6th Ave., 1st Floor, Rm 155. A 2nd public hearing was held at the June 12 HAND Oversight Sub‐committee on Homelessness (HCOSH) meeting, from 3 PM to 4 PM at the Department of Health and Human Services (DHHS), at 825 L St., Rm 423. Copies of the draft plan were available at the DHHS, Public Health Initiatives and Partnerships Division, Community Safety and Development (CSD), at 825 L Street, Rm 506, and through the CSD web site at: http://www.muni.org/Departments/health/services/neighborhoods/PlansAndReports/Pages/ActionPlans.aspx.

Consolidated Plan ANCHORAGE 4
OMB Control No: 2506‐0117 (exp. 07/31/2015)
Other locations where these publications could be found were at the Loussac Library, Alaska Housing Finance Corporation, Cook Inlet Housing Authority, and NeighborWorks Anchorage. CSD worked in collaboration with the HAND Commission and HCOSH to draft and take public input and comment on the new Plan. A summary of public comments are included below and were considered in drafting and making revisions to the document. A final public hearing on the 2013‐2017 CP was held before the MOA Assembly on July 23, 2013 and a final public hearing on the 2013 AP was held before the MOA Assembly on August 6, 2013. The purpose of the HAND Commission is to advise the Mayor and the Assembly on issues related to short‐ and long‐term housing community development needs and strategies to affect lower‐income neighborhoods. The HAND Commission meets on the first Wednesday of the month from 4:00 p.m. ‐ 5:30 p.m. in the Assembly Conference Room 155, on the 1st Floor of City Hall. When special needs/issues arise, the Commission or staff may request an additional meeting or form a sub‐committee to respond to emergent issues. All meetings are open to the public.
ES 05 HAND Commission
5. Summary of public comments
Summary of public comments on the CP that were received during the June 5, 2013 Public Hearing.
Gabe Layman and Tyler Robinson with Cook Inlet Housing Authority (CIHA) made general commented on several areas of the Draft CP. Mr. Robinson requested that the MOA designate specific geographic areas in the municipality for additional revitalization efforts. He then requested that the Mayors Kitchen Cabinet recommendations be put into the CP and consider them. He thought that the same thing goes for the Anchorage Housing Market Analysis. He spoke about the need for very low income housing below 30%. He wants the MOA to consider long term operating costs for rental housing.
Summary of public comments on the AP that were received during the June 5, 2013 Public Hearing.
Brian Shelton‐Kelley Director of Community Development, NeighborWorks Anchorage commented on the 2013 Action Plan. He spoke about the Minor Repair Program (MRP) and that they appreciate the continued support. He is intrigued by the Mobile Home Repair Program (MHRP) and made a couple of comments on that program. NeighborWorks is interested in the Rental Housing Development funds. He made comments on that program and that it needs long term operational, rental subsidies.
Barbara Worley, Supervisor of the Minor Repair Grant, NeighborWorks, Anchorage made general comments in favor of the MRP and the MHRP, but that they would like to see the structure of the MHRP and what the program looks like before they can really say that they support it.
Mr. Shelton‐Kelley said "I think we would say that we do support efforts to address the housing quality conditions targeted to that style of housing."
Kenny Petersen, Interested citizen and newly a member of the Anchorage Coalition on Homelessness Board had lots of questions about the Plans and gave some general comments. He concluded with "Then I will attend the HCOSH meeting which is where that’s probably more fined tuned."
Tyler Robinson gave recommendation on the MHRP. He thinks the money would be better spent providing somebody a down payment for a new manufactured home. He thinks that the MOA should change the Rental Development Project description to include "in the event that a CHDO is not identified or a project is not identified, you contemplate making that rental development money available to the broader community for maybe broader rental development".

Consolidated Plan ANCHORAGE 5
OMB Control No: 2506‐0117 (exp. 07/31/2015)
Gabe Layman wanted to reflect back on a couple of comments that were made by Mr. Petersen. He spoke about what exactly is the whole purpose of the CP & AP, seeking other funding sources, and benchmarking data analysis.
Public Comments Page 1 of 9
Public Comments Page 2 of 9
Public Comments Page 3 of 9
Public Comments Page 4 of 9
Public Comments Page 5 of 9

Consolidated Plan ANCHORAGE 6
OMB Control No: 2506‐0117 (exp. 07/31/2015)
Public Comments Page 6 of 9
Public Comments Page 7 of 9
Public Comments Page 8 of 9
Public Comments Page 9 of 9
6. Summary of comments or views not accepted and the reasons for not accepting them
Although the MOA did not designate specific geographic areas in the Consolidated Plan as requested, there is recognition given and census tracts are identified which presents: ethnic groups by percentage; extremely low income (ELI) households; ELI with substandard living conditions; ELI with Severe Cost Burdened; low income housing tax credit and low income housing tax credit qualified Census Tracts. With limited resources and staff, the MOA is accepting projects across the jurisdiction based on the strategic priorities identified in the Plan. The MOA did not change the Mobile Home Repair Program (MHRP) from a rehabilitation program to one providing down payment for a new manufactured home as requested. The MHRP meets the priorities identified through the needs assessment and is also at the request of the Anchorage Assembly work session May 4, 2012.
The MOA did not accept the request to change the Rental Development Project description so that a non‐CHDO could be contracted. It is in the MOA's best interest to require a CHDO for this project to meet HUD requirements and create a mechanism to attract match dollars. There was a request to establish benchmarking that would measure the success of individual projects and impact on the community. The request outlined a community impact analysis such as transiency, school performance and household income. However, the MOA determined the lack of resources (staff and funding) limits the opportunity to provide an impact analysis of this scope. The MOA will consider this recommendation when more resources are available.
7. Summary

Consolidated Plan ANCHORAGE 7
OMB Control No: 2506‐0117 (exp. 07/31/2015)
The MOA receives HUD monies for CDBG, HOME, and ESG. In collaboration with the community, the MOA determined the most pressing needs in the community and developed effective, data‐based and market‐driven strategies to address the high priority needs. The MOA is required to submit a 5‐year Consolidated Plan to HUD to be eligible to receive these funds. The CP includes an Action Plan (2013) and Consolidated Action Performance Evaluation Review for each year of funding. This Consolidated Plan, 2013‐2017 and its related 2013 Action Plan initiates this 5‐year process.
Consolidated Plan ANCHORAGE 8
OMB Control No: 2506‐0117 (exp. 07/31/2015)
The Process
PR‐05 Lead & Responsible Agencies 24 CFR 91.200(b)
1. Describe agency/entity responsible for preparing the Consolidated Plan and those responsible for administration of each grant program and funding source
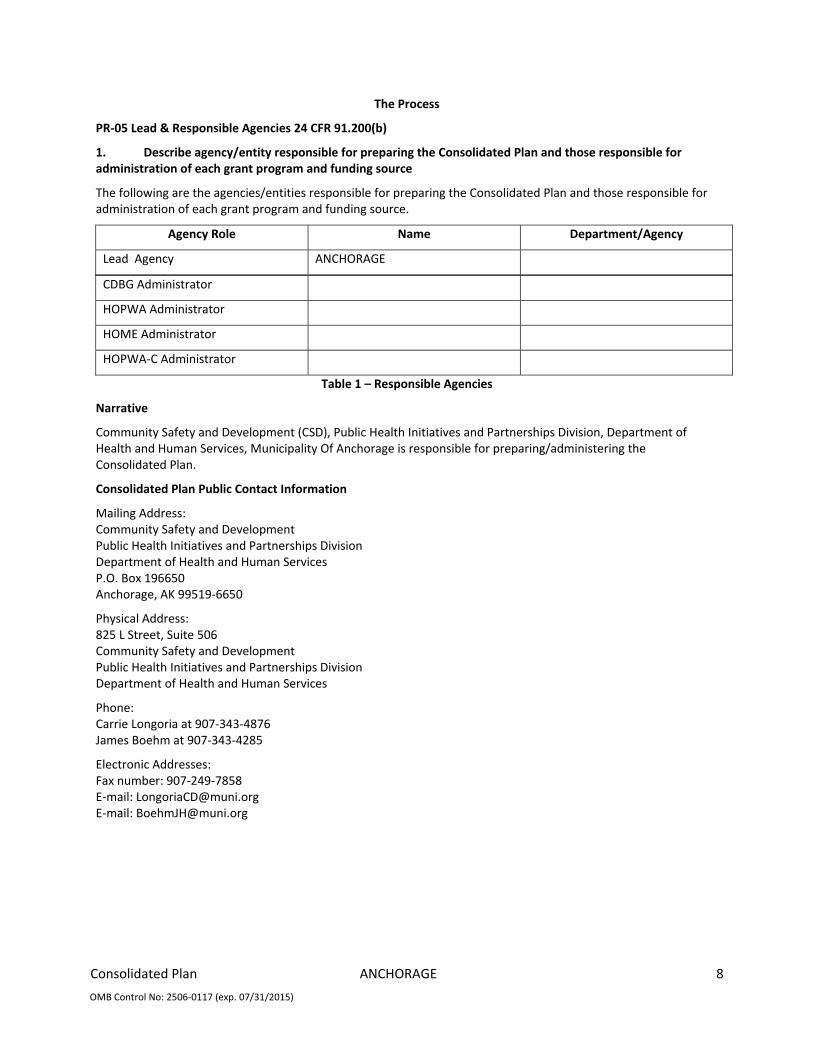
The following are the agencies/entities responsible for preparing the Consolidated Plan and those responsible for administration of each grant program and funding source.
Agency Role Name Department/Agency
Lead Agency ANCHORAGE
CDBG Administrator
HOPWA Administrator
HOME Administrator
HOPWA‐C Administrator
Table 1 – Responsible Agencies
Narrative
Community Safety and Development (CSD), Public Health Initiatives and Partnerships Division, Department of Health and Human Services, Municipality Of Anchorage is responsible for preparing/administering the Consolidated Plan.
Consolidated Plan Public Contact Information
Mailing Address: Community Safety and Development Public Health Initiatives and Partnerships Division Department of Health and Human Services P.O. Box 196650 Anchorage, AK 99519‐6650
Physical Address: 825 L Street, Suite 506 Community Safety and Development Public Health Initiatives and Partnerships Division Department of Health and Human Services
Phone: Carrie Longoria at 907‐343‐4876 James Boehm at 907‐343‐4285
Electronic Addresses: Fax number: 907‐249‐7858 E‐mail: [email protected] E‐mail: [email protected]

Consolidated Plan ANCHORAGE 9
OMB Control No: 2506‐0117 (exp. 07/31/2015)
PR‐10 Consultation ‐ 91.100, 91.200(b), 91.215(l)
1. Introduction
Part 91, Subpart ‐ Citizen Participation and Consultation, Section 91.100 of the Code of Federal Regulations instructs the MOA of the need to consult with other public and private agencies that provide assisted housing, health services, and social services during the preparation of the Consolidated Plan and Action Plans. PR‐10 furnishes a summary of MOA activities to enhance coordination between these entities, describe the coordination with the Anchorage and the State of Alaska, and bring to light the entities and agencies that participated in the process or with whom the Municipality consulted. It goes on to impart how the agencies/groups/organizations were consulted, the anticipated outcomes, or the areas for improved coordination. Then it identifies agencies not consulted, providing an explanation on the lack for consultation.
CSD consulted with many public and private agencies that provide assisted housing services, health care, and social and fair housing services (including those focusing on services to children, elderly persons, persons with disabilities, persons with HIV/AIDS and their families, and homeless persons) during the preparation of the consolidated plan. The planning process involved consultation and collaboration by three different methods: 1) Staff requested information and/or consultation from organizations, groups, and agencies via e‐mail. 2) CSD held public meetings and gave presentations, followed by discussion on the Consolidated Plan, Action Plan, CAPER, CBDG, HOME, ESG, and the Community Survey; 3) in 2012 the Anchorage Assembly held a work session on proposed 2013 Action Plans projects and requested a new project (Minor Repair Program for Mobile Homes) be added for the funding year; and 4) To gain a broad input from the community, CSD created a Housing and Community Development Needs Survey that was sent electronically to the CSD e‐mail list and various community organizations, groups, and agencies. CSD received 340 survey responses that were used in the development of the needs assessment and strategies of the Consolidated Plan. CSD published a display ad in the Anchorage Daily News for the Draft 2013‐2017 Consolidated Plan and 2013 Action Plan to obtain guidance, data, and comments. CSD also sent notice by e‐mail that the review drafts were available on the web, on CD, and hard copy. E‐mails were sent to the CSD e‐mail list, including all the agencies/groups in the above list. The housing market analysis was also posted on the web for review and the Community Development Department gave presentations to the community.
Summary of the jurisdiction’s activities to enhance coordination between public and assisted housing providers and private and governmental health, mental health and service agencies
CSD consulted with public and assisted housing providers and private and governmental health, mental health and service agencies by e‐mail, phone, in person, and by the web. CSD is part the Department of Health and Human Services, Public Health Initiatives and Partnerships Division of the Municipality. CSD held several public meetings in collaboration with the HAND Commission and its Oversight Subcommittee on Homelessness.
Describe coordination with the Continuum of Care and efforts to address the needs of homeless persons (particularly chronically homeless individuals and families, families with children, veterans, and unaccompanied youth) and persons at risk of homelessness
As designated in FY2011, the MOA CSD was assigned to take on the responsibilities held by the Collaborative Applicant for the FY2012 Continuum of Care (CoC) application. CSD was responsible for drafting the application in collaboration with the HAND Commission, HCOSH and the Anchorage Coalition to End Homelessness. The CSD established a FY2012 CoC Review Panel to begin a standardize process for review and scoring. This allowed the CoC Review Panel to rank projects for the application process. All CoC meetings were held in the public and were recorded. Meeting minutes, documents, applications, and related information while the CSD held responsibility can be found at: http://www.muni.org/Departments/health/services/neighborhoods/PlansAndReports/Pages/ContinuumofCare.aspx
The CSD worked closely with the community to bring on two new CoC applicants and applied for planning monies to create a governance structure. In April 2013, DHHS management determined it was important to transfer all CoC responsibilities to the Anchorage Coalition to End Homelessness, which recently gained status as a 501 (c) (3). The transfer of responsibilities includes grant writing, community coordination, and assignment of duties within the Coalition. The Coalition is actively working to secure monies for administrative support and grant application.

Consolidated Plan ANCHORAGE 10
OMB Control No: 2506‐0117 (exp. 07/31/2015)
Describe consultation with the Continuum(s) of Care that serves the jurisdiction's area in determining how to allocate ESG funds, develop performance standards and evaluate outcomes, and develop funding, policies and procedures for the administration of HMIS
In accordance with the HEARTH Act, HUD during 2012 HUD had issued regulations for the Emergency Solutions Grants program. The change was to focus from addressing the needs of homeless people in emergency or transitional shelters to assisting people to quickly regain stability in permanent housing after experiencing a housing crisis or homelessness. Additionally, this changed the corresponding amendments to the Consolidated Plan regulations and codified into law the Continuum of Care planning process to assist homeless persons by providing coordination in responding to their needs.
The MOA is the recipient of ESG funds and began consultation with all CoC members in March 2012, which included the HAND Commission, its Oversight Subcommittee on Homelessness, the Anchorage Coalition to End Homelessness and private interested citizens. The HAND Commission held public hearings to determine the best distribution of ESG funds that would have optimal impact. It was determined the MOA would work with CSS to fund the Beyond Shelter Program, which is based on the Rapid Re‐Housing Model. Also, the ESG monies would assist CSS to serve homeless populations previously funded with CoC monies. The FY2012 CoC application outlines the plan and distribution of ESG funds. Homeless Prevention services will be delivered through Emergency Outreach Services, co‐located with the Aging and Disability Resource Center, within the Department of Health and Human Services. It will be the responsibility of the sub‐grantees in collaboration with the CoC to continually evaluate program results, successes, problems and needs in order to change, refine, and update standards and policies for future funding. ESG funds can be used for five program components: street outreach, emergency shelter, homelessness prevention, rapid re‐housing assistance and HMIS, as well as administrative activities.
The CoC FY2012 grant application also shows the AKHMIS will continue to be administered by the MOA and related policies and procedures are already in operation. Funding development for AKHMIS is being handled by DHHS and AHFC management.

Consolidated Plan ANCHORAGE 11
OMB Control No: 2506‐0117 (exp. 07/31/2015)
2. Describe Agencies, groups, organizations and others who participated in the process and describe the jurisdictions consultations with housing, social service agencies and other entities
Agency/Group/Organization ANCHORAGE
Agency/Group/Organization Type Services‐Children Services‐Elderly Persons Services‐Persons with Disabilities Services‐Persons with HIV/AIDS Services‐Victims of Domestic Violence Services‐homeless Health Agency Other government ‐ Local
What section of the Plan was addressed by Consultation?
Housing Need Assessment Lead‐based Paint Strategy Homelessness Strategy Homeless Needs ‐ Chronically homeless Homeless Needs ‐ Families with children Homelessness Needs ‐ Veterans Homelessness Needs ‐ Unaccompanied youth Non‐Homeless Special Needs Economic Development Market Analysis Anti‐poverty Strategy
1
How was the Agency/Group/Organization consulted and what are the anticipated outcomes of the consultation or areas for improved coordination?
CSD consulted with all Departments/Divisions/Sections through e‐mails and phone calls. CSD also obtained information from the Muni web sites. The anticipated outcomes of the consultation were to improve coordination with all city departments and to include their input in the Consolidated Plan and Action Plan.
Agency/Group/Organization ALASKA LEGAL SERVICES
Agency/Group/Organization Type Housing Services‐Children Services‐homeless
What section of the Plan was addressed by Consultation?
Homeless Needs ‐ Families with children Market Analysis
2
How was the Agency/Group/Organization consulted and what are the anticipated outcomes of the consultation or areas for improved coordination?
Alaska Legal Services (ALS) was consulted by e‐mail. ALS has received CDBG Public Service funding in the past so that they could provide direct assistance to homeless and near homeless families with children regarding issues that are critical to preventing homelessness. Such legal assistance is aimed at immediately increasing an at‐risk family's safety and stability by keeping or securing housing, obtaining orders of protection and assisting with income maintenance issues such as securing child support and public benefits. The anticipated outcomes of the consultation were to improve coordination and to include their input in the Consolidated Plan and Action Plan.

Consolidated Plan ANCHORAGE 12
OMB Control No: 2506‐0117 (exp. 07/31/2015)
Agency/Group/Organization ANCHORAGE COMMUNITY LAND TRUST
Agency/Group/Organization Type Housing Services‐Education Services‐Employment
What section of the Plan was addressed by Consultation?
Economic Development Market Analysis
3
How was the Agency/Group/Organization consulted and what are the anticipated outcomes of the consultation or areas for improved coordination?
Anchorage Community Land Trust (ACLT) was consulted by e‐mail. Their mission is to partner with Anchorage neighborhoods to develop healthy and prosperous communities promoting investment opportunities and sustainable revitalization. ACLT is best described as a hybrid that works as both a land trust and community development organization and since inception, their real estate and community development activities have been solely focused in Mountain View where they leverage private and public resources to acquire and redevelop commercial properties that are strategic to neighborhood revitalization and facilitate grass‐roots efforts that residents identify as important to improving their quality of life. The anticipated outcomes of the consultation were to improve coordination and to include their input in the Consolidated Plan and Action Plan.
Agency/Group/Organization ANCHORAGE HOUSING INITIATIVES
Agency/Group/Organization Type Housing Services‐Persons with Disabilities
What section of the Plan was addressed by Consultation?
Housing Need Assessment Non‐Homeless Special Needs Market Analysis
4
How was the Agency/Group/Organization consulted and what are the anticipated outcomes of the consultation or areas for improved coordination?
Anchorage Housing Initiatives (AHI) was consulted by e‐mail. AHI has received HOME funding in the past for the development of housing for persons with disabilities. The anticipated outcomes of the consultation were to improve coordination and to include their input in the Consolidated Plan and Action Plan.
Agency/Group/Organization ALASKA HOUSING FINANCE CORP
Agency/Group/Organization Type Housing PHA
5
What section of the Plan was addressed by Consultation?
Housing Need Assessment Public Housing Needs Homelessness Strategy Homeless Needs ‐ Chronically homeless Homeless Needs ‐ Families with children Homelessness Needs ‐ Veterans Homelessness Needs ‐ Unaccompanied youth Market Analysis

Consolidated Plan ANCHORAGE 13
OMB Control No: 2506‐0117 (exp. 07/31/2015)
How was the Agency/Group/Organization consulted and what are the anticipated outcomes of the consultation or areas for improved coordination?
Alaska Housing Finance Corporation (AHFC) was consulted by e‐mail and phone. AHFC is the public housing authority for the Municipality of Anchorage, as well as the State of Alaska. They are involved in many housing actives and housing projects in Anchorage. They are also involved with the Continuum of Care and efforts to address the needs of homeless persons and persons at risk of homelessness. The anticipated outcomes of the consultation were to improve coordination and to include their input in the Consolidated Plan and Action Plan. AHFC is the Public Housing agency in the Municipality. AHFC provided information for the CP.
Agency/Group/Organization ANCHORAGE LITERACY PROJECT
Agency/Group/Organization Type Housing Services‐Elderly Persons Services‐Persons with Disabilities Services‐homeless Services‐Education Services‐Employment
What section of the Plan was addressed by Consultation?
Housing Need Assessment Homelessness Strategy Homeless Needs ‐ Chronically homeless Homeless Needs ‐ Families with children Homelessness Needs ‐ Unaccompanied youth Non‐Homeless Special Needs Economic Development Market Analysis Anti‐poverty Strategy
6
How was the Agency/Group/Organization consulted and what are the anticipated outcomes of the consultation or areas for improved coordination?
Anchorage Literacy Project was contacted by e‐mail. They have received CDBG Public Service funding in the past. The anticipated outcomes of the consultation were to improve coordination and to include their input in the Consolidated Plan and Action Plan.
Agency/Group/Organization ANCHORAGE SENIOR CENTER
Agency/Group/Organization Type Housing Services‐Elderly Persons Services‐Persons with Disabilities Services‐Education Services‐Employment
7
What section of the Plan was addressed by Consultation?
Housing Need Assessment Non‐Homeless Special Needs Economic Development Market Analysis Anti‐poverty Strategy

Consolidated Plan ANCHORAGE 14
OMB Control No: 2506‐0117 (exp. 07/31/2015)
How was the Agency/Group/Organization consulted and what are the anticipated outcomes of the consultation or areas for improved coordination?
CSD contacted the Anchorage Senior Center by e‐mail and phone. CSD Staff conducted two presentations on the Consolidated Plan at the Senior Center. Several seniors completed the priority needs survey during the presentations. The anticipated outcomes of the consultation were to improve coordination and to include their input in the Consolidated Plan and Action Plan.
Agency/Group/Organization Abused Women's Aid in Crisis (AWAIC)
Agency/Group/Organization Type Housing Services‐Victims of Domestic Violence Services‐homeless
What section of the Plan was addressed by Consultation?
Market Analysis
8
How was the Agency/Group/Organization consulted and what are the anticipated outcomes of the consultation or areas for improved coordination?
CSD contacted AWAIC by e‐mail and phone. CSD Staff conducted two presentations on the Consolidated Plan at AWAIC. Several people completed the priority needs survey during the presentations. The anticipated outcomes of the consultation were to improve coordination and to include their input in the Consolidated Plan and Action Plan. This organization is also a member of the CoC.
Agency/Group/Organization Access Alaska Inc.
Agency/Group/Organization Type Services‐Persons with Disabilities
What section of the Plan was addressed by Consultation?
Market Analysis
9
How was the Agency/Group/Organization consulted and what are the anticipated outcomes of the consultation or areas for improved coordination?
CSD contacted Access Alaska by e‐mail and phone. CSD Staff conducted a presentation on the Consolidated Plan at the Access Alaska. Several people completed the priority needs survey. The anticipated outcomes of the consultation were to improve coordination and to include their input in the Consolidated Plan and Action Plan.
Agency/Group/Organization AK Cares
Agency/Group/Organization Type Services‐Children Services‐Victims of Domestic Violence Services‐Health provides sexual and physical abuse evaluations for children
What section of the Plan was addressed by Consultation?
Market Analysis
10
How was the Agency/Group/Organization consulted and what are the anticipated outcomes of the consultation or areas for improved coordination?
CSD contacted Alaska Cares by e‐mail and phone. CSD Staff conducted a presentation on the Consolidated Plan at Alaska Cares. Several people completed the priority needs survey. The anticipated outcomes of the consultation were to improve coordination and to include their input in the Consolidated Plan and Action Plan.
Agency/Group/Organization Akeela Inc. 11
Agency/Group/Organization Type Services‐Persons with Disabilities Services‐Health

Consolidated Plan ANCHORAGE 15
OMB Control No: 2506‐0117 (exp. 07/31/2015)
What section of the Plan was addressed by Consultation?
Market Analysis
How was the Agency/Group/Organization consulted and what are the anticipated outcomes of the consultation or areas for improved coordination?
CSD contacted Akeeka Inc. by e‐mail. The anticipated outcomes of the consultation were to improve coordination and to include their input in the Consolidated Plan and Action Plan.
Agency/Group/Organization Alaska Center for the Blind and Visually Impaired
Agency/Group/Organization Type Services‐Persons with Disabilities Services‐Education Services‐Employment
What section of the Plan was addressed by Consultation?
Non‐Homeless Special Needs Economic Development Market Analysis
12
How was the Agency/Group/Organization consulted and what are the anticipated outcomes of the consultation or areas for improved coordination?
CSD contacted Alaska Center for the Blind and Visually Impaired by e‐mail. The anticipated outcomes of the consultation were to improve coordination and to include their input in the Consolidated Plan and Action Plan.
Agency/Group/Organization Alaska Children's Services
Agency/Group/Organization Type Housing Services‐Children Services‐Persons with Disabilities Services‐Education Services‐Employment
What section of the Plan was addressed by Consultation?
Homelessness Needs ‐ Unaccompanied youth Market Analysis
13
How was the Agency/Group/Organization consulted and what are the anticipated outcomes of the consultation or areas for improved coordination?
CSD contacted Alaska Children's Services by e‐mail. The anticipated outcomes of the consultation were to improve coordination and to include their input in the Consolidated Plan and Action Plan.
Agency/Group/Organization Alaska Chadux Corporation
Agency/Group/Organization Type Services‐Education oil spill response
What section of the Plan was addressed by Consultation?
Market Analysis
14
How was the Agency/Group/Organization consulted and what are the anticipated outcomes of the consultation or areas for improved coordination?
CSD contacted Alaska Chadux Corporation by e‐mail. The anticipated outcomes of the consultation were to improve coordination and to include their input in the Consolidated Plan and Action Plan.

Consolidated Plan ANCHORAGE 16
OMB Control No: 2506‐0117 (exp. 07/31/2015)
Agency/Group/Organization Alaska Community Development
Agency/Group/Organization Type Housing Services‐Education
What section of the Plan was addressed by Consultation?
Market Analysis
15
How was the Agency/Group/Organization consulted and what are the anticipated outcomes of the consultation or areas for improved coordination?
CSD contacted Alaska Community Development by e‐mail. The anticipated outcomes of the consultation were to improve coordination and to include their input in the Consolidated Plan and Action Plan.
Agency/Group/Organization Alaska AIDS Assistance Association
Agency/Group/Organization Type Services‐Persons with HIV/AIDS
What section of the Plan was addressed by Consultation?
Housing Need Assessment Homelessness Strategy Non‐Homeless Special Needs Market Analysis
16
How was the Agency/Group/Organization consulted and what are the anticipated outcomes of the consultation or areas for improved coordination?
CSD contacted 4A's by e‐mail. The anticipated outcomes of the consultation were to improve coordination and to include their input in the Consolidated Plan and Action Plan.
Agency/Group/Organization Alaska Health Fair, Inc.
Agency/Group/Organization Type Services‐Children Services‐Elderly Persons Services‐Health Health Agency
What section of the Plan was addressed by Consultation?
Housing Need Assessment Market Analysis
17
How was the Agency/Group/Organization consulted and what are the anticipated outcomes of the consultation or areas for improved coordination?
CSD contacted Alaska Health Fair, Inc. by e‐mail. The anticipated outcomes of the consultation were to improve coordination and to include their input in the Consolidated Plan and Action Plan.
Agency/Group/Organization Alaska Mental Health Trust 18
Agency/Group/Organization Type Services‐Persons with Disabilities Services‐Health Services‐Education Health Agency

Consolidated Plan ANCHORAGE 17
OMB Control No: 2506‐0117 (exp. 07/31/2015)
What section of the Plan was addressed by Consultation?
Housing Need Assessment Homelessness Strategy Homeless Needs ‐ Chronically homeless Homeless Needs ‐ Families with children Homelessness Needs ‐ Veterans Homelessness Needs ‐ Unaccompanied youth Non‐Homeless Special Needs Market Analysis
How was the Agency/Group/Organization consulted and what are the anticipated outcomes of the consultation or areas for improved coordination?
CSD contacted Alaska Mental Health Trust by e‐mail. The anticipated outcomes of the consultation were to improve coordination and to include their input in the Consolidated Plan and Action Plan.
Agency/Group/Organization Anchorage Community Mental Health Services, Inc.
Agency/Group/Organization Type Services‐Children Services‐Elderly Persons Services‐Persons with Disabilities Services‐Health Services‐Education Health Agency
What section of the Plan was addressed by Consultation?
Housing Need Assessment Homelessness Strategy Homeless Needs ‐ Chronically homeless Homeless Needs ‐ Families with children Homelessness Needs ‐ Veterans Homelessness Needs ‐ Unaccompanied youth Non‐Homeless Special Needs Market Analysis
19
How was the Agency/Group/Organization consulted and what are the anticipated outcomes of the consultation or areas for improved coordination?
CSD contacted Anchorage Community Mental Health Services, Inc. by e‐mail. The anticipated outcomes of the consultation were to improve coordination and to include their input in the Consolidated Plan and Action Plan.
Agency/Group/Organization Anchorage Neighborhood Health Center
Agency/Group/Organization Type Services‐Children Services‐Elderly Persons Services‐Persons with Disabilities Services‐Persons with HIV/AIDS Services‐Health Health Agency
What section of the Plan was addressed by Consultation?
Housing Need Assessment Market Analysis
20
How was the Agency/Group/Organization consulted and what are the anticipated outcomes of the consultation or areas for improved coordination?
CSD contacted Anchorage Neighborhood Health Center by e‐mail. The anticipated outcomes of the consultation were to improve coordination and to include their input in the Consolidated Plan and Action Plan.

Consolidated Plan ANCHORAGE 18
OMB Control No: 2506‐0117 (exp. 07/31/2015)
Agency/Group/Organization Anchorage School Board
Agency/Group/Organization Type Services‐Children Services‐Victims of Domestic Violence Services‐homeless Services‐Health Services‐Education
What section of the Plan was addressed by Consultation?
Public Housing Needs Homeless Needs ‐ Families with children Market Analysis
21
How was the Agency/Group/Organization consulted and what are the anticipated outcomes of the consultation or areas for improved coordination?
CSD contacted the Anchorage School Board by e‐mail. The anticipated outcomes of the consultation were to improve coordination and to include their input in the Consolidated Plan and Action Plan.
Agency/Group/Organization Anchorage School District
Agency/Group/Organization Type Housing Services‐Children Services‐Victims of Domestic Violence Services‐homeless Services‐Health Services‐Education
What section of the Plan was addressed by Consultation?
Housing Need Assessment Homeless Needs ‐ Families with children Economic Development Market Analysis
22
How was the Agency/Group/Organization consulted and what are the anticipated outcomes of the consultation or areas for improved coordination?
CSD contacted the Anchorage School District by e‐mail. The anticipated outcomes of the consultation were to improve coordination and to include their input in the Consolidated Plan and Action Plan.
Agency/Group/Organization ARC of Anchorage
Agency/Group/Organization Type Services‐Children Services‐Elderly Persons Services‐Persons with Disabilities Services‐Persons with HIV/AIDS Services‐homeless Services‐Health Services‐Education
23
What section of the Plan was addressed by Consultation?
Housing Need Assessment Homeless Needs ‐ Chronically homeless Homelessness Needs ‐ Veterans Homelessness Needs ‐ Unaccompanied youth Non‐Homeless Special Needs Market Analysis

Consolidated Plan ANCHORAGE 19
OMB Control No: 2506‐0117 (exp. 07/31/2015)
How was the Agency/Group/Organization consulted and what are the anticipated outcomes of the consultation or areas for improved coordination?
CSD contacted ARC of Anchorage by e‐mail. The anticipated outcomes of the consultation were to improve coordination and to include their input in the Consolidated Plan and Action Plan.
Agency/Group/Organization Brother Francis Shelter
Agency/Group/Organization Type Services‐Elderly Persons Services‐Persons with Disabilities Services‐Persons with HIV/AIDS Services‐homeless
What section of the Plan was addressed by Consultation?
Housing Need Assessment Homelessness Strategy Homeless Needs ‐ Chronically homeless Homeless Needs ‐ Families with children Homelessness Needs ‐ Veterans Homelessness Needs ‐ Unaccompanied youth Market Analysis
24
How was the Agency/Group/Organization consulted and what are the anticipated outcomes of the consultation or areas for improved coordination?
CSD contacted Brother Francis Shelter by e‐mail. The anticipated outcomes of the consultation were to improve coordination and to include their input in the Consolidated Plan and Action Plan.
Agency/Group/Organization Campfire USA Alaska Council
Agency/Group/Organization Type Services‐Children Services‐Persons with Disabilities Services‐Health Services‐Education
What section of the Plan was addressed by Consultation?
Housing Need Assessment Market Analysis
25
How was the Agency/Group/Organization consulted and what are the anticipated outcomes of the consultation or areas for improved coordination?
CSD contacted the Campfire USA Alaska Council by e‐mail. The anticipated outcomes of the consultation were to improve coordination and to include their input in the Consolidated Plan and Action Plan.
Agency/Group/Organization Catholic Social Services 26
Agency/Group/Organization Type Housing Services‐Children Services‐Elderly Persons Services‐Persons with Disabilities Services‐homeless Services‐Education

Consolidated Plan ANCHORAGE 20
OMB Control No: 2506‐0117 (exp. 07/31/2015)
What section of the Plan was addressed by Consultation?
Housing Need Assessment Homelessness Strategy Homeless Needs ‐ Chronically homeless Homeless Needs ‐ Families with children Homelessness Needs ‐ Veterans Homelessness Needs ‐ Unaccompanied youth Non‐Homeless Special Needs Market Analysis
How was the Agency/Group/Organization consulted and what are the anticipated outcomes of the consultation or areas for improved coordination?
CSD contacted CSS by e‐mail. The anticipated outcomes of the consultation were to improve coordination and to include their input in the Consolidated Plan and Action Plan.
Agency/Group/Organization Center for Drug Problems
Agency/Group/Organization Type Services‐Children Services‐Elderly Persons Services‐Persons with Disabilities Services‐Victims of Domestic Violence Services‐homeless Services‐Education
What section of the Plan was addressed by Consultation?
Housing Need Assessment Homelessness Strategy Homeless Needs ‐ Chronically homeless Homelessness Needs ‐ Veterans Homelessness Needs ‐ Unaccompanied youth Market Analysis
27
How was the Agency/Group/Organization consulted and what are the anticipated outcomes of the consultation or areas for improved coordination?
CSD contacted the Center for Drug Problems by e‐mail. The anticipated outcomes of the consultation were to improve coordination and to include their input in the Consolidated Plan and Action Plan.
Agency/Group/Organization Child in Transition/Homeless Project
Agency/Group/Organization Type Services‐Children Services‐homeless Services‐Education
What section of the Plan was addressed by Consultation?
Housing Need Assessment Homelessness Strategy Homeless Needs ‐ Chronically homeless Homeless Needs ‐ Families with children Homelessness Needs ‐ Unaccompanied youth Non‐Homeless Special Needs Market Analysis
28
How was the Agency/Group/Organization consulted and what are the anticipated outcomes of the consultation or areas for improved coordination?
CSD contacted the Child in Transition/Homeless Project by e‐mail. The anticipated outcomes of the consultation were to improve coordination and to include their input in the Consolidated Plan and Action Plan.

Consolidated Plan ANCHORAGE 21
OMB Control No: 2506‐0117 (exp. 07/31/2015)
Agency/Group/Organization Covenant House ‐ Alaska (CHA)
Agency/Group/Organization Type Housing Services‐Children Services‐Persons with Disabilities Services‐Persons with HIV/AIDS Services‐Victims of Domestic Violence Services‐homeless Services‐Education
What section of the Plan was addressed by Consultation?
Housing Need Assessment Homelessness Strategy Homeless Needs ‐ Chronically homeless Homelessness Needs ‐ Unaccompanied youth Market Analysis
29
How was the Agency/Group/Organization consulted and what are the anticipated outcomes of the consultation or areas for improved coordination?
CSD contacted CHA by e‐mail. The anticipated outcomes of the consultation were to improve coordination and to include their input in the Consolidated Plan and Action Plan.
Agency/Group/Organization Food Bank of Alaska
Agency/Group/Organization Type Services‐Children Services‐Elderly Persons Services‐Persons with Disabilities Services‐Persons with HIV/AIDS Services‐Victims of Domestic Violence Services‐homeless Services‐Education
What section of the Plan was addressed by Consultation?
Housing Need Assessment Homelessness Strategy Homeless Needs ‐ Chronically homeless Homeless Needs ‐ Families with children Homelessness Needs ‐ Veterans Homelessness Needs ‐ Unaccompanied youth Non‐Homeless Special Needs Economic Development Market Analysis
30
How was the Agency/Group/Organization consulted and what are the anticipated outcomes of the consultation or areas for improved coordination?
CSD contacted the Food Bank of Alaska by e‐mail. The anticipated outcomes of the consultation were to improve coordination and to include their input in the Consolidated Plan and Action Plan.
Agency/Group/Organization HABITAT FOR HUMANITY 31
Agency/Group/Organization Type Housing Services‐Children Services‐Elderly Persons Services‐Persons with Disabilities Services‐homeless Service‐Fair Housing

Consolidated Plan ANCHORAGE 22
OMB Control No: 2506‐0117 (exp. 07/31/2015)
What section of the Plan was addressed by Consultation?
Housing Need Assessment Homelessness Strategy Homeless Needs ‐ Chronically homeless Homeless Needs ‐ Families with children Homelessness Needs ‐ Veterans Homelessness Needs ‐ Unaccompanied youth Market Analysis
How was the Agency/Group/Organization consulted and what are the anticipated outcomes of the consultation or areas for improved coordination?
CSD contacted the Child in Transition/Homeless Project by e‐mail. The anticipated outcomes of the consultation were to improve coordination and to include their input in the Consolidated Plan and Action Plan.
Agency/Group/Organization Home Accessibilities
Agency/Group/Organization Type Housing Services‐Children Services‐Elderly Persons Services‐Persons with Disabilities Services‐Education
What section of the Plan was addressed by Consultation?
Housing Need Assessment Non‐Homeless Special Needs Market Analysis
32
How was the Agency/Group/Organization consulted and what are the anticipated outcomes of the consultation or areas for improved coordination?
CSD contacted the Home Accessibilities by e‐mail. The anticipated outcomes of the consultation were to improve coordination and to include their input in the Consolidated Plan and Action Plan.
Agency/Group/Organization Hope Community Resources
Agency/Group/Organization Type Housing Services‐Children Services‐Elderly Persons Services‐Persons with Disabilities Services‐homeless Services‐Education
What section of the Plan was addressed by Consultation?
Housing Need Assessment Homelessness Strategy Homeless Needs ‐ Chronically homeless Homeless Needs ‐ Families with children Homelessness Needs ‐ Veterans Homelessness Needs ‐ Unaccompanied youth Non‐Homeless Special Needs Market Analysis
33
How was the Agency/Group/Organization consulted and what are the anticipated outcomes of the consultation or areas for improved coordination?
CSD contacted Hope Community Resources by e‐mail. The anticipated outcomes of the consultation were to improve coordination and to include their input in the Consolidated Plan and Action Plan.

Consolidated Plan ANCHORAGE 23
OMB Control No: 2506‐0117 (exp. 07/31/2015)
Agency/Group/Organization KPB Architects
Agency/Group/Organization Type Housing Services‐Children Services‐Elderly Persons Services‐Persons with Disabilities Services‐homeless
What section of the Plan was addressed by Consultation?
Housing Need Assessment Market Analysis
34
How was the Agency/Group/Organization consulted and what are the anticipated outcomes of the consultation or areas for improved coordination?
CSD contacted KPB Architects by e‐mail. The anticipated outcomes of the consultation were to improve coordination and to include their input in the Consolidated Plan and Action Plan.
Agency/Group/Organization Muldoon Safe Harbor Inn
Agency/Group/Organization Type Housing Services‐Children Services‐Elderly Persons Services‐Persons with Disabilities Services‐Persons with HIV/AIDS Services‐Victims of Domestic Violence Services‐homeless
What section of the Plan was addressed by Consultation?
Housing Need Assessment Homelessness Strategy Homeless Needs ‐ Chronically homeless Homeless Needs ‐ Families with children Homelessness Needs ‐ Veterans Homelessness Needs ‐ Unaccompanied youth Market Analysis
35
How was the Agency/Group/Organization consulted and what are the anticipated outcomes of the consultation or areas for improved coordination?
CSD contacted Muldoon Safe Harbor Inn by e‐mail. The anticipated outcomes of the consultation were to improve coordination and to include their input in the Consolidated Plan and Action Plan.
Agency/Group/Organization NEIGHBORWORKS ANCHORAGE 36
Agency/Group/Organization Type Housing Services‐Children Services‐Elderly Persons Services‐Persons with Disabilities Services‐Persons with HIV/AIDS Services‐Victims of Domestic Violence Services‐homeless Services‐Education

Consolidated Plan ANCHORAGE 24
OMB Control No: 2506‐0117 (exp. 07/31/2015)
What section of the Plan was addressed by Consultation?
Housing Need Assessment Public Housing Needs Homelessness Strategy Homeless Needs ‐ Chronically homeless Homeless Needs ‐ Families with children Homelessness Needs ‐ Veterans Homelessness Needs ‐ Unaccompanied youth Non‐Homeless Special Needs
How was the Agency/Group/Organization consulted and what are the anticipated outcomes of the consultation or areas for improved coordination?
CSD contacted NeighborWorks by e‐mail. The anticipated outcomes of the consultation were to improve coordination and to include their input in the Consolidated Plan and Action Plan. NeighborWorks provided comments on the AP.
Agency/Group/Organization New Life Development
Agency/Group/Organization Type Housing Services‐Children Services‐Elderly Persons Services‐Persons with Disabilities Services‐Persons with HIV/AIDS Services‐homeless Services‐Health Services‐Education
What section of the Plan was addressed by Consultation?
Housing Need Assessment Homelessness Strategy Homeless Needs ‐ Chronically homeless Homeless Needs ‐ Families with children Homelessness Needs ‐ Veterans Homelessness Needs ‐ Unaccompanied youth Market Analysis
37
How was the Agency/Group/Organization consulted and what are the anticipated outcomes of the consultation or areas for improved coordination?
CSD contacted New Life Development by e‐mail and by phone. The anticipated outcomes of the consultation were to improve coordination and to include their input in the Consolidated Plan and Action Plan.
Agency/Group/Organization Partners for Progress 38
Agency/Group/Organization Type Housing Services‐Elderly Persons Services‐Persons with Disabilities Services‐Persons with HIV/AIDS Services‐homeless Services‐Education

Consolidated Plan ANCHORAGE 25
OMB Control No: 2506‐0117 (exp. 07/31/2015)
What section of the Plan was addressed by Consultation?
Housing Need Assessment Homelessness Strategy Homeless Needs ‐ Chronically homeless Homeless Needs ‐ Families with children Homelessness Needs ‐ Veterans Homelessness Needs ‐ Unaccompanied youth Non‐Homeless Special Needs Market Analysis
How was the Agency/Group/Organization consulted and what are the anticipated outcomes of the consultation or areas for improved coordination?
CSD contacted Partners for Progress Inn by e‐mail. The anticipated outcomes of the consultation were to improve coordination and to include their input in the Consolidated Plan and Action Plan.
Agency/Group/Organization Providence Hospital Alaska Cares
Agency/Group/Organization Type Housing Services‐Children Services‐Victims of Domestic Violence Services‐Health Services‐Education Health Agency
What section of the Plan was addressed by Consultation?
Housing Need Assessment Market Analysis
39
How was the Agency/Group/Organization consulted and what are the anticipated outcomes of the consultation or areas for improved coordination?
CSD contacted Providence Hospital Alaska Cares by e‐mail. The anticipated outcomes of the consultation were to improve coordination and to include their input in the Consolidated Plan and Action Plan.
Agency/Group/Organization RurAL CAP
Agency/Group/Organization Type Housing Services‐Children Services‐Elderly Persons Services‐Persons with Disabilities Services‐Persons with HIV/AIDS Services‐Victims of Domestic Violence Services‐homeless Services‐Education
40
What section of the Plan was addressed by Consultation?
Housing Need Assessment Homelessness Strategy Homeless Needs ‐ Chronically homeless Homeless Needs ‐ Families with children Homelessness Needs ‐ Veterans Homelessness Needs ‐ Unaccompanied youth Non‐Homeless Special Needs Market Analysis
Consolidated Plan ANCHORAGE 26
OMB Control No: 2506‐0117 (exp. 07/31/2015)
How was the Agency/Group/Organization consulted and what are the anticipated outcomes of the consultation or areas for improved coordination?
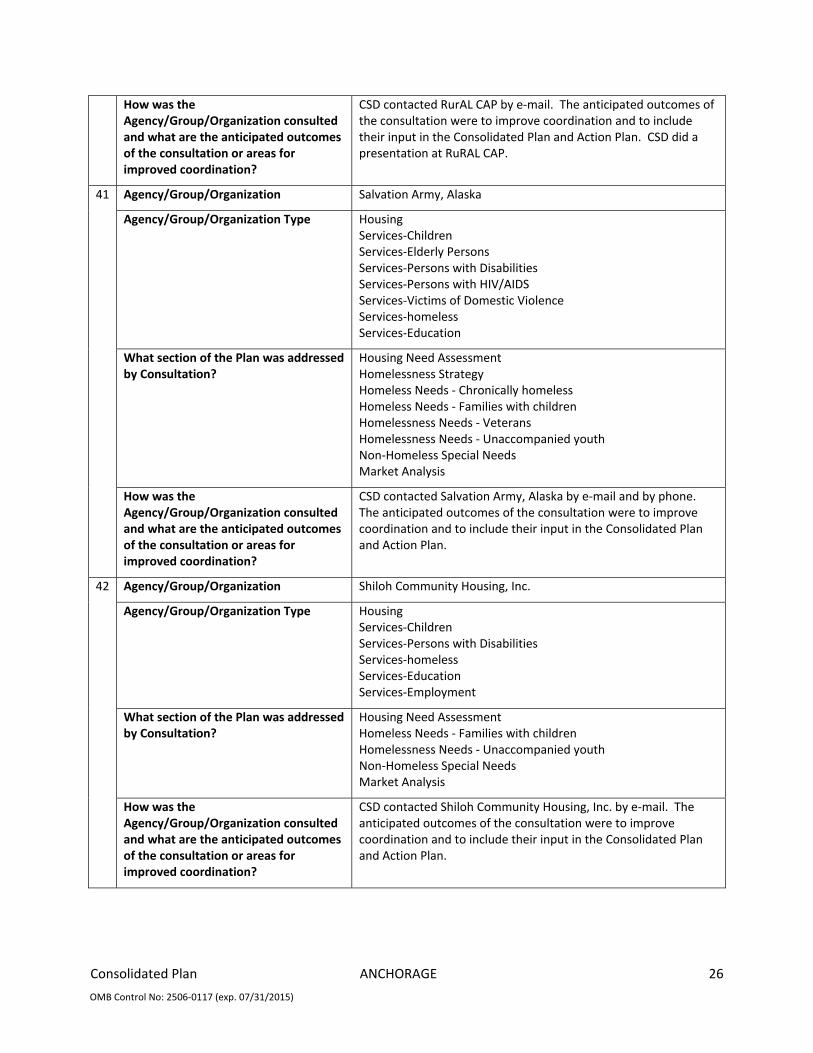
CSD contacted RurAL CAP by e‐mail. The anticipated outcomes of the consultation were to improve coordination and to include their input in the Consolidated Plan and Action Plan. CSD did a presentation at RuRAL CAP.
Agency/Group/Organization Salvation Army, Alaska
Agency/Group/Organization Type Housing Services‐Children Services‐Elderly Persons Services‐Persons with Disabilities Services‐Persons with HIV/AIDS Services‐Victims of Domestic Violence Services‐homeless Services‐Education
What section of the Plan was addressed by Consultation?
Housing Need Assessment Homelessness Strategy Homeless Needs ‐ Chronically homeless Homeless Needs ‐ Families with children Homelessness Needs ‐ Veterans Homelessness Needs ‐ Unaccompanied youth Non‐Homeless Special Needs Market Analysis
41
How was the Agency/Group/Organization consulted and what are the anticipated outcomes of the consultation or areas for improved coordination?
CSD contacted Salvation Army, Alaska by e‐mail and by phone. The anticipated outcomes of the consultation were to improve coordination and to include their input in the Consolidated Plan and Action Plan.
Agency/Group/Organization Shiloh Community Housing, Inc.
Agency/Group/Organization Type Housing Services‐Children Services‐Persons with Disabilities Services‐homeless Services‐Education Services‐Employment
What section of the Plan was addressed by Consultation?
Housing Need Assessment Homeless Needs ‐ Families with children Homelessness Needs ‐ Unaccompanied youth Non‐Homeless Special Needs Market Analysis
42
How was the Agency/Group/Organization consulted and what are the anticipated outcomes of the consultation or areas for improved coordination?
CSD contacted Shiloh Community Housing, Inc. by e‐mail. The anticipated outcomes of the consultation were to improve coordination and to include their input in the Consolidated Plan and Action Plan.
Consolidated Plan ANCHORAGE 27
OMB Control No: 2506‐0117 (exp. 07/31/2015)
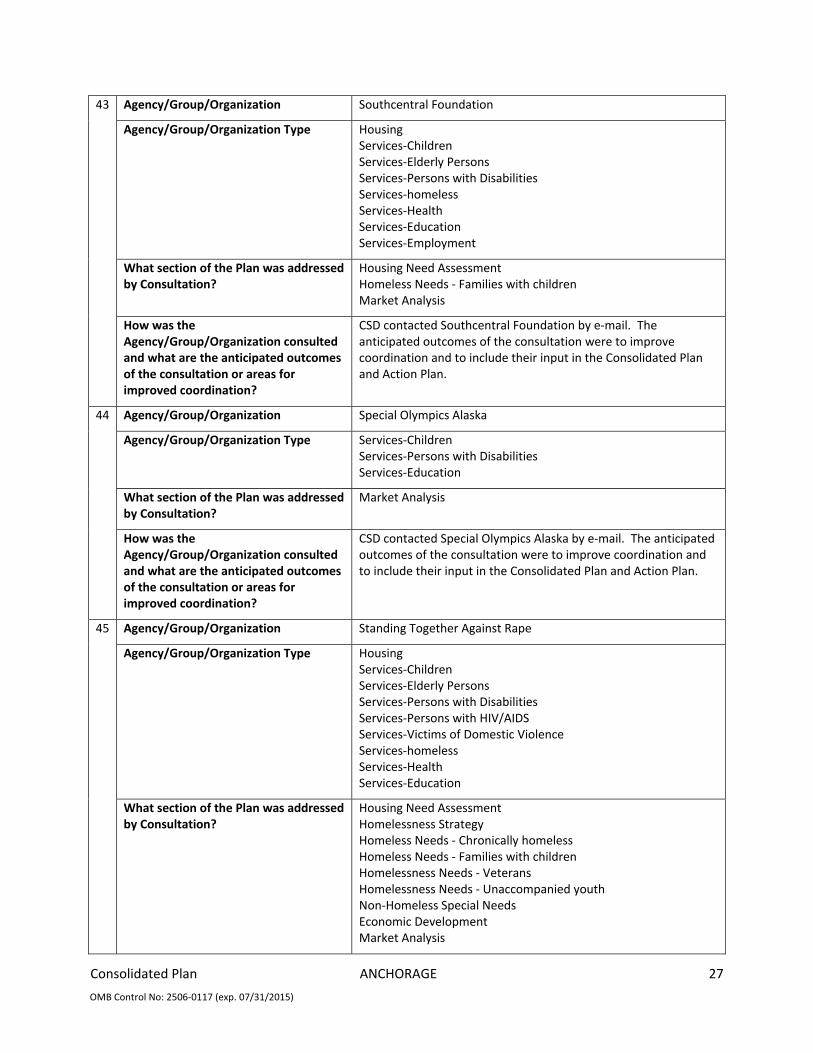
Agency/Group/Organization Southcentral Foundation
Agency/Group/Organization Type Housing Services‐Children Services‐Elderly Persons Services‐Persons with Disabilities Services‐homeless Services‐Health Services‐Education Services‐Employment
What section of the Plan was addressed by Consultation?
Housing Need Assessment Homeless Needs ‐ Families with children Market Analysis
43
How was the Agency/Group/Organization consulted and what are the anticipated outcomes of the consultation or areas for improved coordination?
CSD contacted Southcentral Foundation by e‐mail. The anticipated outcomes of the consultation were to improve coordination and to include their input in the Consolidated Plan and Action Plan.
Agency/Group/Organization Special Olympics Alaska
Agency/Group/Organization Type Services‐Children Services‐Persons with Disabilities Services‐Education
What section of the Plan was addressed by Consultation?
Market Analysis
44
How was the Agency/Group/Organization consulted and what are the anticipated outcomes of the consultation or areas for improved coordination?
CSD contacted Special Olympics Alaska by e‐mail. The anticipated outcomes of the consultation were to improve coordination and to include their input in the Consolidated Plan and Action Plan.
Agency/Group/Organization Standing Together Against Rape
Agency/Group/Organization Type Housing Services‐Children Services‐Elderly Persons Services‐Persons with Disabilities Services‐Persons with HIV/AIDS Services‐Victims of Domestic Violence Services‐homeless Services‐Health Services‐Education
45
What section of the Plan was addressed by Consultation?
Housing Need Assessment Homelessness Strategy Homeless Needs ‐ Chronically homeless Homeless Needs ‐ Families with children Homelessness Needs ‐ Veterans Homelessness Needs ‐ Unaccompanied youth Non‐Homeless Special Needs Economic Development Market Analysis

Consolidated Plan ANCHORAGE 28
OMB Control No: 2506‐0117 (exp. 07/31/2015)
How was the Agency/Group/Organization consulted and what are the anticipated outcomes of the consultation or areas for improved coordination?
CSD contacted STAR by e‐mail. The anticipated outcomes of the consultation were to improve coordination and to include their input in the Consolidated Plan and Action Plan.
Agency/Group/Organization The Alaska Veterans Foundation
Agency/Group/Organization Type Housing Services‐Elderly Persons Services‐Persons with Disabilities Services‐Persons with HIV/AIDS Services‐homeless Services‐Education
What section of the Plan was addressed by Consultation?
Housing Need Assessment Homelessness Strategy Homeless Needs ‐ Chronically homeless Homeless Needs ‐ Families with children Homelessness Needs ‐ Veterans Homelessness Needs ‐ Unaccompanied youth Market Analysis
46
How was the Agency/Group/Organization consulted and what are the anticipated outcomes of the consultation or areas for improved coordination?
CSD contacted The Alaska Veterans Foundation by e‐mail. The anticipated outcomes of the consultation were to improve coordination and to include their input in the Consolidated Plan and Action Plan.
Agency/Group/Organization United Way of Anchorage
Agency/Group/Organization Type Housing Services‐Children Services‐Elderly Persons Services‐Persons with Disabilities Services‐homeless Services‐Health Services‐Education
What section of the Plan was addressed by Consultation?
Housing Need Assessment Homelessness Strategy Homeless Needs ‐ Chronically homeless Homeless Needs ‐ Families with children Homelessness Needs ‐ Unaccompanied youth Non‐Homeless Special Needs Market Analysis
47
How was the Agency/Group/Organization consulted and what are the anticipated outcomes of the consultation or areas for improved coordination?
CSD contacted the United Way by e‐mail. The anticipated outcomes of the consultation were to improve coordination and to include their input in the Consolidated Plan and Action Plan.

Consolidated Plan ANCHORAGE 29
OMB Control No: 2506‐0117 (exp. 07/31/2015)
Agency/Group/Organization Veterans Administration
Agency/Group/Organization Type Housing Services‐Elderly Persons Services‐Persons with Disabilities Services‐Persons with HIV/AIDS Services‐homeless Services‐Education Other government ‐ Federal
What section of the Plan was addressed by Consultation?
Housing Need Assessment Homelessness Strategy Homeless Needs ‐ Chronically homeless Homeless Needs ‐ Families with children Homelessness Needs ‐ Veterans Homelessness Needs ‐ Unaccompanied youth Non‐Homeless Special Needs Market Analysis
48
How was the Agency/Group/Organization consulted and what are the anticipated outcomes of the consultation or areas for improved coordination?
CSD contacted the VA by e‐mail. The anticipated outcomes of the consultation were to improve coordination and to include their input in the Consolidated Plan and Action Plan.
Agency/Group/Organization Volunteers of American Alaska
Agency/Group/Organization Type Housing Services‐Elderly Persons Services‐Persons with Disabilities Services‐homeless
What section of the Plan was addressed by Consultation?
Housing Need Assessment Homelessness Strategy Homeless Needs ‐ Families with children Homelessness Needs ‐ Veterans Homelessness Needs ‐ Unaccompanied youth Market Analysis
49
How was the Agency/Group/Organization consulted and what are the anticipated outcomes of the consultation or areas for improved coordination?
CSD contacted the Volunteers of American Alaska by e‐mail. The anticipated outcomes of the consultation were to improve coordination and to include their input in the Consolidated Plan and Action Plan.
Agency/Group/Organization Anchorage Senior Activities Center Endowment Fund
Agency/Group/Organization Type Services‐Elderly Persons Services‐Persons with Disabilities Services‐Health Services‐Education
50
What section of the Plan was addressed by Consultation?
Homelessness Strategy Non‐Homeless Special Needs Market Analysis

Consolidated Plan ANCHORAGE 30
OMB Control No: 2506‐0117 (exp. 07/31/2015)
How was the Agency/Group/Organization consulted and what are the anticipated outcomes of the consultation or areas for improved coordination?
CSD contacted the Anchorage Senior Activities Center Endowment Fund by e‐mail. The anticipated outcomes of the consultation were to improve coordination and to include their input in the Consolidated Plan and Action Plan.
Agency/Group/Organization Bean's Cafe
Agency/Group/Organization Type Services‐Children Services‐Elderly Persons Services‐Persons with Disabilities Services‐Persons with HIV/AIDS Services‐Victims of Domestic Violence Services‐homeless
What section of the Plan was addressed by Consultation?
Housing Need Assessment Homeless Needs ‐ Chronically homeless Homeless Needs ‐ Families with children Homelessness Needs ‐ Veterans Homelessness Needs ‐ Unaccompanied youth Market Analysis
51
How was the Agency/Group/Organization consulted and what are the anticipated outcomes of the consultation or areas for improved coordination?
CSD contacted Bean's Cafe by e‐mail. The anticipated outcomes of the consultation were to improve coordination and to include their input in the Consolidated Plan and Action Plan.
Agency/Group/Organization Center for Human Development/UAA
Agency/Group/Organization Type Services‐Children Services‐Elderly Persons Services‐Persons with Disabilities Services‐Education
What section of the Plan was addressed by Consultation?
Housing Need Assessment Homeless Needs ‐ Families with children Homelessness Needs ‐ Veterans Homelessness Needs ‐ Unaccompanied youth Non‐Homeless Special Needs Market Analysis
52
How was the Agency/Group/Organization consulted and what are the anticipated outcomes of the consultation or areas for improved coordination?
CSD contacted the V Center for Human Development/UAA by e‐mail. The anticipated outcomes of the consultation were to improve coordination and to include their input in the Consolidated Plan and Action Plan.
Agency/Group/Organization Cook Inlet Housing Authority 53
Agency/Group/Organization Type Housing Services‐Children Services‐Elderly Persons Services‐homeless Service‐Fair Housing

Consolidated Plan ANCHORAGE 31
OMB Control No: 2506‐0117 (exp. 07/31/2015)
What section of the Plan was addressed by Consultation?
Housing Need Assessment Public Housing Needs Homeless Needs ‐ Families with children Non‐Homeless Special Needs Market Analysis
How was the Agency/Group/Organization consulted and what are the anticipated outcomes of the consultation or areas for improved coordination?
CSD contacted Cook Inlet Housing Authority by e‐mail and by phone. The anticipated outcomes of the consultation were to improve coordination and to include their input in the Consolidated Plan and Action Plan. They provided information for the CP.
Agency/Group/Organization American Red Cross
Agency/Group/Organization Type Housing Services‐Children Services‐Elderly Persons Services‐Persons with Disabilities Services‐Persons with HIV/AIDS Services‐homeless Services‐Health
What section of the Plan was addressed by Consultation?
Housing Need Assessment Homelessness Strategy Homeless Needs ‐ Chronically homeless Homeless Needs ‐ Families with children Homelessness Needs ‐ Veterans Homelessness Needs ‐ Unaccompanied youth Market Analysis
54
How was the Agency/Group/Organization consulted and what are the anticipated outcomes of the consultation or areas for improved coordination?
CSD contacted the American Red Cross by e‐mail. The anticipated outcomes of the consultation were to improve coordination and to include their input in the Consolidated Plan and Action Plan.
Agency/Group/Organization Community Council Center
Agency/Group/Organization Type Housing Services‐Children Services‐Elderly Persons Services‐Persons with Disabilities Services‐Education
What section of the Plan was addressed by Consultation?
Housing Need Assessment Non‐Homeless Special Needs Market Analysis
55
How was the Agency/Group/Organization consulted and what are the anticipated outcomes of the consultation or areas for improved coordination?
CSD contacted the Community Council Center by e‐mail. The anticipated outcomes of the consultation were to improve coordination and to include their input in the Consolidated Plan and Action Plan.

Consolidated Plan ANCHORAGE 32
OMB Control No: 2506‐0117 (exp. 07/31/2015)
Agency/Group/Organization Alaska Native Justice Center Inc.
Agency/Group/Organization Type Housing Services‐Children Services‐Elderly Persons Services‐Persons with Disabilities Services‐Persons with HIV/AIDS Services‐Victims of Domestic Violence Services‐homeless Services‐Education
What section of the Plan was addressed by Consultation?
Housing Need Assessment Homeless Needs ‐ Chronically homeless Homeless Needs ‐ Families with children Homelessness Needs ‐ Veterans Homelessness Needs ‐ Unaccompanied youth Non‐Homeless Special Needs Market Analysis
56
How was the Agency/Group/Organization consulted and what are the anticipated outcomes of the consultation or areas for improved coordination?
CSD contacted Alaska Native Justice Center Inc. by e‐mail. The anticipated outcomes of the consultation were to improve coordination and to include their input in the Consolidated Plan and Action Plan.
Agency/Group/Organization Kids' Corp. Inc.
Agency/Group/Organization Type Services‐Children Services‐Education
What section of the Plan was addressed by Consultation?
Housing Need Assessment Non‐Homeless Special Needs Market Analysis
57
How was the Agency/Group/Organization consulted and what are the anticipated outcomes of the consultation or areas for improved coordination?
CSD contacted Kids' Corp. by e‐mail. The anticipated outcomes of the consultation were to improve coordination and to include their input in the Consolidated Plan and Action Plan.
Agency/Group/Organization Cultural and Recreational Services
Agency/Group/Organization Type Services‐Children Services‐Elderly Persons Services‐Education
What section of the Plan was addressed by Consultation?
Housing Need Assessment Market Analysis
58
How was the Agency/Group/Organization consulted and what are the anticipated outcomes of the consultation or areas for improved coordination?
CSD contacted Cultural and Recreational Services by e‐mail. The anticipated outcomes of the consultation were to improve coordination and to include their input in the Consolidated Plan and Action Plan.
Consolidated Plan ANCHORAGE 33
OMB Control No: 2506‐0117 (exp. 07/31/2015)
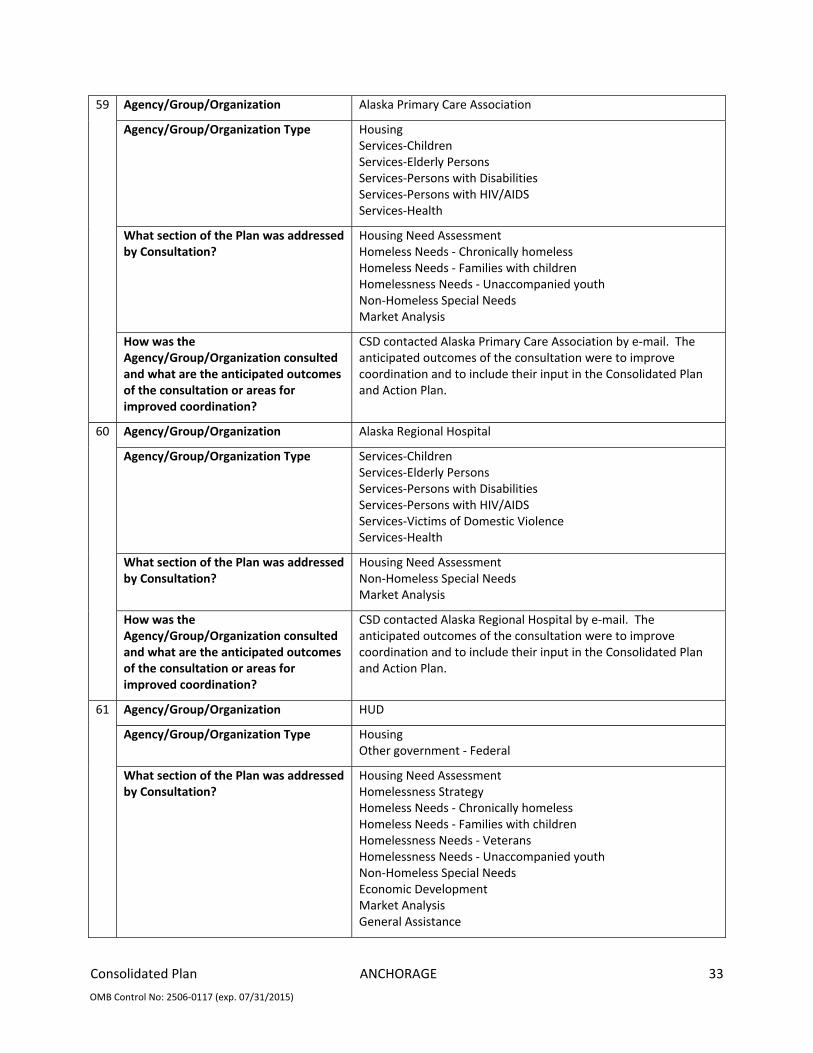
Agency/Group/Organization Alaska Primary Care Association
Agency/Group/Organization Type Housing Services‐Children Services‐Elderly Persons Services‐Persons with Disabilities Services‐Persons with HIV/AIDS Services‐Health
What section of the Plan was addressed by Consultation?
Housing Need Assessment Homeless Needs ‐ Chronically homeless Homeless Needs ‐ Families with children Homelessness Needs ‐ Unaccompanied youth Non‐Homeless Special Needs Market Analysis
59
How was the Agency/Group/Organization consulted and what are the anticipated outcomes of the consultation or areas for improved coordination?
CSD contacted Alaska Primary Care Association by e‐mail. The anticipated outcomes of the consultation were to improve coordination and to include their input in the Consolidated Plan and Action Plan.
Agency/Group/Organization Alaska Regional Hospital
Agency/Group/Organization Type Services‐Children Services‐Elderly Persons Services‐Persons with Disabilities Services‐Persons with HIV/AIDS Services‐Victims of Domestic Violence Services‐Health
What section of the Plan was addressed by Consultation?
Housing Need Assessment Non‐Homeless Special Needs Market Analysis
60
How was the Agency/Group/Organization consulted and what are the anticipated outcomes of the consultation or areas for improved coordination?
CSD contacted Alaska Regional Hospital by e‐mail. The anticipated outcomes of the consultation were to improve coordination and to include their input in the Consolidated Plan and Action Plan.
Agency/Group/Organization HUD
Agency/Group/Organization Type Housing Other government ‐ Federal
61
What section of the Plan was addressed by Consultation?
Housing Need Assessment Homelessness Strategy Homeless Needs ‐ Chronically homeless Homeless Needs ‐ Families with children Homelessness Needs ‐ Veterans Homelessness Needs ‐ Unaccompanied youth Non‐Homeless Special Needs Economic Development Market Analysis General Assistance

Consolidated Plan ANCHORAGE 34
OMB Control No: 2506‐0117 (exp. 07/31/2015)
How was the Agency/Group/Organization consulted and what are the anticipated outcomes of the consultation or areas for improved coordination?
CSD contacted HUD by e‐mail and by phone. The anticipated outcomes of the consultation were to improve coordination and to include their input in the Consolidated Plan and Action Plan.
Agency/Group/Organization American Lung Association
Agency/Group/Organization Type Services‐Health
What section of the Plan was addressed by Consultation?
Housing Need Assessment Market Analysis
62
How was the Agency/Group/Organization consulted and what are the anticipated outcomes of the consultation or areas for improved coordination?
CSD contacted American Lung Association by e‐mail. The anticipated outcomes of the consultation were to improve coordination and to include their input in the Consolidated Plan and Action Plan.
Agency/Group/Organization Anchorage Citizens Coalition
Agency/Group/Organization Type Housing Planning organization
What section of the Plan was addressed by Consultation?
Housing Need Assessment Economic Development Market Analysis
63
How was the Agency/Group/Organization consulted and what are the anticipated outcomes of the consultation or areas for improved coordination?
CSD contacted Anchorage Citizens Coalition by e‐mail. The anticipated outcomes of the consultation were to improve coordination and to include their input in the Consolidated Plan and Action Plan.
Agency/Group/Organization Anchorage Equal Rights Commission
Agency/Group/Organization Type Housing Services‐Employment Service‐Fair Housing Other government ‐ Local
What section of the Plan was addressed by Consultation?
Housing Need Assessment Economic Development Market Analysis
64
How was the Agency/Group/Organization consulted and what are the anticipated outcomes of the consultation or areas for improved coordination?
CSD contacted Anchorage Equal Rights Commission by e‐mail. The anticipated outcomes of the consultation were to improve coordination and to include their input in the Consolidated Plan and Action Plan.
Agency/Group/Organization Anchorage Rescue Mission 65
Agency/Group/Organization Type Housing Services‐Persons with Disabilities Services‐homeless

Consolidated Plan ANCHORAGE 35
OMB Control No: 2506‐0117 (exp. 07/31/2015)
What section of the Plan was addressed by Consultation?
Housing Need Assessment Homelessness Strategy Homeless Needs ‐ Chronically homeless Homeless Needs ‐ Families with children Homelessness Needs ‐ Veterans Homelessness Needs ‐ Unaccompanied youth Market Analysis
How was the Agency/Group/Organization consulted and what are the anticipated outcomes of the consultation or areas for improved coordination?
CSD contacted Anchorage Rescue Mission by e‐mail. The anticipated outcomes of the consultation were to improve coordination and to include their input in the Consolidated Plan and Action Plan.
Agency/Group/Organization Anchorage Water & Wastewater Utility
Agency/Group/Organization Type Services‐Health Other government ‐ Local
What section of the Plan was addressed by Consultation?
Housing Need Assessment Non‐Homeless Special Needs Economic Development Market Analysis
66
How was the Agency/Group/Organization consulted and what are the anticipated outcomes of the consultation or areas for improved coordination?
CSD contacted AWWU by e‐mail. The anticipated outcomes of the consultation were to improve coordination and to include their input in the Consolidated Plan and Action Plan.
Agency/Group/Organization Anchorage's Promise
Agency/Group/Organization Type Services‐Children
What section of the Plan was addressed by Consultation?
Housing Need Assessment Homelessness Strategy Homeless Needs ‐ Chronically homeless Homeless Needs ‐ Families with children Homelessness Needs ‐ Veterans Homelessness Needs ‐ Unaccompanied youth Market Analysis
67
How was the Agency/Group/Organization consulted and what are the anticipated outcomes of the consultation or areas for improved coordination?
CSD contacted Anchorage's Promise by e‐mail. The anticipated outcomes of the consultation were to improve coordination and to include their input in the Consolidated Plan and Action Plan.
Agency/Group/Organization CDI‐ALASKA, INC.
Agency/Group/Organization Type Housing Business Leaders
68
What section of the Plan was addressed by Consultation?
Housing Need Assessment Economic Development Market Analysis

Consolidated Plan ANCHORAGE 36
OMB Control No: 2506‐0117 (exp. 07/31/2015)
How was the Agency/Group/Organization consulted and what are the anticipated outcomes of the consultation or areas for improved coordination?
CSD contacted CDI‐Alaska by e‐mail. The anticipated outcomes of the consultation were to improve coordination and to include their input in the Consolidated Plan and Action Plan.
Agency/Group/Organization Christian Health Assoc.
Agency/Group/Organization Type Services‐Health Services‐Education
What section of the Plan was addressed by Consultation?
Housing Need Assessment Homeless Needs ‐ Chronically homeless Non‐Homeless Special Needs Market Analysis
69
How was the Agency/Group/Organization consulted and what are the anticipated outcomes of the consultation or areas for improved coordination?
CSD contacted Christian Health Associates by e‐mail. The anticipated outcomes of the consultation were to improve coordination and to include their input in the Consolidated Plan and Action Plan.
Agency/Group/Organization Older Persons Action Group
Agency/Group/Organization Type Services‐Elderly Persons
What section of the Plan was addressed by Consultation?
Housing Need Assessment Market Analysis
70
How was the Agency/Group/Organization consulted and what are the anticipated outcomes of the consultation or areas for improved coordination?
CSD contacted OPAG by e‐mail. The anticipated outcomes of the consultation were to improve coordination and to include their input in the Consolidated Plan and Action Plan.
Agency/Group/Organization Spinell Homes
Agency/Group/Organization Type Housing
What section of the Plan was addressed by Consultation?
Housing Need Assessment Economic Development Market Analysis
71
How was the Agency/Group/Organization consulted and what are the anticipated outcomes of the consultation or areas for improved coordination?
CSD contacted Spinell Homes by e‐mail. The anticipated outcomes of the consultation were to improve coordination and to include their input in the Consolidated Plan and Action Plan.
Agency/Group/Organization United Methodist Women
Agency/Group/Organization Type Services‐Children Services‐Elderly Persons Services‐Persons with Disabilities Services‐homeless
72
What section of the Plan was addressed by Consultation?
Housing Need Assessment Market Analysis
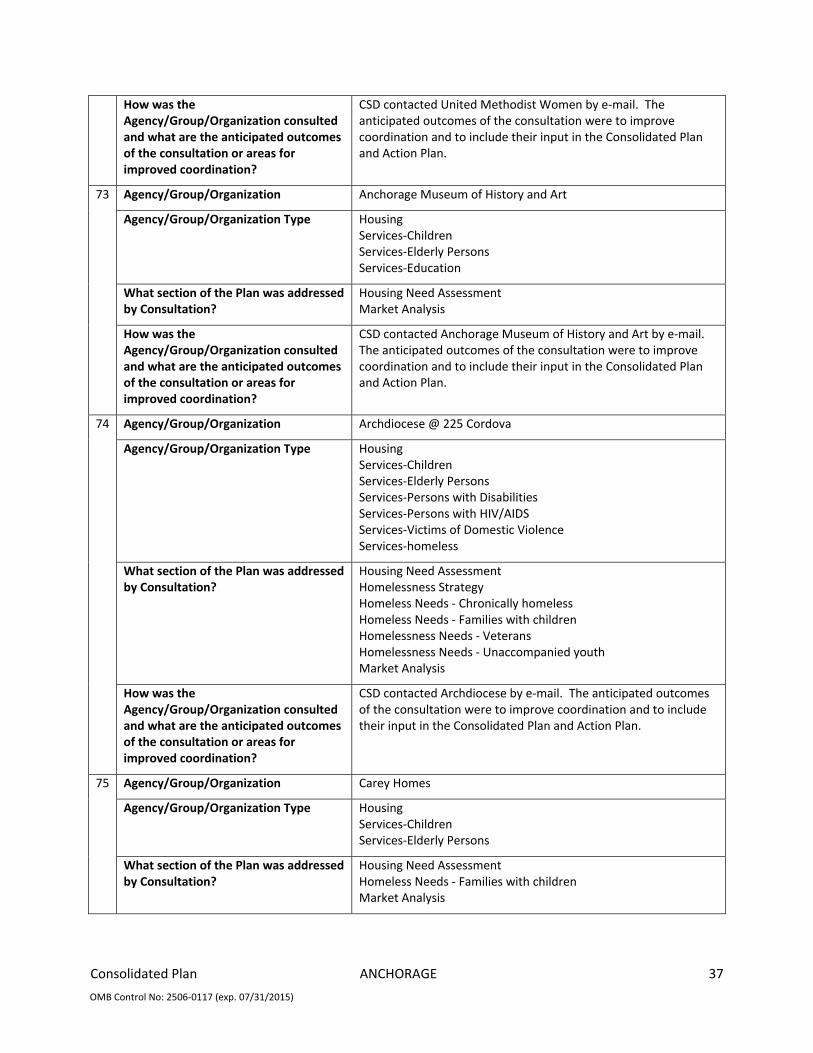
Consolidated Plan ANCHORAGE 37
OMB Control No: 2506‐0117 (exp. 07/31/2015)
How was the Agency/Group/Organization consulted and what are the anticipated outcomes of the consultation or areas for improved coordination?
CSD contacted United Methodist Women by e‐mail. The anticipated outcomes of the consultation were to improve coordination and to include their input in the Consolidated Plan and Action Plan.
Agency/Group/Organization Anchorage Museum of History and Art
Agency/Group/Organization Type Housing Services‐Children Services‐Elderly Persons Services‐Education
What section of the Plan was addressed by Consultation?
Housing Need Assessment Market Analysis
73
How was the Agency/Group/Organization consulted and what are the anticipated outcomes of the consultation or areas for improved coordination?
CSD contacted Anchorage Museum of History and Art by e‐mail. The anticipated outcomes of the consultation were to improve coordination and to include their input in the Consolidated Plan and Action Plan.
Agency/Group/Organization Archdiocese @ 225 Cordova
Agency/Group/Organization Type Housing Services‐Children Services‐Elderly Persons Services‐Persons with Disabilities Services‐Persons with HIV/AIDS Services‐Victims of Domestic Violence Services‐homeless
What section of the Plan was addressed by Consultation?
Housing Need Assessment Homelessness Strategy Homeless Needs ‐ Chronically homeless Homeless Needs ‐ Families with children Homelessness Needs ‐ Veterans Homelessness Needs ‐ Unaccompanied youth Market Analysis
74
How was the Agency/Group/Organization consulted and what are the anticipated outcomes of the consultation or areas for improved coordination?
CSD contacted Archdiocese by e‐mail. The anticipated outcomes of the consultation were to improve coordination and to include their input in the Consolidated Plan and Action Plan.
Agency/Group/Organization Carey Homes
Agency/Group/Organization Type Housing Services‐Children Services‐Elderly Persons
75
What section of the Plan was addressed by Consultation?
Housing Need Assessment Homeless Needs ‐ Families with children Market Analysis

Consolidated Plan ANCHORAGE 38
OMB Control No: 2506‐0117 (exp. 07/31/2015)
How was the Agency/Group/Organization consulted and what are the anticipated outcomes of the consultation or areas for improved coordination?
CSD contacted Carey Homes by e‐mail. The anticipated outcomes of the consultation were to improve coordination and to include their input in the Consolidated Plan and Action Plan.
Agency/Group/Organization Civilian Personnel Advisory Center
Agency/Group/Organization Type Housing Services‐homeless Services‐Education Services‐Employment
What section of the Plan was addressed by Consultation?
Housing Need Assessment Homelessness Needs ‐ Veterans Economic Development Market Analysis
76
How was the Agency/Group/Organization consulted and what are the anticipated outcomes of the consultation or areas for improved coordination?
CSD contacted Civilian Personnel Advisory Center by e‐mail. The anticipated outcomes of the consultation were to improve coordination and to include their input in the Consolidated Plan and Action Plan.
Agency/Group/Organization Community Development Inc.
Agency/Group/Organization Type Housing Services‐Children Services‐Elderly Persons Services‐Persons with Disabilities Services‐Persons with HIV/AIDS Services‐Victims of Domestic Violence Services‐homeless Service‐Fair Housing
What section of the Plan was addressed by Consultation?
Housing Need Assessment Public Housing Needs Homeless Needs ‐ Chronically homeless Homeless Needs ‐ Families with children Homelessness Needs ‐ Veterans Homelessness Needs ‐ Unaccompanied youth Non‐Homeless Special Needs Market Analysis
77
How was the Agency/Group/Organization consulted and what are the anticipated outcomes of the consultation or areas for improved coordination?
CSD contacted CDI by e‐mail. The anticipated outcomes of the consultation were to improve coordination and to include their input in the Consolidated Plan and Action Plan.
Agency/Group/Organization HDR Alaska, Inc.
Agency/Group/Organization Type Housing Planning organization
78
What section of the Plan was addressed by Consultation?
Housing Need Assessment Market Analysis

Consolidated Plan ANCHORAGE 39
OMB Control No: 2506‐0117 (exp. 07/31/2015)
How was the Agency/Group/Organization consulted and what are the anticipated outcomes of the consultation or areas for improved coordination?
CSD contacted HDR Alaska by e‐mail. The anticipated outcomes of the consultation were to improve coordination and to include their input in the Consolidated Plan and Action Plan.
Agency/Group/Organization McLaughlin Youth Center
Agency/Group/Organization Type Services‐Children Services‐Health Services‐Education Other government ‐ State
What section of the Plan was addressed by Consultation?
Housing Need Assessment Market Analysis
79
How was the Agency/Group/Organization consulted and what are the anticipated outcomes of the consultation or areas for improved coordination?
CSD contacted Mclaughlin Youth Center by e‐mail. The anticipated outcomes of the consultation were to improve coordination and to include their input in the Consolidated Plan and Action Plan.
Agency/Group/Organization State of Alaska DHSS
Agency/Group/Organization Type Services‐Children Services‐Elderly Persons Services‐Persons with Disabilities Services‐Persons with HIV/AIDS Services‐homeless Services‐Health Services‐Education Other government ‐ State
What section of the Plan was addressed by Consultation?
Housing Need Assessment Homelessness Strategy Homeless Needs ‐ Chronically homeless Homeless Needs ‐ Families with children Homelessness Needs ‐ Veterans Homelessness Needs ‐ Unaccompanied youth Non‐Homeless Special Needs Market Analysis
80
How was the Agency/Group/Organization consulted and what are the anticipated outcomes of the consultation or areas for improved coordination?
CSD contacted State of Alaska, Health & Social Services by e‐mail. The anticipated outcomes of the consultation were to improve coordination and to include their input in the Consolidated Plan and Action Plan.
Agency/Group/Organization UAA (Meg)
Agency/Group/Organization Type Housing Services‐Health Services‐Education
81
What section of the Plan was addressed by Consultation?
Housing Need Assessment Market Analysis

Consolidated Plan ANCHORAGE 40
OMB Control No: 2506‐0117 (exp. 07/31/2015)
How was the Agency/Group/Organization consulted and what are the anticipated outcomes of the consultation or areas for improved coordination?
CSD contacted University of Alaska by e‐mail. The anticipated outcomes of the consultation were to improve coordination and to include their input in the Consolidated Plan and Action Plan.
Table 2 – Agencies, groups, organizations who participated
Identify any Agency Types not consulted and provide rationale for not consulting
CSD made every effort to include as many community members and agencies as possible to involve them in the Consolidated Plan process. There was no decision to exclude any group. There was no decision to exclude any individual, agency, department, or group.
Other local/regional/state/federal planning efforts considered when preparing the Plan
Name of Plan Lead Organization How do the goals of your Strategic Plan overlap with the goals of each plan?
Continuum of Care
MOA in 2011, 2012, Jan‐March 2013 & Anchorage Coalition to End Homelessness April 2013 to date
There is an overlap for data driven goals, need to reduce number of homeless households with children, emphasis to provide number of beds needed for chronically homeless, importance to evaluate discharge of persons from mental health, prisoner, hospital systems and foster care to avoid homelessness.
10 Year Plan to End Homelessness
MOA, Housing and Neighborhood Development Commission and the Oversight Subcommittee on Homelessness
Common goals: Establish a centralized or coordinated assessment system, maintain the AK Homeless Management Information System to track and identify gaps in homeless services, support Project Homeless Connect, measure outcomes goals for the CoC grant application, present findings annual to the Assembly and Mayor End Homelessness.
AHFC 2012 Action Plan
AHFC Common goals to develop affordable housing, target specific populations (victims of domestic violence, elderly, persons with disabilities), coordinate with community on use of vouchers.
AHFC 2013 Action Plan
AHFC See above.
Anchorage Housing Market Analysis
MOA Relationship to Strategic Plan that recognize lack of buildable land need to increase efficient land use, increase residential densities, expansion into large land holdings (Chugiak/Eagle River).
State of Alaska, Prisoner Reentry Task Force, Five
State of Alaska, Department of Corrections
Common goal to provide affordable housing for persons leaving correctional system.
Mayors Homeless Leadership Team
MOA Common goals to develop affordable housing, assist chronic public inebriates, support of the Cold Weather Plan, maintain/increase detox beds, support of Housing First projects

Consolidated Plan ANCHORAGE 41
OMB Control No: 2506‐0117 (exp. 07/31/2015)
Name of Plan Lead Organization How do the goals of your Strategic Plan overlap with the goals of each plan?
Mayors Kitchen Cabinet Work Group
MOA Common goals: Establish single department to act as liaison with homebuilders, coordination of comprehensive housing development, review need for code changes, research use of Tax Increment Financing, consider revision of municipal regulatory requirements, target site for large housing to develop short‐ and long‐ term sober housing units, reinstitute Pathways to Recovery Program at the Anchorage Safety Center.
Alaska VA Healthcare System
VA Common goal: Commitment to ending Veteran homelessness by the end of 2015. Aligned with understanding that, No one who has served our country should ever go without a safe, stable place to call home.
Table 3 – Other local / regional / federal planning efforts
Describe cooperation and coordination with other public entities, including the State and any adjacent units of general local government, in the implementation of the Consolidated Plan (91.215(l))
The State of Alaska was contacted by e‐mail and phone. There was great emphasis placed in coordinating with the Alaska Housing Finance Corporation, the State Department of Corrections, and the State Department of Health and Social Services Alaska Mental Health Trust Authority.
Several presentations were made to Municipal Commissions such as the American Disability Act Commission, the Senior Commission, Health and Human Services Commission, and the Anchorage Womens Commission. Also, local coalitions, including the Anchorage Coalition to End Homelessness, the Anchorage Domestic Violence, Sexual Assault, and Child Abuse and Neglect Coalition were participants in the development of the Plan.
The Municipal Neighborhood and Housing Development Commission and the Commission's Oversight on Homelessness held several meetings and took testimony on the development of the Plan.
Emails and in‐person contact was made with several Municipal departments, including: Anchorage Police Department, Employee Relations Department, Department of Health & Human Services, Information Technology Department, Legal Department, Office of Management and Budget, Public Works, Purchasing Department, Risk Management, and the Chief Fiscal Office.
Several Municipal Departments are consulted in the preparation of Environmental Assessments including: The Community Development Department, Department of Health & Human Services, Anchorage Water and Wastewater Utility (AWWU), Solid Waste Services, the Police Department, the Fire Department, Anchorage Parks and Recreation Department, Risk Management and the Legal Department.
All Departments were consulted for the 2013 Action Plan and the 2013 ‐2017 Consolidated Plan. The Assembly reviews and approves the plans before submitting them to HUD. Some of the Departments do not have programs/projects/activities that target the low‐ and moderate‐ income (includes abused children, battered spouses, elderly persons, adults meeting federal definition of severely disabled, homeless persons, illiterate adults, persons living with AIDS, and migrant farm workers) or help with the elimination of slum and blight, but several of them do. CSD contacted all departments by e‐mail, phone, and/or in person to coordinate gathering needed information for this Consolidated Plan.
Narrative (optional):

Consolidated Plan ANCHORAGE 42
OMB Control No: 2506‐0117 (exp. 07/31/2015)
PR‐15 Citizen Participation
1. Summary of citizen participation process/Efforts made to broaden citizen participation
Summarize citizen participation process and how it impacted goal‐setting
The Consolidated Plan is a product of research, consultation, and citizen participation. The Municipality provided participation opportunities in accordance with the current Consolidated Plans Citizen Participation Plan, as approved by the Anchorage Assembly and HUD. The preparation of the 2013 Action Plan began with consultation with public agencies. CSD sought first to identify potential needs, services gaps and key issues on which to focus the community outreach process. CSD conducted public presentations on the Consolidated Plan, Action Plan and Community Needs Survey. The Municipality encouraged community participation in the development of the 2013 Action Plan and the 2013 ‐ 2017 Consolidated Plan. CSD is responsible for coordinating the citizen participation process. Community meetings were advertized in the Anchorage Daily News, a paper of general circulation and posted on the CSD website. Notices were sent out to a large e‐mail list. Presentations were made for the HAND Commission, HCOSH, and for the Anchorage Assembly. The results of the Community Needs Survey are included in the Consolidated Plan and were used to establish the needs of the community.
The Municipality Of Anchorage Citizen Participation Plan is included at the back this action plan.

Consolidated Plan ANCHORAGE 43
OMB Control No: 2506‐0117 (exp. 07/31/2015)
Citizen Participation Outreach
Sort
Order
Mode of Outreach Target of Outreach Summary of
response/attendance
Summary of
comments
received
Summary of comments not
accepted and reasons
URL (If applicable)
1 Public Hearing Minorities Non‐English Speaking ‐ Specify other language: Spanish Persons with disabilities Non‐targeted/broad community Residents of Public and Assisted Housing
11/2/2011 ‐ (HAND) Commission Meeting ‐ Room 155, City Hall. The hearing discussed the amount of assistance the Municipality expects to receive in 2013, the range of activities to be consideration to benefit low‐ and moderate‐income persons, the priority needs of the Consolidated Plan, the five‐year strategies in the Consolidated Plan designed to address those needs, and a discussion of programs and activities necessary in the upcoming program year to carry out those strategies.
No comments
were received
from the public.
No comments were received from the public.
http://www.muni.org/ Departments/health/ services/neighborhoods/ Documents/ HANDMinutes110211.pdf

Consolidated Plan ANCHORAGE 44
OMB Control No: 2506‐0117 (exp. 07/31/2015)
Sort
Order
Mode of Outreach Target of Outreach Summary of
response/attendance
Summary of
comments
received
Summary of comments not
accepted and reasons
URL (If applicable)
2 Newspaper Ad Minorities Non‐English Speaking ‐ Specify other language: Spanish Persons with disabilities Non‐targeted/broad community Residents of Public and Assisted Housing
A public notice was posted in the Anchorage Daily News on October 21, 2011 for public meeting on November 2, 2011 on the 2013‐2017 Consolidated Plan and the 2013 Action Plan.
Ms. Worley gave public comments for NeighborWorks Anchorage. She said they were concerned about the CDBG and HOME appropriation cuts. She recommended that the MOA not fund new programs, but fund existing programs, with a track record. She also recommended the MOA cut the TBRA program. Ms. Worley spoke about the AnCHOR Program.
The MOA must fund new programs to address the highest priority needs in the Consolidated Plan.
http://www.muni.org/Departments/health/services/neighborhoods/Documents/DisplayAd10212011.pdf
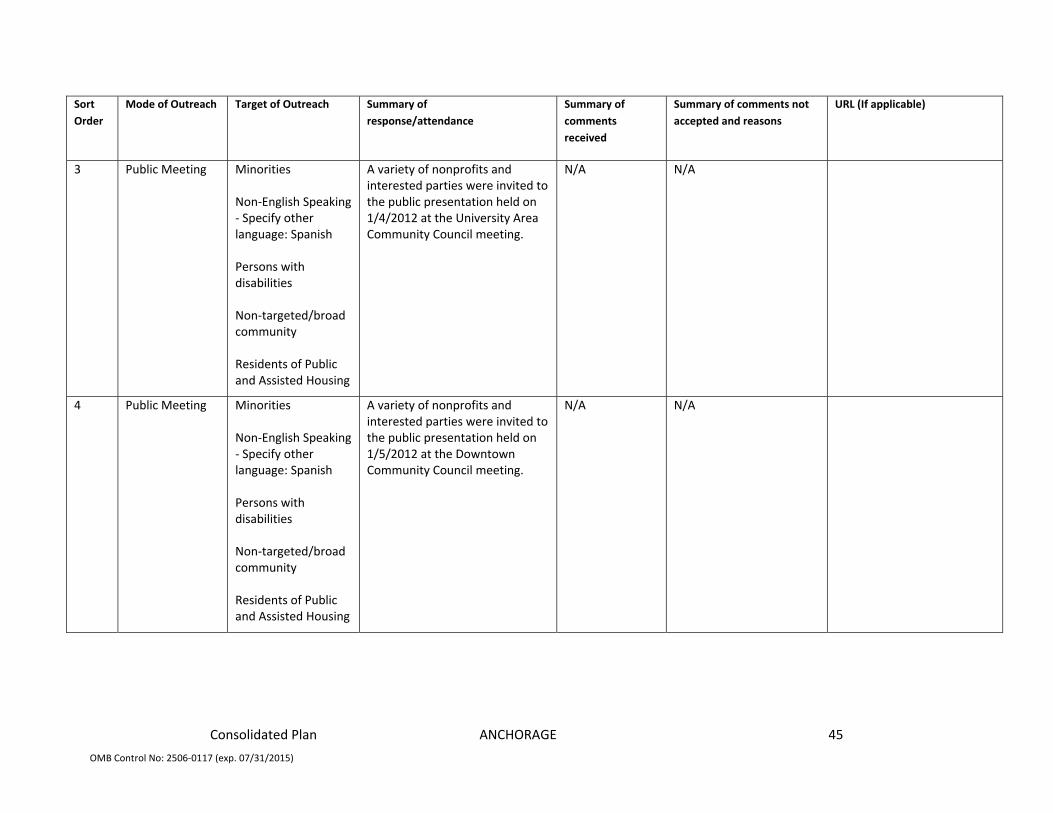
Consolidated Plan ANCHORAGE 45
OMB Control No: 2506‐0117 (exp. 07/31/2015)
Sort
Order
Mode of Outreach Target of Outreach Summary of
response/attendance
Summary of
comments
received
Summary of comments not
accepted and reasons
URL (If applicable)
3 Public Meeting Minorities Non‐English Speaking ‐ Specify other language: Spanish Persons with disabilities Non‐targeted/broad community Residents of Public and Assisted Housing
A variety of nonprofits and interested parties were invited to the public presentation held on 1/4/2012 at the University Area Community Council meeting.
N/A N/A
4 Public Meeting Minorities Non‐English Speaking ‐ Specify other language: Spanish Persons with disabilities Non‐targeted/broad community Residents of Public and Assisted Housing
A variety of nonprofits and interested parties were invited to the public presentation held on 1/5/2012 at the Downtown Community Council meeting.
N/A N/A

Consolidated Plan ANCHORAGE 46
OMB Control No: 2506‐0117 (exp. 07/31/2015)
Sort
Order
Mode of Outreach Target of Outreach Summary of
response/attendance
Summary of
comments
received
Summary of comments not
accepted and reasons
URL (If applicable)
5 Public Meeting Minorities Non‐English Speaking ‐ Specify other language: Spanish Persons with disabilities Non‐targeted/broad community Residents of Public and Assisted Housing
A variety of nonprofits and interested parties were invited to the public presentation held on 1/11/2012 at the Housing and Neighborhood Development (HAND) Commission meeting.
Commissioners Layman and Newgent indicated they love where CSD is at. They (HAND Commission) are receiving more information than they have in the past and the rules and regulations are more transparent than in the past
N/A http://www.muni.org/Departments/health/services/neighborhoods/Documents/HANDMinute01112012.pdf
6 Public Meeting Minorities Non‐English Speaking ‐ Specify other language: Spanish Persons with disabilities Non‐targeted/broad community Residents of Public and Assisted Housing
A variety of nonprofits and interested parties were invited to the public presentation held on 1/25/2012 at the Senior Citizens Advisory Commission meeting.
N/A N/A

Consolidated Plan ANCHORAGE 47
OMB Control No: 2506‐0117 (exp. 07/31/2015)
Sort
Order
Mode of Outreach Target of Outreach Summary of
response/attendance
Summary of
comments
received
Summary of comments not
accepted and reasons
URL (If applicable)
7 Public Meeting Minorities Non‐English Speaking ‐ Specify other language: Spanish Persons with disabilities Non‐targeted/broad community Residents of Public and Assisted Housing
A variety of nonprofits and interested parties were invited to the public presentation held on 1/26/2012 at the Anchorage Coalition on Homelessness General Membership meeting.
N/A N/A
8 Public Meeting Minorities Non‐English Speaking ‐ Specify other language: Spanish Persons with disabilities Non‐targeted/broad community Residents of Public and Assisted Housing
A variety of nonprofits and interested parties were invited to the public presentation held on 2/2/2012 at the Covenant House Staff meeting.
N/A N/A

Consolidated Plan ANCHORAGE 48
OMB Control No: 2506‐0117 (exp. 07/31/2015)
Sort
Order
Mode of Outreach Target of Outreach Summary of
response/attendance
Summary of
comments
received
Summary of comments not
accepted and reasons
URL (If applicable)
10 Public Meeting Minorities Non‐English Speaking ‐ Specify other language: Spanish Persons with disabilities Non‐targeted/broad community Residents of Public and Assisted Housing
A variety of nonprofits and interested parties were invited to the public presentation held on 2/2/2012 at the Beans Cafe Town Hall meeting.
N/A N/A
11 Public Meeting Minorities Non‐English Speaking ‐ Specify other language: Spanish Persons with disabilities Non‐targeted/broad community Residents of Public and Assisted Housing
A variety of nonprofits and interested parties were invited to the public presentation held on 2/7/2012 at Loussac Sogn Apartments.
N/A N/A

Consolidated Plan ANCHORAGE 49
OMB Control No: 2506‐0117 (exp. 07/31/2015)
Sort
Order
Mode of Outreach Target of Outreach Summary of
response/attendance
Summary of
comments
received
Summary of comments not
accepted and reasons
URL (If applicable)
12 Public Meeting Minorities Non‐English Speaking ‐ Specify other language: Spanish Persons with disabilities Non‐targeted/broad community Residents of Public and Assisted Housing
A variety of nonprofits and interested parties were invited to the public presentation held on 2/8/2012 at the Anchorage Women's Commission meeting.
N/A N/A
13 Public Meeting Minorities Non‐English Speaking ‐ Specify other language: Spanish Persons with disabilities Non‐targeted/broad community Residents of Public and Assisted Housing
A variety of nonprofits and interested parties were invited to the public presentation held on 2/9/2012 at the AWAIC Shelter.
N/A N/A

Consolidated Plan ANCHORAGE 50
OMB Control No: 2506‐0117 (exp. 07/31/2015)
Sort
Order
Mode of Outreach Target of Outreach Summary of
response/attendance
Summary of
comments
received
Summary of comments not
accepted and reasons
URL (If applicable)
14 Public Meeting Minorities Non‐English Speaking ‐ Specify other language: Spanish Persons with disabilities Non‐targeted/broad community Residents of Public and Assisted Housing
A variety of nonprofits and interested parties were invited to the public presentation held on 2/9/2012 at the Fairview Community Council meeting.
N/A N/A
15 Public Meeting Minorities Non‐English Speaking ‐ Specify other language: Spanish Persons with disabilities Non‐targeted/broad community Residents of Public and Assisted Housing
A variety of nonprofits and interested parties were invited to the public presentation held on 2/13/2012 at the RurAL CAP All Staff meeting.
N/A N/A

Consolidated Plan ANCHORAGE 51
OMB Control No: 2506‐0117 (exp. 07/31/2015)
Sort
Order
Mode of Outreach Target of Outreach Summary of
response/attendance
Summary of
comments
received
Summary of comments not
accepted and reasons
URL (If applicable)
16 Public Meeting Minorities Non‐English Speaking ‐ Specify other language: Spanish Persons with disabilities Non‐targeted/broad community Residents of Public and Assisted Housing
A variety of nonprofits and interested parties were invited to the public presentation held on 2/16/2012 at STAR Alaska.
N/A N/A
17 Public Meeting Minorities Non‐English Speaking ‐ Specify other language: Spanish Persons with disabilities Non‐targeted/broad community Residents of Public and Assisted Housing
A variety of nonprofits and interested parties were invited to the public presentation held on 2/16/2012 at The Adelaide Apartments.
N/A N/A

Consolidated Plan ANCHORAGE 52
OMB Control No: 2506‐0117 (exp. 07/31/2015)
Sort
Order
Mode of Outreach Target of Outreach Summary of
response/attendance
Summary of
comments
received
Summary of comments not
accepted and reasons
URL (If applicable)
18 Public Meeting Minorities Non‐English Speaking ‐ Specify other language: Spanish Persons with disabilities Non‐targeted/broad community Residents of Public and Assisted Housing
A variety of nonprofits and interested parties were invited to the public presentation held on 2/16/2012 at STAR Alaska.
N/A N/A
19 Public Meeting Minorities Non‐English Speaking ‐ Specify other language: Spanish Persons with disabilities Non‐targeted/broad community Residents of Public and Assisted Housing
A variety of nonprofits and interested parties were invited to the public presentation held on 2/16/2012 at The Adelaide Apartments.
N/A N/A

Consolidated Plan ANCHORAGE 53
OMB Control No: 2506‐0117 (exp. 07/31/2015)
Sort
Order
Mode of Outreach Target of Outreach Summary of
response/attendance
Summary of
comments
received
Summary of comments not
accepted and reasons
URL (If applicable)
20 Public Meeting Minorities Non‐English Speaking ‐ Specify other language: Spanish Persons with disabilities Non‐targeted/broad community Residents of Public and Assisted Housing
A variety of nonprofits and interested parties were invited to the public presentation held on 2/21/2012 at a special Community Stakeholder Meeting held at the BP Energy Center.
N/A N/A
21 Public Meeting Minorities Non‐English Speaking ‐ Specify other language: Spanish Persons with disabilities Non‐targeted/broad community Residents of Public and Assisted Housing
A variety of nonprofits and interested parties were invited to the public presentation held on 2/22/2012 at the Anchorage Senior Center Social Hour.
N/A N/A

Consolidated Plan ANCHORAGE 54
OMB Control No: 2506‐0117 (exp. 07/31/2015)
Sort
Order
Mode of Outreach Target of Outreach Summary of
response/attendance
Summary of
comments
received
Summary of comments not
accepted and reasons
URL (If applicable)
22 Public Meeting Minorities Non‐English Speaking ‐ Specify other language: Spanish Persons with disabilities Non‐targeted/broad community Residents of Public and Assisted Housing
A variety of nonprofits and interested parties were invited to the public presentation held on 2/24/2012 at ACCESS Alaska.
N/A N/A
23 Public Meeting Minorities Non‐English Speaking ‐ Specify other language: Spanish Persons with disabilities Non‐targeted/broad community Residents of Public and Assisted Housing
A variety of nonprofits and interested parties were invited to the public presentation held on 2/27/2012 at the Muldoon Park Strip Committee.
N/A N/A
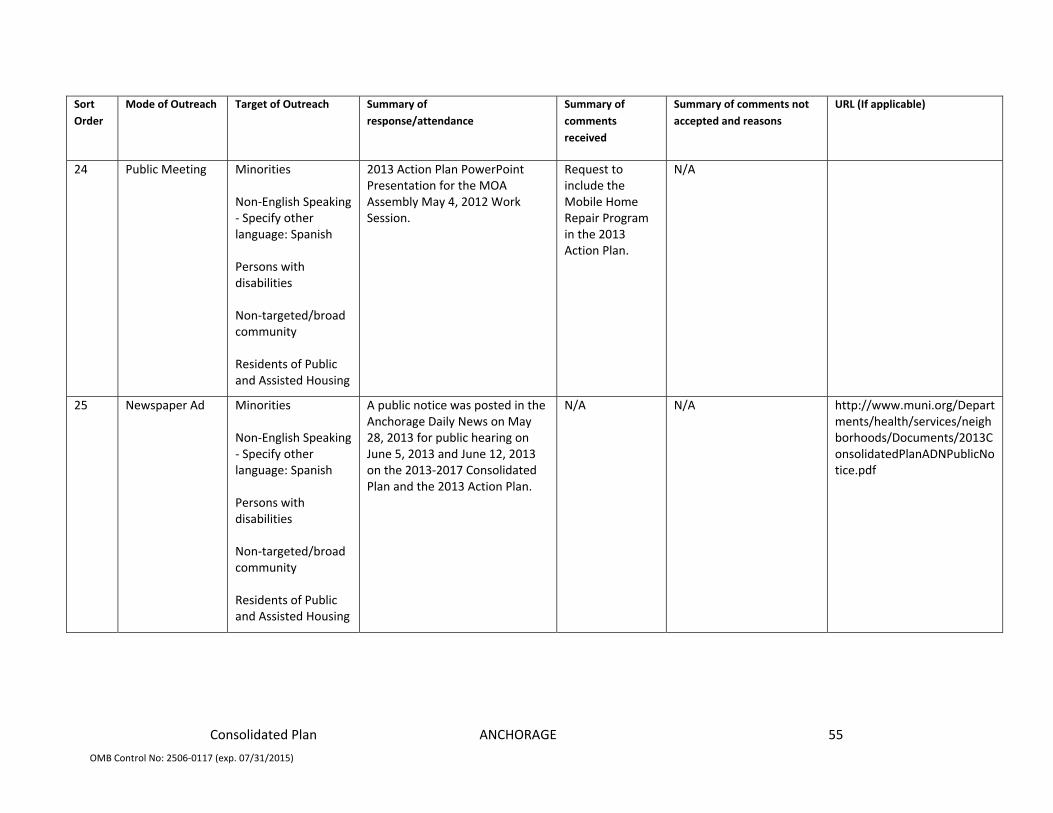
Consolidated Plan ANCHORAGE 55
OMB Control No: 2506‐0117 (exp. 07/31/2015)
Sort
Order
Mode of Outreach Target of Outreach Summary of
response/attendance
Summary of
comments
received
Summary of comments not
accepted and reasons
URL (If applicable)
24 Public Meeting Minorities Non‐English Speaking ‐ Specify other language: Spanish Persons with disabilities Non‐targeted/broad community Residents of Public and Assisted Housing
2013 Action Plan PowerPoint Presentation for the MOA Assembly May 4, 2012 Work Session.
Request to include the Mobile Home Repair Program in the 2013 Action Plan.
N/A
25 Newspaper Ad Minorities Non‐English Speaking ‐ Specify other language: Spanish Persons with disabilities Non‐targeted/broad community Residents of Public and Assisted Housing
A public notice was posted in the Anchorage Daily News on May 28, 2013 for public hearing on June 5, 2013 and June 12, 2013 on the 2013‐2017 Consolidated Plan and the 2013 Action Plan.
N/A N/A http://www.muni.org/Departments/health/services/neighborhoods/Documents/2013ConsolidatedPlanADNPublicNotice.pdf

Consolidated Plan ANCHORAGE 56
OMB Control No: 2506‐0117 (exp. 07/31/2015)
Sort
Order
Mode of Outreach Target of Outreach Summary of
response/attendance
Summary of
comments
received
Summary of comments not
accepted and reasons
URL (If applicable)
26 Public Hearing Minorities Non‐English Speaking ‐ Specify other language: Spanish Persons with disabilities Non‐targeted/broad community Residents of Public and Assisted Housing
A public Hearing on the 2013 ‐ 2017 CP and the 2013 AP was held at the June 5, 2013 HAND Commission meeting.
Request by Older Persons Action Group to consider funding new office site; however, the request was made outside the public hearing. Summary of comments received are included in the Executive Summary.
Summary of comments not accepted and reason are included in the Executive Summary.
27 Public Hearing Minorities Non‐English Speaking ‐ Specify other language: Spanish Persons with disabilities Non‐targeted/broad community Residents of Public and Assisted Housing
A public Hearing on the 2013 ‐ 2017 CP and the 2013 AP was held at the June 12, 2013 HCOSH meeting.
No comments were received.
N/A
Table 4 – Citizen Participation Outreach

Consolidated Plan ANCHORAGE 57
OMB Control No: 2506‐0117 (exp. 07/31/2015)
Needs Assessment
NA‐05 Overview
Needs Assessment Overview
This Consolidated Plan identifies community needs across the following areas: * Homeless * Non‐Homeless Special Needs * Affordable Housing * Non‐housing Community Development
There are many needs in each area and Anchorage does not have the funding to eliminate these needs or the underlying causes. Although many of the needs will still exist, the impact can be lessened and the quality of life improved. The needs are rated high, medium, and low. CSD believes that most areas need additional funding. Everyone knows that Anchorage needs more housing and services for the Homeless. There will always be a need for additional services for those with special needs. There is a huge lack of affordable housing in Anchorage in every group. Not much attention is given to the non‐housing Community Development needs because of so many needs in the other three areas. High Priority: High Priority means it is believed that more of these programs are needed. Activities to address this need are more likely to be funded by the Municipality of Anchorage with federal or local funds, either alone or in conjunction with the investment of other public or private funds. Medium Priority: Medium Priority means it is believed that services should remain at the same level. Activities to address this need are not likely to receive funding that would increase the level of service. It may be funded by the Municipality of Anchorage with federal or local funds, either alone or in conjunction with the investment of other public or private funds. The Municipality will consider certifications of consistency for other entities application for Federal assistance. Low Priority: Low Priority means it is believed that less of these programs or services are needed. The Municipality of Anchorage is not likely to fund significant activities to address this need. The Municipality will consider certifications of consistency for other entities application for Federal assistance.
NA‐05 Additional Information Page 1
NA‐05 Additional Information Page 2
NA‐05 Additional Information Page 3

Consolidated Plan ANCHORAGE 58
OMB Control No: 2506‐0117 (exp. 07/31/2015)
NA‐05 Additional Information Page 4
NA‐05 Additional Information Page 5
NA‐05 Additional Information Page 6
NA‐05 Additional Information Page 7
Community Needs Survey Results

Consolidated Plan ANCHORAGE 59
OMB Control No: 2506‐0117 (exp. 07/31/2015)
NA‐10 Housing Needs Assessment ‐ 24 CFR 91.205 (a, b, c)
Summary of Housing Needs
According to the 2010 U.S. Census, the Municipality of Anchorage (MOA) has a total land area of 1,704.68 square miles and includes the Anchorage Bowl, Chugiak and Eagle River, and Girdwood (Turnagain Arm). The MOA is considered a county under the U.S. Census, and is identified as a unified home rule municipality, which means city government and borough governments are merged. Since the 2000 Census, the MOA had an increase of 31,543 persons or an increase of 12.1% for a total population in 2010 of 291,826. This section of the Plan provides summary of Anchorages estimated housing needs projected over the next five years. This section includes demographic information, number of households, and median income. Additional information presented is census tract information. An analysis is presented before each table, as well as citations or sources of information. This section also reviews housing needs of populations that are at‐risk or at‐imminent risk of homelessness.
Demographics Base Year: 2000 Most Recent Year: 2009 % Change
Population 260,283 280,389 8%
Households 100,368 103,602 3%
Median Income $55,546.00 $70,151.00 26%
Table 5 ‐ Housing Needs Assessment Demographics
Data Source: 2000 Census (Base Year), 2005‐2009 ACS (Most Recent Year)
Anchorage Vicinity Map
Demographics
2010 U.S. Census by Tracts Page 1

Consolidated Plan ANCHORAGE 60
OMB Control No: 2506‐0117 (exp. 07/31/2015)
2010 U.S. Census by Tracts Page 2
MAP NA‐10.2. Anchorage Census Tracts
Number of Households Table
0‐30% HAMFI
>30‐50% HAMFI
>50‐80% HAMFI
>80‐100% HAMFI
>100% HAMFI
Total Households * 9,675 10,380 17,815 11,675
Small Family Households * 3,325 4,205 7,890 36,505
Large Family Households * 745 900 1,915 6,335
Household contains at least one person 62‐74 years of age 1,280 1,240 1,945 1,200 6,435
Household contains at least one person age 75 or older 1,050 975 960 700 2,010
Households with one or more children 6 years old or younger * 2,380 2,645 4,485 11,515
* the highest income category for these family types is >80% HAMFI
Table 6 ‐ Total Households Table
Data Source: 2005‐2009 CHAS
Number of Households Additional Information

Consolidated Plan ANCHORAGE 61
OMB Control No: 2506‐0117 (exp. 07/31/2015)
Housing Needs Summary Tables
1. Housing Problems (Households with one of the listed needs)
Renter Owner
0‐30% AMI
>30‐50% AMI
>50‐80% AMI
>80‐100% AMI
Total 0‐30% AMI
>30‐50% AMI
>50‐80% AMI
>80‐100% AMI
Total
NUMBER OF HOUSEHOLDS
Substandard Housing ‐ Lacking complete plumbing or kitchen facilities 260 120 135 40 555 60 40 95 25 220
Severely Overcrowded ‐ With >1.51 people per room (and complete kitchen and plumbing) 110 290 95 125 620 15 75 80 35 205
Overcrowded ‐ With 1.01‐1.5 people per room (and none of the above problems) 470 290 715 140 1,615 85 115 320 310 830
Housing cost burden greater than 50% of income (and none of the above problems) 4,420 1,640 210 50 6,320 1,995 1,460 1,350 385 5,190
Housing cost burden greater than 30% of income (and none of the above problems) 870 3,220 3,410 645 8,145 200 715 2,850 2,480 6,245
Zero/negative Income (and none of the above problems) 175 0 0 0 175 120 0 0 0 120
Table 7 – Housing Problems Table
Data Source: 2005‐2009 CHAS

Consolidated Plan ANCHORAGE 62
OMB Control No: 2506‐0117 (exp. 07/31/2015)
Housing Needs Summary Page 1
Housing Needs Summary Page 2
Housing Needs Summary Page 3
Housing Needs Summary Page 4
Housing Needs Summary Page 5
Housing Needs Summary Page 6

Consolidated Plan ANCHORAGE 63
OMB Control No: 2506‐0117 (exp. 07/31/2015)
Most Common Housing Problems Page 1
Most Common Housing Problems Page 2
Most Common Housing Problems Page 3
Most Common Housing Problems Page 4
Most Common Housing Problems Page 5
Most Common Housing Problems Page 6

Consolidated Plan ANCHORAGE 64
OMB Control No: 2506‐0117 (exp. 07/31/2015)
Most Common Housing Problems Page 7
Most Common Housing Problems Page 8
Most Common Housing Problems Page 9
Most Common Housing Problems Page 10
Most Common Housing Problems Page 11
Most Common Housing Problems Page 12

Consolidated Plan ANCHORAGE 65
OMB Control No: 2506‐0117 (exp. 07/31/2015)
Most Common Housing Problems Page 13
Most Common Housing Problems Page 14
2. Housing Problems 2 (Households with one or more Severe Housing Problems: Lacks kitchen or complete plumbing, severe overcrowding, severe cost burden)
Renter Owner
0‐30% AMI
>30‐50% AMI
>50‐80% AMI
>80‐100% AMI
Total 0‐30% AMI
>30‐50% AMI
>50‐80% AMI
>80‐100% AMI
Total
NUMBER OF HOUSEHOLDS
Having 1 or more of four housing problems 5,260 2,335 1,155 350 9,100 2,155 1,690 1,840 760 6,445
Having none of four housing problems 1,545 4,550 9,040 4,330 19,465 420 1,805 5,780 6,235 14,240
Household has negative income, but none of the other housing problems 175 0 0 0 175 120 0 0 0 120
Table 8 – Housing Problems 2
Data Source: 2005‐2009 CHAS

Consolidated Plan ANCHORAGE 66
OMB Control No: 2506‐0117 (exp. 07/31/2015)
3. Cost Burden > 30%
Renter Owner
0‐30% AMI
>30‐50% AMI
>50‐80% AMI
Total 0‐30% AMI
>30‐50% AMI
>50‐80% AMI
Total
NUMBER OF HOUSEHOLDS
Small Related 2,170 2,295 1,625 6,090 635 810 2,225 3,670
Large Related 550 370 435 1,355 150 250 565 965
Elderly 1,150 445 205 1,800 850 805 635 2,290
Other 2,195 2,175 1,470 5,840 690 425 1,040 2,155
Total need by income
6,065 5,285 3,735 15,085 2,325 2,290 4,465 9,080
Table 9 – Cost Burden > 30%
Data Source: 2005‐2009 CHAS
Cost Burden
4. Cost Burden > 50%
Renter Owner
0‐30% AMI
>30‐50% AMI
>50‐80% AMI
Total 0‐30% AMI
>30‐50% AMI
>50‐80% AMI
Total
NUMBER OF HOUSEHOLDS
Small Related 1,860 855 40 2,755 570 690 620 1,880
Large Related 455 115 45 615 130 125 180 435
Elderly 810 125 20 955 765 375 195 1,335
Other 1,930 565 105 2,600 630 315 400 1,345
Total need by income
5,055 1,660 210 6,925 2,095 1,505 1,395 4,995
Table 10 – Cost Burden > 50%
Data Source: 2005‐2009 CHAS

Consolidated Plan ANCHORAGE 67
OMB Control No: 2506‐0117 (exp. 07/31/2015)
5. Crowding (More than one person per room)
Renter Owner
0‐30% AMI
>30‐50% AMI
>50‐80% AMI
>80‐100% AMI
Total 0‐30% AMI
>30‐50% AMI
>50‐80% AMI
>80‐100% AMI
Total
NUMBER OF HOUSEHOLDS
Single family households 545 550 750 0 1,845 100 175 355 0 630
Multiple, unrelated family households 0 10 55 0 65 0 10 70 0 80
Other, non‐family households 35 20 35 0 90 0 0 0 0 0
Total need by income
580 580 840 0 2,000 100 185 425 0 710
Table 11 – Crowding Information – 1/2
Data Source: 2005‐2009 CHAS
Renter Owner
0‐30% AMI
>30‐50% AMI
>50‐80% AMI
Total 0‐30% AMI
>30‐50% AMI
>50‐80% AMI
Total
Households with Children Present 0 0 0 0 0 0 0 0
Table 12 – Crowding Information – 2/2
Data Source Comments:
What are the most common housing problems?
A review of the tables in this section show the most common housing problems in Anchorage are:
*Substandard Housing ‐ Lacking complete plumbing or kitchen facilities *Severely Overcrowded ‐ With >1.51 people per room (and complete kitchen and plumbing) *Housing cost burden greater than 50% of income (and none of the above problems) *Housing cost burden greater 30% of income (and none of the above problems)
See Most Common Housing Problems above.
Are any populations/household types more affected than others by these problems?
*Households that contain at least one person age 75 or older far exceed by percentage 18% and 17% in the 0‐30% HAMFI and >30‐50% HAMFI other types of households. *Renters with a 0‐30% AMI are overrepresented at 46.8% for Substandard Housing and are also over represented in the 30‐50% AMI at 47% for Severely Overcrowded. *Renters with a 0‐30% AMI have a disproportionate percentage of 58% for having 1 or more of four housing problems; and, Owners with a 0‐30% AMI also have the greatest percentage of 33% as having 1 or more of four household problems. *Elderly Renters with a 0‐30% AMI are disproportionately represented for Cost Burden at 64% compared to total

Consolidated Plan ANCHORAGE 68
OMB Control No: 2506‐0117 (exp. 07/31/2015)
need by income of 40%; and, Elderly Owners with a 0‐30% AMI are disproportionately represented at 37% compared to total need by income of 26%. *Other Owners are disproportionately represented at 32% for Cost Burden in comparison to Total need by income of 26%. *Elderly Renters with 0‐30% AMI are disproportionately represented at 85% in comparison to Total need by income of 73%. *Large Related families Renters with 0‐30% AMI are disproportionately represented at 74% (455/615) in comparison to Total need by income at 73%. *Other families Renters with 0‐30% AMI are disproportionately represented at 74% (1,930/2,600) in comparison to Total need by income at 73%. *Elderly Owners with a 0‐30% AMI are disproportionately represented at 57% in comparison to Total need by income of 42%. *Other families Owners with 0‐30% AMI are disproportionately represented at 47% in comparison to Total need by income of 42%. *Other, non‐family Renters with a 0‐30% AMI are overrepresented in Crowding Information at 39% in comparison to Total need by income of 29%. *Single‐family Renters with a 0‐30% AMI and >30%‐50% AMI are disproportionately represented at 30% respectively in comparison with the Total need by income of 29%. *Single family Owners with a 0‐30% AMI are disproportionately represented at 16% in comparison to the Total need by income of 14%. *Single Family Owners with a >30%‐50%AMI are disproportionately represented at 28% in comparison to the Total need by income of 26%.
Describe the characteristics and needs of Low‐income individuals and families with children (especially extremely low‐income) who are currently housed but are at imminent risk of either residing in shelters or becoming unsheltered 91.205(c)/91.305(c)). Also discuss the needs of formerly homeless families and individuals who are receiving rapid re‐housing assistance and are nearing the termination of that assistance
According to data collected for 2012 Project Homeless Connect, approximately 113 households participated and had children in the household that was under the age of 18. The total number of children in the family was 204. The reasons given for at imminent risk of homelessness included: chronic substance abuse; domestic violence, mental illness, and physical disability. Only 9% of project attendees were employed. Also, a total 4,314 males and 3,672 females under the age of 18 are identified in "poverty status" in Anchorage. Catholic Social Services' (CSS) Rapid Rehousing (RRH) Program, Anchorage, Alaska, assists families living in shelters or in places not meant for human habitation move as quickly as possible into permanent housing and achieve stability in that housing. The Rapid Rehousing Program offers case management and financial support for families to attain stability and avoid homelessness. CSS RRH Program is a component of the Homeless Family Services. During FY 2012, 884 individuals were served through Homeless Family Services, and 90% of families placed into permanent housing remained housed after 6 months.
If a jurisdiction provides estimates of the at‐risk population(s), it should also include a description of the operational definition of the at‐risk group and the methodology used to generate the estimates:
The jurisdiction does not have an estimate of the at‐risk population; however, it does collect data for Project Homeless Connect, which assists the homeless and at‐risk populations.
Specify particular housing characteristics that have been linked with instability and an increased risk of homelessness
As outlined in this section, there are renters and owners who have housing problems that include: substandard housing; severely overcrowded and housing cost burden greater than 50% and 30%. Large related and small related families are identified with these housing problems. Research shows that affordable housing is the most significant barrier to economic stability. If a person is living in substandard or overcrowded housing, or is paying more than 30% or 50% of their household income, they are at imminent risk for homelessness. Other risk factors include extremely low‐income, lack of employment or employability, history of incarceration, household members

Consolidated Plan ANCHORAGE 69
OMB Control No: 2506‐0117 (exp. 07/31/2015)
with a disability, substance abuse and interpersonal violence. Almost all of these items are described by participants of Anchorage's Project Homeless Connect.
Discussion
Anchorage has significant numbers of families who are at‐risk populations, including small and large related families, single parents, and un‐related families in households. There are also a significant number of these families who are likely living in substandard housing, overcrowded conditions, and are cost burdened.
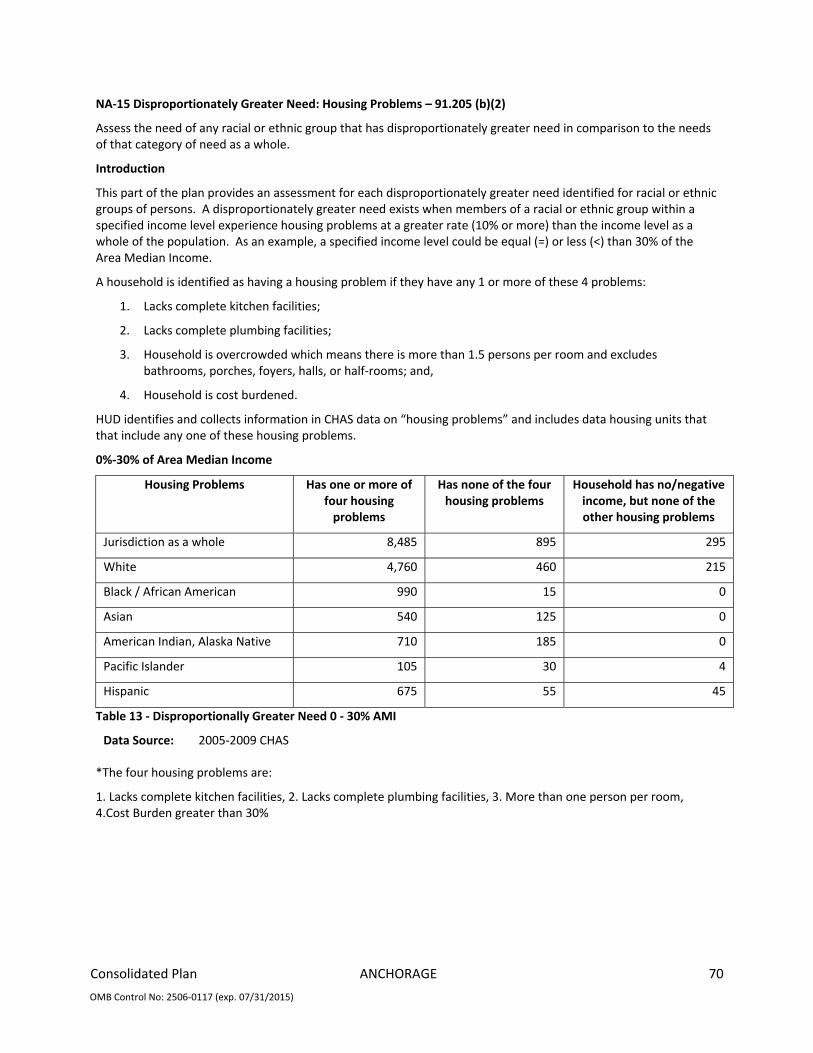
Consolidated Plan ANCHORAGE 70
OMB Control No: 2506‐0117 (exp. 07/31/2015)
NA‐15 Disproportionately Greater Need: Housing Problems – 91.205 (b)(2)
Assess the need of any racial or ethnic group that has disproportionately greater need in comparison to the needs of that category of need as a whole.
Introduction
This part of the plan provides an assessment for each disproportionately greater need identified for racial or ethnic groups of persons. A disproportionately greater need exists when members of a racial or ethnic group within a specified income level experience housing problems at a greater rate (10% or more) than the income level as a whole of the population. As an example, a specified income level could be equal (=) or less (<) than 30% of the Area Median Income.
A household is identified as having a housing problem if they have any 1 or more of these 4 problems:
1. Lacks complete kitchen facilities;
2. Lacks complete plumbing facilities;
3. Household is overcrowded which means there is more than 1.5 persons per room and excludes bathrooms, porches, foyers, halls, or half‐rooms; and,
4. Household is cost burdened.
HUD identifies and collects information in CHAS data on “housing problems” and includes data housing units that that include any one of these housing problems.
0%‐30% of Area Median Income
Housing Problems Has one or more of four housing problems
Has none of the four housing problems
Household has no/negative income, but none of the other housing problems
Jurisdiction as a whole 8,485 895 295
White 4,760 460 215
Black / African American 990 15 0
Asian 540 125 0
American Indian, Alaska Native 710 185 0
Pacific Islander 105 30 4
Hispanic 675 55 45
Table 13 ‐ Disproportionally Greater Need 0 ‐ 30% AMI
Data Source: 2005‐2009 CHAS
*The four housing problems are:
1. Lacks complete kitchen facilities, 2. Lacks complete plumbing facilities, 3. More than one person per room, 4.Cost Burden greater than 30%

Consolidated Plan ANCHORAGE 71
OMB Control No: 2506‐0117 (exp. 07/31/2015)
0%‐30% of Area Median Income Disproportionate: = or > 34% for Owner and = or > 74% for Renter
30%‐50% of Area Median Income
Housing Problems Has one or more of four housing problems
Has none of the four housing problems
Household has no/negative income, but none of the other housing problems
Jurisdiction as a whole 7,960 2,415 0
White 4,485 1,475 0
Black / African American 765 135 0
Asian 570 140 0
American Indian, Alaska Native 560 185 0
Pacific Islander 109 15 0
Hispanic 805 285 0
Table 14 ‐ Disproportionally Greater Need 30 ‐ 50% AMI
Data Source: 2005‐2009 CHAS
*The four housing problems are:
1. Lacks complete kitchen facilities, 2. Lacks complete plumbing facilities, 3. More than one person per room, 4.Cost Burden greater than 30%
30.1%‐50% of Area Median Income Disproportionate: = or > 35% for Owner and = or > 62% for Renter

Consolidated Plan ANCHORAGE 72
OMB Control No: 2506‐0117 (exp. 07/31/2015)
50%‐80% of Area Median Income
Housing Problems Has one or more of four housing problems
Has none of the four housing problems
Household has no/negative income, but none of the other housing problems
Jurisdiction as a whole 9,255 8,560 0
White 5,825 5,885 0
Black / African American 790 485 0
Asian 580 445 0
American Indian, Alaska Native 435 750 0
Pacific Islander 65 35 0
Hispanic 1,105 410 0
Table 15 ‐ Disproportionally Greater Need 50 ‐ 80% AMI
Data Source: 2005‐2009 CHAS
*The four housing problems are:
1. Lacks complete kitchen facilities, 2. Lacks complete plumbing facilities, 3. More than one person per room, 4.Cost Burden greater than 30%
50.1%‐80% of Area Median Income Disproportionate: = or > 34% for Owner and = or > 36%for Renter
80%‐100% of Area Median Income
Housing Problems Has one or more of four housing problems
Has none of the four housing problems
Household has no/negative income, but none of the other housing problems
Jurisdiction as a whole 4,235 7,435 0
White 2,695 5,545 0
Black / African American 250 350 0
Asian 290 480 0
American Indian, Alaska Native 210 235 0
Pacific Islander 85 30 0
Hispanic 495 560 0
Table 16 ‐ Disproportionally Greater Need 80 ‐ 100% AMI
Data Source: 2005‐2009 CHAS

Consolidated Plan ANCHORAGE 73
OMB Control No: 2506‐0117 (exp. 07/31/2015)
*The four housing problems are:
1. Lacks complete kitchen facilities, 2. Lacks complete plumbing facilities, 3. More than one person per room, 4.Cost Burden greater than 30%
80.1%‐100% of Area Median Income Disproportionate: = or > 24% for Owner and = or > than 12% for Rent
Discussion
Discussion NA 15 – 0%‐30%
For the 0%‐30% of the Area Median Income, All households Owner account for 24% and Renters account for 64% of households with one or more of four housing problems. A disproportionate percentage is 34% for Owners and 74% for Renters.
Discussion NA 15 – 30.1%‐50%
For the 30.1% – 50% of the Area Median Income, All household Owners account for 25% and Renters account for 52% of households with one or more of four housing problems. A disproportionate percentage is 35% for Owners and 62% for Renters.
Discussion NA 15 – 50.1%‐80%
For the 50.1% – 80% of the Area Median Income, All household Owners account for 24% and Renters account for 26% of households with one or more of four housing problems. A disproportionate percentage is 34% for Owners and 36% for Renters.
Discussion NA 15 – 80.1%‐100%
For the 80.1% – 100% of the Area Median Income, All households Owners account for 14% and Renters account for 2% of households with one or more of four housing problems. A disproportionate percentage is 24% for Owners and 12% for Renters.
Overview of Significant Findings for Disproportionately Greater Need: Housing Problems
1. Key points for 0‐30%
The population with disproportionate needs for the 0% ‐ 30% Area Median Income with one or more of four housing problems are Black household Renters at 84%.
2. Key points for 30.1%‐50%
The populations with disproportionate needs for the 30.1% ‐ 50% Area Median Income with one or more of four housing problems are: White Owners at 44%; Black Owners at 47%; and, American Indian/AK Native at 37%. Also, a disproportionate percentage is shown for: Other Renters at 70% and Pacific Islander Renters at 95%.
3. Key points for 50.1%‐80%
The populations with disproportionate needs for the 50.1% ‐ 80% Area Median Income with one or more of four housing problems are American Indian/AK Native Owners at 35%. Also, a disproportionate percentage is shown for: Black Renters at 42% and Other Renters at 71%.
4. Key points for 80.1%‐100%
The populations with disproportionate needs for the 80.1% ‐ 100% Area Median Income with one or more of four housing problems are Other Owners at 69%.

Consolidated Plan ANCHORAGE 74
OMB Control No: 2506‐0117 (exp. 07/31/2015)
NA‐20 Disproportionately Greater Need: Severe Housing Problems – 91.205 (b)(2)
Assess the need of any racial or ethnic group that has disproportionately greater need in comparison to the needs of that category of need as a whole.
Introduction
Under HUD guidelines a disproportionately greater need exists when members of a racial or ethnic group at an income level experience housing problems at a greater rate (10% points or more) than the income level as a whole for severe housing problems.
HUD defines severe housing problems as:
1. Lacks complete kitchen facilities;
2. Lacks complete plumbing facilities;
3. More than 1.5 persons per room not including bathrooms, porches, foyers, halls, or half‐rooms; and,
4. Households with housing cost burdens that exceed 50% of the monthly income.
0%‐30% of Area Median Income
Severe Housing Problems* Has one or more of four housing problems
Has none of the four housing problems
Household has no/negative income, but none of the other housing problems
Jurisdiction as a whole 7,415 1,965 295
White 4,235 985 215
Black / African American 905 100 0
Asian 355 310 0
American Indian, Alaska Native 660 235 0
Pacific Islander 105 30 4
Hispanic 565 164 45
Table 17 – Severe Housing Problems 0 ‐ 30% AMI
Data Source: 2005‐2009 CHAS
*The four severe housing problems are:
1. Lacks complete kitchen facilities, 2. Lacks complete plumbing facilities, 3. More than 1.5 persons per room, 4.Cost Burden over 50%
NA 20 Table 1 0%‐30%

Consolidated Plan ANCHORAGE 75
OMB Control No: 2506‐0117 (exp. 07/31/2015)
30%‐50% of Area Median Income
Severe Housing Problems* Has one or more of four housing problems
Has none of the four housing problems
Household has no/negative income, but none of the other housing problems
Jurisdiction as a whole 4,025 6,355 0
White 2,155 3,800 0
Black / African American 485 415 0
Asian 290 415 0
American Indian, Alaska Native 285 460 0
Pacific Islander 89 30 0
Hispanic 500 590 0
Table 18 – Severe Housing Problems 30 ‐ 50% AMI
Data Source: 2005‐2009 CHAS
*The four severe housing problems are:
1. Lacks complete kitchen facilities, 2. Lacks complete plumbing facilities, 3. More than 1.5 persons per room, 4.Cost Burden over 50%
NA 20 Table 2 30.1%‐50%
50%‐80% of Area Median Income
Severe Housing Problems* Has one or more of four housing problems
Has none of the four housing problems
Household has no/negative income, but none of the other housing problems
Jurisdiction as a whole 2,995 14,820 0
White 1,725 9,990 0
Black / African American 140 1,130 0
Asian 330 695 0
American Indian, Alaska Native 160 1,030 0
Pacific Islander 20 74 0
Hispanic 340 1,170 0
Table 19 – Severe Housing Problems 50 ‐ 80% AMI
Data Source: 2005‐2009 CHAS

Consolidated Plan ANCHORAGE 76
OMB Control No: 2506‐0117 (exp. 07/31/2015)
*The four severe housing problems are:
1. Lacks complete kitchen facilities, 2. Lacks complete plumbing facilities, 3. More than 1.5 persons per room, 4.Cost Burden over 50%
NA 20 Table 3 50.1%‐80%
80%‐100% of Area Median Income
Severe Housing Problems* Has one or more of four housing problems
Has none of the four housing problems
Household has no/negative income, but none of the other housing problems
Jurisdiction as a whole 1,110 10,565 0
White 475 7,765 0
Black / African American 130 470 0
Asian 195 575 0
American Indian, Alaska Native 90 360 0
Pacific Islander 50 65 0
Hispanic 160 905 0
Table 20 – Severe Housing Problems 80 ‐ 100% AMI
Data Source: 2005‐2009 CHAS
*The four severe housing problems are:
1. Lacks complete kitchen facilities, 2. Lacks complete plumbing facilities, 3. More than 1.5 persons per room, 4.Cost Burden over 50%
NA 20 Table 4 80.1%‐95%
Discussion
Discussion NA 20 Table 1
For the 0%‐30% of the Area Median Income, All household Owners account for 29% and Renter households account for 56% of households with Severe Housing Problems. A disproportionate percentage is 29% for Owners and 66% for Renters.

Consolidated Plan ANCHORAGE 77
OMB Control No: 2506‐0117 (exp. 07/31/2015)
Discussion NA 20 – 30.1%‐ 50%
For the 30.1%‐50% of the Area Median Income, All household Owners account for 16% and Renter households account for 20% of households with Severe Housing Problems. A disproportionate percentage is 26% for Owners and 30% for Renters.
Discussion NA 20 Table 3
For the 50.1%‐80% of the Area Median Income, All household Owners account for 9% and Renter households account for 2% of households with Severe Housing Problems. A disproportionate percentage is 19% for Owners and 12% for Renters.
Discussion NA 20 Table 4
For the 80.1%‐95% of the Area Median Income, All household Owners account for 3% and Renter households account for 1% of households with Severe Housing Problems. A disproportionate percentage is 13% for Owners and 11% for Renters.
Discussion NA 20 – 95.1% and greater
For the households at 95.1% and greater of the Area Median Income, All household Owners account for 2% and Renter households account for 0% of households with Severe Housing Problems. A disproportionate percentage is 12% for Owners.
NA 20 Overview of Significant Findings for Severe Housing Problems
1. Key points for 0‐30%
The populations with disproportionate Severe Housing Problems for the 0%‐30% Area Median Income are Renters that are: Black at 77%; American Indian/AK Native at 67%; and, Pacific Islanders at 89%
2. Key points for 30.1%‐50%
The populations with the disproportionate representation for the 30.1% ‐ 50% Area Median Income with severe housing problems as Owners are Black households at 28%. For Renters, the populations disproportionately represented are: Black at 37%; Pacific Islander at 49%; and, Other at 32%.
3. Key points for 50.1%‐80%
Population with a disproportionate representation for 50.1%‐80% Area Median Income, for Severe Housing Problems, is Asian Owner households at 19%.
4. Key points for 80.1%‐95%
There is no population with a disproportionate representation for 80.1%‐95% Area Median Income, with Severe Housing Problems.
5. Key points for 95%+
There is no population with a disproportionate representation for the 95% and greater Area Median Income with Severe Housing Problems.

Consolidated Plan ANCHORAGE 78
OMB Control No: 2506‐0117 (exp. 07/31/2015)
NA‐25 Disproportionately Greater Need: Housing Cost Burdens – 91.205 (b)(2)
Assess the need of any racial or ethnic group that has disproportionately greater need in comparison to the needs of that category of need as a whole.
Introduction:
This section provides insight if there any income categories in which a racial or ethnic group has disproportionately greater need than the needs of that income category as a whole. Also, this section reviews whether the racial/ethnic group has other needs which are not identified in the disproportionate assessment.
A disproportionately greater need exists when the members of racial or ethnic group reflect a greater rate of 10% or more compared to households as a whole for those experiencing Housing Cost Burdens. HUD defines Housing Cost Burdens as Housing Cost to Income Ratio. Therefore, the table below shows:
No Cost Burden ‐ Housing Cost to Income Ratio is less than 30%;
Cost Burdened ‐ Housing Cost to Income Ratio is from 30.1% to 50%; and,
Severe Cost Burdened ‐ Housing Cost to Income Ratio is greater than 50.1%.
Housing Cost Burden
Housing Cost Burden <=30% 30‐50% >50% No / negative income (not computed)
Jurisdiction as a whole 69,435 20,920 12,940 325
White 53,285 13,885 7,815 240
Black / African American 3,070 1,515 1,425 0
Asian 3,310 1,280 625 0
American Indian, Alaska Native 3,065 930 875 0
Pacific Islander 350 205 109 4
Hispanic 3,655 1,825 1,245 45
Table 21 – Greater Need: Housing Cost Burdens AMI
Data Source: 2005‐2009 CHAS
NA 25 Tables 1 and 2 Housing Cost Burden
Discussion:
NA 25 Table 2 ‐ Housing Cost Burden by Ethnicity/Race
At 31% of Black households, there is a Severe Cost Burden, which is greater than 10% for All households. There is also a disproportionate percentage of Pacific Islanders at 33% at the 30.1 ‐ 50% for Moderate Cost Burden.
Consolidated Plan ANCHORAGE 79
OMB Control No: 2506‐0117 (exp. 07/31/2015)
NA 25 Overview of Significant Findings for Housing Cost Burden by Ethnicity/Race
There are two groups disproportionately affected by Severe (31%) and Moderate Cost Burden (33%); for, Black and Pacific Islanders respectively.

Consolidated Plan ANCHORAGE 80
OMB Control No: 2506‐0117 (exp. 07/31/2015)
NA‐30 Disproportionately Greater Need: Discussion – 91.205(b)(2)
Are there any Income categories in which a racial or ethnic group has disproportionately greater need than the needs of that income category as a whole?
For the 0%‐30% of the Area Median Income, All households Owner account for 24% and Renters account for 64% of households with one or more of four housing problems. A disproportionate percentage is 34% for Owners and 74% for Renters.
The population with disproportionate needs for the 0% ‐ 30% Area Median Income with one or more of four housing problems are Black household Renters at 84%.
The populations with disproportionate Severe Housing Problems for the 0%‐30% Area Median Income are Renters that are: Black at 77%; American Indian/AK Native at 67%; and, Pacific Islanders at 89%.
At 31% of Black households, there is a Severe Cost Burden, which is greater than 14% for All households.
There is a disproportionate percentage of Pacific Islanders at 33% at the 30.1 – 50% for Moderate Cost Burden.
If they have needs not identified above, what are those needs?
All known needs have been identified.
Are any of those racial or ethnic groups located in specific areas or neighborhoods in your community?
This section presents the percentage of racial or ethnic groups by Anchorage Census Tracts. Notably, there are Census Tracts that shows significant percentages of racial or ethnic groups located in the community.
Census Tract 6 has a high percentage of American Indian/AK Native households (17%), African American households (14%), Asian households (6%), Native Hawaiian/Pacific Islander households (9%), and 2 or more race individuals in households (11%). Tract 6 also includes White households at 27%.
Census Tract 7.03 includes Asian households (16%), American Indian/AK Native (13%), and 2 or more race individuals in households (11%). Tract 7.03 also includes White households at 46%.
Census Tract 8.01 includes Asian households (15%), 2 or more race individuals in households (11%), and Native Hawaiian/Pacific Islander (7%). Tract 8.01 has White households at 40%.
Census Tract 9.01 includes African American households (13%), 2 or more race individuals in a household (12%), and Native Hawaiian/ Pacific Islanders (5%). Tract 9.01 has White households at 35%.
In Census Tract 9.02, there is a large majority of American Indian/AK Native Households (21%), African American Households (15%), and Native Hawaiian/Pacific Islanders (18%). Tract 9.02 has White households at 46%.
Census Tract 19 includes high percentages of Asian (17%), American Indian/AK Native (13%), and Native Hawaiian/Pacific Islander (4%), as well as White households at 44%.
Census Tract 20 includes Asian households (15%), American Indian/AK Native households (14%), and Native Hawaiian/Pacific Islander (4%). Tract 20 includes White households at 47%.
See Appendix E for a full breakout by Census Tract and Population by Race.

Consolidated Plan ANCHORAGE 81
OMB Control No: 2506‐0117 (exp. 07/31/2015)
NA‐35 Public Housing – 91.205(b)
Introduction
This plan includes a summary of the needs of Anchorage public housing residents. This information was gathered in consultation with the Alaska Housing Finance Corporation (AHFC), the public housing agency for the Municipality of Anchorage. AHFC is a self‐supporting corporation with a mission to provide Alaskans with access to safe, quality, affordable housing. They provide a variety of affordable housing programs and tools, including the operation of public housing, housing choice vouchers, and project‐based assistance. They also finance housing developments through the Low Income Housing Tax Credit program, tax‐exempt multifamily loans, and the distribution of Federal and State housing grants. In addition, a variety of home loan programs for low‐ and moderate‐income residents are offered by the Corporation. AHFC promotes self‐sufficiency and well‐being for people in Anchorage. AHFC also provides housing‐related research, planning, and program development services for Alaskan communities. AHFC also provides monthly rental subsidy equivalent to 35 project‐based vouchers for persons at the Karluk Manor, a Housing First development targeting chronically homeless individuals with substance abuse and alcohol addictions. As of April 2013 in Anchorage there were over 1,500 on the Housing Choice Voucher waiting list, and over 3,000 on the waiting list for various AHFC‐owned rental assistance units. In the past year AHFC created three new transitional tenant‐based rental assistance programs: the Empowering Choice Housing Program for victims of domestic violence and sexual assault; the Youth Aging Out of Foster Care program for youth between 18‐24 that transitioning to independent living, and the Parolee/Probationer Re‐Entry program for those transitioning out of the state prison system. In order to continue to serve those with special needs in our communities, AHFC has created set aside programs. For the elderly and disabled population, AHFC has 240 low‐income units. Additionally, AHFC has set aside 96 vouchers statewide, exclusively for persons with disabilities. Anchorage also has a set aside of 20 vouchers for individuals referred from Anchorage Community Mental Health Services. AHFC also conducts an annual ADA‐504 needs assessment to create priorities for modifications and planned unit improvements, such as enlarging door openings, adding grab bars in bathrooms and hallways, installing automatic doors, and removing carpet to facilitate wheelchair movement. For new construction, AHFC complies with ADA‐504 on all new construction and renovation projects and ensures that at least five percent of the units, or one unit (whichever is greater), will accommodate a person with mobility impairments. Lastly, AHFC offers a well‐defined Reasonable Accommodation process that covers families from the application process through unit modification requests. Additionally, AHFC offers language interpretation services to those families with limited English proficiency.
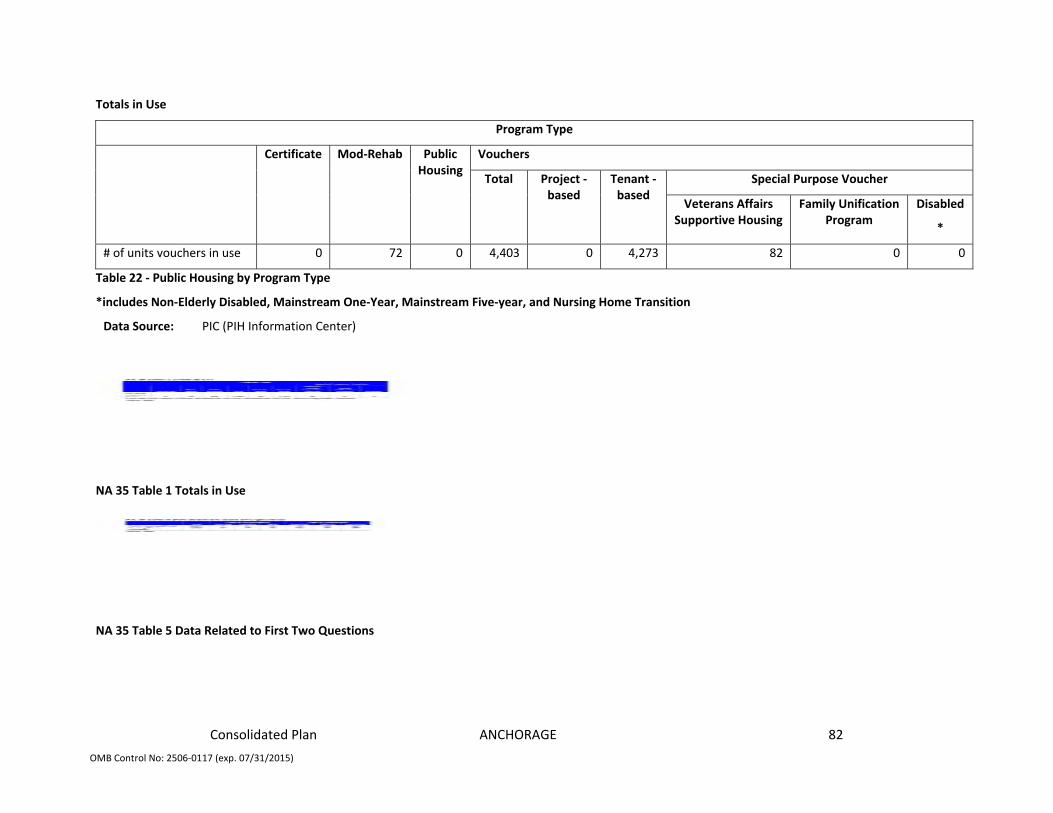
Consolidated Plan ANCHORAGE 82
OMB Control No: 2506‐0117 (exp. 07/31/2015)
Totals in Use
Program Type
Vouchers
Special Purpose Voucher
Certificate Mod‐Rehab Public Housing
Total Project ‐based
Tenant ‐based
Veterans Affairs Supportive Housing
Family Unification Program
Disabled
*
# of units vouchers in use 0 72 0 4,403 0 4,273 82 0 0
Table 22 ‐ Public Housing by Program Type
*includes Non‐Elderly Disabled, Mainstream One‐Year, Mainstream Five‐year, and Nursing Home Transition
Data Source: PIC (PIH Information Center)
NA 35 Table 1 Totals in Use
NA 35 Table 5 Data Related to First Two Questions

Consolidated Plan ANCHORAGE 83
OMB Control No: 2506‐0117 (exp. 07/31/2015)
Characteristics of Residents
Program Type
Vouchers
Special Purpose Voucher
Certificate Mod‐Rehab
Public Housing
Total Project ‐based
Tenant ‐based
Veterans Affairs
Supportive Housing
Family Unification Program
Average Annual Income 0 7,991 0 16,726 0 16,753 14,169 0
Average length of stay 0 2 0 4 0 4 0 0
Average Household size 0 1 0 2 0 2 1 0
# Homeless at admission 0 7 0 25 0 4 21 0
# of Elderly Program Participants (>62) 0 7 0 773 0 751 11 0
# of Disabled Families 0 27 0 1,580 0 1,537 18 0
# of Families requesting accessibility features 0 72 0 4,403 0 4,273 82 0
# of HIV/AIDS program participants 0 0 0 0 0 0 0 0
# of DV victims 0 0 0 0 0 0 0 0
Table 23 – Characteristics of Public Housing Residents by Program Type
Data Source: PIC (PIH Information Center)
NA 35 Table 2 Characteristics of Residents by Program Type

Consolidated Plan ANCHORAGE 84
OMB Control No: 2506‐0117 (exp. 07/31/2015)
Race of Residents
Program Type
Vouchers
Special Purpose Voucher
Race Certificate Mod‐Rehab
Public Housing
Total Project ‐based
Tenant ‐based
Veterans Affairs
Supportive Housing
Family Unification Program
Disabled
*
White 0 47 0 2,452 0 2,368 50 0 0
Black/African American 0 9 0 739 0 712 23 0 0
Asian 0 5 0 221 0 218 1 0 0
American Indian/Alaska Native 0 10 0 849 0 840 6 0 0
Pacific Islander 0 1 0 136 0 133 2 0 0
Other 0 0 0 6 0 2 0 0 0
*includes Non‐Elderly Disabled, Mainstream One‐Year, Mainstream Five‐year, and Nursing Home Transition
Table 24 – Race of Public Housing Residents by Program Type
Data Source: PIC (PIH Information Center)
NA 35 Table 3 Race of Public Housing Residents by Program Type

Consolidated Plan ANCHORAGE 85
OMB Control No: 2506‐0117 (exp. 07/31/2015)
Ethnicity of Residents
Program Type
Vouchers
Special Purpose Voucher
Ethnicity Certificate Mod‐Rehab
Public Housing
Total Project ‐based
Tenant ‐based
Veterans Affairs
Supportive Housing
Family Unification Program
Disabled
*
Hispanic 0 4 0 227 0 221 4 0 0
Not Hispanic 0 68 0 4,170 0 4,050 78 0 0
*includes Non‐Elderly Disabled, Mainstream One‐Year, Mainstream Five‐year, and Nursing Home Transition
Table 25 – Ethnicity of Public Housing Residents by Program Type
Data Source: PIC (PIH Information Center)
NA 35 Table 4 Ethnicity of Public Housing Residents by Program Type

Consolidated Plan ANCHORAGE 86
OMB Control No: 2506‐0117 (exp. 07/31/2015)
Section 504 Needs Assessment: Describe the needs of public housing tenants and applicants on the waiting list for accessible units:
In order to continue to serve those with special needs in our communities, AHFC has created set aside programs. For the elderly and disabled population, AHFC has 240 low‐income units. Additionally, AHFC has set aside 96 vouchers statewide, exclusively for persons with disabilities. Anchorage also has a set aside of 20 vouchers for individuals referred from Anchorage Community Mental Health Services.
AHFC also conducts an annual ADA‐504 needs assessment to create priorities for modifications and planned unit improvements, such as enlarging door openings, adding grab bars in bathrooms and hallways, installing automatic doors, and removing carpet to facilitate wheelchair movement. For new construction, AHFC complies with ADA‐504 on all new construction and renovation projects and ensures that at least five percent of the units, or one unit (whichever is greater), will accommodate a person with mobility impairments.
Lastly, AHFC offers a well‐defined Reasonable Accommodation process that covers families from the application process through unit modification requests. Additionally, AHFC offers language interpretation services to those families with limited English proficiency. AHFC operates 506 Public Housing Program units of which 120 elderly/disabled populations are provided low income housing. There are 137 Section 8 new Multifamily Housing Program units of which 120 serve units serve the elderly/disabled exclusively. There are 70 Section 8 Moderate Rehabilitation Program single‐room occupancy units serving individuals. There are 43 vouchers reserved for individuals with disabilities.
The Arc of Anchorage, Hope Community Resources, and Focus are a few of the organizations that provide housing and services to the disabled population.
Most immediate needs of residents of Public Housing and Housing Choice voucher holders
The number and type of families on the waiting lists for public housing and section 8 tenant‐based rental assistance are included in the tables above. The lack of affordable housing in the Anchorage area is evidenced by the very low vacancy rates. Many times this is most acutely felt by low income residents. In particular, the waiting list in Anchorage indicates that one and two bedroom waiting lists are in the highest demand, and units that provide accessible features for the disabled are also very much needed.
In Anchorage, AHFC operates:
506 Public Housing Program units, of which 120 serve elderly/disabled populations exclusively
137 Section 8 New Multifamily Housing Program units, of which 120 serve elderly/disabled populations exclusively
48 affordable housing units which accept individuals with vouchers
70 Section 8 Moderate Rehabilitation Program single‐room occupancy units serving individuals who qualify as homeless under the McKinney‐Vento Act
2,344 Housing Choice Vouchers
64 project‐based voucher units
43 vouchers reserved for individuals with disabilities
95 vouchers reserved for individuals displaced due to domestic violence
20 vouchers reserved for referrals from Anchorage Community Mental Health Services
As of April 2013 in Anchorage there were over 1,500 on the Housing Choice Voucher waiting list and over 3,000 on the waiting list for various AHFC‐owned rental assistance units. The Anchorage Housing Choice Voucher waiting list has gone to a lottery system, approximately every 2‐3 years the voucher waiting list will open to applicants for a month.
Consolidated Plan ANCHORAGE 87
OMB Control No: 2506‐0117 (exp. 07/31/2015)
The Anchorage Housing Choice Voucher waiting list has gone to a lottery system, approximately every 2‐3 years the voucher waiting list will open to applicants for a month. Those applicants will then be worked off the waiting list for the next 2‐3 years, until the waiting list is nearly exhausted, at which point another lottery is held.
In the past year AHFC has created three new transitional tenant‐based rental assistance programs: The Empowering Choice Housing Program for victims of domestic violence and sexual assault; the Youth Aging Out of Foster Care program for youth are between 18‐24 that transitioning to independent living, and the Parolee/Probationer Re‐Entry program for those transitioning out of the state prison system.
The most immediate needs of residents of Public Housing and Housing Choice voucher holders is the lack of affordable housing in the Anchorage area is evidenced by the very low vacancy rates. Many times this is most acutely felt by low income residents. In particular, the waiting list in Anchorage indicates that one and two bedroom waiting lists are in the highest demand, and units that provide accessible features for the disabled are also very much needed.
How do these needs compare to the housing needs of the population at large
The needs of residents of Public Housing and Housing Choice voucher holders are the same as those of the population at large except the population at large may not have any assistance in obtaining and maintaining affordable housing. There is a very low vacancy rate in Anchorage and housing is a problem for many low‐ and moderate‐income residents.
In 2010 McDowell Group, prepared an Anchorage Housing Market Analysis. The study’s key finding is that there is not enough buildable land to accommodate future housing demands under historical development patterns, development options and current land use policies.
Anchorage will need to increase efficient land use, increase residential densities, increase the supply of buildable land by expansion into further large land holdings, facilitate redevelopment and ensure affordable housing.
Discussion
There is a lack of affordable housing in Anchorage and AHFC is a key factor in providing as much housing and housing assistance with the limited funding that is available. Tables provided by IDIS were not used. New tables have been attached.
As of 2010 there were 5,800 acres of buildable residential land in the Anchorage Bowl, including 5,200 acres of vacant undeveloped land and 600 partially vacant land that has space to be further subdivided or developed. Within the next 20 years it is expected the demand for approximately 18,200 new dwellings in Anchorage will be needed, which will force Anchorage to expand its geographic boundaries.
Financial feasibility is a concern also for the four housing prototypes:
Small lot single family detached units
Infill townhouses
Mid‐rise residential development
Mid‐rise mixed‐use development.
Local costs for compact and other forms of housing are high. Anchorage Construction costs are 37% higher than the nation’s average.

Consolidated Plan ANCHORAGE 88
OMB Control No: 2506‐0117 (exp. 07/31/2015)
NA‐40 Homeless Needs Assessment – 91.205(c)
Introduction:
The Needs Assessment Section of the Consolidated Plan describes the nature and extent of unsheltered and sheltered homelessness within the jurisdiction. The Plan uses data from the Alaska Homeless Management Information System (AKHMIS) and data from the Point‐In‐Time (PIT) and Housing Inventory Chart as a base for this section. This section includes HUD's definitions for homeless, chronically homeless, and unaccompanied youth. This section also highlights ethnic groups in emergency shelters and transitional housing. This section of the Plan describes the nature and extent of unsheltered and sheltered homelessness within the jurisdiction.
This section introduces data on subpopulations of the homeless in Anchorage, such as the chronically homeless; Veterans; unaccompanied youth; persons with HIV/AIDS; and, persons with a disability.
Definitions for these subpopulations are provided for the reader.
NA 40 Table 1 presents information related to:
The number of persons experiencing homelessness on a given night (Point in Time);
The number of persons who experience homelessness each year;
The number of persons who exit homelessness each year; and,
The number of days that persons experience homelessness.

Consolidated Plan ANCHORAGE 89
OMB Control No: 2506‐0117 (exp. 07/31/2015)
Homeless Needs Assessment
Population Estimate the # of persons experiencing homelessness on a
given night
Estimate the # experiencing homelessness each year
Estimate the # becoming
homeless each year
Estimate the # exiting
homelessness each year
Estimate the # of days persons experience
homelessness
Sheltered Unsheltered
Persons in Households with Adult(s) and Child(ren) 405 24 1,257 131 236 195
Persons in Households with Only Children 12 0 120 9 20 221
Persons in Households with Only Adults 665 117 5,323 797 78 152
Chronically Homeless Individuals 94 18 766 255 36 115
Chronically Homeless Families 15 2 144 21 28 143
Veterans 168 31 607 106 0 127
Unaccompanied Child 6 0 113 17 20 221
Persons with HIV 21 2 4 18 0 0
Table 26 ‐ Homeless Needs Assessment
Data Source Comments:
NA 40 Table 1 Homeless Needs Assessment

Consolidated Plan ANCHORAGE 90
OMB Control No: 2506‐0117 (exp. 07/31/2015)
HUD Definitions for NA 40 Table 1_Page_1
HUD Definitions for NA 40 Table 1_Page_2
NA 40 Table 2 Number of Individuals in Emergency Shelters
NA 40 Table 3 Veterans
NA 40 Table 4 Race‐Ethnic Groups in Emergency Shelters or Transitional Housing
NA 40 Table 5 Homeless Population in Emergency Shelters and Transitional Housing

Consolidated Plan ANCHORAGE 91
OMB Control No: 2506‐0117 (exp. 07/31/2015)
NA 40 Table 6 Homeless Population in Emergency Shelters and Transitional Housing
Newly Released Prisoners and Homelessness_Page_1
Newly Released Prisoners and Homelessness_Page_2
Indicate if the homeless population is:
Has No Rural Homeless
If data is not available for the categories "number of persons becoming and exiting homelessness each year," and "number of days that persons experience homelessness," describe these categories for each homeless population type (including chronically homeless individuals and families, families with children, veterans and their families, and unaccompanied youth):
N/A

Consolidated Plan ANCHORAGE 92
OMB Control No: 2506‐0117 (exp. 07/31/2015)
Nature and Extent of Homelessness: (Optional)
Race: Sheltered: Unsheltered (optional)
White 0 0
Black or African American 0 0
Asian 0 0
American Indian or Alaska Native 0 0
Pacific Islander 0 0
Ethnicity: Sheltered: Unsheltered (optional)
Hispanic 0 0
Not Hispanic 0 0
Data Source Comments:
Estimate the number and type of families in need of housing assistance for families with children and the families of veterans.
Based on the NA 40 Table 1 and data gathered from AKHMIS the following facts are present significant findings.
The majority of homeless Individuals are adults (80%), followed by families (18%) and unaccompanied youth (2%).
A total of 199 veterans were identified as homeless, of which 31 were unsheltered.
Although not reflected in the table, an average 373 individuals are in Emergency Shelters, and on average a total of 320 beds are available. The table below shows bed shortages on three of the four dates used to account for bed availability. (AKHMIS 2011 data)
In 2011, a total of 6,700 persons, including men, women and children were in an emergency shelter or transitional housing. Of this total, 5,719 unduplicated persons were identified. (AKHMIS 2011 data)
A total of 607 veterans were identified in Emergency Shelters and Transitional Housing; the majority of veterans (530) were individuals in Emergency Shelters. See table below for a break out of the 607 in Emergency Shelter or Transitional Housing. (AHAR 2011)
In 2011, a total of 911 persons were identified with a disability and were either in Emergency Shelter or Transitional Housing.
A total of 937 are estimated to becoming homeless each year.
Of the subpopulations (Chronically Homeless Individuals, Chronically Homeless Families, Veterans, Unaccompanied Youth) an estimated 46% (255) are comprised of chronically homeless individuals.
A total of 334 are exiting homelessness each year.
A total of 36 chronically homeless individuals are exiting homelessness each year.
Persons in Households with Adults and Children are estimated to have 35 days experiencing homelessness, followed by Persons in Households with Only Adults at 33.
Persons in Households with Only Children, experience more days of homelessness at 221 compared to Persons in Households with Only Adults at 152 and Persons in Households with Adults and Children at 195.
The subpopulation for Chronically Homeless Individuals experience more days of homelessness at 64 indentified in Emergency Shelter compared to the other subpopulations.

Consolidated Plan ANCHORAGE 93
OMB Control No: 2506‐0117 (exp. 07/31/2015)
Unaccompanied Child/Youth experience more days of homelessness at 221 identified in Transitional Housing than the other subpopulations of homelessness.
See tables above:
NA 40 Table 2 Number of Individuals in Emergency Shelters in Anchorage NA 40 Table 3 Veterans
Describe the Nature and Extent of Homelessness by Racial and Ethnic Group.
Ethnic families represent a far different picture of homelessness in emergency services in comparison to individuals.
American Indian/Alaskan Native populations account for 27% of the population, followed by Native American/Pacific Islander (20%), and then Black or African American (15%) and Multiple Races (15%).
In transitional housing services, American Indian/AK Native families account disproportionately for 41% of the population, followed by Native Hawaiian/Pacific Islander (15%) and Multiple Races at 12%.
Describe the Nature and Extent of Unsheltered and Sheltered Homelessness.
According to the Anchorage 2011 Point in Time (PIT) count, there were 1,082 persons that were either in an emergency shelter or transitional housing (sheltered) and 11 homeless persons were unsheltered. The 2012 PIT identifies 1,097 homeless persons sheltered and 50 unsheltered. In 2013, the PIT shows 1,060 sheltered and 52 unsheltered.
Rural area is defined as rural county in § 579.3. County is defined as a state‐recognized county, as well as county equivalents, such as boroughs in Alaska. A county may be defined as rural if it meets one of the following categories: 1. Is NOT in a metropolitan statistical area (MSA), as defined by OMB 2. Is in an MSA where at least 75% of the population is in a non‐urban area, as defined by U.S. Census; 3. Is in a State with a population density of less than 30 persons per square mile, and of which at least 1.25% of the total acreage of such State is Federal land. Anchorage does not meet the eligibility criteria for rural. Anchorage is not aware of the nature and extent of unsheltered and sheltered homelessness in rural areas in Alaska.
Discussion:
Overall, American Indian/Alaska Native represent a disproportionate percentage of Anchorage's Emergency Shelters and Transitional Housing totaling 39% of the homeless population, while comprising only 8% of the city's population. Multiple races were represented by 12% of the homeless population, in comparison to the city’s population of 8%. Black or African American also had a high percentage totaling 11%, while comprising only 6% of the city's population.

Consolidated Plan ANCHORAGE 94
OMB Control No: 2506‐0117 (exp. 07/31/2015)
NA‐45 Non‐Homeless Special Needs Assessment ‐ 91.205 (b, d)
Introduction:
This section of the Plan describes the housing needs of persons who are not homeless but require supportive housing. This includes:
Elderly (defined as 62+)
Frail elderly (defined as an elderly person who requires assistance with three or more activities of daily living, such as bathing, walking, and performing light housework)
Persons with mental, physical, and/or developmental disabilities
Persons with HIV/AIDS and their families
Victims of domestic violence, dating violence, sexual assault, and stalking
Describe the characteristics of special needs populations in your community:
Elderly and Extra Elderly
Elderly and Extra Elderly households have been identified as having a housing problem if they have any one or more of the following four problems:
Lack complete kitchen facilities;
Lack complete plumbing facilities;
Household is overcrowded; and,
Household is cost burdened.
The vast majority of Elderly and Extra Elderly Owner households are significantly overrepresented in all of the AMI categories. Based on information collected in the Tables NA 45 Elderly and Extra Elderly, the following highlights are reviewed for Housing Problems:
For the 0%‐30% of the Area Median Income both the Elderly Owners at 38% and Extra Elderly Owners at 36% are disproportionately represented with Housing Problems, which are greater than 24% for all Owner households.
For the 30.1%‐50% of the Area Median Income both the Elderly Owners at 47% and Extra Elderly Owners at 35% are disproportionately represented with Housing Problems, which are greater than 25% for all Owner households.
For the 50.1%‐80% of the Area Median Income, the Elderly Owners at 29% and Extra Elderly Owners at 25% are disproportionately represented with Housing Problems, which are greater than 24% for all Owner households.
For the 80.1%‐95% of the Area Median Income, the Elderly Owners at 32% and Non‐Elderly Owners at 31% are disproportionately represented with Housing Problems, greater than 30% for all Owner households.
Persons with mental, physical, and/or developmental disabilities
For the 0%‐30% of the Area Median Income the Disabled is disproportionately represented with Housing Problems in comparison to All Renter households.
For the 50.1% ‐ 80% of the Area Median Income the Disabled is disproportionately represented with Housing Problems in comparison to All Renter households.
For the 80% and above of the Area Median Income the Disabled Owner is disproportionately represented with Housing Problems in comparison to All Renter households.

Consolidated Plan ANCHORAGE 95
OMB Control No: 2506‐0117 (exp. 07/31/2015)
Disabled Renters are disproportionately represented with Housing Problems in comparison to All Renter households.
Victims of domestic violence, dating violence, sexual assault, and stalking
What are the housing and supportive service needs of these populations and how are these needs determined?
Elderly and Frail/Extra Elderly
According to data findings from CHAS, affordable housing is a priority need for Elderly and Frail Elderly owners in the 0‐30% Area Median Income (AMI), the 30.1% to 50% AMI; the 50.1%‐80% AMI, and the 80.1%‐95% AMI. There is lack of sufficient data to gain a greater understanding of housing needs for Elderly and Frail Elderly renters by AMI.
Also, adding to this target population is a priority, using the CSD Community Survey the public ranked: Senior Centers as 6th in priority needs for Public Facilities; Frail Elderly as 3rd for Non‐homeless Special Needs; and, Senior Services as 4th for Public Service Priorities.
Persons with mental, physical, and/or developmental disabilities
According to data findings from CHAS, affordable housing is a priority need for the Disabled owners in the 0%‐30% of the Area Median Income (AMI); 50.1%‐80% AMI; and 80.1% and above AMI. Also, Disabled renters in the 80.1% and above AMI are in need.
Adding to this target population as a priority, using the CSD Community Survey the public ranked: Handicapped Centers as the 7th priority need for Public Facilities and Handicapped Services as 1st for Public Service Priorities.
Victims of Domestic Violence, dating violence, sexual assault, and stalking
According to APD data in Anchorage there were 321 sexual assaults in 2008, 359 in 2009, and 370 in 2010. According to the Uniform Crime Report over a three year span (2008‐2010) Anchorages estimated average rate of rape is 92.5 per 100,000 persons. In 2012, there was an average of 477 domestic violence calls made to the APD.
Adding to these target populations as a priority, using the CSD Community Survey the public ranked: Abused/ Neglected Children Facilities as 2nd for Public Facilities; Victims of Domestic Violence or Similar Life Threatening Condition as 1st for Public Service Priorities for Non‐Homeless Special Needs; and, Victims of Domestic Violence or Similar Life Threatening Conditions as 3rd for Homeless Subpopulations Priority Needs.
Discuss the size and characteristics of the population with HIV/AIDS and their families within the Eligible Metropolitan Statistical Area:
The HIV/Aids epidemic is one of the most destructive health crises of modern times. The number of people infected and the effects on their families, communities, and countries are still staggering. The pandemic continues to spread worldwide despite prevention efforts and successes in a few countries. Comprehensive approaches to improve reproductive and sexual health will require continued commitment and investment.
Households experience the immediate impact of HIV/AIDS, because families are the main caregivers for the sick and suffer AIDS‐related financial hardships. During the long period of illness caused by AIDS, the loss of income and cost of caring for a dying family member can impoverish households. When a parent dies, the household may dissolve and the children are sent to live with relatives or left to fend for them selves.
Care services for individuals livings with HIV/AIDS are funded through the HIV/STD Program are overseen by the following organizations:
1. The Alaskan AIDS Assistance Association; and,
2. The Interior AIDS Association
Services provided by or funded through these organizations include case management, education, counseling, advocacy, and funding for other outpatient medical, laboratory, dental, mental health and supportive services, as well as prescribed HIV‐related medications.

Consolidated Plan ANCHORAGE 96
OMB Control No: 2506‐0117 (exp. 07/31/2015)
Currently persons with HIV/AIDS and their families are not identified as a priority. In 2012, the Alaskan AIDS Assistance Association (Four As) were serving 265 active clients. Of these clients, 38 families have families with a total of 72 children.
This population was not ranked as a high or medium need in the CSD Community Survey.
Discussion:
Primary objectives of the MOA are to:
*Maintain housing stability for vulnerable households *Prevent homelessness and loss of permanent housing *Promote expansion of affordable housing units for special needs populations *Make housing more affordable for special needs populations *Link housing with essential supportive services for special needs populations.
Achievement of these goals requires sustained and collaborative efforts of many individuals, groups and public and private organizations. In Anchorage there is a housing and buildable land shortage. It is very costly to build in Anchorage. Lumber prices have escalated and the permitting process is challenging. Many housing programs by the local and state entities link resources and find common goals to support our special needs populations with affordable housing.

Consolidated Plan ANCHORAGE 97
OMB Control No: 2506‐0117 (exp. 07/31/2015)
NA‐50 Non‐Housing Community Development Needs – 91.215 (f)
Describe the jurisdiction’s need for Public Facilities:
The needs were determined from research, public input, and the Community Needs Survey. A summary of the top results are in table below. Examples of public facilities include senior, handicapped, youth, or neighborhood centers, shelters for the homeless, and child care centers. Infrastructure improvements include street, sidewalk, water, sewer, flood, and drainage improvements. Public facilities also include facilities for persons with special needs such as: domestic violence shelters; nursing homes; or, group homes for the disabled.
Also considered may include:
Energy efficiency improvements;
Handicapped accessibility improvements (including improvements to buildings used for general conduct of government); and,
Architectural design features and other treatments aimed at improving aesthetic quality (e.g., sculptures, fountains).
In general, public facilities and public improvements are interpreted to include all facilities and improvements that are publicly owned, or that are owned by a nonprofit and open to the general public.
Anchorage’s survey respondents identified the following high priorities for public facilities.
How were these needs determined?
The needs were determined from research, public input, and the Community Needs Survey. A summary of the top results are in table below.
NA 50 Table 1 Top seven Public Facility needs in Anchorage
Describe the jurisdiction’s need for Public Improvements:
The needs were determined from research, public input, and the Community Needs Survey. A summary of the top results are in table below. HUD defines public improvements as: the acquisition, construction, reconstruction, rehabilitation, or installation of public facilities and improvements. Eligible types of facilities and improvements include:
Infrastructure improvements (construction or installation) including, but not limited to streets, curbs, and water and sewer lines; and,
Neighborhood facilities including, but not limited to public schools, libraries, recreational facilities, parks, playgrounds.
How were these needs determined?
The needs were determined from research, public input, and the Community Needs Survey. A summary of the top results are in table below.

Consolidated Plan ANCHORAGE 98
OMB Control No: 2506‐0117 (exp. 07/31/2015)
NA 50 Table 2 Top three Public Improvement needs in Anchorage
Describe the jurisdiction’s need for Public Services:
The needs were determined from research, public input, and the Community Needs Survey. A summary of the top results are in table below. Specifically, to use CDBG funds, the public services provision applies in the following manner:
If a service is new, it may be funded.
If a service exists, determine whether it was provided by or on behalf of the unit of local government with local or state funding.
If it was not provided by or on behalf of the local government with funding from the local government, it may be funded.
If it was provided by or on behalf of the local government with funding from the local government, grantees must determine whether the proposed service will be a quantifiable increase in the level of service.
HUD considers the following as public service activities:
Employment services (e.g., job training);
Crime prevention and public safety;
Child care;
Health services;
Substance abuse services (e.g., counseling and treatment);
Fair housing counseling;
Education programs;
Energy conservation;
Services for senior citizens;
Services for homeless persons;
Welfare services (excluding income payments);
Down payment assistance; and,
Recreational services.
The following tables identify the community’s identification for needs related to: Public Service Priorities for Non‐Homeless; Homeless Subpopulations Priority Needs; and Public Service Priorities.
How were these needs determined?
The needs were determined from research, public input, and the Community Needs Survey. A summary of the top results are in tables below.
Consolidated Plan ANCHORAGE 99
OMB Control No: 2506‐0117 (exp. 07/31/2015)
NA 50 Tables 3 ‐ 5 Public Service Needs
NA 50 Overview Page 1
NA 50 Overview Page 2

Consolidated Plan ANCHORAGE 100
OMB Control No: 2506‐0117 (exp. 07/31/2015)
Housing Market Analysis
MA‐05 Overview
Housing Market Analysis Overview:
The importance in completing a Housing Market Analysis is to identify barriers to affordable housing, and to determine what, if any, available housing stock is available to fill a gap. Also, the Municipality is tasked with identifying the economic viability of the jurisdiction and creating strategies that fit both the dynamics of the housing industry and its labor pool.
The generally accepted definition of affordability is for a household to expend no more than 30 percent of its annual income on housing. Households that spend more are considered cost burdened, and may as a consequence have less money for food, clothing, and medical care. According to HUD, there is an estimated 13 million renter and homeowner households that now pay more than 50 percent of their annual income on housing. This market analysis describes the housing market, vacancy rates, fair market rates and median rent costs, and identifies the specific needs of Anchorage households who are currently cost burdened. First and foremost is a description of Anchorage’s housing needs.
The tables below show by renter and owner household area median income (AMI), those that are currently spending more than their affordability of 30 percent. The largest need is for the lowest income renters with an AMI less than 30%, and most in need of all bedrooms from 0 (efficiency) to 3 and greater, with an overall need totaling 5,875. The largest need is for homeowners with an AMI less than 30% who need all bedrooms from 0 to 3 and greater, with an overall need totaling 1,290.
Housing Needed by Affordability

Consolidated Plan ANCHORAGE 101
OMB Control No: 2506‐0117 (exp. 07/31/2015)
MA‐10 Number of Housing Units – 91.210(a)&(b)(2)
Introduction
Anchorage has 112,166 total housing units, with 104,315 occupied. Of the occupied units, 62% is owner occupied and 38% is renter occupied. The owner occupied average per household is 2.75, slighter greater than the 2.51 for rental occupied units. Of the 112,166 total units, 7% are vacant units. A modest 12% increase in the number of total housing units from 2000 to 2012, while there has been a 50% increase in the number of occupied housing units. There has also been a 42% increase in vacant units. In 2010, there were a total of 465 new housing units. Of the 7% of the Municipality's vacant units identified in the 2010 Census, the majority at 33% is identified as other vacant, 22% is for rent, and 21% is for seasonal, recreational, or occasional use. Definitions by the US Census, describes a housing unit is classified as "other vacant" when it does not fit into any other year‐round vacant category. Most often cited reason a housing unit is labeled "other vacant" is that no one lives in the unit and the owner: [1]
Is making repairs or renovations
Does not want to rent or sell
Is using the unit for storage
Is elderly and living in a nursing home or with family members
The unit is being held for settlement of an estate.
The unit is being foreclosed.
All residential properties by number of units
Property Type Number %
1‐unit detached structure 103,602 63%
1‐unit, attached structure 14,521 9%
2‐4 units 17,602 11%
5‐19 units 13,736 8%
20 or more units 8,414 5%
Mobile Home, boat, RV, van, etc 5,330 3%
Total 163,205 100%
Table 27 – Residential Properties by Unit Number
Data Source: 2005‐2009 ACS Data
All residential properties by number of units

Consolidated Plan ANCHORAGE 102
OMB Control No: 2506‐0117 (exp. 07/31/2015)
MA 10 Table 1 Total Housing Units
MA 10 Table 2 Anchorage Housing Units Occupied
MA 10 Table 3 Vacant Housing Units
MA 10 Table 4 Renter occupied householder by age
MA 10 Table 5 Owner occupied householder by age
MA 10 Table 10 Anchorage 2011‐2012 Apartment Rental Costs and Vacancy Rates

Consolidated Plan ANCHORAGE 103
OMB Control No: 2506‐0117 (exp. 07/31/2015)
MA 10 Table 11 Anchorage 2011‐2012 Single Family Residence Rental Costs and Vacancy Rates
MA 10 Table 12 JBER Wait List by Grade, # of Bedrooms Needed, and Earliest Wait List Dates
Unit Size by Tenure
Owners Renters
Number % Number %
No bedroom 186 0% 1,307 3%
1 bedroom 1,755 3% 8,813 22%
2 bedrooms 11,645 18% 17,859 44%
3 or more bedrooms 49,570 78% 12,467 31%
Total 63,156 99% 40,446 100%
Table 28 – Unit Size by Tenure
Data Source: 2005‐2009 ACS Data
MA 10 Table 6 Unit Size by Tenure
Describe the number and targeting (income level/type of family served) of units assisted with federal, state, and local programs.
Overall, Anchorage has a total of 112,166 household units with the majority (60%) owner occupied, with an average of 2.75 persons per household. At 40% of renter occupied household units, there are 2.51 persons per household. Owner occupied household units have a high percentage (78%) of 3 bedrooms, while the renter occupied households have a higher percentage at 44% for 2 bedrooms.
Approximately 7% (7,851) of the city's housing units are vacant. Of the total vacant units, 22% are for rent and 21% for seasonal, recreational, or occasional use. A total of 33% account for other vacant.

Consolidated Plan ANCHORAGE 104
OMB Control No: 2506‐0117 (exp. 07/31/2015)
Anchorage's housing units do not meet the needs of the population. Anchorage 2012 apartment rental vacancy rates for 0, 1, 2 and 3 bedrooms are respectively at 4.9%, 1.7%, 2.4%, and 4.8%; well below Alaska's rental vacancy rate for first Quarter 2013 at 6%.
In addition, JBER as of May 7, 2013 has a wait listed for 424 military households. The need for JBER housing by decreasing percentage is: 43% for a 2 bedroom, 25% for a 3 bedroom, 18% for a 5 bedroom and 14% for 4 bedrooms. A safe assumption is these military households are currently occupying rental units with the needed number of bedrooms on the wait list.
Under the Consolidated Plan, two of the federally funded entitlement programs can be used to develop or maintain housing units to offset Anchorage's low vacancy rates: CDBG and HOME. To account for the expected loss of housing funds primarily from the HOME program, more CDBG funds can be targeted towards housing and housing rehabilitation under the CDBG program. The CDBG program has four primary categories of activity: 1) capital improvements (public facilities/infrastructure); 2) housing; 3) public services; and 4) planning and administration. If over the Plans five‐year period funding remains at the 2012 grant amounts, housing rehabilitation unit production and funding can be targeted to the following is:
Minor Repair Program ‐ Projected annual allocation of CDBG funds is $400,000. Program goals are 19 rehabilitated units per year;
Habitat for Humanity Home Ownership ‐ Projected annual allocation of HOME funds is $23,000 for down payment assistance. Program goals are 8 units per year; and,
Rental Development ‐ Projected allocation of CDBG and HOME funds for 2013 is $1.3 mil.
Provide an assessment of units expected to be lost from the affordable housing inventory for any reason, such as expiration of Section 8 contracts.
Anchorage expects to see a loss of public housing vouchers. As a result of federal budget cuts mandated under the sequestration requirements, AHFC has put a statewide hold on the issuance of all Housing Choice vouchers for an indefinite period of time.
The net effect of the funding cut results in about 222 fewer vouchers. As of May 2013, and at AHFC typical issuance rate, it is estimated the moratorium will extend for at least six months, and possibly longer.
Some specially targeted vouchers funded through sources including HUD (Youth Aging out of Foster Care, Prisoner Re‐entry, Victims of Domestic Violence, VASH Vet Vouchers (for chronically homeless veterans) are still being issued, but they are limited in number and tied to specific populations based upon referrals from other agencies.
Does the availability of housing units meet the needs of the population?
The available housing units do not meet the needs of Anchorage’s population. Without increasing the current level of housing density and increasing the rate of land development, the Anchorage Bowl will lack land for about 7,185 of the projected new housing units, or about half of expected demand between 2010 ‐2030. Specifically, in the Anchorage Bowl the projected short fall will be 2,389 for single family, 2,183 for two family/duplexes, 687 for townhouses, and 3,594 for multi‐family/others.
Continuing to breakout the need for military housing that is funded with federal dollars, JBER provides 2,000 housing units on base however, as of May 7, 2013 there were 424 military households on the wait list. The households needed at this time are: 182 for two bedrooms, 106 for 3 bedrooms, 58 for four bedrooms, and 78 for 5 bedroom housing units.
Describe the need for specific types of housing:
Breaking out need for renters and owners show: an estimated 5,875 housings units are needed for Renters with an AMI less than 30%, with units featuring 0 (efficiency) to 3 and greater; and, an estimated 1,290 housing units are needed for Owners with an AMI less than 30% who need all bedrooms from 0 to 3 and greater.
Affordable housing for the elderly and frail elderly owners with AMI from 0% ‐ 80% are needed. (See Needs Assessment Section)

Consolidated Plan ANCHORAGE 105
OMB Control No: 2506‐0117 (exp. 07/31/2015)
Affordable housing is also needed for Disabled Owners with a 0%‐30% AMI. (See Needs Assessment Section)
Emergency and/or transitional housing is also needed for victims of sexual assault, dating violence, and stalking. (See Needs Assessment Section)
As of May 7, 2013, JBER needed 424 military units to meet the needs of military families. Specifically, military households needed are: 182 for two bedrooms, 106 for 3 bedrooms, 58 for four bedrooms, and 78 for 5 bedroom housing units.
Establish affordable housing to use the VA’s vouchers. (See Needs Assessment Section)
Discussion
The Municipality anticipates continued efforts through the HAND Commission and its Oversight Subcommittee on Homelessness (HCOSH) to develop projects that best meets the demand for affordable housing in Anchorage. With decreasing federal and state funding to the jurisdiction, there will be a greater need to develop partnerships and create new venues to increase affordable housing. There are several target populations that are vulnerable; however, with renewed public interest and drive—demonstrated throughout 2012 and early 2013 at HAND and HCOSH Commission meetings—there are great opportunities to explore new ideas.

Consolidated Plan ANCHORAGE 106
OMB Control No: 2506‐0117 (exp. 07/31/2015)
MA‐15 Housing Market Analysis: Cost of Housing ‐ 91.210(a)
Introduction
Before exploring housing and a homeless needs assessment, it is important to take a quick review of the cost of living in Anchorage and recognize that housing is by far the largest expense when measured by the Consumer Price Index. The Anchorage CPI is the only measure of CPI for Alaska.[1] The CPI measures consumption patterns of spending and can be used in comparison with other cities across the Nation. The 2010 CPI for Anchorage shows 41.3% was spent on housing, followed by 17.4% for transportation, and 14.5 % for food and beverage.[2]
According to Alaska economists, the high cost of housing in Anchorage became the highest in the state in 2010, with an annual average sale price for a Single‐Family Home at $328,000. Wage earnings in Anchorage to purchase a home must account for 1.44 of the average wage earnings of workers in the area. The wage earnings reflect an average single‐family home with a 30‐year mortgage and 15% down payment.
Rental market conditions in Anchorage are tight for both apartment rentals and single family resident rentals. Low levels of new rental supply during the past 2 years, previous employment growth, and the 30‐percent increase in the number of military employees and family members in the area since 2005 have contributed to the tighter rental market conditions. In 2010, Anchorage also accounted for the highest rents in the state, reflecting $1,127 for a two‐bedroom apartment.
Table 1 shows a 59% increase in the median home value from 2000 to the period covering 2005‐2009. The percent change increase for the median contract rent is 25%, less than half of the median home value. This means while the median home value has increased by almost 60%, the median contract rent has increased at less than half of the percentage or value. So while home prices have gone up (in value), rent has not increased at the same high percent.
Cost of Housing
Base Year: 2000 Most Recent Year: 2009 % Change
Median Home Value 152,300 255,900 68%
Median Contract Rent 696 921 32%
Table 29 – Cost of Housing
Data Source: 2000 Census (Base Year), 2005‐2009 ACS (Most Recent Year)
Rent Paid Number %
Less than $500 5,257 13.0%
$500‐999 20,894 51.7%
$1,000‐1,499 9,609 23.8%
$1,500‐1,999 3,628 9.0%
$2,000 or more 1,058 2.6%
Total 40,446 100.0%
Table 30 ‐ Rent Paid
Data Source: 2005‐2009 ACS Data

Consolidated Plan ANCHORAGE 107
OMB Control No: 2506‐0117 (exp. 07/31/2015)
MA 15 Table 1 Median Home Value and Median Contract Rent Cost
MA 15 Table 5 Rent Paid
MA 15 Availability of Sufficient Housing
MA 15 Additional Information Page 1
MA 15 Additional Information Page 2
MA 15 Additional Information Page 3

Consolidated Plan ANCHORAGE 108
OMB Control No: 2506‐0117 (exp. 07/31/2015)
MA 15 Additional Information Page 4
MA 15 Additional Information Page 5
MA 15 Additional Information Page 6
MA 15 Additional Information Page 7
MA 15 Additional Information Page 8
MA 15 Additional Information Page 9
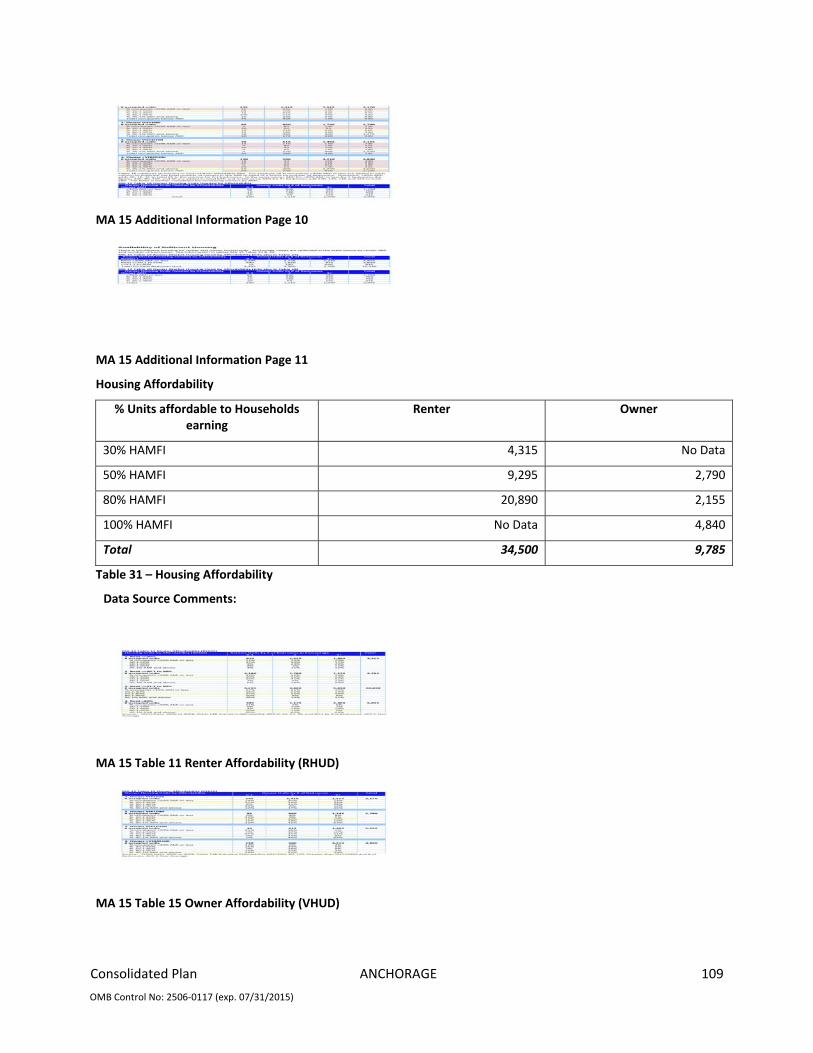
Consolidated Plan ANCHORAGE 109
OMB Control No: 2506‐0117 (exp. 07/31/2015)
MA 15 Additional Information Page 10
MA 15 Additional Information Page 11
Housing Affordability
% Units affordable to Households earning
Renter Owner
30% HAMFI 4,315 No Data
50% HAMFI 9,295 2,790
80% HAMFI 20,890 2,155
100% HAMFI No Data 4,840
Total 34,500 9,785
Table 31 – Housing Affordability
Data Source Comments:
MA 15 Table 11 Renter Affordability (RHUD)
MA 15 Table 15 Owner Affordability (VHUD)

Consolidated Plan ANCHORAGE 110
OMB Control No: 2506‐0117 (exp. 07/31/2015)
Table 12 Renter Affordability and Mismatch for Renters with a Higher AMI
MA 15 Tables 21 and 22
Monthly Rent
Monthly Rent ($) Efficiency (no bedroom)
1 Bedroom 2 Bedroom 3 Bedroom 4 Bedroom
Fair Market Rent 706 803 1,007 1,450 1,766
High HOME Rent 725 826 1,036 1,386 1,526
Low HOME Rent 725 787 945 1,092 1,218
Table 32 – Monthly Rent
Data Source: HUD FMR and HOME Rents
MA 15 Table 6 Cost of Housing by Monthly Rent
Is there sufficient housing for households at all income levels?
There is insufficient housing for renter and owner households. Anchorage needs are reflected in the table below by renter AMI and number of bedrooms. See information in tables MA 15 Table 19 & 20.
How is affordability of housing likely to change considering changes to home values and/or rents?
Housing affordability is very often measured as a percentage of monthly income. In fact, that’s the measure used in programs like the HOME to bring payments down to an affordable level a percentage of monthly income. Across the country, from 2009 to 2011, the number of people paying less than 30 percent of their income on housing fell from 60.2 percent of the population to 58.6 percent. That number surprisingly fell for both owners and renters at a time when buying is considered so affordable.[1] As presented in Table 19, the number of renter units by number of bedrooms needed is 10,340; and, as reflected in Table 20 owners need 2.995 affordable homes.
Many Anchorage homeowners hold stake to mobile homes, which has been in steady decline since 2000. At the height of popularity 1980 to 1990, there were between 7,398 and 6,754 mobiles homes. According to the 2012

Consolidated Plan ANCHORAGE 111
OMB Control No: 2506‐0117 (exp. 07/31/2015)
U.S. Census mobile homes comprise only 5% of the housing stock. During a May 2012 Assembly work session with the DHHS Director, many members pointed to the importance of mobile homes as a safety net for those with little income for housing. Consequently, FY2013 monies were designated for a Minor Repair Program for mobile homes.
How do HOME rents / Fair Market Rent compare to Area Median Rent? How might this impact your strategy to produce or preserve affordable housing?
In general, HOME rents and HUD's Fair Market rents are substantially less than Anchorage's median rents. What this means is that projects that are rent restricted, such as those with HOME or tax credits, have a built‐ in demand. There is never a problem renting the units. In addition, median rents are generally more than 30 percent of the monthly income for low‐income renters, creating an affordability issue in Anchorage.
Therefore, a strategy in producing or preserving affordable housing in Anchorage would be to focus on rental development. There is a need to either build new or acquire and rehabilitate rentals in conjunction with non‐profits (and CHDOs). In addition, the Municipality may promote through policy and incentives the development of rentals at market rates. Both strategies will create and preserve affordable housing by directly increasing the supply and through the increase of the rental‐housing stock, lessening the demand pressure on rents allowing the rents on the affordable stock to stabilize or even decrease.
Building new homeowner units at any market level will also lessen the pressure. Even increasing the stock of high‐end housing will have a ripple affect on rental prices as people move up vacating lesser rent or mortgage units. As vacancy rates go up, rents will tend to decrease.
Discussion
Between 2007 and 2012, Anchorage housing costs increased by 13.2 percent while the nation’s rose 6.3 percent. In 2010, the nation’s housing costs fell while Anchorage’s increased by nearly 1 percent. These numbers reflect the difference between the tough national housing market of the past five years and Anchorage’s relatively healthy market. In future years, this is likely to change as the U.S. housing market continues to recover.[1]
Further discussion will be held with HAND Commissioners and it’s HCOSH Committee to continue efforts that ensure affordable housing for renters, owners, mobile home owners, and the homeless. With low rental vacancy rates, just securing a rental unit is already a challenge. Increasing rental rates and the lack of affordable single family housing is compelling many households to live in the Matanuska Valley‐Susitna area.

Consolidated Plan ANCHORAGE 112
OMB Control No: 2506‐0117 (exp. 07/31/2015)
MA‐20 Housing Market Analysis: Condition of Housing – 91.210(a)
Introduction
Only 1,243 housing units for owner occupancy has been constructed since 2007 and an additional 1,258 of duplex and multi‐family units. The demand has increase more than the number of newly constructed units.
Definitions
The Municipality's definition for "substandard condition” is a structure, building, or property that is in a condition that endangers the safety or welfare of the public or the occupants. Code violation complaints can be filed online at: http://www.muni.org/Departments/OCPD/development/BSD/Pages/CodeEnforcement.aspx. Most code violations are not required to be corrected unless other work is conducted or is it is an immediate threat to life or safety of the public or the occupants. A “substandard condition would be considered suitable for rehabilitation unless the cost of rehab exceeds the cost of replacement.”
Condition of Units
Owner‐Occupied Renter‐Occupied Condition of Units
Number % Number %
With one selected Condition 18,291 29% 16,535 41%
With two selected Conditions 611 1% 1,396 3%
With three selected Conditions 71 0% 104 0%
With four selected Conditions 31 0% 0 0%
No selected Conditions 44,152 70% 22,411 55%
Total 63,156 100% 40,446 99%
Table 33 ‐ Condition of Units
Data Source: 2005‐2009 ACS Data
Year Unit Built
Owner‐Occupied Renter‐Occupied Year Unit Built
Number % Number %
2000 or later 7,159 11% 4,378 11%
1980‐1999 26,404 42% 13,836 34%
1950‐1979 28,658 45% 21,023 52%
Before 1950 935 1% 1,209 3%
Total 63,156 99% 40,446 100%
Table 34 – Year Unit Built
Data Source: 2005‐2009 CHAS

Consolidated Plan ANCHORAGE 113
OMB Control No: 2506‐0117 (exp. 07/31/2015)
Risk of Lead‐Based Paint Hazard
Owner‐Occupied Renter‐Occupied Risk of Lead‐Based Paint Hazard
Number % Number %
Total Number of Units Built Before 1980 29,593 47% 22,232 55%
Housing Units build before 1980 with children present 9,185 15% 4,290 11%
Table 35 – Risk of Lead‐Based Paint
Data Source: 2005‐2009 ACS (Total Units) 2005‐2009 CHAS (Units with Children present)
Vacant Units
Suitable for Rehabilitation
Not Suitable for Rehabilitation
Total
Vacant Units 2,358 0 2,358
Abandoned Vacant Units 0 0 0
REO Properties 1,777 0 1,777
Abandoned REO Properties 0 0 0
Table 36 ‐ Vacant Units
Data Source Comments:
Need for Owner and Rental Rehabilitation
As the owner and rental housing ages there is a growing need to rehabilitate these units. Overall, the housing stock is newer than that in many older cities in other parts of the nation. But, with each passing decade, the issues of aging rental and ownership housing that has not received periodic maintenance and upgrades will become more apparent particularly in the segments serving low‐and very‐low income families. The largest group in housing for both owners and renters is housing between the ages of 35 and 63 years. The life‐expectancy of most housing systems such as roofs, furnaces, flooring, and hot water/plumbing, are significantly less than 35 years. It is important, to the maximum extent possible, to provide programs that offer owner and rental housing rehabilitation assistance.
Empirically, the Municipality has evidence of it offering owner‐ and rental‐rehabilitation programs and disabled‐access programs since the 1980’s. Without exception, demand has far outpaced available funds. In 2012, the Municipality’s Subrecipient administering the Minor Repair Program received over 100 applications to the 20 available slots funding allowed.
Additionally, the Housing Needs analysis shows that families making less than 30% AMI comprise 46% of the housing that is substandard. The most unable to address their housing needs are the most effected, clearly making housing rehabilitation a priority for the duration of this plan.
Estimated Number of Housing Units Occupied by Low or Moderate Income Families with LBP Hazards
Based on housing age/occupant income data provided by HUD's CPD demographic data, 51,825 (50.02 percent) of the occupied housing units were built before 1979. Of these, 29,593 (47 percent) are owner‐occupied and 22,232 (55 percent) are rental units.
The MOA’s records for the MRP show a very low % of instances where LBP needed to be remediated in a project. During 2003 ‐ 2012, the MRP assisted 319 homeowners. Out of those, 136 were constructed prior to 1978 and required testing for LBP. Of those 136 units tested, 12 were positive and required remediation, which constitutes 9%. One could comfortably give a deviation 20% of the 9%, resulting in a plus or minus of 1.8% (9% ± 1.8% = 7.2%,

Consolidated Plan ANCHORAGE 114
OMB Control No: 2506‐0117 (exp. 07/31/2015)
10.8%) In the total population of houses constructed prior to 1978 (51,825), the number of homes with LBP may range from 3,731 to 5,597.
On March 7, 2008, the State of Alaska, Dept of Health and Social Services, Div. of Public Health, Sect. of Epidemiology published Bulletin No. 7. The title of Bulletin No. 7 was Blood Lead Epidemiology and Surveillance, Non‐Occupational Exposures in Adults and Children – AK, 1995–2006. AK regulations require laboratories and health care providers to report all blood lead level (BLL) results ≥ 10 micrograms per deciliter (µ/dL) to the Section of Epidemiology. The Ctr for Disease Control considers BLLs ≥ 10 µ/dL to be a health concern for children aged >6 (subsequent CDC announcements have renamed the “level of concern” to “reference value” and lowered the value to ≥5 µ/dL). AK received BLL reports on 1,141 children during the 10‐year period that were aged >6. Of them, 17 (1.5%) had elevated BLL that were ≥ 10 µ/dL. Sources of exposure included 6 (35%) foreign/adoptee from abroad, 2 (12%) playing with air gun pellets, 2 (12%) pica (eating non‐nutritive substances), and 7 (41%) unknown. The bulletin did not specify from where the children came. Included in the bulletin were similar reports for children aged 6‐17, and adults aged 18+. Significant sources included indoor firing ranges, accounting for 70 persons, which constituted 81% of the reported “levels of concern”. The 2nd highest source for all age groups was children born abroad or adopted (10%). People casting lead as a hobby constituted the 3rd highest source, amounting to 3.4%. Contamination through LBP didn’t make the list. Among children >6 years tested from 1997‐2001 (according to the CDC), the proportion who had elevated BLLs was lower in AK than in the US (1.5% vs. 5.1% respectively).
LBP in Anchorage’s housing continues to be a rare occurrence. Nevertheless, all CDBG‐ and HOME‐funded programs dealing with rehabilitation of older homes include funds to address lead‐based paint according to Part 35 regulations.
CSD will continue to collaborate with State and local agencies, nonprofit groups, and the private sector to reduce housing‐related LBP hazards, especially for low‐income families and children. To implement this strategy, CSD has developed LBP Policies and Procedures in compliance with 24 CFR 35 (Lead‐Based Paint Poisoning Prevention in Certain Residential Structures) which are incorporated into all its programs. These include acquisition, rehabilitation, and rental‐assistance programs funded by CDBG and HOME. Where program‐specific policies impose funding caps per client or per unit, these caps may be waived when costs required address lead‐based paint testing, evaluations, assessments and mitigation cause the project to exceed program limits.
Discussion
High housing costs reduce economic opportunities, access to jobs and services, and the ability of lower‐income households, including the elderly and persons with disabilities to live in the communities and neighborhoods of their choice. The affordability gap results in a concentration of lower‐income households in older neighborhoods that have higher levels of substandard housing and overcrowding.

Consolidated Plan ANCHORAGE 115
OMB Control No: 2506‐0117 (exp. 07/31/2015)
MA‐25 Public and Assisted Housing – 91.210(b)
Introduction
The information for this section of the Consolidated Plan was provided by the Alaska Housing Finance Corporation (AHFC). Applicable Federal Law and HUD regulations require that each Housing Authority develop and adopt a Public Housing Authority (PHA) Plan and update it on an annual basis. The PHA Plan provides details about Housing Authority programs, services, and general operations. In addition, the Plan focuses on implementation strategies designed to address residents' needs and issues, as well as outlining ways to improve operational efficiencies for the upcoming fiscal year. This planning mechanism requires that the Housing Authority examine its existing operational needs and design short and long‐term strategies to address those needs.
AHFC provides housing‐related research, planning, and program development services for Alaskan communities.
2,344 Housing Choice Vouchers;
64 project‐based voucher units;
43 vouchers reserved for individuals with disabilities;
95 vouchers reserved for individuals displaced due to domestic violence;
20 vouchers reserved for referrals from Anchorage Community Mental Health Services; and,
155 vouchers reserved for referrals from the Alaska VA Healthcare System (VASH vouchers).
AHFC also provides monthly rental subsidy equivalent to 35 project‐based vouchers for persons at the Karluk Manor, a Housing First development targeting chronically homeless individuals with substance abuse and alcohol addictions.
As of April 2013 in Anchorage there were over 1,500 on the Housing Choice Voucher waiting list, and over 3,000 on the waiting list for various AHFC‐owned rental assistance units.
The Anchorage Housing Choice Voucher waiting list has gone to a lottery system, approximately every 2‐3 years the voucher waiting list will open to applicants for a month. Those applicants will then be worked off the waiting list for the next 2‐3 years, until the waiting list is nearly exhausted, at which point another lottery is held. AHFC has conducted two such lotteries in the past three years, and the process has streamlined and provided a more efficient and effective way for applicants to manage their housing needs. Prior to the lottery, the list was never closed, there was a preference system in which people would apply and based on preference points would move to the top of the list. Those without high preference points had been waiting on the list for more than eight years. With this new process, this no longer occurs.
In the past year AHFC created three new transitional tenant‐based rental assistance programs: the Empowering Choice Housing Program for victims of domestic violence and sexual assault; the Youth Aging Out of Foster Care program for youth aged 18‐24 that transitioning to independent living, and the Parolee/Probationer Re‐Entry program for those transitioning out of the state prison system.
In order to continue to serve those with special needs in our communities, AHFC has created set aside programs. For the elderly and disabled population, AHFC has 240 low‐income units. Additionally, AHFC has set aside 96 vouchers statewide, exclusively for persons with disabilities. Anchorage also has a set aside of 20 vouchers for individuals referred from Anchorage Community Mental Health Services.
AHFC also conducts an annual ADA‐504 needs assessment to create priorities for modifications and planned unit improvements, such as enlarging door openings, adding grab bars in bathrooms and hallways, installing automatic doors, and removing carpet to facilitate wheelchair movement.

Consolidated Plan ANCHORAGE 116
OMB Control No: 2506‐0117 (exp. 07/31/2015)
Totals Number of Units
Program Type
Vouchers
Special Purpose Voucher
Certificate Mod‐Rehab
Public Housing
Total Project ‐based
Tenant ‐based
Veterans Affairs
Supportive Housing Family Unification
Program Disabled
*
# of units vouchers available 0 72 4,419 0 4,419 678 0 402
# of accessible units
*includes Non‐Elderly Disabled, Mainstream One‐Year, Mainstream Five‐year, and Nursing Home Transition
Table 37 – Total Number of Units by Program Type
Data Source: PIC (PIH Information Center)
MA 25 Table 1 Totals Number of Units by Program Type
MA 25 Tables 3 and 4

Consolidated Plan ANCHORAGE 117
OMB Control No: 2506‐0117 (exp. 07/31/2015)
Describe the supply of public housing developments:
Describe the number and physical condition of public housing units in the jurisdiction, including those that are participating in an approved Public Housing Agency Plan:
In Anchorage, AHFC operates:
506 Public Housing Program units, of which 120 serve elderly/disabled populations exclusively
137 Section 8 New Multifamily Housing Program units, of which 120 serve elderly/disabled populations exclusively
48 affordable housing units which accept individuals with vouchers
70 Section 8 Moderate Rehabilitation Program single‐room occupancy units serving individuals who qualify as homeless under the McKinney‐Vento Act
The lack of affordable housing in the Anchorage area is evidenced by the very low vacancy rates. Many times this is most acutely felt by low income residents. In particular, the waiting list in Anchorage indicates that one and two bedroom waiting lists are in the highest demand, and units that provide accessible features for the disabled are also very much needed.
Information regarding AHFC’s FY2012 activities can be found in its FY2012 Moving to Work Report at: http://www.ahfc.us/files/9913/5754/7544/mtw_annual_report_fy12_102612‐1.pdf.
Information regarding AHFC’s FY2013 Moving to Work Annual Plan is at: http://www.ahfc.us/files/5113/6736/1808/mtw_2013.pdf.
Information regarding AHFC’s FY2014 Moving to Work Annual Plan is at: http://www.ahfc.us/files/9713/6736/1483/mtw_2014.pdf.

Consolidated Plan ANCHORAGE 118
OMB Control No: 2506‐0117 (exp. 07/31/2015)
Public Housing Condition
Public Housing Development Average Inspection Score
Anchorage Central 97
Anchorage South 96
Anchorage East 91
Westhaven 76
Westvale Manor 62
Table 38 ‐ Public Housing Condition
Describe the restoration and revitalization needs of public housing units in the jurisdiction:
AHFC is facing the same issues experienced by all other affordable housing providers across the country. Industry‐ wide, both operating and capital funding has been incrementally decreased over the last decade as older properties continues to age. AHFC is taking a two pronged approach to addressing the issue. The long‐term capital needs of the public housing portfolio are being prioritized first to potential health and safety needs such as upgrading fire suppression and alarm monitoring systems, followed by building envelope and infrastructure needs. Second, AHFC is moving forward with the development of new affordable housing for both families and the senior population in high needs areas utilizing the Alaska Corporation for Affordable Housing (ACAH).
Describe the public housing agency's strategy for improving the living environment of low‐ and moderate‐income families residing in public housing:
In 2011, the Alaska Legislature amended AHFC statutes to allow it to create a subsidiary, Alaska Corporation for Affordable Housing (ACAH), for the purpose of developing affordable housing throughout Alaska. ACAH is organized as a 501(c)(3) tax‐exempt organization under the IRS Code. As a subsidiary of AHFC, ACAH has the same seven member board as AHFC, with three officers; President, Vice President and Secretary/Treasurer.
The Corporation was formed to develop, manage and operate affordable housing and provide supportive and related services to support the mission of AHFC. AHFC statutes do not provide AHFC with the power to undertake certain types of housing or to participate in some financing and ownership structures. The ACAH mission will be to undertake the types of affordable housing and services that are not open to AHFC directly, but which support AHFC's mission in providing affordable housing and services to individuals and groups in need.[1]
ACAH has purchased land in the Mountain View neighborhood of Anchorage and is in the development stage of a new low‐to moderate‐income apartment community consisting of both family and elderly units. Although still in the planning stages, the size of the development is envisioned to be approximately sixty to seventy units in several bedroom sizes. As part of this undertaking, ACAH is also including the re‐development of sixteen family units in the San Roberto area to replace aging buildings in dire need of replacement.
Discussion:
AHFC will continue to provide affordable housing to extremely low‐, very low‐ and low‐income families, seniors and disabled individuals through the public housing program. It will also continue to provide a full service approach to property management and maintenance. General up‐keep and maintenance of property is important for curb appeal and resident satisfaction. Property management and maintenance staff conduct regular site inspections using standard checklists at least annually. Inspections results are used to create plans for capital improvements.
On 24 CFR Parts 901,902 and 907:
“HUD has a proposed rule that would make two sets of amendments to improve evaluation and oversight of public housing agencies (PHAs). First proposed rule would amend HUD’s Consolidating the regulations governing assessment of a PHA’s program in one part of the Code of Federal Regulations (CFR); revising certain PHAS regulations based on the Department’s experience with PHAS since it was established as the new system for

Consolidated Plan ANCHORAGE 119
OMB Control No: 2506‐0117 (exp. 07/31/2015)
evaluating a PHA in 1998; and updating certain PHAS procedures to reflect recent changes in public housing operations from conversion by PHAs to asset management, including updating and revising the PHAS scoring. PHAS is designed to improve the delivery of services in public housing and to enhance trust in the public housing system among PHAs, public housing residents, and the general public, by providing a management tool for effectively and fairly measuring the performance of a PHA in essential housing operations of its projects, based on standards that are uniform and verifiable. The changes proposed by this rule are intended to enhance the efficiency and utility of PHAS.
Second, the proposed rule would establish, in a separate part of the CFR, the regulations that would specify the actions or inactions by which a PHA would be determined to be in substantial default, the procedures for a PHA to respond to such a determination or finding, and the sanctions available to HUD to address and remedy substantial default by a PHA. To date, such regulations have been included in the PHAS regulations, but the actions or inactions that constitute substantial default are not limited to failure to comply with PHAS regulations. Accordingly, the proposed regulations applicable to substantial default are more appropriately codified in a separate CFR part. This proposed rule is also publishing the scoring processes for each of the PHAS scoring categories.

Consolidated Plan ANCHORAGE 120
OMB Control No: 2506‐0117 (exp. 07/31/2015)
MA‐30 Homeless Facilities and Services – 91.210(c)
Introduction
The priorities for ending homelessness are based on the recognition that homelessness results from more than just a lack of affordable housing.
Facilities and Housing Targeted to Homeless Households
Emergency Shelter Beds Transitional Housing Beds
Permanent Supportive Housing Beds
Year Round Beds (Current & New)
Voucher / Seasonal / Overflow Beds
Current & New Current & New Under Development
Households with Adult(s) and Child(ren) 154 0 211 173 0
Households with Only Adults 390 150 241 414 0
Chronically Homeless Households 0 0 0 84 0
Veterans 50 0 44 17 0
Unaccompanied Youth 0 0 0 0 0
Table 39 ‐ Facilities and Housing Targeted to Homeless Households
Data Source Comments:
MA 30 Table 2 Household With and Without Public‐Assistance Income

Consolidated Plan ANCHORAGE 121
OMB Control No: 2506‐0117 (exp. 07/31/2015)
MA 30 Table 3 Facilities with Supportive Services Page 1
MA 30 Table 3 Facilities with Supportive Services Page 2
MA 30 Table 3 Facilities with Supportive Services Page 3
MA 30 Table 3 Facilities with Supportive Services Page 4
Describe mainstream services, such as health, mental health, and employment services to the extent those services are use to complement services targeted to homeless persons
The Municipality is a partner with the Anchorage Continuum of Care, a collaborative effort with the Housing and Neighborhood Development Commission and Commission’s Oversight Subcommittee on Homelessness, and the Anchorage Coalition to End Homelessness. The CoC strives to link household with mainstream services such as Social Security Supplemental Income (SSI), Social Security Disability Insurance, Temporary Assistance to Needy Families (TANF), Medicaid, Food Stamps, State Children’s Health Program, Workforce Investment Act, and Veterans Health Care Services.
In Anchorage, efforts to link households to mainstream services are implemented and tracked through CoC‐funded agencies. CoC funded agencies receive HUD monies through a competitive process that requires community collaboration and performance evaluation of national objectives. One of the national objectives is to link CoC‐funded agency clients to mainstream services.
The current percentage of participants in all Anchorage Continuum of Care (CoC)‐funded projects that receive mainstream benefits when they leave their program is 70%.[1] This percentage far surpasses the national objectives’ goal of 20%. A significant number of CoC‐funded agency’s beneficiaries rely on Medicaid and Medicare Health Insurance, Supplemental Nutritional Assistance Program, and, Section 8, and, Public Housing, Rental Assistance. To continue meeting and surpassing the national goal of 20%, the CoC‐funded agencies will: support

Consolidated Plan ANCHORAGE 122
OMB Control No: 2506‐0117 (exp. 07/31/2015)
case manager trainings by the Anchorage Community Mental Health Services for SSI/SSDI Outreach and Access, & Recovery otherwise known as SOAR, which is funded by the Alaska Mental Health Trust Authority. CoC‐funded agencies will also ensure all mainstream benefits are available at Project Homeless Connect (ACH). Additional effort by local agencies includes RurAL CAP’s quarterly training to complete mainstream assessment during intakes, as well as Abused Women’s Aid in Crisis, Inc. partnerships with Alaska Housing Finance Corporation to implement voucher programs for the Empowering Choice Housing Program (95 vouchers).
Aside from CoC efforts, also on the map of known mainstream services, a total of 6,328 households were identified as receiving public assistance income in the past twelve months, accounting for 6% of households in the Anchorage community.
List and describe services and facilities that meet the needs of homeless persons, particularly chronically homeless individuals and families, families with children, veterans and their families, and unaccompanied youth. If the services and facilities are listed on screen SP‐40 Institutional Delivery Structure or screen MA‐35 Special Needs Facilities and Services, describe how these facilities and services specifically address the needs of these populations.
Emergency shelters (ES), transitional housing (TH), and permanent housing (PH) with supportive services serve to meet homeless needs for chronically homeless individuals and families, families with children, veterans and their families, and unaccompanied youth are included in table MA 30 Table 3 Facilities with Supportive Services (above).

Consolidated Plan ANCHORAGE 123
OMB Control No: 2506‐0117 (exp. 07/31/2015)
MA‐35 Special Needs Facilities and Services – 91.210(d)
Introduction
Licensed community care facilities offer housing and specialized services for children and adults that have special needs. Many of these facilities provide housing and services to persons with disabilities. The Municipality through public and private partnerships continues to strive to provide services and safe, decent and affordable housing for individuals in need.
Including the elderly, frail elderly, persons with disabilities (mental, physical, developmental), persons with alcohol or other drug addictions, persons with HIV/AIDS and their families, public housing residents and any other categories the jurisdiction may specify, and describe their supportive housing needs
Anchorage has a variety of services and programs for special needs populations such as the elderly, frail elderly, persons with disabilities, and persons with alcohol and other drug addiction, and persons with HIV/AIDS and their families. Appendix E is a listing of available services in the Anchorage community. The Municipality also offers a specialized program that is unique to serve seniors and persons with disabilities, titled the Aging and Disability Resource Center this program is housed in the DHHS. The ADRC works closely with state services and the Anchorage Senior Center. The ADRC Program Coordinator is also on the Anchorage Continuum of Care (CoC) Board of Directors.
Describe programs for ensuring that persons returning from mental and physical health institutions receive appropriate supportive housing
Under the Anchorage CoC, the system of services for discharge is met primarily through the Anchorage Community Mental Health Services (ACMHS), the state’s largest community mental health center which provides housing and services. The Alaska Psychiatric Institute (API) P&P delineates patient discharge to prevent homelessness. There is a discharge protocol between API and ACMHS through a Memorandum of Affiliation agreement. ACMH is the primary facilitator for community re‐entry for persons with mental illness. ACMHS identifies housing resources/search, rental subsidy, assisted living homes & community placements. The Anchorage CoC also benefits from The Alaska Homeless Coalition CoC which worked with The Alaska Council on the Homeless to develop a special section (F‐2) in Alaska's 10‐Year plan, which address API discharge.
There are no state or municipally funded health care facilities to coordinate discharge policies. All health care in Anchorage is privatized, with the exception of the Alaska Native Medical Center, which provides services to eligible Alaska Native and American Indians who live in Alaska. Anchorage CoC members work closely with all health care facilities, including emergency service facilities and long‐term health care. By statute (AS 47.24.010‐900) whenever health care workers have “reasonable cause to believe a vulnerable adult suffers from abandonment, exploitation, abuse, neglect, or self‐neglect shall, not later than 24 hours after first having cause for the belief”, must report the belief to the department’s central information and referral service of vulnerable adults (AK Adult Protective Services). Protective services will facilitate placement in assisted living homes.
The larger hospitals in Anchorage, Providence Medical Center and Alaska Regional, have care counselors who identify potentially homeless persons and coordinates with local agencies to discharge to local shelters and services. Local non‐McKinney‐Vento programs/shelters include: the Anchorage Transfer Station for public inebriates; Brother Francis Shelter for single males and females; AWAIC for victims of domestic violence, Clare House for non‐domestic violence women and their children; McKinnell Shelter for families and single fathers; and, Cook Inlet Tribal Council’s services for chronically homeless persons.
Specify the activities that the jurisdiction plans to undertake during the next year to address the housing and supportive services needs identified in accordance with 91.215(e) with respect to persons who are not homeless but have other special needs. Link to one‐year goals. 91.315(e)
N/A

Consolidated Plan ANCHORAGE 124
OMB Control No: 2506‐0117 (exp. 07/31/2015)
For entitlement/consortia grantees: Specify the activities that the jurisdiction plans to undertake during the next year to address the housing and supportive services needs identified in accordance with 91.215(e) with respect to persons who are not homeless but have other special needs. Link to one‐year goals. (91.220(2))
The consolidated plan must provide a concise summary of the priority housing and supportive service needs of persons who are not homeless but who may or may not require supportive housing (i.e., elderly, frail elderly, persons with disabilities (mental, physical, developmental), persons with alcohol or other drug addiction, persons with HIV/AIDS and their families, and public housing residents). If the jurisdiction intends to use HOME funds for tenant‐based assistance to assist one or more of these subpopulations, it must specify local market conditions that led to the choice of this option.
One year goals of the Municipality include services provided by the Minor Repair Program and the Mobile Home Repair Program. The Minor Repair Program provides assistance for increased accessibility, emergency efficiency or repairs to items presenting a threat to health or safety in an owner‐occupied home. Handicapped ramps, hand rails, and related amenities are provided to assist those with disabilities. Also, the Mobile Home Repair Program, although not yet established, will provide similar support for disabled persons.

Consolidated Plan ANCHORAGE 125
OMB Control No: 2506‐0117 (exp. 07/31/2015)
MA‐40 Barriers to Affordable Housing – 91.210(e)
Negative Effects of Public Policies on Affordable Housing and Residential Investment
The MOA has worked with the community leaders and providers to identify barriers to affordable housing. This section describe the jurisdiction's strategy to remove or ameliorate negative effects of public policies that serve as barriers to affordable housing, as identified in accordance with 91.210(e).
See information below "MA‐40 Barriers to Affordable Housing".
MA‐40 Barriers to Affordable Housing Page 1 of 5
MA‐40 Barriers to Affordable Housing Page 2 of 5
MA‐40 Barriers to Affordable Housing Page 3 of 5
MA‐40 Barriers to Affordable Housing Page 4 of 5
MA‐40 Barriers to Affordable Housing Page 5 of 5

Consolidated Plan ANCHORAGE 126
OMB Control No: 2506‐0117 (exp. 07/31/2015)
MA‐45 Non‐Housing Community Development Assets – 91.215 (f)
Introduction
This section analyzes the jurisdiction's economic viability through employment, revenue streams, retail and service strength, vitality of the labor pool, and market factors affecting the economy. In summary, Anchorage's economy is fairly strong; however, construction has slowed and there are less federal monies coming into the economy.
Economic Development Market Analysis
Business Activity
Business by Sector Number of Workers
Number of Jobs Share of Workers
%
Share of Jobs
%
Jobs less workers
%
Agriculture, Mining, Oil & Gas Extraction 4,730 2,003 3 2 ‐1
Arts, Entertainment, Accommodations 12,514 10,147 9 11 2
Construction 10,953 5,478 8 6 ‐2
Education and Health Care Services 29,505 15,450 21 17 ‐4
Finance, Insurance, and Real Estate 8,634 4,764 6 5 ‐1
Information 3,885 2,251 3 2 ‐1
Manufacturing 2,678 1,544 2 2 0
Other Services 7,221 6,567 5 7 2
Professional, Scientific, Management Services 15,409 9,348 11 10 ‐1
Public Administration 13,981 11,900 10 13 3
Retail Trade 15,445 11,674 11 13 2
Transportation and Warehousing 12,122 5,553 9 6 ‐3
Wholesale Trade 3,915 4,336 3 5 2
Total 140,992 91,015 ‐‐ ‐‐ ‐‐
Table 40 ‐ Business Activity
Data Source: 2005‐2009 ACS (Workers), 2010 ESRI Business Analyst Package (Jobs)

Consolidated Plan ANCHORAGE 127
OMB Control No: 2506‐0117 (exp. 07/31/2015)
Anchorages Major Employment Sectors Page 1
Anchorages Major Employment Sectors Page 2
Anchorages Major Employment Sectors Page 3
Anchorages Major Employment Sectors Page 4
Anchorages Major Employment Sectors Page 5
Anchorages Major Employment Sectors Page 6

Consolidated Plan ANCHORAGE 128
OMB Control No: 2506‐0117 (exp. 07/31/2015)
Anchorages Major Employment Sectors Page 7
Anchorages Major Employment Sectors Page 8
Anchorages Major Employment Sectors Page 9
MA 45 Tables 7 and 8
MA 45 Table 9 Business Activity

Consolidated Plan ANCHORAGE 129
OMB Control No: 2506‐0117 (exp. 07/31/2015)
Labor Force
Total Population in the Civilian Labor Force 152,056
Civilian Employed Population 16 years and over 140,992
Unemployment Rate 7.28
Unemployment Rate for Ages 16‐24 25.58
Unemployment Rate for Ages 25‐65 4.36
Table 41 ‐ Labor Force
Data Source: 2005‐2009 ACS Data
Alaska Workforce Investment Board Page 1
Alaska Workforce Investment Board Page 2
Workforce and Infrastructure Needs Page 1
Workforce and Infrastructure Needs Page 2

Consolidated Plan ANCHORAGE 130
OMB Control No: 2506‐0117 (exp. 07/31/2015)
Workforce and Infrastructure Needs Page 3
Workforce and Infrastructure Needs Page 4
Workforce and Infrastructure Needs Page 5
MA 45 Table 18 Wages for Occupational Categories
Occupations by Sector Number of People
Management, business and financial 53,949
Farming, fisheries and forestry occupations 372
Service 24,435
Sales and office 36,008
Construction, extraction, maintenance and repair 14,071
Production, transportation and material moving 12,157
Table 42 – Occupations by Sector
Data Source: 2005‐2009 ACS Data
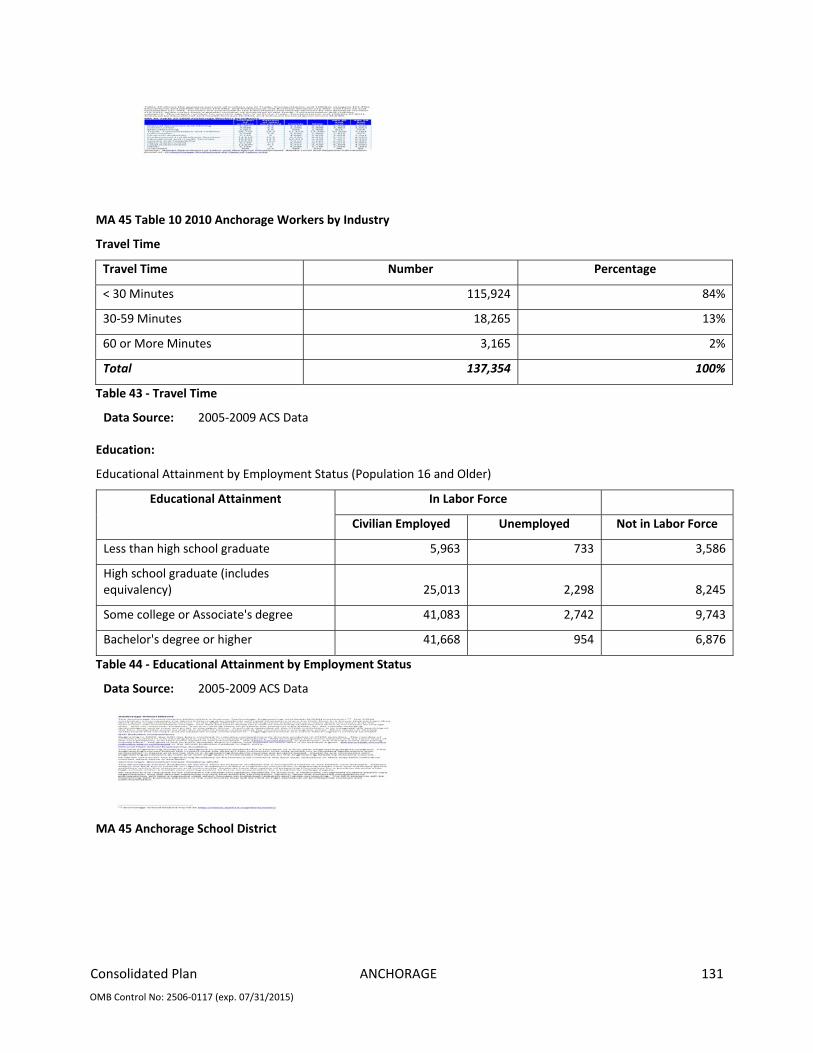
Consolidated Plan ANCHORAGE 131
OMB Control No: 2506‐0117 (exp. 07/31/2015)
MA 45 Table 10 2010 Anchorage Workers by Industry
Travel Time
Travel Time Number Percentage
< 30 Minutes 115,924 84%
30‐59 Minutes 18,265 13%
60 or More Minutes 3,165 2%
Total 137,354 100%
Table 43 ‐ Travel Time
Data Source: 2005‐2009 ACS Data
Education:
Educational Attainment by Employment Status (Population 16 and Older)
In Labor Force Educational Attainment
Civilian Employed Unemployed Not in Labor Force
Less than high school graduate 5,963 733 3,586
High school graduate (includes equivalency) 25,013 2,298 8,245
Some college or Associate's degree 41,083 2,742 9,743
Bachelor's degree or higher 41,668 954 6,876
Table 44 ‐ Educational Attainment by Employment Status
Data Source: 2005‐2009 ACS Data
MA 45 Anchorage School District
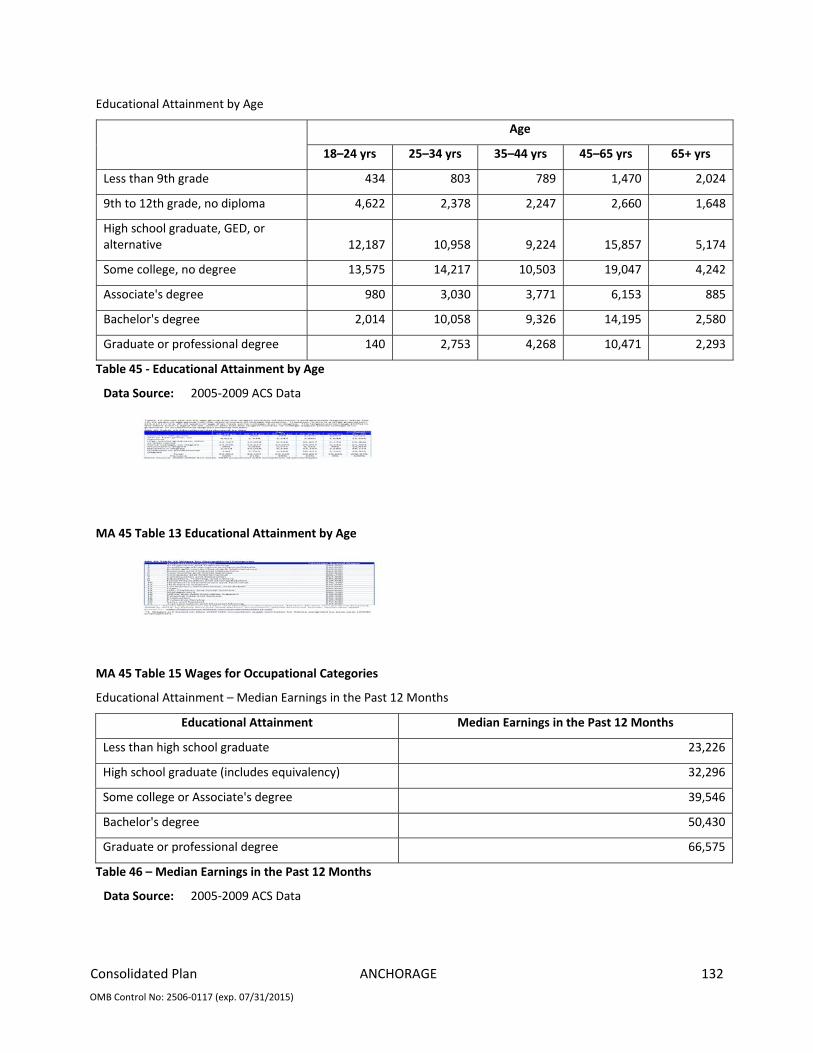
Consolidated Plan ANCHORAGE 132
OMB Control No: 2506‐0117 (exp. 07/31/2015)
Educational Attainment by Age
Age
18–24 yrs 25–34 yrs 35–44 yrs 45–65 yrs 65+ yrs
Less than 9th grade 434 803 789 1,470 2,024
9th to 12th grade, no diploma 4,622 2,378 2,247 2,660 1,648
High school graduate, GED, or alternative 12,187 10,958 9,224 15,857 5,174
Some college, no degree 13,575 14,217 10,503 19,047 4,242
Associate's degree 980 3,030 3,771 6,153 885
Bachelor's degree 2,014 10,058 9,326 14,195 2,580
Graduate or professional degree 140 2,753 4,268 10,471 2,293
Table 45 ‐ Educational Attainment by Age
Data Source: 2005‐2009 ACS Data
MA 45 Table 13 Educational Attainment by Age
MA 45 Table 15 Wages for Occupational Categories
Educational Attainment – Median Earnings in the Past 12 Months
Educational Attainment Median Earnings in the Past 12 Months
Less than high school graduate 23,226
High school graduate (includes equivalency) 32,296
Some college or Associate's degree 39,546
Bachelor's degree 50,430
Graduate or professional degree 66,575
Table 46 – Median Earnings in the Past 12 Months
Data Source: 2005‐2009 ACS Data

Consolidated Plan ANCHORAGE 133
OMB Control No: 2506‐0117 (exp. 07/31/2015)
Based on the Business Activity table above, what are the major employment sectors within your jurisdiction?
Anchorage's largest economic sectors are: transportation (air and water); federal, state and municipal government; natural resource development (petroleum, mining); health care; tourism/leisure; and, construction.
Describe the workforce and infrastructure needs of the business community:
Table 9 below shows a percentage changes by business activity. Area that shows an increase is in oil and gas (15%) and local education (11%) and Professional & Business Services (6%). Both Educational & Health Services and Health Care each grew by 4%. Businesses areas of loss reflect Information (‐3%) and Financial Activities (‐4%). State economists are forecasting a growing demand for health care.[1] These economists point to an expected additional 38,749 jobs between 2010 and 2020, an overall increase of 12%. Health care and social assistance, related to Alaska's aging population, is projected to grow by 31%‐‐the highest of any industry. The second highest growth will be in mining, minus oil and gas, at 19%.
Describe any major changes that may have an economic impact, such as planned local or regional public or private sector investments or initiatives that have affected or may affect job and business growth opportunities during the planning period. Describe any needs for workforce development, business support or infrastructure these changes may create.
Major changes that may have an economic impact could be recently passed legislation regarding oil revenue. In a March 21, 2013 article, the Anchorage Daily News (ADN) featured news regarding a narrow vote in the Alaska Senate, 11 9, where the legislature approved a massive tax cut for the oil industry in the hope that it would lead to more oil production in Alaska[1]. According to the ADN, some believe that Senate Bill 21 will cost the state treasury billions of dollars over the next decade, but supporters say it will eventually lead to greater oil production. Opponents say it's nothing more than a giveaway to the industry, which told the Legislature it would reduce its efforts here if it didn't get tax breaks even as it told stock analysts the opposite. The bill throws out the five‐year‐old tax system known as ACES, for Alaska's Clear and Equitable Share, which became law under then Governor Sarah Palin. It is unclear what impact in the Consolidated Plan's five year period (2013‐2017), this recent legislation will have on Anchorage's business and economy.
How do the skills and education of the current workforce correspond to employment opportunities in the jurisdiction?
The greatest number of persons employed in Anchorage have a bachelors degree or higher, the largest percentage of workers by industry are in Trade, Transportation and Utilities category, followed by Educational and Health Services, and Professional and Business Services, and Leisure and Hospitality. Occupations paying the highest average annual wages are in the following order by highest: Management; Architecture and Engineering; Legal; Healthcare Practitioners and Technical; Computer and Mathematical. The group with the largest number of bachelor's and graduate degrees is from 45‐65 years of age. The largest percentage in the labor pool is aged 45‐65, which most likely has the highest paid occupations. Thus the well educated, older and experienced labor pool matches the high end of the economic spectrums of business services in the municipality. In addition, a review of 2010 hires shows the largest percentage for retail sales workers (13%), followed by food and beverage serving workers (11%). Both of these occupations would likely be occupied by Anchorage's younger labor pool between 18‐24 years of age. (See MA 45 Table 12). This would also indicate the younger labor pool is making less earnings in comparison to the higher skilled or higher educated and older wager earners.
The Wages for Occupational Categories table is consistent with earlier findings that show a bachelor's or graduate degree will garner a higher average annual wage. However, the new 2010 new hires and economic forecast for Anchorage envisions the likelihood the young labor pool will be employed in the retail, sales, and leisure and personal care services.
Describe any current workforce training initiatives, including those supported by Workforce Investment Boards, community colleges and other organizations. Describe how these efforts will support the jurisdiction's Consolidated Plan.
See the section above on "Anchorage School District" and the section on "Alaska Workforce Investment Board".

Consolidated Plan ANCHORAGE 134
OMB Control No: 2506‐0117 (exp. 07/31/2015)
Does your jurisdiction participate in a Comprehensive Economic Development Strategy (CEDS)?
Yes
If so, what economic development initiatives are you undertaking that may be coordinated with the Consolidated Plan? If not, describe other local/regional plans or initiatives that impact economic growth.
The Municipality Of Anchorage participates in a Comprehensive Economic Development Strategy. Recently, the Municipality partnered with the Anchorage Economic Development Corporation (AEDC) to develop the "Anchorage Comprehensive Economic Development Strategy", July 12, 2010.[4] The updated report covers 2009‐2013, and serves as a progress report on economic development within the Municipality. In the Strategy report, the overarching goals of the Municipality is to foster economic growth, develop infrastructure, focus on education and workforce development, cultivate the visitor industry, and maintain a high quality of life for residents.
Objective E of the Strategy, titled Support Development of Public Facilities Which Serve Residents and Visitors, is to Support construction of a new Municipal Department of Health and Human Services building, which will adequately serve the needs of clients (see page 20‐21).
Goal II, for Infrastructure, identifies the importance of providing shelters in accordance with the American Disabilities Act, which is also a priority in a FY2012 CDBG funded project. Under Goal V, Quality of Life, there are several action steps that are consistent with this new Consolidated Plan and include:
Expand affordable rental housing opportunities for low and extremely low‐income households, with an emphasis on special needs and the homeless. Provide an effective mix of program and services that address the housing and housing‐related needs of residents
Preserve affordable rental and home ownership opportunities
Expand home ownership opportunities, particularly for low to moderate income households
Develop incentives for creating and developing affordable housing
Encourage the demolition and redevelopment of substandard housing
Encourage the maintenance and upkeep of existing housing in order to extend its useful life and neighborhood stability
Expand the availability of housing for seniors
Objective B: Reduce Homelessness has several identified action steps also consistent with the Consolidated Plan and includes:
Expand the supply of rental housing for special needs populations, with an emphasis on the homeless
Engage in homeless prevention activities including an effective mix of programs and services including case management to assist people in obtaining and retaining permanent housing
Assist in the development of a coordinated intake and discharge system
Support existing shelter services and the expansion of transitional housing services
Discussion
According to the Training Program Performance Report (February 2013), there were a number of successes to presents from 2012 in workforce development:[1]
Programs have attained high marks for placement, retention and employer satisfaction. In addition there has been substantial wage growth for trainees.
There has been a continuing growth of partnerships across providers, between business/industry and education, and between agencies and projects resulting in reduced duplication, leveraging of funding streams and easier access for the trainees.

Consolidated Plan ANCHORAGE 135
OMB Control No: 2506‐0117 (exp. 07/31/2015)
The programs have been on‐target for priority industries and the current economy with a developing capability for serving growth industries and major projects.
There has been good support for Regional Training Centers with many programs reaching into rural areas.
Pilot programs have resulted in templates for more effective and efficient training programs for both entry into the workforce and upgrading of skills to meet new standards or career opportunities.

Consolidated Plan ANCHORAGE 136
OMB Control No: 2506‐0117 (exp. 07/31/2015)
MA‐50 Needs and Market Analysis Discussion
Are there areas where households with multiple housing problems are concentrated? (include a definition of "concentration")
There are areas in the Municipality that are more affected by multiple housing problems and are identified by census tracts. This section identifies these areas by census tracts.
Table 1 and Table 2 provide a listing of Census Tracts where the Area Median Household Income is below 80% of the Anchorage Median Household Income. About a third of the population is below 80% of the Median Income level. As evidenced in other sections of this Plan, extremely low‐income and low‐income households often exceed 30 to 50% of their income on housing.
Are there any areas in the jurisdiction where racial or ethnic minorities or low‐income families are concentrated? (include a definition of "concentration")
Applying HUD's definition of minority is a racial or ethnic group, members of which have been subjected to prejudice or cultural bias by virtue of belonging to the group, without regard to individual qualities. Such groups include, but are not limited to:[1]
(1) African Americans. ‐ Persons having origins in any of the African racial groups of Africa.
(2) Hispanic Americans. ‐ All persons of Mexican, Puerto Rican, Cuban, South or Central American, Caribbean and other Spanish or Portuguese culture or origin.
(3) Native Americans. ‐ Persons having origins in any of the original peoples of North America or the Hawaiian Islands, in particular, American Indians, Eskimos, Aleuts and Native Hawaiians.
(4) Asian‐Pacific Americans. ‐ Persons having origins in Japan, China, the Philippines, Vietnam, Korea, Samoa, Guam, the U.S. Trust Territories of the Pacific, Northern Marianas, Laos, Cambodia, Taiwan and India.
Historically, HUD uses three different definitions or methods to assess for "area of minority concentration":
*Definition 1: Any neighborhood where the percentage of all minorities is more than 50 percent;
*Definition 2: Any neighborhood where the percentage of all minorities is at least 20 percent above the overall percentage for the citywide minority population percentage; or,
*Definition 3: Any area where the percentage of a particular minority is at least 20 percent higher than the citywide percentage.
What are the characteristics of the market in these areas/neighborhoods?
The median household incomes in the census tracts identified above for racial and/or ethnic minorities also reside in areas representing the lowest median household incomes. See "Table 9 Census Tracts –Median Household Incomes in Ascending Order" below.
Are there any community assets in these areas/neighborhoods?
The Mountain View Neighborhood Plan provides information regarding community assets and investments. The Plan identifies the following community investments/assets for housing: NeighborWorks (100 units repair/innovated); Cook Inlet Housing (146 new units & mixed use building); and, Habitat for Humanity (54 new units). The Mountain View Plan also identifies private business investments which include: Credit Union 1; Glenn Square Mall; New retail (ground floor of CIHA building); locally owned Mt. View Drive businesses; and, the new medical professionals building (formerly Community Health Center). Entities looking for land acquisition for redevelopment in the area include: Anchorage Community Development Authority; Municipality of Anchorage; Anchorage Community Land Trust; and Cook Inlet Housing Authority. Under the MOA, serious efforts at community planning began as a grassroots effort in 1993. The HAND Commission was vital towards carrying out a planning process to revitalize efforts that resulted in: 200+ units of new single housing development (owner and renter); rehabs, repairs, grants/loans to improve over 100 units of existing housing stock; Glenn Square Mall (780
Consolidated Plan ANCHORAGE 137
OMB Control No: 2506‐0117 (exp. 07/31/2015)
jobs), a new Clark Middle School; and, rehabilitation of non‐profit buildings such as Success by Six, Special Olympics and the Alaska Museum of Natural History.
Are there other strategic opportunities in any of these areas?
The local, state and federal government, work in tandem with organizations that provide the above services. The cost of living is high in Alaska due to the distance that products, equipment and technology must travel. Alaska uses the same postal, freight and shipment expense as the lower 48 states but pricing differs due to the demand and high needs.
Under the Mountain View Plan, entities looking for land acquisition for redevelopment in the area include: Anchorage Community Development Authority; Municipality of Anchorage; Anchorage Community Land Trust; and Cook Inlet Housing Authority. Future key goals identified by the MOA range from attracting retail businesses that serve the neighborhood to building a new visual arts center to further market the district.
The Anchorage Downtown Comprehensive Plan points to economic ability to increase housing densities, services and amenities and employment opportunities for mixed‐use develop to encourage walking and public transit usage. This Plans strategies describe the importance of "image and branding program" to evolve the character and quality of downtown's social, cultural and natural environments. This strategy will help to characterize the urban core and establish a distinct downtown identity. Another strategy calls for a "signage and wayfinding program" to orient and direct pedestrians and drivers. This program will make travelling to desirable downtown destinations easy and enjoyable. Another strategy is to focus on a "safety and security program" so visitors and residents feel safe in the area. An "activity and event programming" strategy will build on existing events, such as First Fridays and the Iditarod Trail Sled Dog Race.
The West Anchorage District Plan recommends a re‐commitment of the MOA as a partner in Spenard's transformation into one of Anchorage's most unique and vibrant retail and neighborhood districts. The Anchorage 2020‐Anchorage Bowl Comprehensive Plan identifies the northern portion of Spenard as a Town Center and the rest of the road as a Transit Supportive Development Corridor. Spenard area representatives are working with the MOA and Assembly to determine the best approach to rebuild Spenard Road. The concept is to make sidewalks safer, add crosswalks and landscaping, and slow traffic by converting the road from four lanes to three lanes; one in each direction with a turn lane in the middle. The project extends from Hillcrest Drive to Benson Boulevard, through the middle of the areas vibrant commercial area. Some business owners in the area are adamantly opposed after the protracted time needed to rebuild Arctic Boulevard.
MA 50 Table 1 Anchorage Median Household Income Below 80% AMI by Census Tract
MA 50 Table 2 Census Tracts above 80% Median Income and below Median Income $83,600

Consolidated Plan ANCHORAGE 138
OMB Control No: 2506‐0117 (exp. 07/31/2015)
MA 50 Tables 3 to 7 Page 1
MA 50 Tables 3 to 7 Page 2
MA 50 Tables 3 to 7 Page 3
MA 50 Tables 3 to 7 Page 4
MA 50 Tables 3 to 7 Page 5
MA 50 Tables 3 to 7 Page 6
MA 50 Table 8
MA 50 Table 9

Consolidated Plan ANCHORAGE 139
OMB Control No: 2506‐0117 (exp. 07/31/2015)
MA‐50 Map 1 Extremely Low Income Households with Substandard Living Conditions
MA 50 Map 2 Low Income Housing Tax Credit

Consolidated Plan ANCHORAGE 140
OMB Control No: 2506‐0117 (exp. 07/31/2015)
Strategic Plan
SP‐05 Overview
Strategic Plan Overview
Overall, the city will adopt a strategy whenever possible and appropriate that incorporates some of the elements of all non‐homeless and homeless priorities. As an example, persons with disabilities (handicapped) as defined by HUD could include the homeless and elderly population, as well as victims of interpersonal violence experiencing anxiety disorders or post traumatic stress syndrome. Homelessness by itself is not necessarily justified as the only priority for non‐housing community need, where there is such as broad demand for other needed services.

Consolidated Plan ANCHORAGE 141
OMB Control No: 2506‐0117 (exp. 07/31/2015)
Survey Results page 1

Consolidated Plan ANCHORAGE 142
OMB Control No: 2506‐0117 (exp. 07/31/2015)
Survey Results page 2

Consolidated Plan ANCHORAGE 143
OMB Control No: 2506‐0117 (exp. 07/31/2015)
Survey Results page 3

Consolidated Plan ANCHORAGE 144
OMB Control No: 2506‐0117 (exp. 07/31/2015)
Survey Results page 4

Consolidated Plan ANCHORAGE 145
OMB Control No: 2506‐0117 (exp. 07/31/2015)
Survey Results page 5

Consolidated Plan ANCHORAGE 146
OMB Control No: 2506‐0117 (exp. 07/31/2015)
Survey Results page 6

Consolidated Plan ANCHORAGE 147
OMB Control No: 2506‐0117 (exp. 07/31/2015)
Survey Results with percents page 1
Survey Results with percents page 2

Consolidated Plan ANCHORAGE 148
OMB Control No: 2506‐0117 (exp. 07/31/2015)
Survey Results with percents page 3
Survey Results with percents page 4

Consolidated Plan ANCHORAGE 149
OMB Control No: 2506‐0117 (exp. 07/31/2015)
SP 05 Strategic Plan Overview Page 1
SP 05 Strategic Plan Overview Page 2
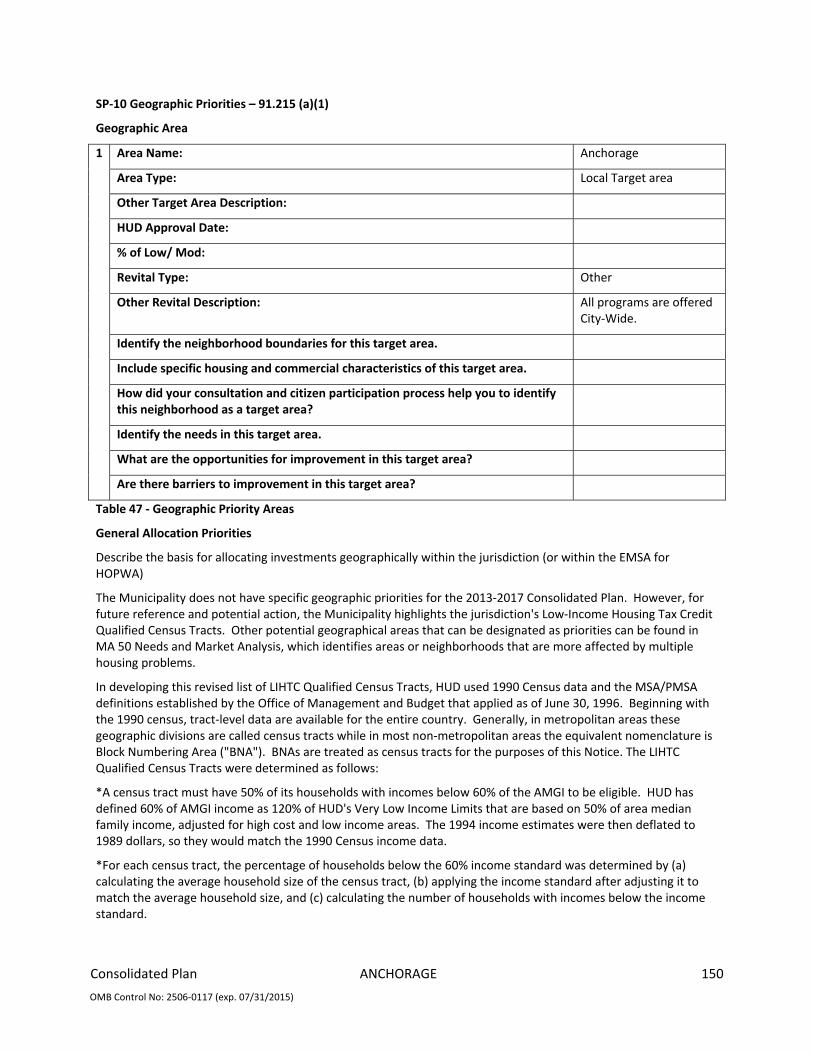
Consolidated Plan ANCHORAGE 150
OMB Control No: 2506‐0117 (exp. 07/31/2015)
SP‐10 Geographic Priorities – 91.215 (a)(1)
Geographic Area
Area Name: Anchorage
Area Type: Local Target area
Other Target Area Description:
HUD Approval Date:
% of Low/ Mod:
Revital Type: Other
Other Revital Description: All programs are offered City‐Wide.
Identify the neighborhood boundaries for this target area.
Include specific housing and commercial characteristics of this target area.
How did your consultation and citizen participation process help you to identify this neighborhood as a target area?
Identify the needs in this target area.
What are the opportunities for improvement in this target area?
1
Are there barriers to improvement in this target area?
Table 47 ‐ Geographic Priority Areas
General Allocation Priorities
Describe the basis for allocating investments geographically within the jurisdiction (or within the EMSA for HOPWA)
The Municipality does not have specific geographic priorities for the 2013‐2017 Consolidated Plan. However, for future reference and potential action, the Municipality highlights the jurisdiction's Low‐Income Housing Tax Credit Qualified Census Tracts. Other potential geographical areas that can be designated as priorities can be found in MA 50 Needs and Market Analysis, which identifies areas or neighborhoods that are more affected by multiple housing problems.
In developing this revised list of LIHTC Qualified Census Tracts, HUD used 1990 Census data and the MSA/PMSA definitions established by the Office of Management and Budget that applied as of June 30, 1996. Beginning with the 1990 census, tract‐level data are available for the entire country. Generally, in metropolitan areas these geographic divisions are called census tracts while in most non‐metropolitan areas the equivalent nomenclature is Block Numbering Area ("BNA"). BNAs are treated as census tracts for the purposes of this Notice. The LIHTC Qualified Census Tracts were determined as follows:
*A census tract must have 50% of its households with incomes below 60% of the AMGI to be eligible. HUD has defined 60% of AMGI income as 120% of HUD's Very Low Income Limits that are based on 50% of area median family income, adjusted for high cost and low income areas. The 1994 income estimates were then deflated to 1989 dollars, so they would match the 1990 Census income data.
*For each census tract, the percentage of households below the 60% income standard was determined by (a) calculating the average household size of the census tract, (b) applying the income standard after adjusting it to match the average household size, and (c) calculating the number of households with incomes below the income standard.

Consolidated Plan ANCHORAGE 151
OMB Control No: 2506‐0117 (exp. 07/31/2015)
*Qualified Census Tracts are those in which 50% or more of the households are income eligible and the population of all census tracts that satisfy this criterion does not exceed 20% of the total population of the respective area.
*In areas where more than 20% of the population qualifies, census tracts are ordered from the highest percentage of eligible households to the lowest. Starting with the highest percentage, census tracts are included until the 20% limit is exceeded. If a census tract is excluded because it raises the percentage above 20%, then subsequent census tracts are considered to determine if a census tract with a smaller population could be included without exceeding the 20% limit.
According to 2012 IRS Section 42(d)(5)(C) QUALIFIED CENSUS TRACTS (2000 Census Data; OMB Metropolitan Area Definitions, November 20, 2008) the following tracts have been identified: 6, 10 and 11.

Consolidated Plan ANCHORAGE 152
OMB Control No: 2506‐0117 (exp. 07/31/2015)
SP‐25 Priority Needs ‐ 91.215(a)(2)
Priority Needs
Priority Need Name
Homeless ‐ Special Needs ‐ Subpopulations
Priority Level High
Population Extremely Low Low Large Families Families with Children Elderly Chronic Homelessness Individuals Families with Children Mentally Ill Chronic Substance Abuse veterans Persons with HIV/AIDS Victims of Domestic Violence Unaccompanied Youth Elderly Frail Elderly Persons with Mental Disabilities Persons with Physical Disabilities Persons with Alcohol or Other Addictions Victims of Domestic Violence
Geographic Areas Affected
Anchorage
Associated Goals
CHDO Rental Housing Development Homeless Facilities Homeless Assistance and Rapid Transition Services
Description Homeless Special Needs ‐ Subpopulations includes housing and/or services. Public Facility ‐ Homeless Facilities was rated the number one priority in Anchorage from the Community Needs Survey conducted for the 2013 ‐ 2017 Consolidated Plan.
1
Basis for Relative Priority
In the Community Survey, all activities for the Homeless Special Needs ‐ Subpopulations were rated as a high priority except for "Persons with HIV/AIDS". The following Homeless activities were rated in the top ten high priorities category:
#1: Public Facility ‐ Homeless Facilities
#2: Public Facility ‐ Abused/Neglected Children Facilities
#4: Homeless ‐ Chronically Homeless Individuals and Families
#5: Homeless ‐ Families with Children
#6 Homeless ‐ Victims of Domestic Violence or Similar Life Threatening Condition
2 Priority Need Name
Non‐Homeless Special Needs ‐ Subpopulations

Consolidated Plan ANCHORAGE 153
OMB Control No: 2506‐0117 (exp. 07/31/2015)
Priority Level High
Population Extremely Low Low Moderate Large Families Families with Children Elderly Public Housing Residents Elderly Frail Elderly Persons with Mental Disabilities Persons with Physical Disabilities Persons with Developmental Disabilities Persons with Alcohol or Other Addictions Victims of Domestic Violence
Geographic Areas Affected
Anchorage
Associated Goals
CHDO Rental Housing Development
Description Non‐Homeless persons with special needs.
Basis for Relative Priority
All categories rated as a high priority except "Veterans and their families" and "Persons with HIV/AIDS". Those that were rated in the top ten include:
#7 Victims of Domestic Violence or Similar Life Threatening Condition
#9 Persons at Risk of Homelessness
#10 Frail Elderly
Priority Need Name
Affordable Housing ‐ Renters
Priority Level High
Population Extremely Low Large Families Families with Children Elderly Public Housing Residents Elderly Frail Elderly Persons with Mental Disabilities Persons with Physical Disabilities Persons with Developmental Disabilities Persons with Alcohol or Other Addictions Persons with HIV/AIDS and their Families Victims of Domestic Violence
3
Geographic Areas Affected
Anchorage

Consolidated Plan ANCHORAGE 154
OMB Control No: 2506‐0117 (exp. 07/31/2015)
Associated Goals
CHDO Rental Housing Development
Description Includes affordable rental housing for small related households, large related households, elderly, and all other.
Basis for Relative Priority
All were rated as a high priority except for small related households, large related households, and all other over 50% of the median income. Two were included in the twelve priorities.
#8 Affordable Rental Housing for Small Related 0 ‐ 30% Median Income
#12 Affordable Rental Housing for Elderly 0 ‐ 30% Median Income
Priority Need Name
Affordable Housing ‐ Owners
Priority Level High
Population Extremely Low Low Large Families Families with Children Elderly Elderly Frail Elderly Persons with Mental Disabilities Persons with Physical Disabilities Persons with Developmental Disabilities Persons with Alcohol or Other Addictions Persons with HIV/AIDS and their Families Victims of Domestic Violence
Geographic Areas Affected
Anchorage
Associated Goals
Homeowner Rehabilitation Mobile Home Rehabilitation Affordable Homeownership
Description Programs, projects, or funding to provide or maintain Affordable Housing for owners.
4
Basis for Relative Priority
The highest rated in the Affordable Housing category was for the elderly at 0‐ 30% of the median income. It was only rated #42 on the high priority list. The next three high priorities for Affordable Housing ‐ Owners are:
#48 Small Related at 0‐ 30% of the median income
#61 Large Related at 0‐ 30% of the median income
#66 All other at 0‐ 30% of the median income
Priority Need Name
Affordable Housing ‐ Non‐Homeless Special Needs 5
Priority Level High

Consolidated Plan ANCHORAGE 155
OMB Control No: 2506‐0117 (exp. 07/31/2015)
Population Extremely Low Low Moderate Large Families Families with Children Elderly Elderly Frail Elderly Persons with Mental Disabilities Persons with Physical Disabilities Persons with Developmental Disabilities Persons with Alcohol or Other Addictions Victims of Domestic Violence
Geographic Areas Affected
Anchorage
Associated Goals
CHDO Rental Housing Development
Description Activities that serve the Affordable Housing ‐ Non‐Homeless Special Needs.
Basis for Relative Priority
All categories of Affordable Housing ‐ Non‐Homeless Special Needs were rated a high priority except those for HIV/AIDS. Some of the high priority ratings are:
#15 Victims of Domestic Violence
#23 Frail Elderly
#31 Elderly
#40 Severe Mental Illness
#46 Physical Disability
Priority Need Name
General
Priority Level High
Population Extremely Low Low Moderate Middle
Geographic Areas Affected
Anchorage
Associated Goals
CHDO Rental Housing Development Affordable Homeownership Homeless Facilities Child Care Center Homeless Assistance and Rapid Transition Services
6
Description Acquisition of Real Property, Disposition, Clearance and Demolition, Clearance or Contaminated Sites, and Code Enforcement.

Consolidated Plan ANCHORAGE 156
OMB Control No: 2506‐0117 (exp. 07/31/2015)
Basis for Relative Priority
All sections of this group were rated as a medium priority in the community survey. None were rated as a high priority! Of this section, Clearance and Demolition received the highest rating at #77 on the list.
Priority Need Name
Public Facilities
Priority Level High
Population Extremely Low Low Moderate Large Families Families with Children Elderly Chronic Homelessness Individuals Families with Children Mentally Ill Chronic Substance Abuse veterans Persons with HIV/AIDS Victims of Domestic Violence Unaccompanied Youth Elderly Frail Elderly Persons with Mental Disabilities Persons with Physical Disabilities Persons with Developmental Disabilities Persons with Alcohol or Other Addictions Persons with HIV/AIDS and their Families Victims of Domestic Violence
Geographic Areas Affected
Anchorage
Associated Goals
Child Care Center
Description Public Facilities in order of highest priority are: Homeless Facilities, Abused/Neglected Children Facilities, Mental Health Facilities, Child Care Centers, Youth Centers, Health Facilities, Senior Centers, Handicapped Centers, Fire Stations\Equipment, Parks and\or Recreation Facilities, Neighborhood Facilities, Asbestos Removal, Tree Planting, Parking Facilities, Non‐Residential Historic Preservation, and Other Public Facility Needs.
7
Basis for Relative Priority
The following list shows the eight Public Facilities that were rated high priority in the Community Survey and where they placed on the total list: Homeless Facilities #1, Abused/Neglected Children Facilities #2, Mental Health Facilities #20, Child Care Centers #27, Youth Centers #28, Health Facilities #43, Senior Centers #47, Handicapped Centers #49. The rest were rated as a medium priority.
Priority Need Name
Infrastructure 8
Priority Level High
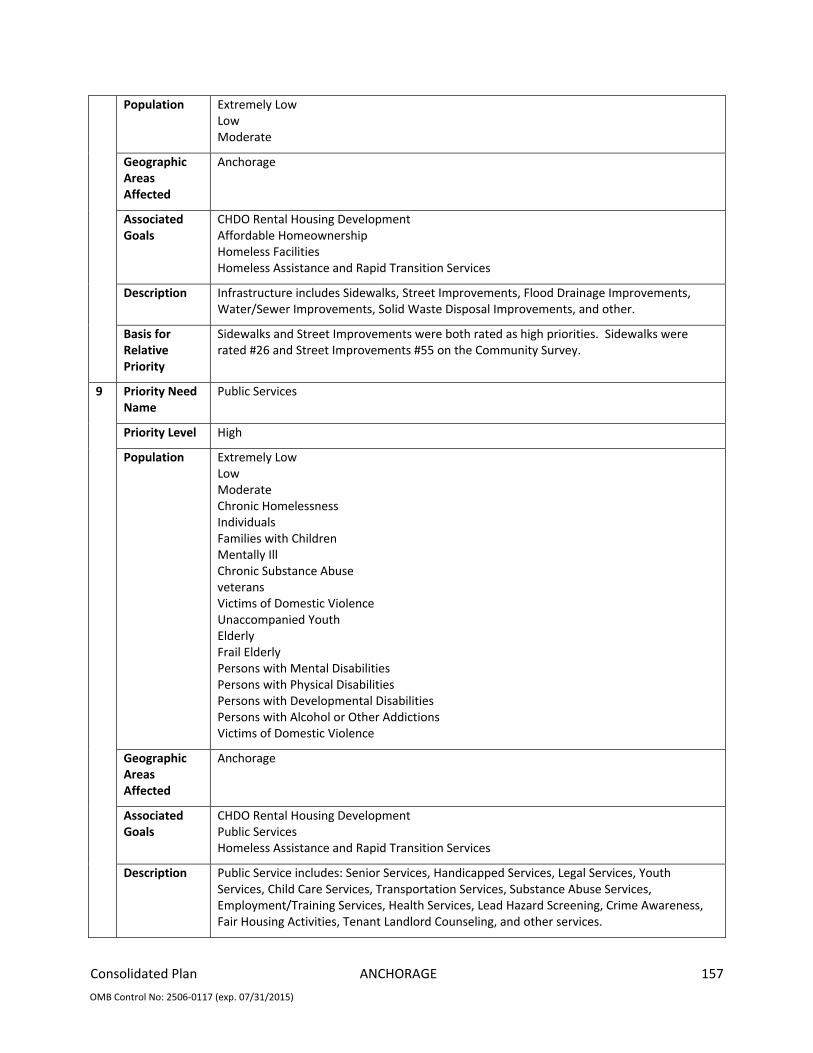
Consolidated Plan ANCHORAGE 157
OMB Control No: 2506‐0117 (exp. 07/31/2015)
Population Extremely Low Low Moderate
Geographic Areas Affected
Anchorage
Associated Goals
CHDO Rental Housing Development Affordable Homeownership Homeless Facilities Homeless Assistance and Rapid Transition Services
Description Infrastructure includes Sidewalks, Street Improvements, Flood Drainage Improvements, Water/Sewer Improvements, Solid Waste Disposal Improvements, and other.
Basis for Relative Priority
Sidewalks and Street Improvements were both rated as high priorities. Sidewalks were rated #26 and Street Improvements #55 on the Community Survey.
Priority Need Name
Public Services
Priority Level High
Population Extremely Low Low Moderate Chronic Homelessness Individuals Families with Children Mentally Ill Chronic Substance Abuse veterans Victims of Domestic Violence Unaccompanied Youth Elderly Frail Elderly Persons with Mental Disabilities Persons with Physical Disabilities Persons with Developmental Disabilities Persons with Alcohol or Other Addictions Victims of Domestic Violence
Geographic Areas Affected
Anchorage
Associated Goals
CHDO Rental Housing Development Public Services Homeless Assistance and Rapid Transition Services
9
Description Public Service includes: Senior Services, Handicapped Services, Legal Services, Youth Services, Child Care Services, Transportation Services, Substance Abuse Services, Employment/Training Services, Health Services, Lead Hazard Screening, Crime Awareness, Fair Housing Activities, Tenant Landlord Counseling, and other services.

Consolidated Plan ANCHORAGE 158
OMB Control No: 2506‐0117 (exp. 07/31/2015)
Basis for Relative Priority
The five top public services in the Community Survey and their rating on the list were: Handicapped Services #3, Youth Services #13, Transportation Services #14, Senior Services # 22, and Child Care Services #29. All were rated high priority except: Fair Housing Activities, Tenant Landlord Counseling, Crime Awareness, and Substance Lead Hazard Screening. These were rated medium priority.
Priority Need Name
Commercial/Industrial
Priority Level High
Population Extremely Low Low Moderate
Geographic Areas Affected
Anchorage
Associated Goals
CHDO Rental Housing Development Affordable Homeownership Homeless Facilities Homeless Assistance and Rapid Transition Services
Description Commercial/Industrial includes: Land Acquisition/Disposition, Infrastructure Development, Building Acq/Const/Rehab, and other Commercial/Industrial.
10
Basis for Relative Priority
All were rated a medium priority in the Community Survey.
Priority Need Name
Economic Development
Priority Level High
Population Extremely Low Low Moderate
Geographic Areas Affected
Anchorage
Associated Goals
Affordable Homeownership
Description Assistance to For‐Profit, Technical Assistance, and Micro‐enterprise Assistance.
11
Basis for Relative Priority
Micro‐enterprise Assistance was rated as a high priority on the Community Survey, #88 on the list. Assistance to For‐Profit #98 and Technical Assistance#95 were both rate as a medium priority.
Priority Need Name
Other 12
Priority Level High

Consolidated Plan ANCHORAGE 159
OMB Control No: 2506‐0117 (exp. 07/31/2015)
Population Extremely Low Low Moderate
Geographic Areas Affected
Anchorage
Associated Goals
Homeless Assistance and Rapid Transition Services
Description Transit Oriented Development and Urban Agriculture.
Basis for Relative Priority
Transit Oriented Development #65 was rated a a high priority on the Community Survey and Urban Agriculture #96 a medium priority.
Table 48 – Priority Needs Summary
Narrative (Optional)
Other Identifying Needs
A total of 7,986 Anchorage children live in poverty; with the largest percentage under five years of age. The greatest percentage (41%) of male children in poverty is under the age of 5 years and between 6 to 11 years of age (28%). Female children in poverty show a similarity, with the greatest percentage (34%) of female children in poverty under 5 years of age and between 6 to 11 years of age (26%).
According to the Anchorage School District Child in Transition/Homeless (CIT/H) Project from 2007/2008 (2,829 children) to 2011/2012 (4,277 children) school year there was an increase of 49% of children meeting the definition of homeless.
On average over the past five school years, the majority of ASD children identified in the CIT/H Project live doubled‐up (42%) or in a shelter (26%).
Disproportionately Greater Need by Ethnicity and AMI
A disproportionately greater need exists when the members of racial or ethnic group at an income level experience housing problems at a greater rate (10% or more) than the income level as a whole of the population. A household is identified as having a housing problem if they have any 1 or more of these 4 problems:
1. Lacks complete kitchen facilities;
2. Lacks complete plumbing facilities;
3. Household is overcrowded which means there is more than 1.5 persons per room and excludes bathrooms, porches, foyers, halls, or half‐rooms; and,
4. Household is cost burdened.
Disproportionately Greater Need for Severe Housing Problems
A disproportionately greater need exists when members of a racial or ethnic group at an income level experience housing problems at a greater rate (10% points or more) than the income level as a whole for severe housing problems.
HUD defines severe housing problems as:
1. Lacks complete kitchen facilities;
2. Lacks complete plumbing facilities;
3. More than 1.5 persons per room not including bathrooms, porches, foyers, halls, or half‐rooms; and,
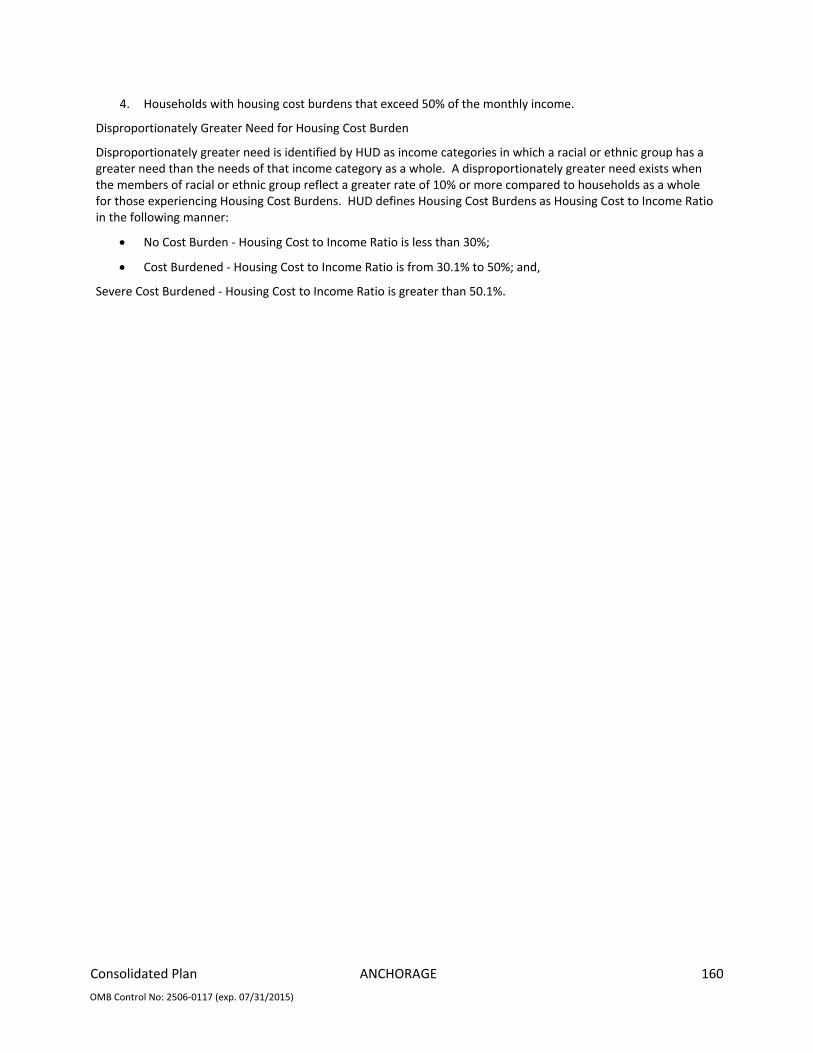
Consolidated Plan ANCHORAGE 160
OMB Control No: 2506‐0117 (exp. 07/31/2015)
4. Households with housing cost burdens that exceed 50% of the monthly income.
Disproportionately Greater Need for Housing Cost Burden
Disproportionately greater need is identified by HUD as income categories in which a racial or ethnic group has a greater need than the needs of that income category as a whole. A disproportionately greater need exists when the members of racial or ethnic group reflect a greater rate of 10% or more compared to households as a whole for those experiencing Housing Cost Burdens. HUD defines Housing Cost Burdens as Housing Cost to Income Ratio in the following manner:
No Cost Burden ‐ Housing Cost to Income Ratio is less than 30%;
Cost Burdened ‐ Housing Cost to Income Ratio is from 30.1% to 50%; and,
Severe Cost Burdened ‐ Housing Cost to Income Ratio is greater than 50.1%.

Consolidated Plan ANCHORAGE 161
OMB Control No: 2506‐0117 (exp. 07/31/2015)
SP‐30 Influence of Market Conditions – 91.215 (b)
Influence of Market Conditions
Affordable Housing Type
Market Characteristics that will influence the use of funds available for housing type
Tenant Based Rental Assistance (TBRA)
Based on data collected for this Consolidated Plan, TBRA is needed to offset the income for low‐income Elderly, Extra Elderly, Large Related and Small Related Families, and Other family households. In addition, chronically homeless individuals and families would benefit. This effort is augmented by the fact that the labor pool, which is comprised of a very young population working in business sector for, leisure, hospitality, tourism, sales, and retail need subsidized housing to maintain a residence.
TBRA for Non‐Homeless Special Needs
Based on data collected for this Consolidated Plan, TBRA is needed to offset the income for low‐income Elderly, Extra Elderly, Large Related and Small Related Families, and Other family households. In addition, chronically homeless individuals and families would benefit. This effort is augmented by the fact that the labor pool, which is comprised of a very young population working in business sector for, leisure, hospitality, tourism, sales, and retail need subsidized housing to maintain a residence.
New Unit Production
New unit production is needed to assist those living in severe housing conditions, such as lacking a complete kitchen facility and complete plumbing, particularly with aging home conditions. Cost of suitable building land and viability of business sectors such as natural resource development (oil and mining), construction costs, and transportation (air and water) for shipping will impact this effort.
Rehabilitation Cost of suitable building land and viability of business sectors such as natural resource development that includes oil and mining. Also, restrictions that have been placed on wood‐products in both extraction and production that have significantly impacted construction costs. Transportation (air and water) costs are also rising for shipping.
Acquisition, including preservation
Cost of suitable building land and viability of business sectors such as natural resource development (oil and mining), construction costs, and other funding agencies ability to partner (where their portfolio is vastly reduced in the housing industry). Inflation in housing market has outpaced low‐ and moderate‐ incomes. The median purchase price has risen 51% while incomes have only increased by 31% over the last 10 years.
Table 49 – Influence of Market Conditions
Anchorage Vicinity Map

Consolidated Plan ANCHORAGE 162
OMB Control No: 2506‐0117 (exp. 07/31/2015)
Demographics
2010 U.S. Census by Tracts Page 1
2010 U.S. Census by Tracts Page 2
MAP NA‐10.2. Anchorage Census Tracts

Consolidated Plan ANCHORAGE 163
OMB Control No: 2506‐0117 (exp. 07/31/2015)
SP‐35 Anticipated Resources ‐ 91.215(a)(4), 91.220(c)(1,2)
Introduction
The Anticipated Resources that the MOA will have at its disposal over the course of the Strategic Plan is approximately $8,861,965 for CDBG, $2,959,555 for HOME, and $624,580 for ESG. Public and private agencies rely heavily on HUD funding and programs that address the broad spectrum of needs. Reduced funding for these HUD programs in 2012 adversely impacted local agencies and services that rely on these monies to assist individuals and families, and affected their ability to leverage resources for state or private funding. In 2013, the Municipality will receive increased funding of $60,109 for CDBG. The HOME Program funding was reduced $36,782 from 2012 and the ESG reduced $22,972. The Municipality received 33.6% less than projected in HUD HOME funds for FY 2012. The table reflects HUD’s reduced funding. CDBG funds may leverage additional resources from private, state, and local funds. The Minor Repair Program may become a loan to leverage private funds as program income. The Mobile Home Repair Program will leverage some state funding through the Weatherization Program. The Rental Development Program is funded with CDBG and HOME funds and may leverage other private, state, local, and federal funds.
Anticipated Resources
Expected Amount Available Year 1 Program Source of
Funds
Uses of Funds
Annual Allocation:
$
Program Income:
$
Prior Year Resources:
$
Total:
$
Expected Amount Available Reminder
of Con Plan
$
Narrative Description
CDBG public ‐ federal
Acquisition Admin and Planning Economic Development Housing Public Improvements Public Services
1,772,393 0 1,216,167 2,988,560 7,089,572 CDBG funds may leverage additional resources from private, state, and local funds. The Minor Repair Program may become a loan to leverage private funds as program income. The Mobile Home Repair Program will leverage some state funding through the Weatherization Program. The Rental Development Program is funded with CDBG and HOME funds and may leverage other private, state, local, and federal funds.

Consolidated Plan ANCHORAGE 164
OMB Control No: 2506‐0117 (exp. 07/31/2015)
Expected Amount Available Year 1 Program Source of
Funds
Uses of Funds
Annual Allocation:
$
Program Income:
$
Prior Year Resources:
$
Total:
$
Expected Amount Available Reminder
of Con Plan
$
Narrative Description
HOME public ‐ federal
Acquisition Homebuyer assistance Homeowner rehab Multifamily rental new construction Multifamily rental rehab New construction for ownership TBRA
591,911 59,945 1,091,542 1,743,398 2,367,644 HOME was designed explicitly to expand the supply of decent and affordable housing for the very low, low to moderate income families and individuals. HOME assistance funding targets families that urgently need it. Nonprofit organizations that are rooted into the neighborhoods they serve represent the idea of community‐led revitalization through HOME funding. The federal government makes investments into the future of local nonprofit housing groups through community housing development organizations called CHDO. There is a 25 cent match requirement for each dollar of HOME funds spent on affordable housing. Eligible sources of a match for HOME funds include: cash, donated construction material or voluntary labor, the value of donated land or real property, investments in on or off‐site improvements, the cost of homebuyer counseling, proceeds from bond financing, the cost of supportive services provided to families living in HOME units and the value of foregone interest, taxes, fees or charges levied by public or private entities. Generally investments from State or local governments or the private sector qualify as matching contributions, whereas federal funds such as CDBG do not qualify. The Municipality has an established resale provision that safeguards the properties continued affordability or recaptures all or part of the HOME subsidy.

Consolidated Plan ANCHORAGE 165
OMB Control No: 2506‐0117 (exp. 07/31/2015)
Expected Amount Available Year 1 Program Source of
Funds
Uses of Funds
Annual Allocation:
$
Program Income:
$
Prior Year Resources:
$
Total:
$
Expected Amount Available Reminder
of Con Plan
$
Narrative Description
ESG public ‐ federal
Conversion and rehab for transitional housing Financial Assistance Overnight shelter Rapid re‐housing (rental assistance) Rental Assistance Services Transitional housing
124,913 0 179,104 304,017 499,667 Emergency Solutions Grant (ESG) addresses homelessness assistance, rental and utility assistance, supports basic shelter operations and essential supportive services for homeless individuals and families geared to re‐housing. ESG emphasizes the need to prevent homelessness with a continuum model to prevent people from having to enter shelters and/or to support them in the event a shelter stay is unavoidable. ESG requires a dollar for dollar match of the federal share. The statute provides that a grantee may use funds from any source including other federal source (excluding the specific statutory subtitle from which ESG funds are provided), as well as state, local and private sources, provided that funds from the other sources are not statutorily prohibited to be used as a match and that the funds are to be used for ESG eligible activities. The following are acceptable program matches: cash, value or fair rental value of any donated material or building to be used by the respondents, value of a building lease needed to house the ESG program in the proportion of the space to be used for ESG, space, telephone, furniture, secretarial, clerical support, computers, HMIS costs for the program, supervisory time spent on specific client cases, and other direct and indirect administrative/overhead costs not included in the budget and any salaries paid to staff to carry out the program.
Table 50 ‐ Anticipated Resources
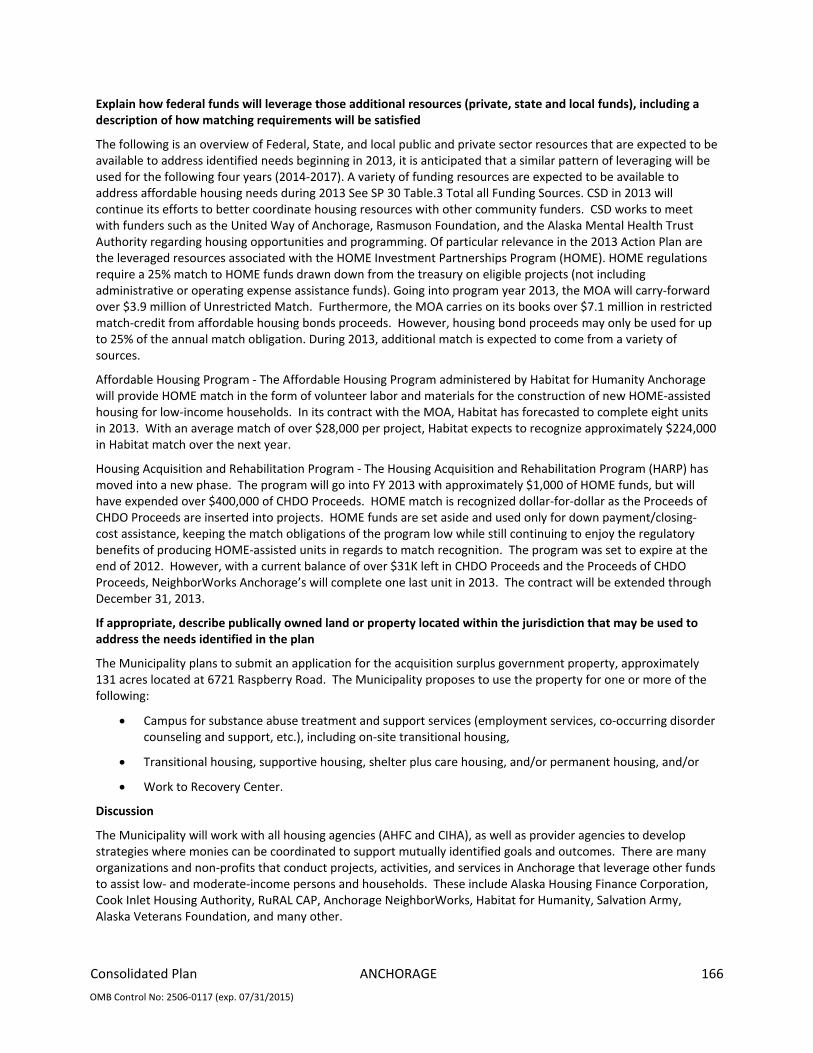
Consolidated Plan ANCHORAGE 166
OMB Control No: 2506‐0117 (exp. 07/31/2015)
Explain how federal funds will leverage those additional resources (private, state and local funds), including a description of how matching requirements will be satisfied
The following is an overview of Federal, State, and local public and private sector resources that are expected to be available to address identified needs beginning in 2013, it is anticipated that a similar pattern of leveraging will be used for the following four years (2014‐2017). A variety of funding resources are expected to be available to address affordable housing needs during 2013 See SP 30 Table.3 Total all Funding Sources. CSD in 2013 will continue its efforts to better coordinate housing resources with other community funders. CSD works to meet with funders such as the United Way of Anchorage, Rasmuson Foundation, and the Alaska Mental Health Trust Authority regarding housing opportunities and programming. Of particular relevance in the 2013 Action Plan are the leveraged resources associated with the HOME Investment Partnerships Program (HOME). HOME regulations require a 25% match to HOME funds drawn down from the treasury on eligible projects (not including administrative or operating expense assistance funds). Going into program year 2013, the MOA will carry‐forward over $3.9 million of Unrestricted Match. Furthermore, the MOA carries on its books over $7.1 million in restricted match‐credit from affordable housing bonds proceeds. However, housing bond proceeds may only be used for up to 25% of the annual match obligation. During 2013, additional match is expected to come from a variety of sources.
Affordable Housing Program ‐ The Affordable Housing Program administered by Habitat for Humanity Anchorage will provide HOME match in the form of volunteer labor and materials for the construction of new HOME‐assisted housing for low‐income households. In its contract with the MOA, Habitat has forecasted to complete eight units in 2013. With an average match of over $28,000 per project, Habitat expects to recognize approximately $224,000 in Habitat match over the next year.
Housing Acquisition and Rehabilitation Program ‐ The Housing Acquisition and Rehabilitation Program (HARP) has moved into a new phase. The program will go into FY 2013 with approximately $1,000 of HOME funds, but will have expended over $400,000 of CHDO Proceeds. HOME match is recognized dollar‐for‐dollar as the Proceeds of CHDO Proceeds are inserted into projects. HOME funds are set aside and used only for down payment/closing‐cost assistance, keeping the match obligations of the program low while still continuing to enjoy the regulatory benefits of producing HOME‐assisted units in regards to match recognition. The program was set to expire at the end of 2012. However, with a current balance of over $31K left in CHDO Proceeds and the Proceeds of CHDO Proceeds, NeighborWorks Anchorage’s will complete one last unit in 2013. The contract will be extended through December 31, 2013.
If appropriate, describe publically owned land or property located within the jurisdiction that may be used to address the needs identified in the plan
The Municipality plans to submit an application for the acquisition surplus government property, approximately 131 acres located at 6721 Raspberry Road. The Municipality proposes to use the property for one or more of the following:
Campus for substance abuse treatment and support services (employment services, co‐occurring disorder counseling and support, etc.), including on‐site transitional housing,
Transitional housing, supportive housing, shelter plus care housing, and/or permanent housing, and/or
Work to Recovery Center.
Discussion
The Municipality will work with all housing agencies (AHFC and CIHA), as well as provider agencies to develop strategies where monies can be coordinated to support mutually identified goals and outcomes. There are many organizations and non‐profits that conduct projects, activities, and services in Anchorage that leverage other funds to assist low‐ and moderate‐income persons and households. These include Alaska Housing Finance Corporation, Cook Inlet Housing Authority, RuRAL CAP, Anchorage NeighborWorks, Habitat for Humanity, Salvation Army, Alaska Veterans Foundation, and many other.

Consolidated Plan ANCHORAGE 167
OMB Control No: 2506‐0117 (exp. 07/31/2015)
SP‐40 Institutional Delivery Structure – 91.215(k)
Explain the institutional structure through which the jurisdiction will carry out its consolidated plan including private industry, non‐profit organizations, and public institutions.
Responsible Entity Responsible Entity Type Role Geographic Area Served
MUNICIPALITY OF ANCHORAGE
Government Economic Development Homelessness Non‐homeless special needs Ownership Planning Rental neighborhood improvements public facilities public services
Jurisdiction
Abused Women's Aid in Crisis (AWAIC)
Non‐profit organizations Homelessness Non‐homeless special needs
Jurisdiction
ALASKA HOUSING FINANCE CORP
PHA Homelessness Non‐homeless special needs Ownership Planning Public Housing Rental public services
State
ALASKA LEGAL SERVICES Non‐profit organizations Homelessness Non‐homeless special needs Planning
Jurisdiction
Spinell Homes Developer Ownership Planning Rental
Jurisdiction
ANCHORAGE COMMUNITY LAND TRUST
Non‐profit organizations Homelessness Non‐homeless special needs Planning public services
Jurisdiction

Consolidated Plan ANCHORAGE 168
OMB Control No: 2506‐0117 (exp. 07/31/2015)
Responsible Entity Responsible Entity Type Role Geographic Area Served
ANCHORAGE HOUSING INITIATIVES
Non‐profit organizations Economic Development Non‐homeless special needs Ownership Planning Rental neighborhood improvements public facilities public services
Jurisdiction
ANCHORAGE SENIOR CENTER
Public institution Non‐homeless special needs Planning public facilities public services
Jurisdiction
ANCHORAGE LITERACY PROJECT
Non‐profit organizations Non‐homeless special needs Planning public services
Jurisdiction
Access Alaska Inc. Non‐profit organizations Non‐homeless special needs Planning public facilities public services
Jurisdiction
AK Cares Private Industry Non‐homeless special needs Planning public facilities public services
State
Akeela Inc. Non‐profit organizations Non‐homeless special needs Planning public services
State
Alaska Center for the Blind and Visually Impaired
Non‐profit organizations Non‐homeless special needs Planning public services
State
Alaska Children's Services Non‐profit organizations Non‐homeless special needs Planning public services
State
Alaska Chadux Corporation
Private Industry Economic Development Planning
State

Consolidated Plan ANCHORAGE 169
OMB Control No: 2506‐0117 (exp. 07/31/2015)
Responsible Entity Responsible Entity Type Role Geographic Area Served
Alaska Mental Health Trust
Public institution Homelessness Non‐homeless special needs Ownership Planning Rental public services
State
Anchorage Community Mental Health Services, Inc.
Non‐profit organizations Homelessness Non‐homeless special needs Ownership Planning Rental public services
State
Alaska AIDS Assistance Association
Non‐profit organizations Homelessness Non‐homeless special needs Planning Rental public services
State
Anchorage Neighborhood Health Center
Non‐profit organizations Homelessness Planning
Jurisdiction
Anchorage School Board Public institution Non‐homeless special needs Planning public facilities public services
Jurisdiction
Anchorage School District Public institution Homelessness Non‐homeless special needs Planning public facilities public services
Jurisdiction
Brother Francis Shelter Non‐profit organizations Homelessness Planning
Jurisdiction
Catholic Social Services Non‐profit organizations Homelessness Planning Rental
Region
Covenant House ‐ Alaska (CHA)
Non‐profit organizations Homelessness Planning
State
Child in Transition/Homeless Project
Public institution Homelessness Non‐homeless special needs Planning public facilities public services
Jurisdiction

Consolidated Plan ANCHORAGE 170
OMB Control No: 2506‐0117 (exp. 07/31/2015)
Responsible Entity Responsible Entity Type Role Geographic Area Served
Food Bank of Alaska Non‐profit organizations Homelessness Planning
State
HABITAT FOR HUMANITY Non‐profit organizations Ownership Planning
Jurisdiction
Home Accessibilities Private Industry Ownership Planning
Jurisdiction
KPB Architects Private Industry Homelessness Ownership Planning Rental
Jurisdiction
Muldoon Safe Harbor Inn Non‐profit organizations Homelessness Planning
Jurisdiction
NEIGHBORWORKS ANCHORAGE
Non‐profit organizations Homelessness Ownership Planning Rental
Jurisdiction
New Life Development Non‐profit organizations Homelessness Planning
Jurisdiction
Partners for Progress Non‐profit organizations Homelessness Ownership Planning Rental
State
RurAL CAP CHDO Homelessness Ownership Planning Rental
State
Salvation Army, Alaska Non‐profit organizations Homelessness Planning
State
Shiloh Community Housing, Inc.
CHDO Homelessness Ownership Planning Rental
Jurisdiction
Southcentral Foundation Other Economic Development Homelessness Non‐homeless special needs Ownership Planning Rental public services
State
Standing Together Against Rape
Non‐profit organizations Homelessness Planning
State

Consolidated Plan ANCHORAGE 171
OMB Control No: 2506‐0117 (exp. 07/31/2015)
Responsible Entity Responsible Entity Type Role Geographic Area Served
Veterans Administration Government Homelessness Ownership Planning Rental
Nation
Volunteers of American Alaska
Non‐profit organizations Homelessness Planning
State
Bean's Cafe Non‐profit organizations Homelessness Planning
Jurisdiction
Center for Human Development/UAA
Public institution Homelessness Planning
State
Cook Inlet Housing Authority
PHA Homelessness Ownership Planning Rental
State
American Red Cross Non‐profit organizations Homelessness Planning
State
Alaska Native Justice Center Inc.
Non‐profit organizations Economic Development Homelessness Planning
State
Anchorage Rescue Mission Non‐profit organizations Homelessness Planning
Jurisdiction
HUD Government Economic Development Homelessness Non‐homeless special needs Ownership Planning Rental neighborhood improvements public facilities public services
State
Older Persons Action Group
Non‐profit organizations Economic Development Homelessness Non‐homeless special needs Ownership Planning Rental neighborhood improvements public facilities public services
State

Consolidated Plan ANCHORAGE 172
OMB Control No: 2506‐0117 (exp. 07/31/2015)
Responsible Entity Responsible Entity Type Role Geographic Area Served
CDI‐ALASKA, INC. Non‐profit organizations Economic Development Homelessness Planning public services
State
Table 51 ‐ Institutional Delivery Structure
Assess of Strengths and Gaps in the Institutional Delivery System
The Anchorage community has a long history in coordinating resources and services to provide the most integrated system possible with resources available. Example of strong community coordination include: Homeless Prevention Project, which included partners from United Way, Covenant House, Salvation Army McKinnell, Catholic Social Services, and the Municipality; Continuum of Care, which presented a broad representation of the community through its FY2012 Project Review Panel; Project Homeless Connect, which includes provider agencies and community volunteers, Cold Weather Plan, which is led by the faith‐based community and provides emergency shelter for families, and the HARP project which links homeless persons in camps to appropriate services. Although the HARP Project is not currently active, the model is in place to pull together police, case managers, and volunteers to continue outreach efforts.

Consolidated Plan ANCHORAGE 173
OMB Control No: 2506‐0117 (exp. 07/31/2015)
Availability of services targeted to homeless persons and persons with HIV and mainstream services
Homelessness Prevention Services Available in the Community
Targeted to Homeless Targeted to People with HIV
Homelessness Prevention Services
Counseling/Advocacy X X X
Legal Assistance X X
Mortgage Assistance X X
Rental Assistance X X
Utilities Assistance X X
Street Outreach Services
Law Enforcement X X
Mobile Clinics X X
Other Street Outreach Services X X
Supportive Services
Alcohol & Drug Abuse X X
Child Care
Education X X
Employment and Employment Training X
Healthcare
HIV/AIDS X X X
Life Skills X X
Mental Health Counseling X X
Transportation X X
Other
Domestic Violence Prevention X X
Table 52 ‐ Homeless Prevention Services Summary
Describe how the service delivery system including, but not limited to, the services listed above meet the needs of homeless persons (particularly chronically homeless individuals and families, families with children, veterans and their families, and unaccompanied youth)
Provider agencies in Anchorage work in tandem to ensure that those in need will not fall through gaps in the service system. The use of the Alaska 2‐1‐1‐ line has allowed available services to be updated quickly through an electronic database of information. Key services in Anchorage, such as CSS Homeless Prevention and Rapid Re‐housing are updated regularly to inform the public of available financial assistance. Conversely, 2‐1‐1 caller line staff informs the general public when there are no monies available. As an example, the MOA contracts with CSS’ Rapid Re‐Housing Project using ESG monies, which in turn coordinates with Alaska 2‐1‐1. This allows 2‐1‐1‐ callers to be referred appropriately to CSS, which in turn uses ESG funds for those who are at imminent‐risk for homelessness. Veterans calling into 2‐1‐1 are also referred appropriately to local veteran services, including the domiciliary. The 4A’s agency, which assists persons with HIV/AIDS and their families, also participate in ‐2‐1‐1. The

Consolidated Plan ANCHORAGE 174
OMB Control No: 2506‐0117 (exp. 07/31/2015)
CoC confirmed that services delivered by CSS and the Municipality fit the requirements of the revised ESG guidelines. CSS and the Municipality are active members of the CoC and will continue to consult with the CoC and subcommittees to assure coordination of homeless prevention and rapid re‐housing activities to best utilize and leverage ESG funding in addressing the population served by HPRP. Likewise, the VA Coordinator will work with Alaska 2‐1‐1 and maintain membership on the HAND Commission's HCOSH membership to provide an integrated system of care for veterans.
Describe the strengths and gaps of the service delivery system for special needs population and persons experiencing homelessness, including, but not limited to, the services listed above
There are key areas which warrant community discussion and agency resolution. The continued growth of chronically homeless populations and additional information regarding victims of violence (sexual assault and domestic violence) are policy issues which need extensive examination and discussion. While the numbers of persons served at the Brother Francis Shelter, it is unclear why the numbers are growing is this due to in‐state or out‐of state migration, personal and situation circumstances, an economy that does not have high wages for certain occupations such as retail, sales and leisure.
Provide a summary of the strategy for overcoming gaps in the institutional structure and service delivery system for carrying out a strategy to address priority needs
With the addition of victims of sexual assault, dating and stalking violence, it will be critical to include this element of the homeless population in all future discussions regarding the homeless. The Municipality’s Housing and Neighborhood Development Commission and its Homeless Oversight Subcommittee on Homelessness are taking on the task of completing the city’s Ten‐Year Plan on homeless. The HAND Commission and HCOSH will invite the community to participate in developing new strategies to address the increasing subpopulations of homeless.

Consolidated Plan ANCHORAGE 175
OMB Control No: 2506‐0117 (exp. 07/31/2015)
SP‐45 Goals Summary – 91.215(a)(4)
Goals Summary Information
Sort Order
Goal Name Start Year
End Year
Category Geographic Area
Needs Addressed Funding Goal Outcome Indicator
1 CHDO Rental Housing Development
2013 2017 Affordable Housing
Anchorage Homeless ‐ Special Needs ‐ Subpopulations Non‐Homeless Special Needs ‐ Subpopulations Affordable Housing ‐ Renters Affordable Housing ‐ Non‐Homeless Special Needs General Infrastructure Public Services Commercial/Industrial
CDBG: $270,806HOME:
$572,444
Public service activities for Low/Moderate Income Housing Benefit: 10 Households Assisted Rental units constructed: 10 Household Housing Unit
2 Homeowner Rehabilitation
2013 2017 Affordable Housing
Anchorage Affordable Housing ‐ Owners CDBG: $415,000
Homeowner Housing Rehabilitated: 18 Household Housing Unit
3 Mobile Home Rehabilitation
2013 2017 Affordable Housing
Anchorage Affordable Housing ‐ Owners CDBG: $215,000
Homeowner Housing Rehabilitated: 8 Household Housing Unit
4 Affordable Homeownership
2013 2017 Affordable Housing
Anchorage Affordable Housing ‐ Owners General Infrastructure Commercial/Industrial Economic Development
HOME: $15,000
Homeowner Housing Added: 8 Household Housing Unit
5 Homeless Facilities 2012 2017 Homeless Anchorage Homeless ‐ Special Needs ‐ Subpopulations General Infrastructure Commercial/Industrial
CDBG: $76,250
Other: 1 Other

Consolidated Plan ANCHORAGE 176
OMB Control No: 2506‐0117 (exp. 07/31/2015)
Sort Order
Goal Name Start Year
End Year
Category Geographic Area
Needs Addressed Funding Goal Outcome Indicator
6 Child Care Center 2012 2017 Child Care Anchorage General Public Facilities
CDBG: $175,000
Public Facility or Infrastructure Activities for Low/Moderate Income Housing Benefit: 48 Households Assisted
7 Public Services 2013 2017 Homeless Anchorage Public Services CDBG: $265,859
Other: 4 Other
8 Homeless Assistance and Rapid Transition Services
2012 2017 Homeless Anchorage Homeless ‐ Special Needs ‐ Subpopulations General Infrastructure Public Services Commercial/Industrial Other
ESG: $124,916
Homelessness Prevention: 225 Persons Assisted Other: 5 Other
Table 53 – Goals Summary

Consolidated Plan ANCHORAGE 177
OMB Control No: 2506‐0117 (exp. 07/31/2015)
Goal Descriptions
Goal Name CHDO Rental Housing Development 1
Goal Description
This project shall include the selection of a CHDO to provide supportive housing for chronically homeless or other high‐priority populations. Funding for the project shall be comprised of CDBG, HOME, and HOME CHDO. Other sources of funds may come from prior years, program income, or HOME recaptures. It is estimated that $1,400,995 of the Municipality's HUD entitlement funding may go toward this project.
The inclusion of HOME funds dictates that the project complies with the Affordability requirements of Section 92.252, Including the recording of deed restrictions. However, since the exact parameters of the project is at this time unknown, the nature of the affordability and recapture provisions shall be determined through negotiations with the CHDO during the contracting phase.
Goal Name Homeowner Rehabilitation 2
Goal Description
The Minor Repair Program provides assistance for increased accessibility, energy efficiency or repairs to items presenting a threat to health or safety in an owner‐occupied home. For the standard component of the MRP, assistance is available to low‐ and moderate‐income residents throughout the Municipality. All homes considered for assistance must be occupied by owners with annual incomes at or below 80% of the area median income, as determined by HUD, adjusted for family size. Maximum project cost per eligible client is $15,000, excluding housing services costs. Exceptions may be made for homes with additional costs due to lead‐based paint, or to cover unforeseen cost overruns or when additional costs are due to improvements needed to accommodate a resident’s disability or for other exceptional circumstances. Thirty percent of the grant award to the Subrecipient will be used for Housing Services Costs.
Goal Name Mobile Home Rehabilitation 3
Goal Description
Through the public process, it was determined that mobile homes are a substantial component of the affordable housing in Anchorage. Additionally, research revealed that the mobile‐home stock is significantly aging with the condition of many units deteriorating. Therefore, the Municipality shall develop a program that focuses on the repairs of mobile homes.
Goal Name Affordable Homeownership 4
Goal Description
This goal is attained through the Affordable Housing Program undertaken in conjunction with Habitat for Humanity Anchorage. The program consists of providing Habitat with CDBG funds to purchase properties. When the housing units are complete, a HOME downpayment‐assistance loan is furnished to the homebuyers. Using the HOME funds qualifies the projects as “HOME‐assisted”, allowing the Municipality to count the volunteer labor and other donations as match under its obligations to the HOME Program.

Consolidated Plan ANCHORAGE 178
OMB Control No: 2506‐0117 (exp. 07/31/2015)
Goal Name Homeless Facilities 5
Goal Description
The Community Service Patrol is a van equipped with a gurney, and driven by an Emergency Medical Technical (EMT) I, which takes individuals incapacitated by alcohol and substance abuse in public places into protective custody. The inebriated person is transported to the Anchorage Safety Center which is co‐located by the Anchorage Cook Inlet Jail complex. Clients are evaluated using basic assessments and an EMT I, conducts follow‐up evaluation every half hour when a person falls asleep Individuals requiring medical assistance or additional care are taken to hospitals. This basic shelter for public inebriates requires repair and rehabilitation. The Safety Center is open and staffed 24 hours a day/7 days a week to accept individuals in need.
The project was funded $75,000 in 2012. Before construction could begin in 2012, it was decided to increase the scope and allocate an additional $76,250 from 2013 funds. The total allocation will amount to $151,250.
Goal Name Child Care Center 6
Goal Description
In 2012, the Municipality assisted RurAL CAP in the purchase of the Child Development Center located at 545 East 5th Avenue. It was determined that parking for the facility was inadequate. The lot adjacent to the building was available. Therefore, it was decided to assist RurAL CAP in its purchase. The purchase price is $175,000.
Goal Name Public Services 7
Goal Description
CDBG Public Services – RFP for 5 public service projects.
Goal Name Homeless Assistance and Rapid Transition Services 8
Goal Description
ESG ‐ Engage in homeless prevention, rapid re‐housing and shelter activities. To prevent individuals and families from becoming homeless.

Consolidated Plan ANCHORAGE 179
OMB Control No: 2506‐0117 (exp. 07/31/2015)
Estimate the number of extremely low‐income, low‐income, and moderate‐income families to whom the jurisdiction will provide affordable housing as defined by HOME 91.315(b)(2)
Rental Development Program The Rental Development Program is targeted at the chronically homeless or other populations receiving a high‐prioritization in the Consolidated Plan’s Needs Assessment. Other groups could include housing for elderly, frail elderly, or the disabled. The Municipality has set aside approximately $1.4 million in HOME, CDBG, and CDBG Public Service funds. If the funds are not leveraged, staff has calculated that the available HUD funds could conservatively generate about 10 rental units. Targets groups such as the chronically homeless and disabled tend to be included in the extremely low‐income category. Senior household may be more spread across the income levels. Therefore, a fair estimate could be 5‐10 extremely low‐income, 1‐5 low income, and 1‐5 moderate‐income families for the Rental Development Program.
Minor Repair Program The Municipality intends to infuse $400,000 into the ongoing Minor Repair Program. This amount of funds is calculated to assist about 19 households. Historically, the demographics appear randomly split among the income groups. Therefore, a reasonable estimate would consist of 3‐10 extremely low‐income, 3‐10 low‐income, and 3‐10 moderate‐income families.
Mobile Home Rehabilitation Program According to the Investing in Affordable Homeownership‐Housing
In 2013, CSD will continue to fund affordable homeownership programs such as the Affordable Housing Program. The Affordable Housing Program is funded to assist 8 households in 2013. In addition to funding homeownership, CSD will continue to invest in preserving the affordable housing stock by funding the Minor Repair Program, thus helping to lessen the burden of low‐income homeowners by reducing maintenance and utility costs. CSD estimates that the Minor Repair program funding for 2013 will assist 19 households. DHHS will work closely with AHFC to ensure access to housing for special‐needs populations.
Investing in Manufactured Housing The number of affordable manufactured housing units in Anchorage has been diminishing over the past several years. With vacant land becoming scarce within the Anchorage bowl, there are increased market pressures on owners of manufactured housing parks to convert their lots into other uses. In addition, many of the existing homes and parks are in poor condition. In some cases, upgrading the parks to current standards has proved prohibitively expensive, leaving owners facing disincentives to re‐investment. These combined circumstances have resulted in several parks closing. Some of the evicted tenants with older homes face the reality that their homes cannot be moved due to their poor condition or age.
Over the past several years CSD has worked on several community efforts with the HAND Commission and other community groups to begin manufactured‐housing projects. There have been several meetings held with manufactured‐housing park owners to assess federal policies and programs regarding manufactured housing. There have been discussions with CIHA on development of a manufactured‐housing replacement‐loan program. CSD has funded the new Mobile Home Repair program for 2013. CSD anticipates the 2013 funding will assist 8 or more housing units.
Investing in Affordable Rental‐Housing for Extremely Low‐Income Persons CSD in 2013 will continue to prioritize funding for investment in rental housing development for extremely low‐income persons with HOME funding. The Municipality is providing CDBG and HOME funding for one or two rental‐development projects in 2013. The Rental Development may include acquisition, new construction, or rehabilitation.

Consolidated Plan ANCHORAGE 180
OMB Control No: 2506‐0117 (exp. 07/31/2015)
SP‐50 Public Housing Accessibility and Involvement – 91.215(c)
Need to Increase the Number of Accessible Units (if Required by a Section 504 Voluntary Compliance Agreement)
AHFC also conducts an annual ADA‐504 needs assessment to create priorities for modifications and planned unit improvements, such as enlarging door openings, adding grab bars in bathrooms and hallways, installing automatic doors, and removing carpet to facilitate wheelchair movement. For new construction, AHFC complies with ADA‐504 on all new construction and renovation projects and ensures that at least five percent of the units, or one unit (whichever is greater), will accommodate a person with mobility impairments.
AHFC offers a well‐defined Reasonable Accommodation process that covers families from the application process through unit modification requests. Additionally, AHFC offers language interpretation services to those families with limited English proficiency.
Activities to Increase Resident Involvements
AHFC encourages resident involvement and input on routine basis. The Resident Advisory board meets infrequently to discuss program or plan changes affecting both Public Housing residents and Housing Choice Voucher holders. The Public Housing Division frequently holds public hearings for resident and public input on a variety of policies and programs. Examples of recent community meetings include public outreach for comment on their Moving to Work plan and the Rent Reform Initiative in a number of localities, a survey to residents in our elderly facilities regarding smoking policies, and informational meetings to discuss new apartment developments, how residents are affected, and their rights as the process moves forward. Several of AHFC Public Housing and Multi‐Family communities have active Resident Councils across the state, and AHFC produces a newsletter that is available to residents several times per year.
Is the public housing agency designated as troubled under 24 CFR part 902?
No
Plan to remove the ‘troubled’ designation
N/A
Consolidated Plan ANCHORAGE 181
OMB Control No: 2506‐0117 (exp. 07/31/2015)
SP‐55 Barriers to affordable housing – 91.215(h)
Barriers to Affordable Housing
The MOA has worked with the community leaders and providers to identify barriers to affordable housing. This section describe the jurisdiction's strategy to remove or ameliorate negative effects of public policies that serve as barriers to affordable housing, as identified in accordance with 91.210(e).
See information below "MA‐40 Barriers to Affordable Housing".
Strategy to Remove or Ameliorate the Barriers to Affordable Housing
The Municipality has worked with the community leaders and providers to identify barriers to affordable housing. This section describe the jurisdiction's strategy to remove or ameliorate negative effects of public policies that serve as barriers to affordable housing, as identified in accordance with 91.210(e).
See information in the section "Strategy to Remove or Ameliorate the Barriers to Affordable Housing".
SP‐55 Barriers to Affordable Housing
Strategy to Remove or Ameliorate the Barriers to Affordable Housing Page 1
Strategy to Remove or Ameliorate the Barriers to Affordable Housing Page 2
Strategy to Remove or Ameliorate the Barriers to Affordable Housing Page 3

Consolidated Plan ANCHORAGE 182
OMB Control No: 2506‐0117 (exp. 07/31/2015)
Strategy to Remove or Ameliorate the Barriers to Affordable Housing Page 4
Consolidated Plan ANCHORAGE 183
OMB Control No: 2506‐0117 (exp. 07/31/2015)
SP‐60 Homelessness Strategy – 91.215(d)
Reaching out to homeless persons (especially unsheltered persons) and assessing their individual needs
Project Homeless Connect is an annual one‐stop shop which links essential services for the homeless and at‐risk or imminently at‐risk individuals and households. The PHC collects data from project participants and uses the information to invite new vendors or services to future events. In addition, the PHC information is collated and used in determining Anchorage’s Point In Time count as well as the Housing Inventory Chart. The effort to collect data during this one‐day event is the cornerstone for establishing data used in the Anchorage Continuum of Care (CoC), and will be used in the city’s upcoming Ten Year Plan. The Needs Assessment Section of this Consolidated Plan presents helpful information in understanding the reasons why households are homeless or at‐risk and whether or not they are accessing mainstream services.
Addressing the emergency and transitional housing needs of homeless persons
Over the past year and a half, the Municipality’s HAND Commission and its Oversight Subcommittee on Homelessness (HCOSH) have spent months assessing the needs of homeless persons, in particular emergency shelter and affordable housing. According to data from AKHMIS as well as discussions between the DHHS Director and Catholic Social Services Executive Director, there is a deep understanding for the need of additional emergency shelter beds. Data collected in 2012 during scheduled “time” counts, shows there is a lack of emergency shelter beds ranging from 108 to 29. Most importantly, the months that showed the greatest need was January and December; both months are the coldest in Anchorage. Data collected in 2011 showed the same need. This Consolidated Plan outlines the use of HUD monies toward homeless services facilities, as evidenced in Section NA 50 Non‐Housing Community Development Needs and is given a high priority in SP 25 Priority Needs. Transitional housing is currently under review by the Ten Year Plan, which will present findings and recommendations later this year (2013). The Ten Year Plan is overseen by the HCOSH.
Helping homeless persons (especially chronically homeless individuals and families, families with children, veterans and their families, and unaccompanied youth) make the transition to permanent housing and independent living, including shortening the period of time that individuals and families experience homelessness, facilitating access for homeless individuals and families to affordable housing units, and preventing individuals and families who were recently homeless from becoming homeless again.
Under the Emergency Solutions Grant (ESG), the Municipal DHHS provides direct emergency financial assistance to households who are literally homeless or will imminently lose their residence. This financial assistance is provided through HUD ESG dollars. Under HUD Emergency Solutions Grant there are four categories of homelessness:[1]
1. Literally homeless individuals/families
2. Individuals/families who will imminently (within 14 days) lose their primary nighttime residence with no subsequent residence, resources or support networks
3. Unaccompanied youth or families with children/youth who meet the homeless definition under another federal statute and 3 additional criteria
4. Individuals/families fleeing or attempting to flee domestic violence with no subsequent residence, resources or support networks
The Continuum of Care is working towards a plan to create new permanent housing beds for the chronically homeless populations including: RurAL CAP’s Housing First Project designating 5 additional beds; and, the Municipality working with Veterans Health Officer to add 35 VA vouchers to 2013 HIC, as well as include 10 additional VASH vouchers. This will total 87 beds in twelve months during 2013. Also, the Municipality will work with Cook Inlet Housing Authority and AHFC to assess building additional housing for chronically homeless using CDBG monies; and, Anchorage Community Mental Health Services will advocate for development of Housing First programs for the mentally ill.

Consolidated Plan ANCHORAGE 184
OMB Control No: 2506‐0117 (exp. 07/31/2015)
Help low‐income individuals and families avoid becoming homeless, especially extremely low‐income individuals and families who are likely to become homeless after being discharged from a publicly funded institution or system of care, or who are receiving assistance from public and private agencies that address housing, health, social services, employment, education or youth needs
The Alaska Department of Health and Social Services, Office of Children’s Services (OCS) is mandated by AS 47.18.300‐390 to implement a foster care transition program for youth. The municipality does not have jurisdiction over the State. However, the Anchorage CoC, of which the municipality is a Board member, has supported the Alaska Homeless Coalition/CoC’s work with The Alaska Council on the Homeless to develop a special section (F‐2) in Alaska's 10‐Year plan that addresses youth aging out of foster care. The Plan includes strategies such as pursuing Family Unification Program vouchers when available and advocating for prioritization of youth leaving foster care for admission to residential vocational‐tech centers. This past year, AHFC redirected HOME funds to launch a new TBRA program targeting youth aging out of foster care. When fully implemented, the program is expected to assist approximately 20 young adults in the CoC aged between 18 and 20 yrs.
SP60 Table 1 Number of Homeless Individuals vs Available Emergency Shelter Beds

Consolidated Plan ANCHORAGE 185
OMB Control No: 2506‐0117 (exp. 07/31/2015)
SP‐65 Lead based paint Hazards – 91.215(i)
Actions to address LBP hazards and increase access to housing without LBP hazards
The following describes actions that will take place in 2013 to evaluate and reduce the number of housing units containing lead‐based paint hazards in order to increase the inventory of lead‐safe housing available to extremely low‐income, low‐income, and moderate‐income families.
HUD regulations require that the Consolidated Plan examine lead‐based paint hazards and develop a strategy for reducing them. The Annual Action Plan describes the Municipality’s proposed actions for the coming program year to evaluate and reduce lead‐based paint hazards.
Based on housing age/occupant income data provided by HUD's Community Planning and Development demographic data, 51,825 (50.02 percent) of the occupied housing units were built before 1979. Of these, 29,593 (47 percent) are owner‐occupied and 22,232 (55 percent) are rental units.
As a point of reference, the Municipality’s records for the Minor Repair Program show a very low percentage of instances where LBP needed to be remediated in a project. During the time‐span from 2003 through 2012, the Minor Repair Program assisted 319 homeowners. Out of those, 136 were constructed prior to 1978 and required testing for LBP. Of those 136 units tested, 12 were positive and required remediation, which constitutes 9%. Granted, these calculations are not scientifically derived. No complex‐statistical analysis was performed; thus, no mathematically generated confidence factor was obtained. However, one could comfortably give a deviation 20% of the 9%, resulting in a plus or minus of 1.8% (9% ± 1.8% = 7.2%, 10.8%) Therefore, in the total population of houses constructed prior to 1978 (51,825), the number of homes with LBP may range from 3,731 to 5,597.
Lead‐based paint in Anchorage’s housing continues to be a rare occurrence. Nevertheless, all CDBG‐ and HOME‐funded programs dealing with rehabilitation of older homes include funds to address lead‐based paint according to Part 35 regulations.
How are the actions listed above related to the extent of lead poisoning and hazards?
On March 7, 2008, the State of Alaska, Department of Health and Social Services, Division of Public Health, Section of Epidemiology published Bulletin No. 7. The title of Bulletin No. 7 was Blood Lead Epidemiology and Surveillance, Non‐Occupational Exposures in Adults and Children – Alaska, 1995–2006. Alaska regulations require laboratories and health care providers to report all blood lead level (BLL) results ≥ 10 micrograms per deciliter (µ/dL) to the Section of Epidemiology. The Center for Disease Control (CDC) considers BLLs ≥ 10 µ/dL to be a health concern for children aged >6 (subsequent CDC announcements have renamed the “level of concern” to “reference value” and lowered the value to ≥5 µ/dL). The State received BLL reports on 1,141 children during the 10‐year period that were aged >6. Of them, 17 (1.5%) had elevated BLL that were ≥ 10 µ/dL. Sources of exposure included 6 (35%) foreign/adoptee from abroad, 2 (12%) playing with air gun pellets, 2 (12%) pica (eating non‐nutritive substances), and 7 (41%) unknown. The bulletin did not specify from where the children came. Also included in the bulletin were similar reports for children aged 6‐17, and adults aged 18+. Significant sources included indoor firing ranges, accounting for 70 persons, which constituted 81% of the reported “levels of concern”. The second highest source for all age groups was children born abroad or adopted (10%). People casting lead as a hobby constituted the 3rd highest source, amounting to 3.4%. Contamination through LBP didn’t make the list. Lastly, among children >6 years tested from 1997‐2001 (according to the CDC), the proportion who had elevated BLLs was lower in Alaska than in the United States (1.5% vs. 5.1% respectively).
How are the actions listed above integrated into housing policies and procedures?
CSD will continue to collaborate with State and local agencies, nonprofit groups, and the private sector to reduce housing‐related lead‐based paint hazards, especially for low‐income families and children. To implement this strategy, CSD has developed lead‐based paint Policies and Procedures in compliance with 24 CFR 35 (Lead‐Based Paint Poisoning Prevention in Certain Residential Structures) which are incorporated into all its programs. These include acquisition, rehabilitation, and rental‐assistance programs funded by CDBG and HOME. Where program‐specific policies impose funding caps per client or per unit, these caps may be waived when costs required address lead‐based paint testing, evaluations, assessments and mitigation cause the project to exceed program limits.

Consolidated Plan ANCHORAGE 186
OMB Control No: 2506‐0117 (exp. 07/31/2015)
SP‐70 Anti‐Poverty Strategy – 91.215(j)
Jurisdiction Goals, Programs and Policies for reducing the number of Poverty‐Level Families
There are many programs within the Municipality coordinating efforts towards reducing the number of poverty level families. The listed programs below are identified in the HAND and HCOSH’s work on the Consolidated Plan, and will also be included in the jurisdiction’s Ten Year Plan.
The HAND and HCOSH are working with the community to identify the number of families living in poverty, raise awareness of this issue by documenting numbers in the Consolidated Plan, 2013‐2017, and subsequent Annual Action Plans. Also, this issue will be addressed in the jurisdiction’s Ten Year Plan on Homelessness. The HAND and HCOSH have identified the following projects in coordinating this effort: The Child in Transition/Homeless Project, Project Homeless Connect, AKHMIS, and Anchorage’s Continuum of Care. Some of these projects are outlined in greater detail in B‐C below.
How are the Jurisdiction poverty reducing goals, programs, and policies coordinated with this affordable housing plan
See information in section "SP 70 Jurisdiction poverty reducing goals, programs, and policies" below.
SP 70 Jurisdiction poverty reducing goals, programs, and policies Page 1
SP 70 Jurisdiction poverty reducing goals, programs, and policies Page 2
SP 70 Jurisdiction poverty reducing goals, programs, and policies Page 3

Consolidated Plan ANCHORAGE 187
OMB Control No: 2506‐0117 (exp. 07/31/2015)
SP‐80 Monitoring – 91.230
Describe the standards and procedures that the jurisdiction will use to monitor activities carried out in furtherance of the plan and will use to ensure long‐term compliance with requirements of the programs involved, including minority business outreach and the comprehensive planning requirements
Monitoring is an integral management technique and a Government Accountability Office (GAO) standard. It is an ongoing process that assesses the quality of a program participant’s performance over a period of time. Monitoring provides information about program participants that is critical for making informed judgments about program effectiveness and management efficiency. It also helps in identifying instances of fraud, waste and abuse. It is the principal means by which the Department:
Ensures that programs and technical areas are carried out efficiently, effectively, and in compliance with applicable laws and regulations;
Assists program participants in improving their performance, developing or increasing stability and augmenting their management and technical skills, and
Stays abreast of the efficacy of CPD‐administered programs and technical areas within the communities these programs serve.
These regulations are designed to be consistent with the Departmental Management Control Program Handbook 1840.1 and the HUD Monitoring Desk Guide: Policies and Procedures for Program Oversight.
Handbook 1840.1 can be found at:
http://www.hud.gov/offices/adm/hudclips/handbooks/cfoh/18401/index.cfm.
The Desk Guide is located at: http://hudatwork.hud.gov/mgmtbudget/deskguide.pdf.
1. CSD Approach to Monitoring
Staff view monitoring, not as a once a year or periodic exercise, but as an ongoing process involving continuous communication and evaluation. Such a process involves frequent telephone/email contacts, written communications, analysis of reports and audits, and periodic meetings. It is the responsibility of staff to keep fully informed concerning participant compliance with program requirements and the extent to which technical assistance is needed.
The overriding goal of monitoring is to determine compliance, prevent/identify deficiencies and design corrective actions to improve or reinforce program participant performance. As part of this process, staff should be alert for fraud, waste and mismanagement or situations with potential for such abuse. Where possible, any identified deficiencies in need of corrective action should be handled through discussion, negotiation, or technical assistance in a manner that maximizes local discretion. Monitoring also provides opportunities to identify program participant accomplishments as well as successful management/implementation/evaluation techniques that might be replicated by other CPD program participants.
CSD monitors CDBG and HOME Grantees and Subrecipients using the following methods:
Quarterly Reports
On‐site Inspections
Desk reviews
Davis Bacon compliance reviews
CHDO certifications/recertifications
Review of Audited Financial Statements, Federal, State and Single Audits

Consolidated Plan ANCHORAGE 188
OMB Control No: 2506‐0117 (exp. 07/31/2015)
Expected Resources
AP‐15 Expected Resources – 91.220(c)(1,2)
Introduction
The Anticipated Resources that the MOA will have at its disposal over the course of the Strategic Plan is approximately $8,861,965 for CDBG, $2,959,555 for HOME, and $624,580 for ESG. Public and private agencies rely heavily on HUD funding and programs that address the broad spectrum of needs. Reduced funding for these HUD programs in 2012 adversely impacted local agencies and services that rely on these monies to assist individuals and families, and affected their ability to leverage resources for state or private funding. In 2013, the Municipality will receive increased funding of $60,109 for CDBG. The HOME Program funding was reduced $36,782 from 2012 and the ESG reduced $22,972.
The Municipality received 33.6% less than projected in HUD HOME funds for FY 2012.
The table reflects HUD’s reduced funding. CDBG funds may leverage additional resources from private, state, and local funds. The Minor Repair Program may become a loan to leverage private funds as program income. The Mobile Home Repair Program will leverage some state funding through the Weatherization Program. The Rental Development Program is funded with CDBG and HOME funds and may leverage other private, state, local, and federal funds.

Consolidated Plan ANCHORAGE 189
OMB Control No: 2506‐0117 (exp. 07/31/2015)
Anticipated Resources
Expected Amount Available Year 1 Program Source of
Funds
Uses of Funds
Annual Allocation:
$
Program Income:
$
Prior Year Resources:
$
Total:
$
Expected Amount Available Reminder
of Con Plan
$
Narrative Description
CDBG public ‐ federal
Acquisition Admin and Planning Economic Development Housing Public Improvements Public Services
1,772,393 0 1,216,167 2,988,560 7,089,572 CDBG funds may leverage additional resources from private, state, and local funds. The Minor Repair Program may become a loan to leverage private funds as program income. The Mobile Home Repair Program will leverage some state funding through the Weatherization Program. The Rental Development Program is funded with CDBG and HOME funds and may leverage other private, state, local, and federal funds.

Consolidated Plan ANCHORAGE 190
OMB Control No: 2506‐0117 (exp. 07/31/2015)
Expected Amount Available Year 1 Program Source of
Funds
Uses of Funds
Annual Allocation:
$
Program Income:
$
Prior Year Resources:
$
Total:
$
Expected Amount Available Reminder
of Con Plan
$
Narrative Description
HOME public ‐ federal
Acquisition Homebuyer assistance Homeowner rehab Multifamily rental new construction Multifamily rental rehab New construction for ownership TBRA
591,911 59,945 1,091,542 1,743,398 2,367,644 HOME was designed explicitly to expand the supply of decent and affordable housing for the very low, low to moderate income families and individuals. HOME assistance funding targets families that urgently need it. Nonprofit organizations that are rooted into the neighborhoods they serve represent the idea of community‐led revitalization through HOME funding. The federal government makes investments into the future of local nonprofit housing groups through community housing development organizations called CHDO.
There is a 25 cent match requirement for each dollar of HOME funds spent on affordable housing. Eligible sources of a match for HOME funds include: cash, donated construction material or voluntary labor, the value of donated land or real property, investments in on or off‐site improvements, the cost of homebuyer counseling, proceeds from bond financing, the cost of supportive services provided to families living in HOME units and the value of foregone interest, taxes, fees or charges levied by public or private entities.
Generally investments from State or local governments or the private sector qualify as matching contributions, whereas federal funds such as CDBG do not qualify.
The Municipality has an established resale provision that safeguards the properties continued affordability or recaptures all or part of the HOME subsidy.

Consolidated Plan ANCHORAGE 191
OMB Control No: 2506‐0117 (exp. 07/31/2015)
Expected Amount Available Year 1 Program Source of
Funds
Uses of Funds
Annual Allocation:
$
Program Income:
$
Prior Year Resources:
$
Total:
$
Expected Amount Available Reminder
of Con Plan
$
Narrative Description
ESG public ‐ federal
Conversion and rehab for transitional housing Financial Assistance Overnight shelter Rapid re‐housing (rental assistance) Rental Assistance Services Transitional housing
124,913 0 179,104 304,017 499,667 Emergency Solutions Grant (ESG) addresses homelessness assistance, rental and utility assistance, supports basic shelter operations and essential supportive services for homeless individuals and families geared to re‐housing. ESG emphasizes the need to prevent homelessness with a continuum model to prevent people from having to enter shelters and/or to support them in the event a shelter stay is unavoidable.
ESG requires a dollar for dollar match of the federal share. The statute provides that a grantee may use funds from any source including other federal source (excluding the specific statutory subtitle from which ESG funds are provided), as well as state, local and private sources, provided that funds from the other sources are not statutorily prohibited to be used as a match and that the funds are to be used for ESG eligible activities. The following are acceptable program matches: cash, value or fair rental value of any donated material or building to be used by the respondents, value of a building lease needed to house the ESG program in the proportion of the space to be used for ESG, space, telephone, furniture, secretarial, clerical support, computers, HMIS costs for the program, supervisory time spent on specific client cases, and other direct and indirect administrative/overhead costs not included in the budget and any salaries paid to staff to carry out the program.
Table 54 ‐ Expected Resources – Priority Table

Consolidated Plan ANCHORAGE 192
OMB Control No: 2506‐0117 (exp. 07/31/2015)
Explain how federal funds will leverage those additional resources (private, state and local funds), including a description of how matching requirements will be satisfied
The following is an overview of Federal, State, and local public and private sector resources that are expected to be available to address identified needs beginning in 2013, it is anticipated that a similar pattern of leveraging will be used for the following four years (2014‐2017).
A variety of funding resources are expected to be available to address affordable housing needs during 2013 See SP 30 Table.3 Total all Funding Sources. CSD in 2013 will continue its efforts to better coordinate housing resources with other community funders. CSD works to meet with funders such as the United Way of Anchorage, Rasmuson Foundation, and the Alaska Mental Health Trust Authority regarding housing opportunities and programming.
Of particular relevance in the 2013 Action Plan are the leveraged resources associated with the HOME Investment Partnerships Program (HOME). HOME regulations require a 25% match to HOME funds drawn down from the treasury on eligible projects (not including administrative or operating expense assistance funds). Going into program year 2013, the MOA will carry‐forward over $3.9 million of Unrestricted Match. Furthermore, the MOA carries on its books over $7.1 million in restricted match‐credit from affordable housing bonds proceeds. However, housing bond proceeds may only be used for up to 25% of the annual match obligation. During 2013, additional match is expected to come from a variety of sources.
Affordable Housing Program ‐ The Affordable Housing Program administered by Habitat for Humanity Anchorage will provide HOME match in the form of volunteer labor and materials for the construction of new HOME‐assisted housing for low‐income households. In its contract with the MOA, Habitat has forecasted to complete eight units in 2013. With an average match of over $28,000 per project, Habitat expects to recognize approximately $224,000 in Habitat match over the next year.
Housing Acquisition and Rehabilitation Program ‐ The Housing Acquisition and Rehabilitation Program (HARP) has moved into a new phase. The program will go into FY 2013 with approximately $1,000 of HOME funds, but will have expended over $400,000 of CHDO Proceeds. HOME match is recognized dollar‐for‐dollar as the Proceeds of CHDO Proceeds are inserted into projects. HOME funds are set aside and used only for down payment/closing‐cost assistance, keeping the match obligations of the program low while still continuing to enjoy the regulatory benefits of producing HOME‐assisted units in regards to match recognition. The program was set to expire at the end of 2012. However, with a current balance of over $31K left in CHDO Proceeds and the Proceeds of CHDO Proceeds, NeighborWorks Anchorage’s will complete one last unit in 2013. The contract will be extended through December 31, 2013.
If appropriate, describe publically owned land or property located within the jurisdiction that may be used to address the needs identified in the plan
The Municipality plans to submit an application for the acquisition surplus government property, approximately 131 acres located at 6721 Raspberry Road. The Municipality proposes to use the property for one or more of the following:
Campus for substance abuse treatment and support services (employment services, co‐occurring disorder counseling and support, etc.), including on‐site transitional housing,
Transitional housing, supportive housing, shelter plus care housing, and/or permanent housing, and/or
Work to Recovery Center.
Discussion
The Municipality will work with all housing agencies (AHFC and CIHA), as well as provider agencies to develop strategies where monies can be coordinated to support mutually identified goals and outcomes. There are many organizations and non‐profits that conduct projects, activities, and services in Anchorage that leverage other funds to assist low‐ and moderate‐income persons and households. These include Alaska Housing Finance Corporation, Cook Inlet Housing Authority, RuRAL CAP, Anchorage NeighborWorks, Habitat for Humanity, Salvation Army, Alaska Veterans Foundation, and many other.

Consolidated Plan ANCHORAGE 193
OMB Control No: 2506‐0117 (exp. 07/31/2015)
Annual Goals and Objectives
AP‐20 Annual Goals and Objectives
Goals Summary Information
Sort Order
Goal Name Start Year
End Year
Category Geographic Area
Needs Addressed Funding Goal Outcome Indicator
1 CHDO Rental Housing Development
2013 2014 Affordable Housing
Anchorage Affordable Housing ‐ Renters
CDBG: $285,806HOME:
$1,130,189
Public service activities for Low/Moderate Income Housing Benefit: 10 Households Assisted Rental units constructed: 10 Household Housing Unit
2 Homeowner Rehabilitation
2013 2014 Affordable Housing
Anchorage Affordable Housing ‐ Owners
CDBG: $415,000
Homeowner Housing Rehabilitated: 18 Household Housing Unit
3 Mobile Home Rehabilitation
2013 2014 Affordable Housing
Anchorage Affordable Housing ‐ Owners
CDBG: $215,000
Homeowner Housing Rehabilitated: 8 Household Housing Unit
4 Affordable Homeownership
2013 2014 Affordable Housing
Anchorage Affordable Housing ‐ Owners
HOME: $15,000
Homeowner Housing Added: 8 Household Housing Unit
5 Homeless Facilities 2012 2014 Homeless Anchorage Homeless ‐ Special Needs ‐ Subpopulations
CDBG: $76,250 Homeless Person Overnight Shelter: 3415 Persons Assisted
6 Child Care Center 2012 2014 Child Care Anchorage Public Facilities CDBG: $175,000
Other: 1 Other
7 Public Services 2013 2014 Homeless Anchorage Public Services CDBG: $265,859
Other: 5 Other
8 Homeless Assistance and Rapid Transition Services
2013 2015 Homeless Anchorage Homeless ‐ Special Needs ‐ Subpopulations
ESG: $115,547 Homelessness Prevention: 50 Persons Assisted
Table 55 – Goals Summary

Consolidated Plan ANCHORAGE 194
OMB Control No: 2506‐0117 (exp. 07/31/2015)
Goal Descriptions
Goal Name CHDO Rental Housing Development 1
Goal Description
This project shall include the selection of a CHDO to supportive housing for chronically homeless or other high‐priority populations. Funding for the project shall be comprised of CDBG, HOME, and HOME CHDO. The CDBG includes $15,000 for project oversight and $270,806 for project cost for a total CDBG of $285,806. It may also include $150,000 of CDBG Public Service. Furthermore, the Municipality intends to make available 2012 HOME and 2012 HOME CHDO funds in the amount of $557,745 for this project. It is estimated that $1,415,995 of the Municipality's HUD entitlement funding (CDBG, HOME, HOME CHDO) may go toward this project, $1,565,995 if the CDBG Public Services funds are also included.
Goal Name Homeowner Rehabilitation 2
Goal Description
The Minor Repair Program provides assistance for increased accessibility, energy efficiency or repairs to items presenting a threat to health or safety in an owner‐occupied home. Maximum project cost per eligible client is $15,000, excluding housing services costs. Exceptions may be made for homes with additional costs due to lead‐based paint, or to cover unforeseen cost overruns or when additional costs are due to improvements needed to accommodate a residents disability or for other exceptional circumstances.
Goal Name Mobile Home Rehabilitation 3
Goal Description
Through the public process, it was determined that mobile homes are a substantial component of the affordable housing in Anchorage. Additionally, research revealed that the mobile‐home stock is significantly aging with the condition of many units deteriorating. Therefore, the Municipality shall develop a program that focuses on the repairs of mobile homes.
Goal Name Affordable Homeownership 4
Goal Description
This goal is attained through the Affordable Housing Program undertaken in conjunction with Habitat for Humanity Anchorage. The program consists of providing Habitat with CDBG funds to purchase properties. When the housing units are complete, a HOME downpayment‐assistance loan is furnished to the homebuyers. Using the HOME funds qualifies the projects as HOME‐assisted, allowing the Municipality to count the volunteer labor and other donations as match under its obligations to the HOME Program.
Goal Name Homeless Facilities 5
Goal Description
The Community Service Patrol is a van equipped with a gurney, and driven by an Emergency Medical Technical (EMT) I, which takes individuals incapacitated by alcohol and substance abuse in public places into protective custody. The inebriated person is transported to the Anchorage Safety Center which is co‐located by the Anchorage Cook Inlet Jail complex. Clients are evaluated using basic assessments and an EMT I, conducts follow‐up evaluation every half hour when a person falls asleep. Individuals requiring medical assistance or additional care are taken to hospitals. This basic shelter for public inebriates requires repair and rehabilitation. The Safety Center is open and staffed 24 hours a day/7 days a week to accept individuals in need.
The project was funded $75,000 in 2012. Before construction could begin in 2012, it was decided to increase the scope and allocate an additional $76,250 from 2013 funds. The total allocation will amount to $151,250.

Consolidated Plan ANCHORAGE 195
OMB Control No: 2506‐0117 (exp. 07/31/2015)
Goal Name Child Care Center 6
Goal Description
In 2012, the Municipality assisted RurAL CAP in the purchase of the Child Development Center located at 545 East 5th Avenue. It was determined that parking for the facility was inadequate. The lot adjacent to the building was available. Therefore, it was decided to assist RurAL CAP in its purchase. The purchase price is $175,000.
Goal Name Public Services 7
Goal Description
Community Public Services, RFP/Application
Goal Name Homeless Assistance and Rapid Transition Services 8
Goal Description
ESG ‐ Engage in homeless prevention activities and essential services activities.
Consolidated Plan ANCHORAGE 196
OMB Control No: 2506‐0117 (exp. 07/31/2015)
Projects
AP‐35 Projects – 91.220(d)
Introduction
The Municipality of Anchorage is an Entitlement City and expects to receive Community Development Block Grant (CDBG) funds, HOME Investment Partnerships (HOME) funds, and Emergency Solutions Grants (ESG) funds for program year 2013. The programs that are planned for 2013 are discussed in this section.
Projects
# Project Name
1 Administration, Planning, and Grant Management
2 Minor Repair Program
3 Anchorage Safety Center
4 Child Development Center Acquisition of Adjacent Parking Lot
5 Mobile Home Repair Program
6 Rental Development
7 HOME Administration, Planning, and Grant Management
8 Affordable Housing Program ‐ Habitat for Humanity Anchorage
9 CDBG Public Services
10 ESG13 Anchorage
Table 56 – Project Information
Describe the reasons for allocation priorities and any obstacles to addressing underserved needs
The allocation priorities for this Action Plan were derived from the needs recognized in the 2013‐2017 Consolidated Plan. The three main obstacles to addressing underserved needs include:
Lack of funding;
Lack of available land for construction of affordable housing; and,
High cost of land and building materials.
Objectives specifically related to homelessness include:
Expand the supply of rental housing for special‐needs populations, with an emphasis on the homeless, as outlined in the affordable‐housing strategy section;
Educate the public about the issue of homelessness;
Engage in homeless‐prevention activities and homeless services;
Support case‐management services in order to assist people in obtaining or retaining permanent housing;
Assist in the development of a coordinated intake‐ and discharge‐system in Anchorage; and,
Support existing shelter services and the expansion of transitional‐housing services.
The Municipality will continue to seek additional funding for programs to address underserved needs. Two of the four affordable housing programs in this Action Plan are targeted at improving and maintaining a small portion of the existing affordable housing stock. Habitat for Humanity will continue to seek land for the Affordable Housing program for new construction.

Consolidated Plan ANCHORAGE 197
OMB Control No: 2506‐0117 (exp. 07/31/2015)
AP‐38 Project Summary
Project Summary Information
Project Name Administration, Planning, and Grant Management
Target Area Anchorage
Goals Supported
CHDO Rental Housing Development Homeowner Rehabilitation Mobile Home Rehabilitation Affordable Homeownership Homeless Facilities Child Care Center Public Services
Needs Addressed
Homeless ‐ Special Needs ‐ Subpopulations Non‐Homeless Special Needs ‐ Subpopulations Affordable Housing ‐ Renters Affordable Housing ‐ Owners Affordable Housing ‐ Non‐Homeless Special Needs General Public Facilities Infrastructure Public Services Other
1
Funding CDBG: $354,478

Consolidated Plan ANCHORAGE 198
OMB Control No: 2506‐0117 (exp. 07/31/2015)
Description Grant management, planning, and technical assistance to carry out CDBG, HOME and selected other activities. Several planning, technical assistance and grant management activities have been identified for 2013 and include the following:
A. General management of the CDBG and HOME projects and programs, including the drafting of the Action Plan and CAPER, executing procurement processes including RFP procedures and drafting written agreements
B. Monitoring subrecipient agreements and budgets, and assuring all federal and local guidelines are met, including eligibility under HUD national objectives, Davis Bacon labor requirements, environmental reviews, fair housing and affirmative marketing
C. Environmental reviews for projects initiated and funded by HUD (other than CDBG, HOME or ESG projects)
D. As the Lead Agency for the Continuum of Care (CoC) oversee the process and write the CoC Exhibit 1for submission to HUD
E. Assist in the development of planning strategies and community development planning efforts with other services, including Alaska Housing Finance Corporation. Makes recommendations to Housing and Neighborhood Development Commission related to long and short term housing community development strategies to affect revitalization of lower income risk neighborhoods.
F. Program evaluations
G. Direct Departmental operational costs and indirect costs as determined by the Intra‐governmental Chargeback System
Planned Activities
24 CFR 570.205 & 206 ‐ Eligible planning and Program administrative costs.

Consolidated Plan ANCHORAGE 199
OMB Control No: 2506‐0117 (exp. 07/31/2015)
Project Name Minor Repair Program
Target Area Anchorage
Goals Supported
Homeowner Rehabilitation
Needs Addressed
Affordable Housing ‐ Owners
Funding CDBG: $415,000
Description The Minor Repair Program provides assistance for increased accessibility, energy efficiency or repairs to items presenting a threat to health or safety in an owner‐occupied home. For the standard component of the MRP, assistance is available to low‐ and moderate‐income residents throughout the Municipality. All homes considered for assistance must be occupied by owners with annual incomes at or below 80% of the area median income, as determined by HUD, adjusted for family size. Maximum project cost per eligible client is $15,000, excluding housing services costs. Exceptions may be made for homes with additional costs due to lead‐based paint, or to cover unforeseen cost overruns or when additional costs are due to improvements needed to accommodate a residents disability or for other exceptional circumstances. Thirty percent of the grant award to the Subrecipient will be used for Housing Services Costs. $15,000 of the 2013 funding is for project oversight.
2
Planned Activities
24 CFR 570.202 (b)(1) ‐ Assistance to private individuals and entities, including profit making and nonprofit organizations, to acquire for the purpose of rehabilitation, and to rehabilitate properties, for use or re‐sale for residential purposes.

Consolidated Plan ANCHORAGE 200
OMB Control No: 2506‐0117 (exp. 07/31/2015)
Project Name Anchorage Safety Center
Target Area Anchorage
Goals Supported
Homeless Facilities
Needs Addressed
Homeless ‐ Special Needs ‐ Subpopulations
Funding CDBG: $76,250
Description The Community Service Patrol is a van equipped with a gurney, and driven by an Emergency Medical Technical (EMT) I, which takes individuals incapacitated by alcohol and substance abuse in public places into protective custody. The inebriated person is transported to the Anchorage Safety Center which is co‐located by the Anchorage Cook Inlet Jail complex. Clients are evaluated using basic assessments and an EMT I, conducts follow‐up evaluation every half hour when a person falls asleep Individuals requiring medical assistance or additional care are taken to hospitals. This basic shelter for public inebriates requires repair and rehabilitation. The Safety Center is open and staffed 24 hours a day/7 days a week to accept individuals in need.
The project was funded $75,000 in 2012. Before construction could begin in 2012, it was decided to increase the scope and allocate an additional $76,250 from 2013 funds. The total allocation will amount to $151,250. $3,750 of the 2013 funding is for project oversight.
3
Planned Activities
24 CFR 570.201 (c) Public facilities & improvements.

Consolidated Plan ANCHORAGE 201
OMB Control No: 2506‐0117 (exp. 07/31/2015)
Project Name Child Development Center Acquisition of Adjacent Parking Lot
Target Area Anchorage
Goals Supported
Child Care Center
Needs Addressed
Public Facilities
Funding CDBG: $175,000
Description In 2012, the Municipality assisted RurAL CAP in the purchase of the Child Development Center located at 545 East 5th Avenue. It was determined that parking for the facility was inadequate. The lot adjacent to the building was available. Therefore, it was decided to assist RurAL CAP in its purchase. The purchase price is $175,000.
4
Planned Activities
24 CFR 201 (c) ‐ Public facilities & improvements.

Consolidated Plan ANCHORAGE 202
OMB Control No: 2506‐0117 (exp. 07/31/2015)
Project Name Mobile Home Repair Program
Target Area Anchorage
Goals Supported
Mobile Home Rehabilitation
Needs Addressed
Affordable Housing ‐ Owners
Funding CDBG: $215,000
Description Through the public process, it was determined that mobile homes are a substantial component of the affordable housing in Anchorage. Additionally, research revealed that the mobile‐home stock is significantly aging with the condition of many units deteriorating. Therefore, the Municipality shall develop a program that focuses on the repairs of mobile homes. $15,000 of the 2013 funding is for project oversight.
5
Planned Activities
24 CFR 570.202 (b)(1) ‐ Assistance to private individuals and entities, including profit making and nonprofit organizations, to acquire for the purpose of rehabilitation, and to rehabilitate properties, for use or re‐sale for residential purposes.

Consolidated Plan ANCHORAGE 203
OMB Control No: 2506‐0117 (exp. 07/31/2015)
Project Name Rental Development
Target Area Anchorage
Goals Supported
CHDO Rental Housing Development
Needs Addressed
Affordable Housing ‐ Renters
Funding CDBG: $285,806 HOME: $1,130,189
Description This project shall include the selection of a CHDO to supportive housing for chronically homeless or other high‐priority populations. Funding for the project shall be comprised of CDBG, HOME, and HOME CHDO. The CDBG includes $15,000 for project oversight and $270,806 for project cost for a total CDBG of $$285,806. It may also include $150,000 of CDBG Public Service. Furthermore, the Municipality intends to make available 2012 HOME and 2012 HOME CHDO funds in the amount of $557,745 for this project. It is estimated that $1,415,995 of the Municipality's HUD entitlement funding (CDBG, HOME, HOME CHDO) may go toward this project, $1,565,995 if the CDBG Public Services funds are also included.
6
Planned Activities
24 CFR 570.201 (e) ‐ Public Services 24 CFR 570.201 (c) ‐ Public facilities and improvements. 24 CFR 92.205 (a)(1) ‐ HOME funds may be used by a PJ to provide incentives to develop and support affordable rental housing through the acquisition, new construction, reconstruction, or rehabilitation of non‐luxury housing with suitable amenities, including real property acquisition, site improvement. The housing must be permanent or transitional housing. The specific eligible costs are set forth in sections 92.206 through 92.209.

Consolidated Plan ANCHORAGE 204
OMB Control No: 2506‐0117 (exp. 07/31/2015)
Project Name HOME Administration, Planning, and Grant Management
Target Area Anchorage
Goals Supported
CHDO Rental Housing Development Affordable Homeownership
Needs Addressed
Affordable Housing ‐ Renters Affordable Housing ‐ Owners
Funding HOME: $64,412
Description Up to 10 percent of all new HOME funds, including program income, may be used for administration, planning, and grant management. These funds will be used for general management of HOME projects and programs including the drafting the Action Plan and CAPER, executing procurement processes including RFGP procedures and drafting written agreements, and general office expenses. Funds will also support the monitoring subrecipient agreements and budgets, and assuring all federal and local guidelines are met, including eligibility under HUD national objectives, Davis Bacon labor requirements, environmental reviews, fair housing and affirmative marketing. $5,221 of the $64,412 is from program income.
7
Planned Activities
24 CFR 92.207 ‐ Eligible administrative and planning costs.

Consolidated Plan ANCHORAGE 205
OMB Control No: 2506‐0117 (exp. 07/31/2015)
Project Name
Affordable Housing Program ‐ Habitat for Humanity Anchorage
Target Area Anchorage
Goals Supported
Affordable Homeownership
Needs Addressed
Affordable Housing ‐ Owners
Funding HOME: $15,000
Description Under this program, Habitat for Humanity Anchorage purchases sites for the construction of affordable housing for low‐ to moderate‐income households. Sites acquired with the assistance of CDBG funds and the construction of new single‐family or multi‐family housing units will be completed using other funds and volunteer labor. Homebuyers will be required to qualify for a 0% interest loan and comply with the policies of Habitat of Humanity Anchorages program. The homebuyers for these units will also receive a minimum of $1,000 in down payment and closing costs assistance through the HOME program. This program has been ongoing since 2003, with the current contract beginning in 2008. For this program year, the Municipality will be allocating HOME funds to be used as the downpayment/closing‐cost loans. The funds will be used over this and the next program years.
8
Planned Activities
24 CFR 201 (a) ‐ Acquisition. 24 CFR 92.205 ‐ HOME funds may be used by a PJ to provide incentives to develop and support affordable ...homeownership through the acquisition (including assistance to homebuyers)

Consolidated Plan ANCHORAGE 206
OMB Control No: 2506‐0117 (exp. 07/31/2015)
Project Name CDBG Public Services
Target Area Anchorage
Goals Supported Public Services
Needs Addressed Public Services
Funding CDBG: $265,859
Description CDBG Public Services ‐ RFP for 4‐5 public service projects.
9
Planned Activities 570.201(e) – Public Services.

Consolidated Plan ANCHORAGE 207
OMB Control No: 2506‐0117 (exp. 07/31/2015)
Project Name ESG13 Anchorage
Target Area Anchorage
Goals Supported Homeless Assistance and Rapid Transition Services
Needs Addressed Homeless ‐ Special Needs ‐ Subpopulations
Funding ESG: $124,916
Description Homeless Prevention activities, Rapid Rehousing Services and emergency shelter operation services.
10
Planned Activities Engage in homeless prevention activities and essential services activities. Homeless Prevention ‐ $26,232 Rapid Re‐housing ‐ $63,084 Emergency Shelter Services Operations ‐ $26,232 Administration ‐ $9,368
Table 57 – Project Summary

Consolidated Plan ANCHORAGE 208
OMB Control No: 2506‐0117 (exp. 07/31/2015)
AP‐50 Geographic Distribution – 91.220(f)
Description of the geographic areas of the entitlement (including areas of low‐income and minority concentration) where assistance will be directed
The following is a description of the Municipality’s geographic area for services, which include areas for low‐income families and/or racial and minority concentrations where efforts will be directed throughout the 2013 calendar year.
According to the 2010 U.S. Census, the Municipality of Anchorage (MOA) has a total land area of 1,704.68 square miles and includes the Anchorage Bowl, Chugiak and Eagle River, and Girdwood (Turnagain Arm). The MOA is considered a county under the U.S. Census, and is identified as a unified home rule municipality, which means city government and borough governments are merged. Anchorage is the northernmost major city in the United States. According to the AK Department of Labor, the estimated population in July 2012, Anchorage hosted a total of 298,842 residents. Anchorage is the largest city in Alaska and constitutes more than 40% of the state’s total population.
The geographic area is the Municipality Of Anchorage, ranging from Girdwood to Eklutna.
Geographic Distribution
Target Area Percentage of Funds
Table 58 ‐ Geographic Distribution
Rationale for the priorities for allocating investments geographically
In 2010 the median income in Anchorage was $85,200. According to the 2010 Census, a total of 32,469 households in census tracts with a median household income below 80% of Anchorage’s median income, below $66,880. According to the AK Dept. of Labor, in July 2011, approximately 71% of the population are White, 12% are Asian or Pacific Islanders, 10% are American Indian/Alaska Native, 8% is Black, and 8% are of Hispanic Origin (of any race).
The rationale for the priorities for allocating investments geographically was that there is a great need for all programs city‐wide. It was decided that it would not be fair, with the limited funding, to penalize resident based on where they reside in the Municipality. There are no priority areas for allocating investments.
Discussion
The rationale for the priorities for allocating investments geographically was that there is a great need for all programs city‐wide. It was decided that it would not be fair, with the limited funding, to penalize resident based on where they reside in the Municipality. There are no priority areas for allocating investments.
As the Anchorage and Matanuska‐Susitna Valley metropolitan areas continue to sprawl outward with jobs and housing becoming increasingly dispersed, fewer low‐wage workers are able to find housing near their work. Low‐ and moderate income families are “driving till they qualify” for housing and choosing to live in the Matanuska‐Susitna Valley where the cost of housing is less expensive, but the transportation costs dramatically increase. This trend reflects the fact that nationally, the combination of housing and transportation costs now averages a combined 60 percent of income for working families.

Consolidated Plan ANCHORAGE 209
OMB Control No: 2506‐0117 (exp. 07/31/2015)
Affordable Housing
AP‐55 Affordable Housing – 91.220(g)
Introduction
Affordable Housing is a high priority in the Consolidated Plan. The Municipality has four programs funded with 2013 CDBG and HOME funds.
CHDO Rental Housing Development ‐ New construction or renovation of 10 units of rental housing for chronically homeless or other high‐priority populations.
Minor Repair Program ‐ Increased accessibility, energy efficiency or repairs to items presenting a threat to health or safety in 18 owner‐occupied homes.
Mobile Home Rehabilitation ‐ Repairs to 8 owner‐occupied mobile homes.
Affordable Housing Program ‐ Downpayment‐assistance loans to 8 homebuyers of newly constructed homes.
Some of the households may be those with special‐needs.
One Year Goals for the Number of Households to be Supported
Homeless 10
Non‐Homeless 34
Special‐Needs 0
Total 44
Table 59 ‐ One Year Goals for Affordable Housing by Support Requirement
One Year Goals for the Number of Households Supported Through
Rental Assistance 10
The Production of New Units 8
Rehab of Existing Units 26
Acquisition of Existing Units 0
Total 44
Table 60 ‐ One Year Goals for Affordable Housing by Support Type
Discussion
The Municipality is providing affordable housing assistance to renters and homeowners. The programs include acquisition, new construction, rehabilitation, and down‐payment assistance. Clients may be homeless, non‐homeless, or have special needs.

Consolidated Plan ANCHORAGE 210
OMB Control No: 2506‐0117 (exp. 07/31/2015)
AP‐60 Public Housing – 91.220(h)
Introduction
Alaska Housing Finance Corporation (AHFC) is a self‐supporting corporation with a mission to provide Alaskans with access to safe, quality, affordable housing. They provide a variety of affordable housing programs and tools, including the operation of public housing, housing choice vouchers, and project‐based assistance. They also finance housing developments through the Low Income Housing Tax Credit program, tax‐exempt multifamily loans, and the distribution of Federal and State housing grants. In addition, a variety of home loan programs for low‐ and moderate‐income residents are offered by the Corporation. AHFC promotes self‐sufficiency and well‐being for people in Anchorage. AHFC also provides housing‐related research, planning, and program development services for Alaskan communities. AHFC also provides monthly rental subsidy equivalent to 35 project‐based vouchers for persons at the Karluk Manor, a Housing First development targeting chronically homeless individuals with substance abuse and alcohol addictions. As of April 2013 in Anchorage there were over 1,500 on the Housing Choice Voucher waiting list, and over 3,000 on the waiting list for various AHFC‐owned rental assistance units. In the past year AHFC created three new transitional tenant‐based rental assistance programs: the Empowering Choice Housing Program for victims of domestic violence and sexual assault; the Youth Aging Out of Foster Care program for youth between 18‐24 that transitioning to independent living, and the Parolee/Probationer Re‐Entry program for those transitioning out of the state prison system. In order to continue to serve those with special needs in our communities, AHFC has created set aside programs. For the elderly and disabled population, AHFC has 240 low‐income units. Additionally, AHFC has set aside 96 vouchers statewide, exclusively for persons with disabilities. Anchorage also has a set aside of 20 vouchers for individuals referred from Anchorage Community Mental Health Services. AHFC also conducts an annual ADA‐504 needs assessment to create priorities for modifications and planned unit improvements, such as enlarging door openings, adding grab bars in bathrooms and hallways, installing automatic doors, and removing carpet to facilitate wheelchair movement. For new construction, AHFC complies with ADA‐504 on all new construction and renovation projects and ensures that at least five percent of the units, or one unit (whichever is greater), will accommodate a person with mobility impairments. Lastly, AHFC offers a well‐defined Reasonable Accommodation process that covers families from the application process through unit modification requests. Additionally, AHFC offers language interpretation services to those families with limited English proficiency.
Actions planned during the next year to address the needs to public housing
Public Housing units available 7/1/2013 ‐ 506 Number or MTW Voucher units authorized ‐ 2,345 Number of non‐MTW Voucher units authorized for veterans (Anchorage, Fairbanks, Mat‐Su) ‐ 240 Number of project‐based units authorized (Loussac Place) ‐ 60 Anticipated MTW Public Housing units leased ‐ 506 Anticipated MTW voucher units leased ‐ 2,345 Anticipated non‐MTW voucher units leased for veterans (Anchorage, Fairbanks, Mat‐Su) ‐ 195 Anticipated project‐based voucher units leased (Loussac Place) ‐ 60 Number of households on the Housing Choice Voucher waiting list ‐ 2,367 Empowering Choice Housing Program ‐ 295,570 Section 8 new multi‐family housing available units ‐ 120 Affordable housing available units ‐ 48 Other subsidized units available – Adelaide SRO Mod Rehabilitation – 70
In Anchorage, AHFC operates:
506 Public Housing Program units, of which 120 serve elderly/disabled populations exclusively;
137 Section 8 New Multifamily Housing Program units, of which 120 serve elderly/disabled populations exclusively;
48 affordable housing units which accept individuals with vouchers;
70 Section 8 Moderate Rehabilitation Program single‐room occupancy units serving individuals who

Consolidated Plan ANCHORAGE 211
OMB Control No: 2506‐0117 (exp. 07/31/2015)
qualify as homeless under the McKinney‐Vento Act;
2,344 Housing Choice Vouchers;
64 project‐based voucher units;
43 vouchers reserved for individuals with disabilities;
95 vouchers reserved for individuals displaced due to domestic violence;
20 vouchers reserved for referrals from Anchorage Community Mental Health Services; and,
155 vouchers reserved for referrals from the Alaska VA Healthcare System (VASH vouchers).
AHFC promotes self‐sufficiency and well‐being for people in Anchorage by providing:
After‐school programs for children and youth in public housing developments;
The Gateway Learning Center – a program that offers family self‐sufficiency and educational resources as well as youth educational activities;
The Family Self‐Sufficiency Program;
Heavy chore services to frail elderly or disabled families;
Meals on Wheels program at elderly and disabled buildings;
Educational scholarships;
Summer camp scholarships for children in the Housing Choice Voucher program and residing in Public Housing units;
Set‐aside vouchers for families under the following programs: Qualified Medical Waiver (20 vouchers), Veterans Affairs Supportive Housing (195 vouchers), Nonelderly Disabled (45 vouchers), Empowering Choice Housing Program (families displaced due to domestic violence, 214 vouchers);
A program targeted to youth aging out of foster care through a partnership with the State of Alaska Office of Children’s Services (50 coupons statewide);
A program targeting probationers/parolees through a partnership with the State of Alaska Department of Corrections (50 coupons statewide); and
A fair share allocation (96 vouchers reserved statewide) for people with disabilities.
Actions to encourage public housing residents to become more involved in management and participate in homeownership
AHFC encourages resident involvement and input on routine basis. The Resident Advisory board meets infrequently to discuss program or plan changes affecting both Public Housing residents and Housing Choice Voucher holders. The Public Housing Division frequently holds public hearings for resident and public input on a variety of policies and programs. Examples of recent community meetings include public outreach for comment on their Moving to Work plan and the Rent Reform Initiative in a number of localities, a survey to residents in our elderly facilities regarding smoking policies, and informational meetings to discuss new apartment developments, how residents are affected, and their rights as the process moves forward. Several of AHFC Public Housing and Multi‐Family communities have active Resident Councils across the state, and AHFC produces a newsletter that is available to residents several times per year.
If the PHA is designated as troubled, describe the manner in which financial assistance will be provided or other assistance
The PHA is not designated as troubled.

Consolidated Plan ANCHORAGE 212
OMB Control No: 2506‐0117 (exp. 07/31/2015)
Discussion
AHFC is the State of Alaska’s only Public Housing Authority. Their headquarters is located in Anchorage. AHFC partners with many of the non‐profits and agencies in Anchorage and provides funding for many programs/projects. AHFC was not able to provide funding sources and amounts for programs/projects in Anchorage.
AHFC will continue to provide affordable housing to extremely low‐, very low‐ and low‐income families, seniors and disabled individuals through the public housing program. It will also continue to provide a full service approach to property management and maintenance. General up‐keep and maintenance of property is important for curb appeal and resident satisfaction. Property management and maintenance staff conduct regular site inspections using standard checklists at least annually. Inspections results are used to create plans for capital improvements.

Consolidated Plan ANCHORAGE 213
OMB Control No: 2506‐0117 (exp. 07/31/2015)
AP‐65 Homeless and Other Special Needs Activities – 91.220(i)
Introduction
The Municipality has a goal to assist the homeless and provide assistance to those with special needs. Special needs groups are those groups with high priority needs including the elderly, the frail elderly, persons with HIV/AIDS and their families, persons with disabilities and individuals with alcohol and drug addictions. This goal includes providing decent housing by preserving the affordable housing stock, increasing the availability of affordable housing, reducing discriminatory barriers, increasing the supply of supportive housing for those with special needs, and transitioning homeless persons and families into housing. It is also a goal to increase self‐sufficiency and economic opportunity for the homeless and individuals with special needs so that they can achieve a reasonable standard of living.
Describe the jurisdictions one‐year goals and actions for reducing and ending homelessness including
Reaching out to homeless persons (especially unsheltered persons) and assessing their individual needs
The Municipality’s one‐year goals and actions for reducing and ending homelessness by reaching out to homeless persons (especially unsheltered persons) and assessing their individual needs include:
Rental Development program with CDBG and Home funds
Raspberry Road Project (may include the Rental Development program)
ESG activities
The details for the Rental Development program have not been worked out. The ESG one‐year goals and actions are:
The problem of homelessness in Anchorage is very severe and more funding is necessary to further address the needs of individuals and families who are homeless or near homeless. Through the continuum of care ESG will promote community‐wide commitment of ending homelessness.
ESG Rapid Re‐housing will provide financial assistance and services to individuals and families who are homeless or near homeless as quickly as possible into permanent housing. Case management, rent and utility assistance, rent and utility deposits will be provided. We are projecting that 175 people (including children) will be placed in stabilized settings as defined by 24 CFR576.2. Catholic Social Services is the primary contractor. They will use a network of providers to determine eligibility through a screening process. The applicants will contact AK211 phone hotline and social services homeless providers through the provider network. The assessment will determine the current living condition, income, and the ability to maintain housing options without assistance. Providers are required to report participant data and update client data into the AK‐HMIS (data‐collection system). Rapid re‐housing funds target families that are homeless and assist them to move quickly.
ESG Homeless Prevention will assist individuals and families who are homeless or near homelessness as defined by HUD with the Continuum of Care partners. Assistance under this activity will include rent and/or utility arrearages for families that have received eviction or utility shut off notices. Individuals or families may also receive security deposits or first month’s rental assistance. Individuals and families seeking assistance are also referred to other agencies and faith‐based organizations for coordinated assistance and/or continued services.
ESG Maintenance and Operation funds will be distributed through grant agreements through a competitive request for proposal (RFP), activities which fall under this category pay for operating costs of emergency and transitional shelters for homeless persons.
Addressing the emergency shelter and transitional housing needs of homeless persons
The Rental Development program may address emergency shelter and transitional housing needs of homeless persons. ESG funds annually are used to prevent homelessness or near homelessness, assist the homeless and the ESG program provides flexibility in determining the program structure based on HUD regulations. The primary focus is on the rapid re‐housing and homeless prevention services.
Consolidated Plan ANCHORAGE 214
OMB Control No: 2506‐0117 (exp. 07/31/2015)
ESG Rapid Re‐housing will provide financial assistance and services to individuals and families who are homeless or near homeless as quickly as possible into permanent housing. Case management, rent and utility assistance, rent and utility deposits will be provided. We are projecting that 175 people (including children) will be placed in stabilized settings as defined by 24 CFR576.2. Catholic Social Services is the primary contractor. They will use a network of providers to determine eligibility through a screening process. The applicants will contact AK211 phone hotline and social services homeless providers through the provider network. The assessment will determine the current living condition, income, and the ability to maintain housing options without assistance. Providers are required to report participant data and update client data into the AK‐HMIS (data‐collection system). Rapid re‐housing funds target families that are homeless and assist them to move quickly.
ESG will provide short‐term assistance to individuals and families until the ESG funding is exhausted. Individuals and families seeking assistance are also referred to other agencies and faith‐based organizations for coordinated assistance and/or continued services.
ESG Homeless Prevention will assist individuals and families who are homeless or near homelessness as defined by HUD. Assistance under this activity will include rent and/or utility arrearages for families that have received eviction or utility shut off notices. Individuals or families may also receive security deposits or first month’s rental assistance. Individuals and families seeking assistance are also referred to other agencies and faith‐based organizations for coordinated assistance and/or continued services.
Helping homeless persons (especially chronically homeless individuals and families, families with children, veterans and their families, and unaccompanied youth) make the transition to permanent housing and independent living, including shortening the period of time that individuals and families experience homelessness, facilitating access for homeless individuals and families to affordable housing units, and preventing individuals and families who were recently homeless from becoming homeless again
The Rental Development program may help homeless persons (especially chronically homeless individuals and families, families with children, veterans and their families, and unaccompanied youth) make the transition to permanent housing and independent living, including shortening the period of time that individuals and families experience homelessness, facilitating access for homeless individuals and families to affordable housing units, and preventing individuals and families who were recently homeless from becoming homeless again. The Rental Development program will include $150,000 of CDBG public service funding to include supportive services in the project(s).
ESG will provide short‐term assistance to individuals and families until the ESG funding is exhausted. Individuals and families seeking assistance are also referred to other agencies and faith‐based organizations for coordinated assistance and/or continued services.
Helping low‐income individuals and families avoid becoming homeless, especially extremely low‐income individuals and families and those who are: being discharged from publicly funded institutions and systems of care (such as health care facilities, mental health facilities, foster care and other youth facilities, and corrections programs and institutions); or, receiving assistance from public or private agencies that address housing, health, social services, employment, education, or youth needs
The Minor Repair program and the Mobile Home Repair program may help low‐income homeowners avoid becoming homeless by making needed repairs. If repairs are left undone, the homes could become in such a state that it is uninhabitable and the homeowner may not have the funds for other housing.
ESG will provide short‐term assistance to individuals and families until the ESG funding is exhausted. Individuals and families seeking assistance are also referred to other agencies and faith‐based organizations for coordinated assistance and/or continued services.
Discussion
Homeless and Other Special Needs is such a high priority that the Municipality has programmed most of the 2013 CDBG, HOME, and ESG funds to programs that will provide housing or housing with services to the homeless and/or persons with special needs or for affordable housing to help prevent homelessness.

Consolidated Plan ANCHORAGE 215
OMB Control No: 2506‐0117 (exp. 07/31/2015)
AP‐75 Barriers to affordable housing – 91.220(j)
Introduction:
The barriers to affordable housing in Anchorage are complex. The economy is stable, especially in comparison to the lower‐48 which has experienced serious housing crashes and foreclosures. However, in Anchorage there are increasing numbers of homeless individuals and families. An examination of the jurisdiction’s economy shows business factors which are strong and steady; however, there has been flat growth in leisure and hospitality (such as tourism), similarly with construction, both of which have been viable economic bases. The economic downfall in the lower‐48 has contributed to the downfall in tourism.
New hires in 2010 were primarily for retail and food and beverage; however, these positions tend to offer lowering paying wages. Construction was identified in third place for new hires in 2010; however, construction has been slow in comparison to earlier years. There has been a 59% increase in the median home value from 2010 to 2009, but the percent change for median household income is only 31% for almost the same period. The vacancy rate in Anchorage for 2012 is low for all rental units, showing: 0 bedrooms at 4.9, 1 bedroom at 1.7, 2 bedrooms at 2.4 and 3 bedrooms at 4.8. At the same time vacancy rates are dropping, median rent is rising on an average of 4%. There is a relatively young group of renters, aged 15 to 24% that account for 17% of renter occupied households; and those aged 25 to 34 years account for 29%. There are approximately 17,205 owner households who are paying more than 30% of their household income on housing; and 16,865 of renters who are paying 30% more than their household income on rent.
While the civilian population is experiencing the lack of affordable housing, our local military community is equally in need of housing. As of May 7, 2013 there were 424 households on the wait list. Of those on the wait list, the type of housing needed was: 43% for 2 bedrooms, 25% for 3 bedrooms, 18% for 5 bedrooms, and 14% for 4 bedrooms. At this time, these households are living off JBER in our local community until military housing is available.
The lack of available housing is driving up the median rent, the median income has not kept pace with housing values, our young population are likely in lower‐paying occupations that cannot afford the higher median rents required.
Although there are some builders looking at the prospects for building new housing, there are also barriers to this effort, such as suitable buildable land and the type of housing needed to accommodate Anchorage’s population. For example, the elderly and extra elderly, and the disabled populations were identified in the Needs Assessment Section of this Draft Consolidated Plan as being disproportionately represented for several types of housing problems.
The Municipality plans to establish planning discussions with other funding agencies to determine the rising numbers of homeless individuals seen in emergency shelters, as well as discuss options for housing to accommodate Anchorage’s youngest and older populations; both of whom are likely to be low‐income.
Actions it planned to remove or ameliorate the negative effects of public policies that serve as barriers to affordable housing such as land use controls, tax policies affecting land, zoning ordinances, building codes, fees and charges, growth limitations, and policies affecting the return on residential investment
Below are the specific actions to remove barriers to affordable housing.
In 2013, CSD recognizes that the Community Development Department is continuing to work on Title 21. Title 21 is a section of municipal code that regulates land use and development in order to protect and enhance the public health, safety, and general welfare, and to implement the comprehensive plan. The regulations address zoning, subdividing, and such development standards as parking, landscaping, lighting, drainage, open space, and stream setbacks. The title is organized into chapters, each addressing a different aspect of the regulations.
As part of the implementation of Anchorage 2020 – Anchorage Bowl Comprehensive Plan, the Community Development Department's Planning Division of the Municipality of Anchorage initiated a comprehensive rewrite of the land use code. The purpose of the code rewrite was to modernize Anchorage's land use regulations to include development techniques and design standards; to make the code more useable and easier to understand;

Consolidated Plan ANCHORAGE 216
OMB Control No: 2506‐0117 (exp. 07/31/2015)
and to implement recently adopted plans and policies. Most of the Chapters of Title 21have been provisionally adopted. More information on Title 21 and on the Title 21 Rewrite is available at: http://www.muni.org/Departments/OCPD/Planning/Projects/t21/Pages/Title21Rewrite.aspx.
Discussion:
CSD supports provisions for affordable housing which consider the following.
Maintain affordable housing inventory for low‐ and moderate‐ income households.
Consider housing and transportation needs of seniors and persons with disabilities.
Include a separate housing‐use type for permanent supportive‐housing.
Consider supportive‐housing models for vulnerable populations.
To remove barriers to affordable housing, the Municipality may undertake the following actions.
Coordinate with AHFC to increase the application of the Alaska Homeless Management Information Systems (AKHMIS) to Anchorage and Alaska provider agencies, and subsequently link persons and families in shelters to access affordable housing
Coordinate with partner agencies to support community efforts that link veterans to case management and housing services
Coordinate with community agencies to provide intensive case management services to families, including educational services regarding landlord/tenant information and job training, which increase a household’s ability to secure and maintain housing
Continue to work with the community to facilitate discussions on landlord/tenant challenges and develop strategies that will increase the housing stock for some homeless subpopulations, such as persons leaving jail and/or with a criminal justice offense
Continue to ensure that the concerns of low‐ and moderate income households are addressed in infrastructure investment projects
Coordinate with the Anchorage and Alaska Coalitions on Homelessness to seek strategies and actions that increase affordable housing
Work with community partners to link persons and families to mainstream support services, such as child care assistance, public assistance, Medicaid/Medicare, and veterans support services
Reduce homelessness by increasing the availability of affordable housing, so individuals and families can move off the streets and shelters into homes
CSD will continue to be responsive to other issues and policy opportunities that may elevate in 2013.

Consolidated Plan ANCHORAGE 217
OMB Control No: 2506‐0117 (exp. 07/31/2015)
AP‐85 Other Actions – 91.220(k)
Introduction:
The Municipality is using the 2013‐2017 Consolidated Plan to set the goals and objectives in this Action Plan. Actions are base on the Community Needs Survey and other needs based on facts and research. A Point‐In‐Time survey was conducted and the 2013 Housing Inventory Counts was prepared to document the unmet need for the Anchorage Continuum of Care.
Actions planned to address obstacles to meeting underserved needs
One of the main obstacles to meeting underserved community development needs is inadequate funding from the state and federal governments. Appropriations for the CDBG and HOME program have decreased, expected to decrease at least an additional 5% in 2013, leading to reduced support for local community development programs. CSD anticipates that funding will not significantly increase in the immediate future due to the continuing federal budget deficit. All actions in the 2013 Action Plan are to address obstacles to meeting underserved needs.
Actions planned to foster and maintain affordable housing
The MRP, AHP, & MHRP, & Rental Development programs are designed to foster and maintain affordable housing.
Actions planned to reduce lead‐based paint hazards
Based on housing age/occupant income data provided by HUD's CPD demographic data, 51,825 (50.02 percent) of the occupied housing units were built before 1979. Of these, 29,593 (47 %) are owner‐occupied and 22,232 (55 %) are rental units.
The MOA’s records for the MRP show a very low percentage of instances where LBP needed to be remediated in a project. During the time‐span from 2003 through 2012, the MRP assisted 319 homeowners. Out of those, 136 were constructed prior to 1978 and required testing for LBP. Of those 136 units tested, 12 were positive and required remediation, which constitutes 9%. No complex‐statistical analysis was performed; thus, no mathematically generated confidence factor was obtained. One could comfortably give a deviation 20% of the 9%, resulting in a +/‐ of 1.8% (9% ± 1.8% = 7.2%, 10.8%) Therefore, in the total population of houses constructed prior to 1978 (51,825), the number of homes with LBP may range from 3,731 to 5,597.
On March 7, 2008, the State of AK published Bulletin No. 7. The title of Bulletin No. 7 was Blood Lead Epidemiology and Surveillance, Non‐Occupational Exposures in Adults and Children – Alaska, 1995–2006. Alaska regulations require laboratories and health care providers to report all blood lead level (BLL) results ≥ 10 micrograms per deciliter (µ/dL) to the Section of Epidemiology. The Center for Disease Control (CDC) considers BLLs ≥ 10 µ/dL to be a health concern for children aged >6 (subsequent CDC announcements have renamed the “level of concern” to “reference value” and lowered the value to ≥5 µ/dL). The State received BLL reports on 1,141 children during the 10‐year period that were aged >6. Of them, 17 (1.5%) had elevated BLL that were ≥ 10 µ/dL. Sources of exposure included 6 (35%) foreign/adoptee from abroad, 2 (12%) playing with air gun pellets, 2 (12%) pica (eating non‐nutritive substances), and 7 (41%) unknown. The bulletin did not specify from where the children came. Included in the bulletin were similar reports for children aged 6‐17, and adults aged 18+. Significant sources included indoor firing ranges, accounting for 70 persons, which constituted 81% of the reported “levels of concern”. The 2nd highest source for all age groups was children born abroad or adopted (10%). People casting lead as a hobby constituted the 3rd highest source, amounting to 3.4%. Contamination through LBP didn’t make the list. Among children >6 years tested from 1997‐2001 (according to the CDC), the proportion who had elevated BLLs was lower in Alaska than in the United States (1.5% vs. 5.1% respectively).
LBP in Anchorage’s housing continues to be a rare occurrence. Nevertheless, all CDBG‐ and HOME‐funded programs dealing with rehabilitation of older homes include funds to address lead‐based paint according to Part 35 regulations.
CSD will continue to collaborate with State and local agencies, nonprofit groups, and the private sector to reduce housing‐related lead‐based paint hazards, especially for low‐income families and children. CSD has developed lead‐based paint Policies and Procedures in compliance with 24 CFR 35 (Lead‐Based Paint Poisoning Prevention in Certain Residential Structures) which are incorporated into all its programs. These include acquisition,

Consolidated Plan ANCHORAGE 218
OMB Control No: 2506‐0117 (exp. 07/31/2015)
rehabilitation, and rental‐assistance programs funded by CDBG and HOME. Where program‐specific policies impose funding caps per client or per unit, these caps may be waived when costs required address lead‐based paint testing, evaluations, assessments and mitigation cause the project to exceed program limits.
Actions planned to reduce the number of poverty‐level families
Below are the actions that will take place in 2013 that will reduce the number of poverty‐level families. CSD will help families move to economic self‐sufficiency. The affordable housing projects funded by CSD for low‐income renters and homeowners directly supports the anti‐poverty strategy. Homeownership also helps families build individual wealth by building home equity. In addition, many of the CDBG capital projects support facilities such childcare centers, substance abuse treatment centers, and other facilities that house services utilized by households living in poverty. Other issues identified as obstacles to fighting poverty include:
Lack of access to affordable, reliable and convenient childcare
Lack of job training
Lack of experience and skills
Lack of English proficiency
Illiteracy
Relying on infrequent public transportation to get to and from work
Finding appropriate supportive services
Anchorage’s anti‐poverty Strategy is to work in cooperation and coordination with local, state, and national agencies to increase referrals with the goal of helping families overcome barriers to access employment, childcare, public transportation and public services. ESG funding includes transportation assistance. The public service funding for 2013 will have a strong emphasis on implementing anti‐poverty strategies as it relates to services for the homeless population. In addition, the Municipality is actively working with United Way of Anchorage’s 2‐1‐1 centralized referral line to social services, as an important antipoverty strategy to ensue that people are correctly referred to community resources.
Actions planned to develop institutional structure
The DHHS is refining staff organization and strategies to create an institutional structure that can best implement the Consolidated Plan and Action Plan priorities. The Mayor’s designation of DHHS as the lead Municipal organization for homelessness, issues of chronic public inebriates, and prevention efforts highlight his desire to both streamline local bureaucracy and to provide an enhanced integrated‐response. Examples of this strategy are:
Services to pick up public inebriates were transferred from the Anchorage Fire Department to DHHS, resulting in coordination of direct services and strategies to serve this population;
The Mayor’s Homeless Leadership Team is staffed by DHHS;
Continuum of Care (CoC) – The Municipality is currently the CoC Collaborative Applicant. In 2013, DHHS will be working with the ACH to transition the Municipalities responsibilities as the Collaborative Applicant to the ACH. The ACH Board will be working with HUD TA to help the Anchorage CoC establish governance structure, capacity and policies and procedures.
The DHHS meets regularly with AHFC to coordinate on developing and supporting AKHMIS services to track the needs and services of the homeless in Anchorage and Balance of State;
The DHHS provides data for the AHFC’s Point In Time count of homeless; a critical tool to apply and qualify for the Continuum of Care Community Grant; and
DHHS staff provides data through AKHMIS for Project Homeless Connect Reports for Anchorage, Juneau, and the Mat‐Su.
As outlined in the examples above, DHHS will continue to adapt its structure and apply its resources in order to maintain and develop its capacity to support the priorities of the Consolidated Plan.

Consolidated Plan ANCHORAGE 219
OMB Control No: 2506‐0117 (exp. 07/31/2015)
Actions planned to enhance coordination between public and private housing and social service agencies
CSD plans to continue its ongoing efforts to further the goals and objectives of the Consolidated Plan by coordinating with public and private agencies. The HAND Commission’s members may collectively represent the real estate industry, the banking industry, non‐profit housing organizations, homebuilders, and residential shelter providers.
DHHS and CSD’s staff attends various community coalitions and community meetings on a regular basis. These and other coordinating bodies are listed below:
Mayor Sullivan’s Homeless Leadership Team
The Team was formed by Mayor Sullivan to look at recommendations and solutions, with an initial emphasis on the chronic homeless alcoholic population. Neighborhood Services led the continuum of housing subcommittee in 2010 for this Team.
Oversight Subcommittee of the Housing and Neighborhood Development (HAND) Commission
The HCOSH was formed in January 2005 to oversee and track implementation of the Municipality’s Ten Year Plan on Homelessness. CSD staff attends their monthly meetings. Per Municipal Ordinance, the Subcommittee provides guidance on issues related to homelessness in Anchorage.
Anchorage Coalition to End Homelessness (ACH)
The Coalition is an open group that comes together to address homelessness as a community and partners with the Municipality. In 2013, DHHS will be working with the ACH to transition the Municipalities responsibilities as the Collaborative Applicant to the ACH. The ACH Board will be working with HUD TA to help the Anchorage CoC establish governance structure, capacity and policies and procedures. The DHHS, Public Health Initiatives and Partnerships Division Manager, Britteny Matero, sits on the ACH Board. The ACH will coordinate the development of the 2013 CoC Exhibit 1 application of HUD funding.
Anchorage Caring and Emergency Social Service (ACESS)
This group attracts representatives from faith‐based organizations as well as social services. ACESS has been instrumental in reaching out and sharing information between social services, and churches and other faith‐based organizations. It has also helped spearhead an initiative to establish an active Love, Inc. affiliate in Anchorage.
Alaska Coalition on Housing and Homelessness
This group is the Statewide Coalition on housing and homelessness. DHHS attends these meetings and provides testimony on the needs of homeless persons and families in Anchorage.
Discussion:
The Municipality will continue to partner with non‐profits and other agencies to address the goals and objectives in the 2013 – 2017 Consolidated Plan.

Consolidated Plan ANCHORAGE 220
OMB Control No: 2506‐0117 (exp. 07/31/2015)
Program Specific Requirements
AP‐90 Program Specific Requirements – 91.220(l)(1,2,4)
Introduction:
The jurisdiction must describe activities planned with CDBG funds expected to be available during the year. All such activities are also included in the Projects section. Planed actions for 2013 and key points include:
Minor Repair Program ‐ Ongoing program that provides assistance for increased accessibility, energy efficiency or repairs to items presenting a threat to health or safety in owner‐occupied homes.
Anchorage Safety Center ‐ This project received 2012 and 2013 CDBG funds to renovate a public facility that houses people overnight that are incapacitated by alcohol and/or substance abuse in public places.
Child Development Center ‐ In 2012, the MOA assisted RurAL CAP in the purchase of the Child Development Center located at 545 East 5th Avenue. It was determined that parking for the facility was inadequate and 2013 CDBG funds will be used to purchase additional parking.
Mobile Home Repair Program ‐ A program to renovate owner‐occupied mobile home.
Rental Development ‐ This program shall be comprised of CDBG, HOME, and HOME CHDO funds. It is planned to provide 10 or more units of supportive housing for chronically homeless or other high‐priority populations.
Affordable Housing Program ‐ HOME funds will be used as the downpayment/closing‐cost loans for newly constructed homes by Habitat for Humanity.
CDBG Public Services ‐ CDBG funds will be used to fund 5 public service projects. Projects have not been selected.
ESG ‐ Homeless Prevention ‐ Engage in homeless prevention activities and essential services activities. ESG ‐ Rapid Re‐housing ‐ MOA CSD has contracted with Catholic Social Services to provide housing relocation and stabilization services. The Rapid Re‐housing component is available to individuals and families who are literally homeless.
ESG ‐ Emergency Housing Services ‐ Maintenance and Operations ‐ Support existing shelter services and the expansion of transitional housing services.
The Municipality had projected PI during 2012 from the sale of the John Thomas building which used CDBG funds from 1993 and 1995, the sale did not occur. All 2013 program income will be diverted to make‐up the program income shortfall. The sale is anticipated during late 2013 ‐ early 2014.
Community Development Block Grant Program (CDBG)
Reference 24 CFR 91.220(l)(1)
Projects planned with all CDBG funds expected to be available during the year are identified in the Projects Table. The following identifies program income that is available for use that is included in projects to be carried out.
1. The total amount of program income that will have been received before the start of the next program year and that has not yet been reprogrammed 0
2. The amount of proceeds from section 108 loan guarantees that will be used during the year to address the priority needs and specific objectives identified in the grantee's strategic plan. 0
3. The amount of surplus funds from urban renewal settlements 0
4. The amount of any grant funds returned to the line of credit for which the planned use has not been included in a prior statement or plan 0
5. The amount of income from float‐funded activities 0
Total Program Income: 0

Consolidated Plan ANCHORAGE 221
OMB Control No: 2506‐0117 (exp. 07/31/2015)
Other CDBG Requirements
1. The amount of urgent need activities 0
2. The estimated percentage of CDBG funds that will be used for activities that benefit persons of low and moderate income. Overall Benefit ‐ A consecutive period of one, two or three years may be used to determine that a minimum overall benefit of 70% of CDBG funds is used to benefit persons of low and moderate income. Specify the years covered that include this Annual Action Plan. 98.00%
HOME Investment Partnership Program (HOME)
Reference 24 CFR 91.220(l)(2)
1. A description of other forms of investment being used beyond those identified in Section 92.205 is as follows:
Section 92.205 is about housing and homeless needs. The HOME funds and other forms of investment related to the HOME program are all used for housing and homeless needs.
2. A description of the guidelines that will be used for resale or recapture of HOME funds when used for homebuyer activities as required in 92.254, is as follows:
If a homeownership project ceases to comply with the affordability requirements, the following guidelines shall be used.
Resale
In projects where HOME funds are used for acquisition and or rehabilitation by the developer with no down‐payment assistance, a Resale provision will be utilized in the form of restrictions included in a recorded Declaration of Covenants Conditions and Restrictions (DCCR) with the Deed of Trust (DOT) as the security instrument, or written directly into the DOT. The housing must remain the principal residence of the family for the duration of the affordability period. The affordability period shall have a minimum length of that which is required by regulations. A detailed description of actions under default resides in the DOT or the DCCR.
In the event the Borrower intends to sell the property during the affordability period, the housing must be available exclusively to low income families as stated in the applicable program policies. The property must be the principal residence as defined in the DOT.
The resale price shall provide the homeowner a fair return on investment to include the original investment and any capital improvements. The price shall also remain affordable to a reasonable range of low income homebuyers. These resale price assurances are delineated and guaranteed as provisions in the DOT or DCCR as applicable. The Municipality is not funding any programs that use these resale provisions.
Recapture
When down payment assistance or other loan assistance is provided, with or without a developer subsidy or purchase price reduction, the DOT and DOT Note will document restrictions needed to comply with HUD 24 CFR 92.254 (a)(5)(ii). The DOT default provisions may include (but are not limited to) payment schedules, superior encumbrances, occupancy requirements, use of property, and compliance with federal regulations and program policies.
The housing must continue to be the principal residence throughout the affordability period. Loan balances at the time of a default according to the DOT and Note shall be recaptured, including amortized loans and loans with other types of payment requirements.
In the event of recapture, the amount recaptured will be determined by either the Loan Balance Recapture method, or the Shared Net Proceeds method. The Action Plan must specify which of these methods will be used by each HOME funded program (see program descriptions in AP‐35 Programs for this specification).

Consolidated Plan ANCHORAGE 222
OMB Control No: 2506‐0117 (exp. 07/31/2015)
The Loan Balance Recapture method requires the borrower to repay the balance of the loan at the time of default or property sale, subject to the limitation set below. Typically, a portion of these loans are forgiven over the affordability period (see program descriptions for details).
The Shared Net Proceeds method determines the amount to be recaptured by the HOME program according to the formula stated in 24 CFR 92.245(a)(5)(ii)(A)(3), or homeowners may be allowed to recover their investment first, depending on the parameters of the program.
Limitation The Loan Balance Recapture and Shared Net Proceeds methods are subject to the limitation that when the recapture is triggered by a sale (voluntary or involuntary) of the housing unit, and there are no net proceeds or the net proceeds are insufficient to repay the HOME investment, only the net proceeds are required to be recaptured, if any. The net proceeds are the sales price minus superior loan repayment and any closing costs.
When HOME funds are used to assist homebuyers acquiring single family housing containing one or more units, the recapture provisions apply as above to both the unit used as the homebuyers primary residence and the assisted rental units. For the rental units, the affordability requirements of 24 CFR 92.252 will apply, except that the Municipality may terminate the affordability period upon the recapture of the HOME funds.
3. A description of the guidelines for resale or recapture that ensures the affordability of units acquired with HOME funds? See 24 CFR 92.254(a)(4) are as follows:
A description of the Municipality’s guidelines for resale or recapture that ensures the affordability of units acquired with HOME funds is the same as the description of the guidelines that will be used for resale or recapture of HOME funds when used for homebuyer activities. See description above.
4. Plans for using HOME funds to refinance existing debt secured by multifamily housing that is rehabilitated with HOME funds along with a description of the refinancing guidelines required that will be used under 24 CFR 92.206(b), are as follows:
There are no plans for refinancing existing debt with HOME funds.
Emergency Solutions Grant (ESG)
Reference 91.220(l)(4)
1. Include written standards for providing ESG assistance (may include as attachment)
See below.
2. If the Continuum of Care has established centralized or coordinated assessment system that meets HUD requirements, describe that centralized or coordinated assessment system.
The CoC has an e‐mail list serve that includes Community Councils, over seventy service providers, businesses, all Municipal Commissions, the Anchorage Coalition on the Prevention of Homelessness membership and faith‐based agencies. Special effort was placed and achieved in recruiting homeless and formerly homeless persons in the community.
Updates and input from the CoC will help to determine if limits on rental assistance should be increased or decreased based on community needs, outcomes, and available budget within the HUD guidelines. At such time that standards for client contribution are set by the continuum, the ESG funded agencies will incorporate these into overall procedures and policies. See above written procedures.
All ESG‐assisted households must meet the revised HUD definition for at risk for homeless and/or homeless.
To avoid duplication of ESG services, ESG sub‐grantees will be entering data into a shared HMIS system. ESG grantee/sub‐grantee will meet on a regularly scheduled basis to review program policies and procedures and staff potential homeless clients requiring additional assistance above and beyond above stated limits and HUD guidelines.

Consolidated Plan ANCHORAGE 223
OMB Control No: 2506‐0117 (exp. 07/31/2015)
It is expected that ESG grantee and sub‐grantees will actively coordinate with service providers including AK 2‐1‐1 and the Aging and Disability Resource Center to assure that individuals and families experiencing homelessness have the most up to date information and access to mainstream resources available to meet their needs and assist with housing stabilization. To the extent possible, ESG grantee and sub‐grantees will seek Memorandums of Understanding with key referral sources to assure seamless referral process for ESG clients.
For those clients identified as disabled or elderly, a referral will be made to the Aging and Disability Resource Center for options counseling regarding long‐term care support services available in the community to assist with stabilization of those services for the eligible clients.
ESG grantee and sub‐grantees are required to report program participant‐level data and update client information into AK‐HMIS. ESG grantees and sub‐grantees will participate in HMIS trainings and adhere to HMIS data entry expectations.
There are requirements for using a coordinated assessment system, as per 24 CFR 576.400(d)
3. Identify the process for making sub‐awards and describe how the ESG allocation available to private nonprofit organizations (including community and faith‐based organizations).
The MOA has a Citizen Participation Plan (CPC). CSD must develop and follow a Citizen Participation Plan to receive Federal funds for Community Development Block Grants (CDBG), HOME Investment Partnerships (HOME) and Emergency Solutions Grant (ESG) Programs. The citizen participation plan covers the 5‐year Consolidated Plan, each subsequent Annual Action Plan, each year’s Consolidated Annual Performance and Evaluation Reports and any amendments.
The CoC is always responsible for all of the activities set forth in the regulations even if it has delegated them to another entity (e.g. HMIS lead, CoC board, collaborative applicant). Coordinate the implementation of a housing and service system within its geographic area that meets the needs of the homeless individuals (including unaccompanied youth) and families, and all subpopulations. At a minimum, such system encompasses the following: outreach, engagement, and assessment, shelter, housing, and supportive services and prevention strategies. CoC will consult with ESG recipients on the plan for allocating ESG funds and reporting on and evaluating the performance of ESG recipients and subrecipients. Funding will be awarded through a Request for Grant Proposal (RFGP) or by a sole source award depending on financial feasibility and history of the organization. An evaluation committee will review and rank proposals and provide a recommendation of award based on a rank order list. Department of Health and Human Services distributes funding and initiates a Request for Rapid Re‐Housing and Homeless Prevention and Maintenance and Operations.
The CPC sets forth the policies and procedures for citizen participation in Anchorage's Consolidated Planning Process. CSD urges citizens to voice their concern and share their ideas concerning CDBG, HOME and ESG funds. At least two public hearings per year are held to obtain public comments on needs, strategies, actions, projects and performance. CSD provides reasonable opportunities for comment. CSD places notices by email, advertisement in newspapers, posting on the MOA DHHS Website, direct mailings, posting of notices on public counters, bulleting boards and community facilities for all people.
The preparation of the 2013 Action Plan begins with consultation from public agencies, CoC and the public. CSD sought first to identify potential needs, services gaps and key issues on which to focus the community outreach process. CSD conducted public presentations on the Consolidated Plan, Action Plan and Community Needs Survey. The Municipality encouraged community participation in the development of the 2013 Action Plan and the 2013 ‐ 2017 Consolidated Plan. CSD is responsible for coordinating the citizen participation process. Community meetings were advertized in the Anchorage Daily News, a paper of general circulation and posted on the CSD website. Notices were sent out to a large e‐mail list. Presentations were made for the HAND Commission and for the Anchorage Assembly. The results of the Community Needs Survey are included in the Consolidated Plan and were used to establish the needs of the community.

Consolidated Plan ANCHORAGE 224
OMB Control No: 2506‐0117 (exp. 07/31/2015)
4. If the jurisdiction is unable to meet the homeless participation requirement in 24 CFR 576.405(a), the jurisdiction must specify its plan for reaching out to and consulting with homeless or formerly homeless individuals in considering policies and funding decisions regarding facilities and services funded under ESG.
As per 24 CFR 576.405 (a): On Homeless participation unless the recipient is a State, the recipient must provide for the participation of not less than one homeless individual or formerly homeless individual on the board of directors or other equivalent policy‐making entity of the recipient, the extent that the entity considers and makes policies and decisions regarding any facilities, services, or other assistance that receive funding under the ESG.
The MOA has homeless and previously homeless individuals on the board or working with CoC subgrantees. The FY2013 CoC Project Review Panel (PRP) will have a similar composition of community representatives as the FY2013 Panel. Representation will include the AKHMIS, ACH, HAND Commission, the HCOSH and interested citizens. Under municipal ordinance, the HAND/HCOSH will oversee the Consolidated Plan and the Ten Year Plan, which is in compliance with the HEARTH Act.
Should the homeless or previously homeless representation resign from the board, the Municipality is developing a plan to consult with homeless or formerly homeless individuals with regard to policy‐making and decisions regarding any services, or other assistance that receive funding under the ESG. The plan would be included in the annual action plan required under 24 CFR 91.220.
The MOA to the maximum extent possible and practical will involve homeless individuals and families in constructing, renovating, maintaining and operating facilities assisted under ESG. This involvement will include employment or volunteer services as per 24 CFR 576.405 (c).
See Municipal Ordinance 2004‐180 at: http://www.muni.org/Departments/health/services/neighborhoods/Documents/AO2004‐180‐Ten_Year_Plan_on_Homelessness.pdf
5. Describe performance standards for evaluating ESG.
The new Emergency Solutions Grant (ESG) regulations released by HUD on November 15, 2011, defined the system coordination requirements that are new and expanded program responsibilities. The Municipality has initiated the performance standards for ESG as per 24 CFR 576.400.
The CoC area wide systems coordination requirements are:
The recipient must: consult with each CoC serving the region to determine the ESG allocations each year; develop performance standards for evaluating the outcomes of projects and activities funded by ESG; and develop funding policies and procedures for administering and operating the Homeless Management Information System (HMIS).
Recipients and subrecipients must coordinate and integrate ESG funded activities with other programs targeted to homeless people in the CoC's area or the area over which the services are coordinated to provide a strategic, community‐wide system to prevent and end homelessness.
Additionally, recipient/subrecipients must also coordinate and integrate ESG funded activities with mainstream housing and services that the homeless families and individuals and those at risk of homelessness might be eligible.
Centralized or coordinated assessment
CoC is refining a centralized/coordinated assessment system in accordance with HUD requirements, each ESG funded program or project must use that system. The recipient/subrecipient must work with the CoC to ensure screening, assessment, and referral of program participants are consistent with section's standards. The exception is that a victim service provider may choose not to use the CoC's system.

Consolidated Plan ANCHORAGE 225
OMB Control No: 2506‐0117 (exp. 07/31/2015)
Written standards for providing ESG assistance
If the recipient is a metropolitan city or urban county, there must be consistently applied written standards for providing ESG assistance. The recipient must describe these standards in its consolidated plan.
Participation in HMIS
All data on people served and assistance provided under ESG must be entered into the HMIS system or comparable database that meets HUD's standards. A comparable system may be used by a victim service or legal services provider to enter client‐level data (and this data is not entered into HMIS).
AP‐90 ESG Standards Page 1
AP‐90 ESG Standards Page 2
AP‐90 ESG Standards Page 3
AP‐90 ESG Standards Page 4
AP‐90 ESG Standards Page 5

Consolidated Plan ANCHORAGE 226
OMB Control No: 2506‐0117 (exp. 07/31/2015)
Discussion:
Homeless and Other Special Needs is such a high priority that the Municipality has programmed most of the 2013 CDBG, HOME, and ESG funds to programs that will provide housing or housing with services to the homeless and/or persons with special needs or for affordable housing to help prevent homelessness. CSD will continue to be responsive to other issues and policy opportunities that may elevate in 2013.

Attachments ES 05 Additional Information Pages 1‐5 ES 05 Tables ‐ Objectives and Strategies Pages 1‐3 ES 05 HAND Commission Public Comments Pages 1‐9 NA 05 Additional Information Pages 1‐7 Community Needs Survey Results Anchorage Vicinity Map Demographics 2010 U.S. Census by Tracts Pages 1‐2 Map NA 10.2 Anchorage Census Tracts Number of Households Additional Information Housing Needs Summary Pages 1‐6 Most Common Housing Problems Pages 1‐14 Cost Burden 0%‐30% of Area Median Income Disproportionate: = or > 34% for Owner and = or > 74% for Renter 30.1%‐50% of Area Median Income Disproportionate: = or > 35% for Owner and = or > 62% for Renter 50.1%‐80% of Area Median Income Disproportionate: = or > 34% for Owner and = or > 36%for Renter 80.1%‐100% of Area Median Income Disproportionate: = or > 24% for Owner and = or > than 12% for Rent NA 20 Table 1 0%‐30% NA 20 Table 2 30.1%‐50% NA 20 Table 3 50.1%‐80% NA 20 Table 4 80.1%‐95% NA 25 Tables 1 and 2 Housing Cost Burden NA 35 Table 1 Totals in Use NA 35 Table 5 Data Related to First Two Questions NA 35 Table 2 Characteristics of Residents by Program Type NA 35 Table 3 Race of Public Housing Residents by Program Type NA 35 Table 4 Ethnicity of Public Housing Residents by Program Type NA 40 Table 1 Homeless Needs Assessment HUD Definitions for NA 40 Table 1 Pages 1‐2 NA 40 Table 2 Number of Individuals in Emergency Shelters NA 40 Table 3 Veterans NA 40 Table 4 Race‐Ethnic Groups in Emergency Shelters or Transitional Housing NA 40 Table 5 Homeless Population in Emergency Shelters and Transitional Housing NA 40 Table 6 Homeless Population in Emergency Shelters and Transitional Housing Newly Released Prisoners and Homelessness Pages 1‐2 NA 50 Table 1 Top seven Public Facility needs in Anchorage NA 50 Table 2 Top three Public Improvement needs in Anchorage NA 50 Tables 3 ‐ 5 Public Service Needs NA 50 Overview Pages 1‐2 Housing Needed by Affordability All residential properties by number of units MA 10 Table 1 Total Housing Units MA 10 Table 2 Anchorage Housing Units Occupied MA 10 Table 3 Vacant Housing Units MA 10 Table 4 Renter occupied householder by age MA 10 Table 5 Owner occupied householder by age MA 10 Table 10 Anchorage 2011‐2012 Apartment Rental Costs and Vacancy Rates MA 10 Table 11 Anchorage 2011‐2012 Single Family Residence Rental Costs and Vacancy Rates MA 10 Table 12 JBER Wait List by Grade, # of Bedrooms Needed, and Earliest Wait List Dates
MA 10 Table 6 Unit Size by Tenure MA 15 Table 1 Median Home Value and Median Contract Rent Cost MA 15 Table 5 Rent Paid MA 15 Availability of Sufficient Housing MA 15 Additional Information Pages 1 ‐ 11 MA 15 Table 11 Renter Affordability (RHUD) MA 15 Table 15 Owner Affordability (VHUD) Table 12 Renter Affordability and Mismatch for Renters with a Higher AMI MA 15 Tables 21 and 22 MA 15 Table 6 Cost of Housing by Monthly Rent MA 25 Table 1 Totals Number of Units by Program Type MA 25 Tables 3 and 4 MA 30 Table 2 Household With and Without Public‐Assistance Income MA 30 Table 3 Facilities with Supportive Services Pages 1‐4 MA‐40 Barriers to Affordable Housing Page 1 ‐ 5 Anchorages Major Employment Sectors Pages 1 ‐ 9 MA 45 Tables 7 and 8 MA 45 Table 9 Business Activity Alaska Workforce Investment Board Pages 1 & 2 Workforce and Infrastructure Needs Pages 1 ‐ 5 MA 45 Table 18 Wages for Occupational Categories MA 45 Table 10 2010 Anchorage Workers by Industry MA 45 Anchorage School District MA 45 Table 13 Educational Attainment by Age MA 45 Table 15 Wages for Occupational Categories MA 50 Table 1 Anchorage Median Household Income Below 80% AMI by Census Tract MA 50 Table 2 Census Tracts above 80% Median Income and below Median Income $83,600 MA 50 Tables 3 to 7 Pages 1 ‐ 6 MA 50 Table 8 MA 50 Table 9 MA‐50 Map 1 Extremely Low Income Households with Substandard Living Conditions MA 50 Map 2 Low Income Housing Tax Credit SP 05 Strategic Plan Overview Pages 1 & 2 Anchorage Vicinity Map Demographics 2010 U.S. Census by Tracts Pages 1 & 2 MAP NA‐10.2. Anchorage Census Tracts SP‐55 Barriers to Affordable Housing Strategy to Remove or Ameliorate the Barriers to Affordable Housing Pages 1 ‐ 4 SP60 Table 1 Number of Homeless Individuals vs Available Emergency Shelter Beds SP 70 Jurisdiction poverty reducing goals, programs, and policies Pages 1 ‐3 AP‐90 ESG Standards Pages 1 ‐ 5

A. HAND Commission Members
The HAND Commission has nine members. The members consist of representatives from the following areas: persons with disabilities, real estate industry, banking industry, non‐profit housing, homebuilders, residential shelters and low‐income neighborhoods. The Commission is led by a chairperson and co‐chair. Commissioner's three year terms are appointed on a rotating basis, so that a third of the seats come up for appointment or reappointment yearly.
ES‐05 Table 1 Prior HAND Members
Name Appointment Term Expiration
Debbie Newgent November 17, 2009 January 14, 2012
Gabriel Layman November 17, 2009 October 14, 2012
Norman Elliott November 17, 2009 October 14, 2012
Jeremiah Stephen December 15, 2009 October 14, 2012
ES‐05Table 2 Current HAND Members
Name Appointment Term Expiration
Tamas Deak, Chair December 17, 2008 October 14, 2014
Andre Spinelli, Vice Chair October 14, 2008 October 14, 2014
Margaret Evans August 24, 1999 October 14, 2013
Karen Kassik‐Michelsohn October 14, 2010 October 14, 2013
Dewayne Harris October 14, 2011 October 14, 2014
Nikole Nelson December 18, 2012 October 14, 2015
Amanda Price December 18, 2012 October 14, 2015
Dean Williams December 18, 2012 October 14, 2015
Claire Waddoup December 18, 2012 October 14, 2015
B. HAND Commission’s Oversight Sub‐committee on Homelessness (HCOSH)
The HCOSH consists of two HAND Commission members and two members appointed by the Mayor and confirmed by the Assembly for a total of four members. The members of the HCOSH shall:
Include members representative of the homeless, non‐profit agencies, public safety, businesses, the school district, government officials, the faith community, neighborhoods, or charitable organizations;
Provide oversight to the development and implementation of the Ten‐Year Plan on Homelessness;
Provide guidance on issues related to homelessness in Anchorage to the HAND Commission;
Advise the Commission, the Mayor, and the Assembly on issues related to homelessness;
Report annually to the Commission, the Mayor, and the Assembly on the progress of the Ten‐Year Plan on Homelessness. The report shall be presented on or before June 1 of each year and shall include recommendations for (a) specific action to implement the plan and (b) an appropriation to carry out the plan in the following budget year.
C. HCOSH Members
ES‐05 Table 3 Prior HCOSH Members
Name Appointment Term Expiration Resigned
Catherine Stone February 28, 2012 February 28, 2015 September 14, 2012
Trevor Storrs February 28, 2012 February 28, 2015 August 9, 2012
ES‐05 Table 4 Current Members
Name Appointment Term Expiration
John Pendrey February 28, 2012 February 28, 2015
Elaine Hollier* December 18, 2012 October 14, 2015
Dewayne Harris February 28, 2012 October 14, 2014

Amanda Price December 18, 2012 October 14, 2015
Nikole Nelson** December 18, 2012 October 14, 2015
* Elaine Hollier, on behalf of Catherine Stone, with Alaska Housing Finance Corporation, began attending HCOSH meetings in October 2012 and was appointed by the Municipal Assembly December 2012.
** Nikole Nelson will attend meetings based on emergent issues and need for additional HAND Commissioner Support.
More information on the HAND Commission and the HCOSH can be found on the Municipal website:
http://www.muni.org/Departments/health/services/neighborhoods/Pages/HAND.aspx.
D. Public Participation in the Consolidated Plan
CSD staff coordinated with HAND and HCOSH members to provide opportunities for Anchorage citizens to participate in the development of the 2013‐2017 Consolidated Plan. There was targeted outreach to the following populations:
Low‐ and moderate‐ income persons;
Residents of slum and blighted areas, predominantly low‐ and moderate‐income neighborhoods, and neighborhoods and areas where CDBG funds are proposed to be used;
Minorities;
Non‐English speaking persons;
Persons with disabilities;
Public housing residents and other low‐income residents of targeted revitalization areas in which public housing developments are located; and,
Local and regional institutions, businesses, developers, nonprofit organizations, philanthropic organizations, and community‐based and faith‐based organizations.
CSD staff, the HAND Commission, and the HCOSH provided draft sections of the new Plan and set out a schedule for public hearings. Email invites were made to ensure participation and input at a minimum by the:
Members of the Mayor’s Kitchen Cabinet on Homelessness;
Anchorage Coalition to End Homelessness;
Alaska Council on Homelessness;
Alaska Coalition on Housing and Homelessness;
Domestic Violence, Sexual Assault, and Child Abuse Caucus;
Domestic Violence Fatality Review Advisory Team;
Health and Human Services Commission;
Americans with Disabilities Act Advisory Commission;
Military and Veterans Affairs Commission;
Anchorage Women’s Commission;
Anchorage Community Diversity Advisory Commission;
Public Safety Advisory Commission;
Catholic Social Services’ Beyond Shelter Steering Committee;
Faith‐based Groups; and,
Anchorage’s Community Councils.

E. Data Sources
There are three primary data sources in the Needs Assessment Section: Comprehensive Housing Affordability Strategy (CHAS) data; Alaska Homeless Management Information Systems (AKHMIS), and the 2010 U.S. Census.
Local data was also used for the Needs Assessment Section and sources include:
Abused Women’s Aid in Crisis, Inc.
Alaskan AIDS Assistance Association, Anchorage, Alaska
Alaska Housing Finance Corporation
Anchorage Housing Market Analysis
Anchorage Police Department
Anchorage School District, Child In Transition/Homeless Project
Catholic Social Services
Municipal Prosecutor’s Office
Municipal Department of Health and Human Services, Community Safety and Development Program, Anchorage Domestic Violence Prevention Project
Municipal Department of Health and Human Services, Alaska Homeless Management Information System
Standing Together Against Rape, Inc (STAR)
State of Alaska, Department of Corrections, Alaska Prisoner Reentry Task Force, publication March 2011
State of Alaska, Alaska Commission on Aging
State of Alaska, Alaska State Plan for Senior Services, FY2012‐FY2015
State of Alaska, Department of Health and Human Services, Healthy Alaskans, 2010, Volume 1, 25‐4
State of Alaska, Department of Workforce and Labor Development
Federal Bureau of Investigation, Uniform Crime Report
Department of Veterans Affairs, Veterans Domiciliary, Anchorage, Alaska
The data tables using HUD’s 2006‐2008 CHAS data indicates the use of this data and the specific CHAS table from the data bank. The AKHMIS data source indicates the year representing the data, the report, and the type of query implemented. AKHMIS is the primary data source for NA 40, Homeless Needs Assessment Table. The 2010 Census used the following definitions of race.
F. Definition of Race Categories Used in the 2010 Census
White refers to a person having origins in any of the original peoples of Europe, the Middle East, or North Africa. It includes people who indicated their race(s) as White or reported entries such as Irish, German, Italian, Lebanese, Arab, Moroccan, or Caucasian.
Black or African American refers to a person having origins in any of the Black racial groups of Africa. It includes people who indicated their race(s) as Black, African American, or Negro or reported entries such as African American, Kenyan, Nigerian, or Haitian.
American Indian or Alaska Native refers to a person having origins in any of the original peoples of North and South America (including Central America) and who maintains tribal affiliation or community attachment. This category includes people who indicated their race(s) as American Indian or Alaska Native or reported their enrolled or principal tribe, such as Navajo, Blackfeet, Inupiat, Yup’ik, or Central American Indian groups or South American Indian groups.
Asian refers to a person having origins in any of the original peoples of the Far East, Southeast Asia, or the Indian subcontinent, including, for example, Cambodia, China, India, Japan, Korea, Malaysia, Pakistan, the Philippine Islands, Thailand, and Vietnam. It
includes people who indicated their race(s) as Asian or reported entries such as Asian Indian, Chinese, Filipino, Korean, Japanese, Vietnamese, and Other Asian or provided other detailed Asian responses.
Hispanic or Latino refers to a person of Cuban, Mexican, Puerto Rican, South or Central American, or other Spanish culture or origin regardless of race.
Native Hawaiian or Other Pacific Islander refers to a person having origins in any of the original peoples of Hawaii, Guam, Samoa, or other Pacific Islands. It includes people who indicated their race(s) as Pacific Islander or reported entries such as Native Hawaiian, Guamanian or Chamorro, Samoan, and Other Pacific Islander or provided other detailed Pacific Islander responses.
Some Other Race includes all other responses not included in the White, Black or African American, American Indian or Alaska Native, Asian, and Native Hawaiian or Other Pacific Islander race categories described above. Census respondents reporting entries such as multiracial, mixed, interracial, or a Hispanic or Latino group (for example, Mexican, Puerto Rican, Cuban, or Spanish) in response to the race question are included in this category.
G. Methodology
There are some tables which contain a “0” in columns, and both CSD staff and HCOSH members noted the lack of data affected the analysis. Therefore, tables with “0” display a “margin of error” that may distort the data findings. Statistically, the margin of error is a way to measure the sampling error in the results of a statistical survey. Margins of error occur when a population is incompletely sampled. Zeros indicate a sampling error that should be taken into consideration when reviewing the results of the table. In areas where there is a “0”, CSD staff and the HAND Commission and HCOSH conducted additional research.
HUD provided the formula to determine disproportionate based on the given data. Disproportionately greater means when a group is represented at any of the levels (Area Median Income, Housing Problems, Severe Housing Problems) by 10% greater than the whole (or All) population under analysis. The disproportionate rate can be found at the top of each table in the Anchorage’s tables, or the disproportionate rate is described in the narrative.
To determine disproportionate percentages, HUD offers the following example for computation.

ES‐05 Table 5 Example Only for NA 15 – Disproportionately Greater Needs: Housing Problems
0‐30% of Area Median Income
Racial/Ethnic Group Has One or More of Four Housing
Problems
Has None of the Four Housing Problems
Has No/Negative Income, but None of the Four Housing Problems
Jurisdiction as a whole 120,295 26,380 13,540
White 37,405 7,590 4,265
Black/African American 59,560 14,235 6,840
Asian 5,115 920 1,155
Native American, Alaska Native
240 75 25
Pacific Islander 20 55 0
Hispanic 16,255 3,085 1,130
Jurisdiction as a whole 120,295/(120,295+26,380+13,540)= 75.08%
White 37,405/(37,405+7,590+4,265)= 75.93%

The “AP‐35 Projects” section of the 2013 Action Plan, details respective objectives and outcomes for each of the activities proposed. The following tables provide objectives, strategies, and proposed projects in 2013. It also lays out the performance measures to gauge program status and effectiveness.
ES‐05 Table 6 Housing Objectives and Strategies
Activities
Outcomes: 1. ‐ Availability/Accessibility 2. ‐ Affordability 3. ‐ Sustainability
Objectives DH ‐ Decent Housing SL ‐ Suitable Living Environment EO ‐ Economic Opportunity
Strategies 2013
Funding Goals
CHDO Rental Development 1. Expand affordable rental housing opportunities for low and extremely‐low income households, with emphasis on special needs and homeless.
DH Fund new construction or rehabilitation of rental housing.
$858,250(includes projected income of
$54,724 on HOME)
10 Units
Minor Repair Program 2. Preserve affordable homeownership housing opportunities.
DH Provide housing rehabilitation, emergency repair and accessibility funding and reduce household energy costs.
$415,000 18 Units
Affordable Housing Program
2. Expand homeownership opportunities, particularly for low‐ to moderate‐ income households
DH Provide down payment assistance to low‐income households
$15,000 8 Units
Mobile Home Repair Program
2. Preserve affordable homeownership housing opportunities.
DH Provide housing rehabilitation, emergency repair and accessibility funding and reduce household energy costs.
$215,000 8 Units

ES‐05 Table 7 Homeless Objectives and Strategies
Activities
Outcomes: 1. ‐ Availability/Accessibility 2. ‐ Affordability 3. ‐ Sustainability
Objectives DH ‐ Decent Housing SL ‐ Suitable Living Environment EO ‐ Economic Opportunity
Strategies 2013
Funding Goals
ESG13 Anchorage ‐ Homeless Prevention
1. Engage in homeless prevention activities and essential services activities.
SL Essential services $26,232 50 Households
ESG13 Anchorage ‐ Rapid Re‐housing Catholic Social Services
1. Engage in homelessness prevention activities; housing relocation and stabilization services.
SL Homelessness prevention, housing relocation and stabilization services
$63,084 175 People
ESG13 Anchorage ‐ Maintenance and Operations
1. Support existing shelter services and the expansion of transitional housing services
SL Sustain the number of emergency housing services.
$26,232 5 Orgs

Housing and Neighborhood Development (HAND) Commission
The purpose of the HAND Commission is to advise the Mayor and the Assembly on issues related to short‐ and long‐term housing community development needs and strategies to affect lower‐income neighborhoods. HAND Commission responsibilities include:
Reviewing and making recommendations on proposed allocation of all federal, state, and municipal revenues targeted for housing and community development programs managed by the Municipality;
Identifying and addressing issues in Anchorage related to long‐ and short‐term housing issues;
Advising the mayor and assembly on policies, practices, and legislation that impacts housing and community development issues;
Prioritizing, in an Annual Action Plan, strategies to assist revitalization of lower‐income and at‐risk neighborhoods;
Providing advice to the Planning and Zoning Commission about relevant housing and community development issues and their connection with land use controls;
Participating in the development and implementation of the Comprehensive Plan and Consolidated Plan;
Presenting recommendations to the mayor and assembly on the infrastructure, facilities, transportation and public services needs of lower‐income and at‐risk neighborhoods; and,
Facilitating public participation in housing and neighborhood revitalization policies, plans, strategies and programs.

ES‐05‐Table 8 Community Development Objectives and Strategies
Activities
Outcomes: 1. ‐ Availability/Accessibility 2. ‐ Affordability 3. ‐ Sustainability
Objectives DH ‐ Decent Housing SL ‐ Suitable Living Environment EO ‐ Economic Opportunity
Strategies 2013
Funding Goals
Municipal Safety Center Rehabilitation
1. Promote livable neighborhoods and community redevelopment.
SL Public facilities to meet neighborhood needs.
$76,250 1 Facility
Child Development Center, Rural Cap
1. Promote livable neighborhoods and community redevelopment.
SL Public facilities to meet neighborhood needs.
$175,000 1 Facility
Community Public Services, RFP/Application
1. Promote livable neighborhoods and community redevelopment.
SL Public facilities to meet neighborhood needs.
$265,859 4‐5 Projects
ES‐05‐Table 9 ‐ Non‐Homeless Special Needs Objectives and Strategies
Activities
Outcomes: 1. ‐ Availability/Accessibility 2. ‐ Affordability 3. ‐ Sustainability
Objectives DH ‐ Decent Housing SL ‐ Suitable Living Environment EO ‐ Economic Opportunity
Strategies 2013
Funding Goals
NA

N. Public Comments
Public Hearing ‐ June 05, 2013
Assembly Conference Room, 1st Floor, Room 155 at City Hall 632 West 6th Avenue
Presentation on Consolidated Plan 2013 ‐ 2017
Ms Longoria gave a PowerPoint presentation on the 2013 – 2017 Consolidated Plan, explaining the Needs Assessment and the Market Analysis which can be found on the following web site.
http://www.muni.org/Departments/health/services/neighborhoods/Documents/2013‐2017ConPlanPresentation.pdf
Open for Public Hearing on the Consolidated Plan, 2013 – 2017. Chairman Deak reminded the speakers of the five minute and three minute rule.
Gabe Layman and Tyler Robinson with Cook Inlet Housing Authority (CIHA), Mr. Layman ‐ Thank you all very much for the opportunity to be here today to comment on the Consolidated Plan. As a means of introduction, I am General Counsel and Government Liaison for Cook Inlet Housing Authority. Tyler is our Development Finance Manager; Tyler also has a Planning background and was employed by the Municipality. He has a very good background in the Consolidated Plan and will share our perspective in a little more detail later.
CIHA is the regional housing authority for South Central Alaska. It is also the tribally designated housing entity for Cook Inlet Region, Inc. CIHA administers programs that are funded by a variety of sources, not just Native funding sources but tax credits, a whole smorgasbord and administers them on behalf of not just Alaska Natives, but people of all races and ethnicities throughout the MatSu, Anchorage, and the Kenai Peninsula. We very much appreciate the investment that staff has made in putting together the Draft Consolidated Plan; it’s certainly no easy process. We do have some initial comments after our preliminary review, by providing some, I guess, framing for that we are also going to follow up with some more detailed written comments later on. So with that I will be happy to turn this over to Tyler, who is going to review our specific comments on the Consolidated Plan.
Tyler Robinson, Cook Inlet Housing Authority – Mr. Chair and members of the HAND Commission, and staff; I think I will start with the point that was most important to us and I have several. We will get to them if we can, if not we will follow up in writing. But the first one really, is there’s a couple opportunities in the Consolidated Plan to designate specific geographic areas in the municipality for additional revitalization efforts. The plan does not do so, it makes a statement that no area is sort of worse off than others and we just sort of make the point that I don’t believe that the data shows that.
I think there are parts of town that whether due to the census data or whether due to the land that’s there, the zoning that’s there, the opportunity for housing or public services; there are places that I think are in need and would benefit from being targeted or called out in the plan. I’ll give you some specific examples also of how this potentially helps projects in Anchorage happen.
When you apply for funding through Alaska Housing Finance Corporation they give you bonus points if you propose projects that’s both in a qualified census tract, which again is a HUD designated area as having a significant amount of poverty. But also is an area that’s identified in a municipally adopted plan, and so if those areas are not identified on the plan even though you’re proposing a project in a high need area you’re not getting credit for that, and the issue there is, we compete for projects. We and other developers compete for projects around the state and I think it would simply behoove the municipality to take a close
look at some of those geographic areas and list them in this document as areas that would benefit from specific revitalization efforts.
We have the qualified census tracts that call out Fairview, Mountain View and parts of Mid‐town. There’s other agencies; the New Market Tax Credit area looks at other areas; Russian Jack, Muldoon and Spenard. I had a meeting just the other day with someone from the EPA for Brownfield funding and they said well if you’re looking at a project in this area, is it identified on a municipally adopted plan as a sort of target area. I have to look through other plans and in some other plans it is, but again I would say that it really helps us align and leverage additional resources if we capture those areas up front. Again, I would also say that in addition to just funding opportunities these areas are also the ones we know generally are well served by transit, and they also have some of the oldest housing stock in town and multi‐families. So you’re addressing all the things that you’re already calling out in the Consolidated Plan but calling attention to specific geographic areas and we can provide those areas for you in writing as well as these maps. In addition to that I would just add on I appreciate seeing the Mayor’s Kitchen Cabinet recommendations being carried forward here. I would simply say that I think you captured the kind of immediate four points that the Cabinet suggested as a five year document.
I think it would be well served taking a look at the entire list of recommendations, I think there were seven or ten; I have a copy of the report here. Might as well put them in here and consider them and I think the same thing goes for the Anchorage Housing Market Analysis. You point out quite right that the market analysis basically identifies a shortage of housing and in twenty years a shortage of units of something like seven thousand units in the municipality or in the Anchorage Bowl, a surplus in Eagle River, but especially when you’re looking at multi‐family and more affordable housing, that shortage is alarming. But the other thing that study points out is that there’s a feasibility gap between multi‐family projects of what you could actually build to help address that as it exists currently.
So you can’t be a developer without a significant amount of subsidy and build anything that’s going to address the shortage. That’s a problem I think. You know, the plan that I was encouraged to hear staff say that other efforts are helping to go through those lists of recommendations, but I would again maybe suggest that there’s an avenue to make sure you sort of capture some of the more salient recommendations as it relates to HUD, HOME and CDBG funding and sort of support those here. We have a real good track record in this city of putting things in plans and then just letting them go and not following up and making sure that we’re working on implementing them. Those are the big ones. I guess final point is, we get the need for very low income housing below 30% and that’s very clearly stated in the report and frankly it’s not a surprise that individuals that earn less than 30% of the median income pay more than 30% of their income on housing.
That said as an operator of rental housing, you have to understand that roughly the first five hundred dollars or so per month simply goes to keeping the lights on in a rental unit. Basically if you are recommending or committing to funding those types of projects, you also have to consider long term operating costs and I know that’s difficult to do with HOME and CDBG, but without that commitment you can’t make those projects feasible. So I think you need to look at the balance of who you’re trying to serve. Understanding that the very low income takes a whole lot of subsidy both on the capital side and operating per individual or per household. And that at times by sort of also serving people that are also struggling but maybe in that 50% – 80% range that, whose incomes can actually support a decent amount of operating as long as the unit is developed in the first place. You have to keep that in mind as our federal funds decline, those problems that depend on a lot of on‐going operating costs are going to struggle the most and I think we have to consider that up front. So I think with that I’ll piggy back what Gabe said, we have other comments and certainly will have other comments over the next couple of weeks, and we’ll be happy to provide those in writing. Thank You.
Chairman Deak – Let’s open it up for questions, this is a great opportunity to maybe ask for other ones so everybody can hear what other ideas there are so any questions for Tyler.
Commissioner Waddoup ‐ Is there is a down side to designating those areas you were talking about for revitalization?

Mr. Robinson ‐ I guess I will answer that in a couple of different ways. Number one, no one is suggesting that by identifying these areas you’re only going to designate your efforts over the next five years to those areas. What it may do is actually help somebody to go after additional funds that are not part of the Municipalities annual Action Plan. Because without them being called out in this document, you don’t get past sort of the initial screening for a state, federal or frankly even a private foundation. That’s show me where the community need is for this project in this particular area.
I think what you may be getting at. Is there a down side to sort of clustering affordable housing in all ready areas that may be already poor? I don’t know if that’s part of where you’re going. What I would say to that is, what we’ve found in Mountain View and other places, is by building quality affordable housing. We’re actually raising the incomes of those neighborhoods. And then third I would say this is something that’s always very sensitive in the business community in particular. You call an area a revitalization area; are you creating a stigma with that area? We hear that a lot. I think there’s a way to do it in a way that’s positive. We’ve talked about reframing the Municipality’s deteriorating area designation to call it a redevelopment area designation so you try to take some of the positive; you know the negative stigma away and bring only the positive, which is infra‐structure development, new development that’s going to get rid of blighted properties. Those are the types of things that overall can have a positive affect on the areas that you’re not even going to be working on directly with these types of funds.
Mr. Layman – If I may piggy back onto that. I see this as a simple issue of bringing the most possible resources into the community; I see no practical affect of flipping around and say excluding certain communities from this list. It’s simply a matter of by including certain communities in this list, then, you may be opening other doors that aren’t funded through these traditional mechanisms but through low income housing tax credits or other things that are available on a state wide basis.
Chairman Deak – To speculate, this issue is based in economics and socioeconomics and maybe that’s one way to look at it because those are just numbers and no one should feel stigmatized if you show numbers. That’s one way to perhaps to do it without designating an area to be less advantageous to locate at than others.
Mr. Robinson – I use to sit where staff is sitting over there and produce these documents and I’d get call from real estate agents that would say, “Hey what does this mean that you’ve designated this area.” The reality is that they have access to the same information that we all do. We can all look at the census data and say, guess what. It’s really ultimately no secret that certain parts of town are more affluent than others. I think here we’re trying to sort of put a positive spin that really if we are going to continue to grow and redevelop as a community, as we talk about that lack of vacant land elsewhere; we need to focus on those areas. Those projects don’t pencil by themselves so we need to do everything we possibly can to sort of figure out how to turn them around.
Mr. Layman – And more critically Mr. Chair, there are some very new progressive efforts to educate the community at large about what neighborhood revitalization is; the role of affordable housing in the community. I think within the next one to two years you’re going to see some very coordinated community efforts in that regard. I think people are going to begin to realize that if you are in a community that everyone knows has economic challenges, challenges with housing stock, it’s a good thing to know that the community has been designated for additional investment and that’s exactly what this does; is it lets people know this is a community that the municipality has identified for additional investment.
Chairman Deak thanked Mr. Layman and Mr. Robinson for the presentation and noted that there wasn’t anyone else on the list and then closed the Public Hearing for the Consolidated Plan.
Presentation on 2013 Action Plan
Mr. Boehm gave a power point presentation on the 2013 Action Plan and its various programs which can be found at the following web site:
http://www.muni.org/Departments/health/services/neighborhoods/Docume nts/2013ActionPlanPresentation.pdf
Chairman Deak opened for Public Hearing on the 2013 Action Plan.
Brian Shelton‐Kelley Director of Community Development, NeighborWorks Anchorage – Thank you Mr. Chairman and members of the commission. Pardon my boots and my hands; we’ve been painting the town this week, so we’re in work mode. Just a few comments on the proposed 2013 Action Plan; first, we as a long time operator of the Minor Repair Program we appreciate the continued support of that program which assists approximately twenty homeowners per year with retaining and preserving their homes. In fact just today we were out painting the house of a recipient of those services; we were able to replace their roof. Without that kind of program this home owner probably would not have been able to stay in their home. So the continued support of the Home Repair Program we feel is critical, especially when we’re seeing a focus on substandard housing and needing to work on those issues.
We’re also intrigued by the Mobile Home Repair Program; perhaps a couple of comments on that program. We work with mobile homes in the course of our repair and rehab programs and we’ve encountered substantial issues in working with the mobile or manufactured homes. Often it’s next to impossible to fully know the scope of work until you start getting into the building. Getting into the structure, costs can increase drastically. There’s a lot of liability for the provider or the contractor working on those homes, and at times we’re putting more in repair or rehabilitation into the unit than the unit is worth. So as the community ends the Municipality creates this program that we just ask to keep some of those issues in mind and figure out how we can really as a community address some of these challenges and issues we have with some of our aging mobile and manufactured homes in the community.
At times I think we’ll find that repair is not enough and putting a new roof on or just doing minor repair to some of these units may not go far enough. There might need to be a more systematic or structural approach addressing these issues that we have there. At the same time, mobile homes, manufactured homes are some of the most affordable housing in Anchorage so we do have to figure out a way to retain and preserve those units. So we’re intrigued by this program, we’re looking forward to learning more about it. If it looks like something that’s doable we would, you know be a likely or potential applicant or any kind of RFP or process.
We are also obviously interested in the Rental Housing Development funds that are being programmed in this Action Plan, and this kind of echoes the earlier comments made on the Consolidated Plan. Though when we’re talking about developing housing for special needs populations or very low income populations, development subsidy isn’t in of itself is not sufficient; we really have to talk about the long term operational, rental subsidies.
We can subsidize the capital development side as much as we want but we still have to keep the lights on, we still have to pay the insurance, we still have to pay for maintenance and upkeep and when we’re targeting or talking about populations with very limited means and only looking at 30% of their income towards rent that becomes a very, very hard equation to break. So without long term operational rental subsidies I think it’s going to be very challenging for this community to produce any kind of housing that’s feasible and sustainable in the long run. And that wraps it up.
Chairman Deak thanked Mr. Shelton‐Kelley and asked opened up for questions.
Commissioner Spinelli – When you mentioned putting more money into a mobile home than what it’s actually worth, do you know what a mobile home is worth?
Mr. Shelton‐Kelley – Why would you want to comment on that?
I’m actually the supervisor that administers the Minor Repair Grant,
Chairman Deak – Name please.
I’m Barbara Worley, Supervisor of the Minor Repair Grant, NeighborWorks, Anchorage – When we are currently doing the Minor Repair grants on mobile homes, we’re limited to roofs, and furnaces, and hot water heaters at this current time. In the past when we were doing minor repair on mobile homes we were looking at doing bathrooms, flooring, windows, a variety, you know, whatever’s wrong with the mobile home. When

you walk into those mobile homes in many, many cases you find that the floors are so rotten that you’re afraid to walk on the floor for fear that you’re going to fall through; and the roof is leaking and the bathroom, the fixtures in the bathroom are barely working and so you have more than a $15,000.00 repair and a mobile home that’s barely inhabitable certainly can’t be worth much more than $15,000.00. So if you’re putting twenty or thirty thousand dollars of repair into something; and no we don’t know what the actual value of, average value, but when you walk into these mobile homes where folks have applied you can figure that, uh.
Commissioner Spinelli – O.K., next question, when you say that mobile homes are some of the most affordable housing; do we know how much a mobile home rents for?
Ms Worley – Some of the homeowners that apply for the Minor Repair Program, they already own the mobile home and they are just paying the lot rent and so their lot rent is typically up to, upwards of five hundred – six hundred dollars a month. Some of them own them free and clear, others are maybe making a five hundred dollar, or four hundred dollar a month mortgage payment or a excuse me, an escrow payment on that mobile home so they still, and it’s a housing choice where we find that folks in the mobile home, they own their home and they have a little yard space, they are not stacked in an apartment style living and so they feel like they have this sense of ownership and that sense of freedom.
Chairman Deak – This is a Public Comment on the Action Plan itself, but you were very kind not to target any specific numbers or areas for approval or disapproval or anything in between. So, does NeighborWorks then support the Mobile Home Repair Program in general or does NeighborWorks support it because it may be a recipient of funds which then allows you to do work with them.
Ms Worley – I think we would like to see the structure of the program and what the program looks like before we can really say that we support it.
Mr. Shelton‐Kelley – I think we would say that we do support efforts to address the housing quality conditions targeted to that style of housing.
Chairman Deak – Thank you, and any comments on the actual targets for allocations. The response was a no. Thank you, any other questions?
We have Kenny Petersen.
Kenny Petersen, Interested citizen and newly a member of the Anchorage Coalition on Homelessness Board – I had a question about the Action Plan that kind of stems from some comments that I made last month which was, my understanding the Action Plan, it’s amazing all this work, thirty days ago I don’t think we had any of this and all of a sudden it just came together, which is fantastic for this and the Consolidated Plan. If I understand what the Action Plan is supposed to be is that it’s the plan of how we’re going to address two different elements, one is housing the other is services for homeless and if so; I was under the impression that the Ten Year Plan then would be incorporated in this, I was wondering if this is the document where the Ten Year Plan and all that is involved in if you know.
Ms Longoria – No, these two plans are very specific and follow HUD guidelines. The Ten Year Plan is going to be our community plan and it will incorporate what we have for the Con and Action Plans and the Continuum of Care.
Mr. Petersen – So the Action Plan is not yet, so there’s another plan that comes after this called the Community Plan.
Ms Longoria – Our staff will work on the Ten Year Plan after these [Con and Action] Plans are accepted by the Assembly.
Mr. Petersen – The other question that I had is that I didn’t see, one of the highest things we saw on the list was the Chronic Homeless and this has a lot of the items but this looks particularly, if this is the city plan, it seems like it’s just addressing only HUD money. I was at a meeting two, a week or two ago a semi annual Alaska Council on Homelessness, the governments coalition, and after the afternoon meeting I said what can we do as a community member and they said, well we have some extra money so if you can come up with some ideas how to spend the two million extra dollars we have; that’s what you can do and so, they were

almost just asking for recommendations on where to put the rest of the money they have. So I thought that we would not just focus only on the ESG money and the HOME and CDBG money but there’s apparently some money, I don’t know where it was from, I don’t know if it was a SNUG or whatever acronym they use over there but they said there was some more money that’s available. So that was the question on that as well.
Chairman Deak – It’s one of those that generally everyone listens when they says extra money. Anyway, so Carrie is probably going to talk to you about this as we are certainly not aware of any other monies which is programmed for the Action Plan itself. It is about HUD what they have for us to allocate and that’s what the plan is about.
Mr. Boehm – The Action Plan includes all the funding from the Municipality. We send out requests to all different agencies that we’re aware of. And the Action Plan actually includes other agencies that are willing to submit information on what their plans and funding sources are for 2013 and they are included in the Action Plan.
Mr. Petersen – So then I guess that addition of two million that the Coalition I mean, not the Coalition, the Council of Alaska said that they had as extra funding, so we might be able to see about tapping into that somehow as part of the Action Plan. Then if it’s community money that’s available for it. That was what the head of the HFC that’s the Chair of it asked what we could do as a community, he says we’ll figure out how to spend this money, so it might hit towards some of the goals that we might be involved with. It’s not just HFC, he just happens to be the Chair and he’s from HFC, so it’s the Governors Alaska Council on Homelessness, so you can look at the minutes of that meeting to find out.
Chairman Deak – So that’s why I think what they’re going to do is request that you follow up, O.K., any other comment.
Mr. Petersen – The other question is with this as an Action Plan again, it’s just HUD money, I was wondering where city money comes into this; if we match with that, if it comes out of the taxes for it, why we’re only dependent on federal money that’s just going to keep going lower and lower and how would a business or how would a community council, how would a native group, how would a faith based group, how would additional community monies be involved outside of the traditional kind of things?
So I’m just interested, is this a plan and obviously it’s in the public and obviously this meeting is here but has anyone gone to business groups and to those kind of things? It’s not a traditional source but if it’s a good vision and I don’t know if the vision is in here but say I’m wondering if the visions is in there, if it’s good that it can be presented to those groups and if there’s an outreach effort and to say “hey you guys look, we can solve” for example. I’m interested in Chronic Street Corner Homeless and those in the shelters, and those that have sort of graduated for a time to Housing First, and if there’s a message around that says hey you guys if you want to solve this one here’s a good vision, why don’t you bring some money to it because we need such a thing.
And so I think that the Action Plan is just a spending plan of federal money which is a diminutive thing so this book should get smaller and smaller over time. But if the vision is good enough that I think that we can solicit additional money and maybe I’m just naïve about that but at least it’s worth a try to put a good vision out there if this is the vision I hope that we present it and one, how will we measure it? What will success look as a result of this, what are the three or four things that based on the Needs Assessment, the Handicap Services being the highest one, Chronic Homeless; two hundred ten people voted for it. What is the one measurement in each of those areas that we’re going to make a difference? Are we going to count every 30, 90 days how many people on the street corners, are we going to count how many people actually get out of the shelter program are we going to count how many people in Housing First that get self reliant? And so I’m interested in and actual number that we’re going to measure as a result of the Action Plan so that we can actually see 90 days from now, did we make a difference?
Chairman Deak – How do we address this one, this is bigger issue on the whole vision and it all comes together. Yes we have been for years we have been somewhat limited in our scope sometimes to the frustration sometimes they were just accepting it as the nature of the business but certainly it is something we need to have discussions on. Carrie, what are your thoughts?

Ms Longoria – Two thoughts, we do have a lot of information in there like Alaska Housing Finance Corporation about what they’re contributing for projects in 2013, which is what you’re asking for, a larger understanding of dollars going into these projects.
Number two, I think it would be great for every three months for each one of the projects that are funded to come back to the HAND Commission and give a report. How many people are served and how is it going. Which is what you’re asking, what’s our measureable outcome, what’s happening with the dollars and at that time we can also identify if that particular project which often does have other partnership dollars coming in, we can identify who those other partners are and how much money is coming in.
Mr. Petersen – To consolidate this down to a few sentences. Here’s our five measurable things these are the, put them by categories and say, these ones are going to do this, because to say that we’re going to fix so many roofs in trailers that’s good but how many will we do and is that uh but I didn’t see trailer fixing as the number one item on here.
Chairman Deak – No, it’s not, it’s one of the many.
Mr. Petersen – I was just thinking, that if this is the driving force, the Needs Assessment, then I’m interested in the number one Public Service Homeless Subpopulation “Chronic Homeless Individuals with Families.” What are we going to do about that group in the next 90 days and then the second one “Families with Children,” what are we going to do about that group in 90 days. And does this money actually target those items?
Ms Longoria – I just want to add something that Brian and Barbara already said, is that generally those individuals in the mobile homes are the low, really, really low, low, low income, they’re right there, and those are the ones we can bring back information. The owners and renters that we were looking at. They are not called mobile home owners, they’re just called owners or renters.
Ms Worley – Carrie, in addition to that, many of those folks, if they didn’t have that mobile home to live in, they would be homeless.
Ms Longoria – Right, I know that and that’s my point that we’re not using the term like mobile home owner but we know that the category need is the low income.
Mr. Petersen – I’m a mobile home owner, I put someone in one just so I could get him off the streets. Same idea.
Chair Deak – Kenny, it appears that there are several issues here which would be very helpful to provide us the feedback for this process and I would request that you may actually have to have a meeting with staff.
Mr. Petersen – I go to all of them.
Chairman Deak – They are going to have written comments which are targeting certain areas of their interests while the more broad thinkers, they are looking at five year plan. I think the issue is they would like you to pursue that so that information can be captured in here and then when it goes to the Assembly.
Mr. Petersen – Which one particularly caught your attention that I could focus on?
Chairman Deak – The whole issue of metrics, to me, but that would be one way, how do you measure actual success. That would be one big one, but there are others certainly, but that would be the number one, I would think.
Mr. Petersen – Metrics in some of the particular things they said was the highest priorities?
Chairman Deak – Right, correct. Any other comments you have.
Mr. Petersen – That was the main one because if the rest of it was kind of reserved for the Community Plan, which is, is this the plan to reduce homelessness of chronics; how will we measure it, when, who, if this is the plan to move forward. This is obviously a funding plan and so this could be for this additional document but how’s the Ten Year Plan included in the collaborative effort, who’s going to lead that, who’s going to make assignments, who’s going to check that the assignments are measured, how does this coordinate with

HCOSH, how does it coordinate with the Mayor’s Task Force and the Coalition? And then, how could additional folks come in to be involved, native groups, faith groups, community councils, how can they engage in it and then in my particular case just my own little segment, how do, can we count the people on the street corners and will that reduce or can we count the people in the shelters will they get out or can we count the homeless and will they get out? I’m just interested in that particular metric personally; but you also have the families and so on and it goes beyond that
Chairman Deak – If I may then I request that you follow up with these comments with I guess Carrie would be the first one.
Mr. Petersen ‐ Then I will attend the HCOSH meeting which is where that’s probably more fined tuned.
Chairman Deak – Any questions
Commissioner Spinelli – My only comment would be, if you are trying to count people on the corner, you might just keep counting forever unless you actually count the people you put into a house. I don’t know if you can, I just think that there might be a number of things that apply.
Mr. Petersen – We have the HMIS and so you can do it by name and so and forth, they are willing to, so there are some metrics by names through HMIS and so on. But that is true, they could keep coming over and over, but they’ve often found that there’s usually about two hundred that are repeat and maybe start with that. I don’t know how it is, but you’re right you would have to do it by name and keep the list growing.
Chairman Deak – O.K., thank you, anyone else, this is a public hearing you’re welcome to contribute.
Tyler Robinson, Cook Inlet Housing Authority – Thank you. A comment on two of the proposed projects, one is I want to add to the discussion about mobile homes. Several years back just for context, we did look at a lot of different solutions and partnership with NeighborWorks and others about how to sort of both recognize that mobile homes are an important part of our housing stock. But how to preserve those long term; and you know it was at a time when a number of the parks had sold and homes had been relocated. At some degree CDBG funds, and it’s becoming harder and harder to find parks that will accept a lot of these older homes.
Some make straight out that declaration that any home that’s pre 1976, HUD code is not acceptable as a new move in. There’s also a code that was written by HUD in 1992 that was an energy efficiency code that was put on and it was sort of a number that we use to at least contemplate when we as a municipality did weatherization on mobile homes. So I think as you go down this road, I certainly understand where Assembly members come from when they say you know boy it’ll cost me $260,000. a unit to build a rental development or if I can slap fifteen grand on a home even if it’ll only cost fifteen grand it’ll only cost me fifteen grand to keep somebody in a home.
That said, if you go down this road, you really have to understand that you’re still; putting money into something that you’re likely putting more money than value exists on that home. You need to consider policies that recognize whether the park owner is actually a secure park owner. Some parks you can know just by looking at the ownership and looking at the for sale sign out front that it’s likely not going to remain a park for very much longer. So I think the fact that the Minor Repair Program, there have been limits to what can be done to mobile homes. I strongly think that should be considered and perhaps this money would be better spent providing somebody a down payment for a new manufactured home in a more secure location. So food for thought, I understand it’s a difficult issue. I shared with staff a paper that I produced; a 25 page report on mobile home parks with some policy issues a couple of years back, and it tried to capture a lot of these things that we sort of wrestled with. So I recommend as you contemplate, that maybe if you’re up for it take a little read and it will save you some time of researching those issues.
The second item I want to talk about is rental development. I read that specifically it’s reserved for Community Housing and Development Organization (CHDO) for support housing for chronically homeless or high priority populations. I certainly see the need for that and I recognize that there’s a CHDO set aside for HOME dollars and I not here to try to sort of take money away from good projects. What I would simply suggest is that you consider maybe a two tier approach to this activity and say that in the event that a CHDO

is not identified or a project is not identified, you contemplate making that rental development money available to the broader community for maybe broader rental development. Again we discussed in previous comments just the whole shortage of housing units regardless of the population. So you can still target where your greatest need is but maybe leave yourself an out so that you don’t have to come back and amend the Action Plan. But if it turns out that you don’t have a project moving forward, you have a way to keep that money rolling I think, as you’re expected to do. So, those are my two comments on those activities.
Chairman Deak – Thanks you, any questions on those.
Gabe Layman, also with Cook Inlet Housing Authority – I actually just wanted to reflect back on a couple of comments that were made by Kenny, is it. There’s a couple of things that Kenny pointed out that I think merit a little bit of additional discussion. The first was, what exactly is the whole purpose of the Consolidated Plan and of the Action Plan and is it just limited to HUD funds, and what are we trying to do here and I think it’s important to recognize that these efforts typically begin in municipalities and jurisdiction as a tool to access HUD funding. You want the HUD funding; you gotta do the plan, right?
The question is, whether as a community we can do something more with this, and I think we have to acknowledge that staff is constrained in what they can do because they have to follow certain HUD prescribed methodology within the plan tends to make the plan convoluted in terms of the data that’s gathered and the data that’s assessed but there’s also perhaps some real opportunity here for the Municipality to look at the Consolidated Plan and kind of vision what can this be.
Can we turn this into a true planning document that draws additional data sources that’s highly quantitative in its evaluation and it’s something more than just checking our HUD boxes to get funds. I think staff has done a good job of expanding towards that ultimate goal, but there’s probably also still work to do there.
Second, Kenny hit on this idea of, what are the other sources out there, we’re focused on HUD funding, and staff is absolutely correct that for example, Cook Inlet Housing Authority and the Alaska Housing Finance Corporation, other sources of funds are identified. But something that’s more important here which is, that in a declining Federal funding environment if housing and community development is really a priority for the Municipality; it needs to put on its thinking cap and try to figure out how to leverage additional funds.
Cook Inlet Housing Authority, for example is facing a declining federal funding environment, it’s been our core source of funding for a long time. When we acknowledge that that was the impending reality, we immediately got to work trying to figure out how to diversify our funding. We branched off and looked at additional foundation relationships, we branched off and looked at additional debt financing sources that we could make feasible, we began to look at social enterprise, business oriented solutions to socially motivated mission based friendships. So the point being here is that if the Municipality wants to look beyond Federal funding it’s going to have to get very innovative whether directly or in partnership with other entities. And finally there’s this issue of benchmarking data analysis, however you want to put that together. One thing I would say in that regard is, it’s sometimes silly to box ourselves in and simply count units built with money available when it comes down to, how much money did you spend on one unit.
Cook Inlet Housing Authority, for example we gather that data, we can count that data, but what we wanted to know for example in terms of our investment in Mountain View was, what are the impacts on the whole community, right? So we’ve actually commissioned consultants to come in and take a look at the overall impact on things like transiency, and school performance, and household income. So I would simply suggest that if the HAND Commission and Municipality begins to look at really evaluating data, be smart about it, don’t’ simply count dollars spent on units actually developed. Let’s look at how investments impact what’s important to us and what we see in our communities. And whether we’re actually achieving those outcomes in education and health, etcetera through specific investments in housing and community development. So with that I would be happy to take any questions or go back to my seat and be quiet.
Commissioner Spinelli – So when I count how many units and what they cost, I’m well aware of the other impacts that housing provides in society, but I still need to know how many units and what they cost. Is there, I don’t understand why you say don’t say that.

Mr. Layman – And don’t get me wrong.
Commissioner Spinelli – I didn’t know if you’re just saying that there’s other things to consider and maybe it’s just obvious to me or.
Mr. Layman – And don’t get me wrong Commissioner Spinelli, I’m not suggesting that we focus on the number of units that we can actually produce with “X” dollars. What I’ suggesting is there’s a variety of tactics, strategies that you can employ to try to meet our community objectives, whether it’s supportive housing versus independent housing, whether you’re focusing on a population that’s making 30% or less of median income or those making 50 to 80%. The issue is being able to measure what the outputs of those different investments are and whether they move the dial more or less based on what type of investment you’re making. That’s certainly important but it’s a question of which investment gives you the best bang for your buck, based on what your vision of your community is in the long term.
Chairman Deak – Anyone else?
Mr. Layman – Thank you very much.
Chairman Deak – Last call for, looks like Kenny, go ahead Kenny.
Mr. Petersen – I think I have 15 seconds left. Today is John Court’s birthday, or would have been John Court’s birthday. John Court was one of the first residents of Karluk Manor. I got a phone call from his mother today just to acknowledge about his birthday, he was one of the first ones who moved in and shortly died thereafter with dignity in the home. So that’s one of the fundings I think that came from this group and his mom wanted to thank us for having put him in a home for the last part of his life kind of thing, and he would have celebrated his birthday today and I got a call from his mom from wherever she is in Missouri or something to thank us for that.
Chairman Deak – Last call for the Public Hearing on the Action Plan, anyone else is interested, seeing none I am going to close the Public Hearing. Thank you everyone for attending and speaking and please continue with your follow ups through staff, so they actually, these ideas actually land in some fashion in these documents and I think the more exciting part of this is that they land in a document that is truly looking at a broader scale at all these issues. So thank you again.
Public Comments received by e‐mail
Comments received from Susan H. Bomalaski, Ph.D., LPC, Executive Director, Catholic Social Services
Catholic Social Services (CSS) supports the draft 2013 – 2017 Housing and Community Development Consolidated Plan and the draft 2013 Annual Action Plan. The plans are data driven and accurately reflect community needs. The data for the needs assessment and market analysis were collected through many community meetings and extensive efforts at gathering input from stakeholders and the results are incorporated into the strategic plan.
I would also like to acknowledge the many hours of work put into these documents by the Municipality of Anchorage Department of Health and Human Services (DHHS), Public Health Initiatives and Partnerships Division, Community Safety and Development (CSD) staff. They have made every effort to gather information and to give all interested parties an opportunity to participate in the process of development the plans. My hat is off to them for their hard work and dedication.

V. NA 05 Overview and Findings for Funding 2013‐2017
This section introduces community’s needs for the next 5‐year period, including estimate and types of families in need of assistance for extremely low‐income, low‐income, moderate income, and middle‐income families. This review includes renters and owners and specifications for different categories of persons. The analysis used to determine the priority needs is a 2012 survey of Anchorage citizens, including Community Councils, Municipal Commissions, agencies serving the homeless, victims of interpersonal violence, and persons with disabilities. Local data is also used to identify target populations.
A. Housing problems by Area Median Income (AMI)
Substandard housing include households by income level without hot and cold piped water, a flush toilet and a bathtub or shower, and kitchen facilities that lack a sink with piped water, a range or stove, or a refrigerators. The following live in Substandard Housing conditions:
47% of Renters with a 0‐30% AMI
43% of Owners with a >50 – 80% AMI.
Severely Overcrowded households have complete kitchens and bathrooms, but house more than 1.5 persons per room, excluding bathrooms, porches, foyers, halls, or half‐rooms. The following live in Severely Overcrowded conditions:
47% of Renters with a >30% – 50% AMI
37% of Owners with a >30‐50% AMI
39% of Owners with a >30‐50% AMI
Overcrowded households have complete kitchens and bathrooms, but house more than 1 to 1.5 persons per room excluding bathrooms, porches, foyers, halls, or half‐rooms.
44% of Renters in the >50‐80% AMI
39% of Owners in the >50‐80% AMI
37% of Owners in the >80‐100% AMI
Housing cost burden is a fraction of a household’s total gross income spent on housing costs. For renters, housing costs include rent paid by the tenant plus utilities. For owners, housing costs include mortgage payment, taxes, insurance and utilities.
Housing cost burden greater than 50% of household income do not have problems identified with substandard housing, severely overcrowding, and overcrowding.
70% of Renters with a 0‐30% AMI
38% of Owners with a 0‐30% AMI
Housing cost burden of greater than 30% is similar to 50% of household income issues, and similarly does not have the other housing problem.
40% of Renters in the >30‐50% AMI
42% of Renters in the >50‐80% AMI
46% of Owners in the >50‐80% AMI
40% of Owners at >80‐100%AMI

B. Households with one or more housing problems: Lacks kitchen or bathroom, Overcrowding, Cost Burden
58% of Renters with a 0‐30% AMI
26% of Renters with a >30‐50% AMI
33% of Owners in the 0‐30% AMI
26% of Owners in the >30‐50% AMI
26% of Owners in the >50‐80% AMI
C. Cost Burden by Household Type (Small Related, Large Related, Elderly, Other) and AMI (See NA 10 Table 7)
Percentage of households with housing cost burdens more than 30% of their income in comparison to the area median income of the household.
Disproportionately represented households of housing cost burden greater than 30% of household income
Renters
64% of Elderly Renters with a 0‐30% AMI
41% of Large Related Family Renters with 0‐30% AMI
38% of Small Related Family Renters in the >30‐50% AMI
37% of Other Renters in the >30‐50% AMI
27% of Small Related Family Renters in the >50‐80% AMI
32% of Large Related Family Renters in the >50‐80% AMI
Owners
37% of Elderly Owners in the 0‐30% AMI
32% of Other Owners in the 0‐30% AMI
26% of Large Related Owners in the >30‐50%
35% of Elderly Owners in the >30‐50 AMI
61% of Small Related Owners in the >50‐80% AMI
59% of Large Related Owners in the >50‐80% AMI
Disproportionately represented households at a Cost Burden greater than 50% of household income
Renters
85% of Elderly Renters with a 0‐30% AMI
74% Large Related Renters with a 0‐30% AMI
74% Other Renters with a 0‐30% AMI
31% of Small Related Renters with a >30‐50% AMI
7% of Large Related Renters with a >50‐80% AMI
Owners

57% of Elderly Owners in the 0‐30% AMI
47% of Other Owners in the 0‐30% AMI
37% of Small Related Owners in the >30‐50% AMI
41% of Large Related Owners in the >50‐80% AMI
33% of Small Related Owners in the >50‐80% AMI
30% of Other Owners in the >50‐80% AMI
D. Percentage of households that are overcrowded, defined by HUD, as households with more than one person per room, excluding bathrooms, porches, foyers, halls, or half‐rooms.
Renters
39% of Other, non‐family households in the 0‐30% AMI
30% of Single family households in the 0‐30% AMI
30% of Single family households in the >30‐50 AMI
83% of Multiple, unrelated family households in the >50‐80% AMI
Owners
16% of Single family Owner households in the 0‐30% AMI
28% of Single family Owner households in the >30‐50% AMI
88% of Multiple, unrelated family households in the >50‐80% AMI
E. Other Identifying Needs
A total of 7,986 Anchorage children live in poverty; with the largest percentage under five years of age. The greatest percentage (41%) of male children in poverty is under the age of 5 years and between 6 to 11 years of age (28%). Female children in poverty show a similarity, with the greatest percentage (34%) of female children in poverty under 5 years of age and between 6 to 11 years of age (26%).
According to the Anchorage School District Child in Transition/Homeless (CIT/H) Project from 2007/2008 (2,829 children) to 2011/2012 (4,277 children) school year there was an increase of 49% of children meeting the definition of homeless.
On average over the past five school years, the majority of ASD children identified in the CIT/H Project live doubled‐up (42%) or in a shelter (26%).
F. Disproportionately Affected Racial Groups
A disproportionately greater need exists when the members of racial or ethnic group at an income level experience housing problems at a greater rate (10% or more) than the income level as a whole of the population. A household is identified as having a housing problem if they have any 1 or more of these 4 problems:
1. Lacks complete kitchen facilities;
2. Lacks complete plumbing facilities;
3. Household is overcrowded which means there is more than 1.5 persons per room and excludes bathrooms, porches, foyers, halls, or half‐rooms; and,

4. Household is cost burdened.
The following households have been identified as having a disproportionate need with a housing problem.
Households with 0‐30% AMI and disproportionate representation with one or more of four housing problems
Black Renter households account for 84% of all households
Households with 30.1‐50% AMI and disproportionate representation with one or more of four housing problems
White Owners account for 44%
Black Owners account for 47%
American Indian/AK Native account for 37%
Other Renters account for 70%
Pacific Islanders account for 95%
Households with 50.1%‐80% AMI and disproportionate representation with one or more of four housing problems
Black Renters account for 42%
American Indian/AK Native Owners account for 35%
Other Renters account for 71%
Households with 80% ‐ 100% AMI and disproportionate representation with one or more of four housing problems
Other Owners account for 69%
A disproportionately greater need exists when members of a racial or ethnic group at an income level experience housing problems at a greater rate (10% points or more) than the income level as a whole for severe housing problems.
HUD defines severe housing problems as:
1. Lacks complete kitchen facilities;
2. Lacks complete plumbing facilities;
3. More than 1.5 persons per room not including bathrooms, porches, foyers, halls, or half‐rooms; and,
4. Households with housing cost burdens that exceed 50% of the monthly income.
The following households have been identified as having a disproportionate need with a housing problem.
Households with 0‐30% AMI
Black Renter households account for 77%
American Indian/AK Native households account for 67%
Pacific Islander households account for 89%
Households with 30.1% ‐ 50% AMI
Black Owner households account for 28%
Black Renter households account for 37%
Pacific Islander Renter households account for 49%
Other Renter households account for 32%
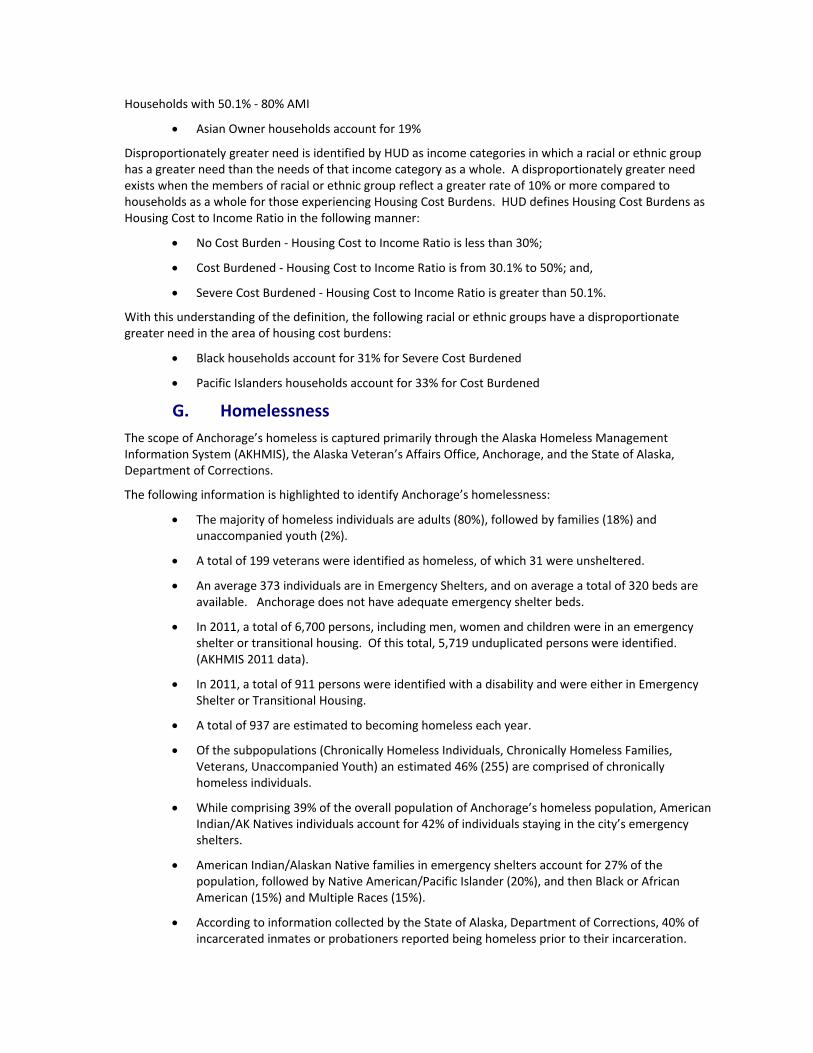
Households with 50.1% ‐ 80% AMI
Asian Owner households account for 19%
Disproportionately greater need is identified by HUD as income categories in which a racial or ethnic group has a greater need than the needs of that income category as a whole. A disproportionately greater need exists when the members of racial or ethnic group reflect a greater rate of 10% or more compared to households as a whole for those experiencing Housing Cost Burdens. HUD defines Housing Cost Burdens as Housing Cost to Income Ratio in the following manner:
No Cost Burden ‐ Housing Cost to Income Ratio is less than 30%;
Cost Burdened ‐ Housing Cost to Income Ratio is from 30.1% to 50%; and,
Severe Cost Burdened ‐ Housing Cost to Income Ratio is greater than 50.1%.
With this understanding of the definition, the following racial or ethnic groups have a disproportionate greater need in the area of housing cost burdens:
Black households account for 31% for Severe Cost Burdened
Pacific Islanders households account for 33% for Cost Burdened
G. Homelessness
The scope of Anchorage’s homeless is captured primarily through the Alaska Homeless Management Information System (AKHMIS), the Alaska Veteran’s Affairs Office, Anchorage, and the State of Alaska, Department of Corrections.
The following information is highlighted to identify Anchorage’s homelessness:
The majority of homeless individuals are adults (80%), followed by families (18%) and unaccompanied youth (2%).
A total of 199 veterans were identified as homeless, of which 31 were unsheltered.
An average 373 individuals are in Emergency Shelters, and on average a total of 320 beds are available. Anchorage does not have adequate emergency shelter beds.
In 2011, a total of 6,700 persons, including men, women and children were in an emergency shelter or transitional housing. Of this total, 5,719 unduplicated persons were identified. (AKHMIS 2011 data).
In 2011, a total of 911 persons were identified with a disability and were either in Emergency Shelter or Transitional Housing.
A total of 937 are estimated to becoming homeless each year.
Of the subpopulations (Chronically Homeless Individuals, Chronically Homeless Families, Veterans, Unaccompanied Youth) an estimated 46% (255) are comprised of chronically homeless individuals.
While comprising 39% of the overall population of Anchorage’s homeless population, American Indian/AK Natives individuals account for 42% of individuals staying in the city’s emergency shelters.
American Indian/Alaskan Native families in emergency shelters account for 27% of the population, followed by Native American/Pacific Islander (20%), and then Black or African American (15%) and Multiple Races (15%).
According to information collected by the State of Alaska, Department of Corrections, 40% of incarcerated inmates or probationers reported being homeless prior to their incarceration.

H. Special Need Populations
This section of the Plan describes the housing needs of persons who are not homeless but require supportive housing.
The Consolidated Plan is using HUD’s definitions for elderly and frail elderly, persons with disabilities, persons with HIV/AIDS and their families, and victims of domestic violence, dating violence, sexual assault and stalking. Note for purposes of this Plan for the elderly:
Elderly is 62 years of age and greater;
Frail elderly (defined as an elderly person who requires assistance with three or more activities of daily living, such as bathing, walking, and performing light housework); and,
Extra elderly is 75 years and older, and represents a population with different needs than those who are 62‐74 years of age.
HUD identifies and collects information in CHAS data on housing problems. A household is identified as having a housing problem if they have any one or more of the following four problems:
Lack complete kitchen facilities;
Lack complete plumbing facilities;
Household is overcrowded; and,
Household is cost burdened.
The following information identifies populations within Anchorage that are disproportionately represented with housing problems.
1. Elderly and Extra Elderly
For the 0%‐30% of the Area Median Income both the Elderly Owners at 38% and Extra Elderly Owners at 36% are disproportionately represented with Housing Problems, which are greater than 24% for all Owner households.
For the 30.1%‐50% of the Area Median Income both the Elderly Owners at 47% and Extra Elderly Owners at 35% are disproportionately represented with Housing Problems, which are greater than 25% for all Owner households.
For the 50.1%‐80% of the Area Median Income, the Elderly Owners at 29% and Extra Elderly Owners at 25% are disproportionately represented with Housing Problems, which are greater than 24% for all Owner households.
For the 80.1%‐95% of the Area Median Income, the Elderly Owners at 32% and Non‐Elderly Owners at 31% are disproportionately represented with Housing Problems, greater than 30% for all Owner households.
2. Persons with mental, physical, and/or developmental disabilities
For the 0%‐30% of the Area Median Income the Disabled is disproportionately represented with Housing Problems in comparison to All Renter households.
For the 50.1% ‐ 80% of the Area Median Income the Disabled is disproportionately represented with Housing Problems in comparison to All Renter households.
For the 80% and above of the Area Median Income the Disabled Owner is disproportionately represented with Housing Problems in comparison to All Renter households.
Disabled Renters are disproportionately represented with Housing Problems in comparison to All Renter households.

The following information represents populations with specific needs for their group.
3. Persons and Families Living with HIV/AIDS
Aside from medical conditions and special needs for persons and families living with HIV/AIDS:
16 families were homeless when they came to the Four A’s, Anchorage’s local provider to serve this population.
2 families were identified by Four A’s as currently on the verge of homelessness.
1 family is currently homeless were assisted by Four A’s.
4. Domestic Violence
A total of 471 household clients were assist by the Anchorage Domestic Violence Prevention Project (ADVPP), which provides emergency financial assistance.
A total of 51 households were relocated for safety under ADVPP.
The areas of ADVPP emergency financial need for domestic violence households were travel/transportation (57%) and housing (27%), food and clothing (5%), and health and safety (4%).
5. Sexual Assault
According to data provided by Standing Together Against Rape, Inc. (STAR), many victims are in need of safe and secure housing.
The majority of sexual assaults take place in or near the victim’s home, or in the homes of relatives or neighbors – thus, for many survivors of sexual violence, home is not safe.
Of those, 71 of the sexual violence perpetrators were individuals located in the home of the victim.
Sexual assault, specifically at the hands of a family member, jeopardizes housing
Non offending parent must make a choice between keeping their children safe or fleeing their home
If the offending parent is arrested, the non offending parent is faced with struggles to pay rent
Shelter and housing needs of sexual violence survivors are often overlooked ‐ in fact, survivors are seldom asked about their housing concerns.
STAR provides emergency shelter, and works with AWAIC but struggles with the cost of providing emergency shelter to male clients (28 males in the month of August sought services).

Table NA‐05.1. Community Needs Survey Results
Top seven Public Facility needs in Anchorage
Rank Public Facility High Priority
1 Homeless Facilities 223
2 Abused/Neglected Children Facilities 218
3 Mental Health Facilities 158
4 Child Care Centers 151
5 Youth Centers 150
6 Senior Centers 122
7 Handicapped Centers 121
Top five Public Service Priorities
Rank Public Service Priorities High Priority
1 Handicapped Services 214
2 Youth Services 168
3 Transportation Services 168
4 Senior Services 154
5 Child Care Services 148
Top five Priorities for Homeless: Subpopulations
Rank Homeless ‐ Subpopulations High Priority
1 Chronically Homeless Individuals and Families 210
2 Families with children 207
3 Victims of Domestic Violence or Similar Life Threatening Condition 206
4 Unaccompanied youth 165
5 Persons with Chronic Substance Abuse 160
Top five Public Service Priorities for Non‐Homeless Special Needs
Rank Public Service Priorities for Non‐Homeless Special Needs High Priority
1 Victims of Domestic Violence or Similar Life Threatening Condition 202
2 Persons at Risk of Homelessness 173
3 Frail Elderly 170
4 Severe Mental Illness 169
5 Families with Children 164
Top three Public Improvement needs in Anchorage
Rank Public Improvements High Priority
1 Sidewalks 151
2 Street Improvements 114
3 Flood Drainage Improvements 94

MAP NA‐10.1. Anchorage Vicinity Map

Summary of Demographics Table 1 presents Anchorage’s population, number of households, and median income, as well as the percentage change from 2000 to 2010.
NA 10 Table 1 Housing Needs Assessment Demographics
Demographics Based Year: 2000 Most Recent Year: 2010 % Change
Population 260,283 291,826 12%+
Households 100,368 113,032 12%+
Median Income $73,004 $75,485 3%+
Source: 2010 U.S. Census/American FactFinder/People QuickFacts @: http://factfinder2.census.gov/faces/tableservices/jsf/pages/productview.xhtml?src=bkmk.
Table 2 shows the majority of the Anchorage population at 66% is White, followed by persons reporting two or more races at 8.1% and Asian at 8.1%, and American Indian and Alaska Native at 7.9%.
NA 10 Table 2 U.S. Census 2010 Demographic Information for Anchorage
Race Percentage
White 66.0%
Black 5.6%
American Indian and Alaska Native 7.9%
Asian 8.1%
Native Hawaiian and Other Pacific Islander 2.0%
Persons reporting two or more races 8.1%
Persons of Hispanic or Latino origin 7.6%
White persons not Hispanic 62.6%
This Consolidated Plan will cover Anchorage’s population needs 2013 through 2017 for decent housing, suitable living environment, and expanded economic opportunities. According to the U.S. Census and state economists estimates, Anchorage will have an average growth rate of 3,019 per year beginning in 2013 through 2017. The table below shows this growth rate per year, and estimated population for Anchorage for each year.
NA 10 Table 3 Municipality of Anchorage Population
Year Population
2013 302,009
2014 304,555
2015 307,606
2016 310,658
2017 313,709
Source: Estimates based on 2010 U S Census and AK Dept of Labor and Workforce Development, Alaska Population Projections, 2010‐2034, Section 3, February, 2011

U.S. Census by Tract The U.S. Census recognizes census tracts as permanent statistical subdivisions of a county. Census tract boundaries are delineated so that statistical comparisons can be made from census year to census year. The spatial size of census tracts varies on the density of the geographical area. Anchorage has a total of 55 census tracts. See 2010 U S Census Tract information outlined and related populations.
NA 10 Table 4 Municipality of Anchorage, 2010 U.S. Census by Tracts
Anchorage Census Tract Total
Population
Anchorage Census Tract
Total Population
1.01 5,736 17.31 5,823
1.02 5,259 17.32 6,179
2.01 4,110 18.01 4,907
2.02 5,947 18.02 5,537
2.03 10,549 19 4,194
2.04 3,381 20 3,748
3 8,000 21 3,787
4 5,937 22.01 5,053
5 1,988 22.02 2,960
6 7,747 23.01 7,088
7.01 5,949 23.02 4,791
7.02 5,107 23.03 9,273
7.03 5,706 24 3,299
8.01 7,323 25.01 4,993
8.02 4,407 25.02 5,236
9.01 4,906 26.01 4,784
9.02 3,141 26.02 5,805
10 4,131 26.03 6,341
11 940 27.02 9,670
12 3,718 27.11 6,589
13 3,059 27.12 9,068
14 5,224 28.11 6,313
15 5,104 28.12 7,166
16.01 4,092 28.13 4,579
16.02 4,224 28.21 5,050
17.01 6,843 28.22 4,020
17.02 5,258 28.23 5,217
17.31 5,823 29 2,570
17.32 6,179

Individual census tracts in the MOA with the largest populations include Tract 2.03, Eagle River at 10,549; Tract 27.02 Old Seward/Ocean View at 9,670; Tract 23.03, Sand Lake at 9,273; and Tract 27.17, Bay Shore/Klatt at 9,068. Tract 11, representing Downtown had the lowest population at 940.
Chugiak and Eagle River became annexed to the Municipality of Anchorage, when the City of Anchorage and the Greater Anchorage Area Borough were unified in 1975. The area north of Fort Richardson to the municipal boundary includes Eagle River, Chugiak, Birchwood, Peters Creek, Thunderbird Falls, and Eklutna. The 2010 Census reflects a population of 23,987 in Eagle River and an additional 10,995 in Chugiak, Birchwood, Peters Creek, Thunderbird Falls, and Eklutna.
Girdwood adds another 2,570 to Anchorage’s population. Girdwood is located on Turnagain Arm in the Municipality of Anchorage, 35 miles southeast of downtown Anchorage. The area is accessed by the Seward Highway. Girdwood is bordered on three sides by the Chugach State Park and Chugach National Forest.1
1 Alaska Community Database Community Information Summaries Alaska Department of Commerce, Community, and Economic Development Division of Community & Regional Affairs

MAP NA‐10.2. Anchorage Census Tracts
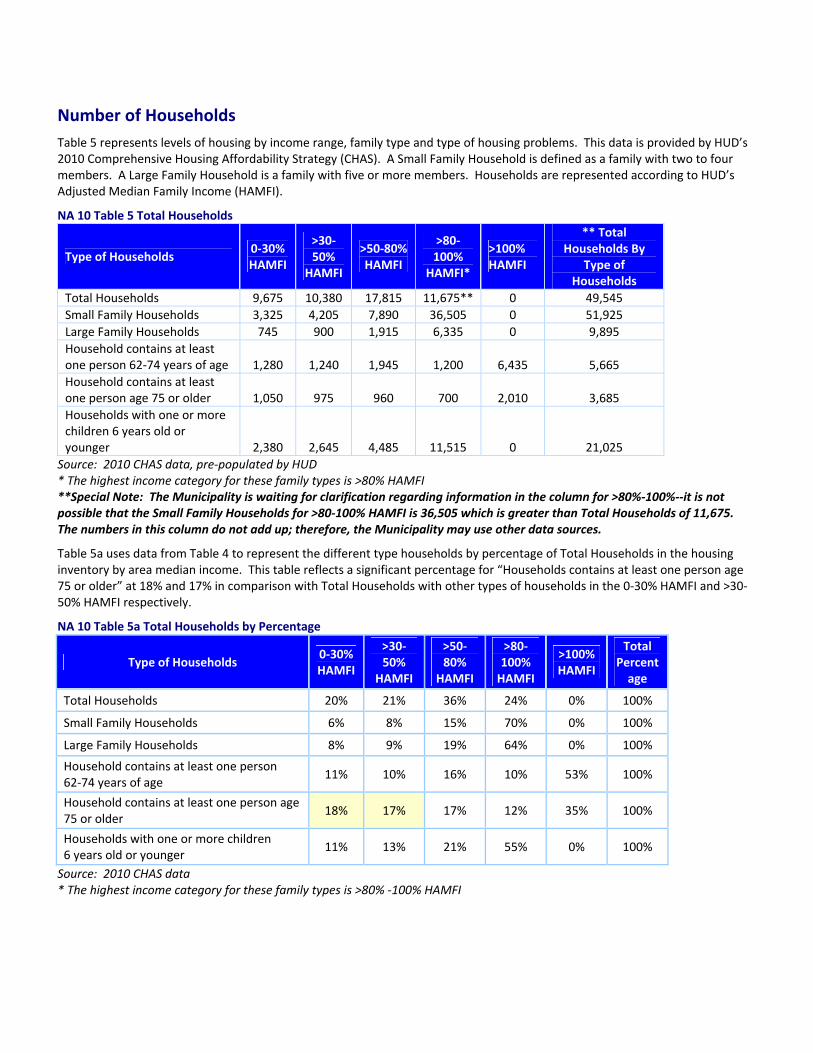
Number of Households
Table 5 represents levels of housing by income range, family type and type of housing problems. This data is provided by HUD’s 2010 Comprehensive Housing Affordability Strategy (CHAS). A Small Family Household is defined as a family with two to four members. A Large Family Household is a family with five or more members. Households are represented according to HUD’s Adjusted Median Family Income (HAMFI).
NA 10 Table 5 Total Households
Type of Households 0‐30% HAMFI
>30‐50%
HAMFI
>50‐80% HAMFI
>80‐100%
HAMFI*
>100% HAMFI
** Total Households By
Type of Households
Total Households 9,675 10,380 17,815 11,675** 0 49,545
Small Family Households 3,325 4,205 7,890 36,505 0 51,925
Large Family Households 745 900 1,915 6,335 0 9,895
Household contains at least one person 62‐74 years of age 1,280 1,240 1,945 1,200 6,435 5,665
Household contains at least one person age 75 or older 1,050 975 960 700 2,010 3,685
Households with one or more children 6 years old or younger 2,380 2,645 4,485 11,515 0 21,025
Source: 2010 CHAS data, pre‐populated by HUD * The highest income category for these family types is >80% HAMFI **Special Note: The Municipality is waiting for clarification regarding information in the column for >80%‐100%‐‐it is not possible that the Small Family Households for >80‐100% HAMFI is 36,505 which is greater than Total Households of 11,675. The numbers in this column do not add up; therefore, the Municipality may use other data sources.
Table 5a uses data from Table 4 to represent the different type households by percentage of Total Households in the housing inventory by area median income. This table reflects a significant percentage for “Households contains at least one person age 75 or older” at 18% and 17% in comparison with Total Households with other types of households in the 0‐30% HAMFI and >30‐50% HAMFI respectively.
NA 10 Table 5a Total Households by Percentage
Type of Households 0‐30% HAMFI
>30‐50%
HAMFI
>50‐80%
HAMFI
>80‐100% HAMFI
>100% HAMFI
Total Percentage
Total Households 20% 21% 36% 24% 0% 100%
Small Family Households 6% 8% 15% 70% 0% 100%
Large Family Households 8% 9% 19% 64% 0% 100%
Household contains at least one person 62‐74 years of age
11% 10% 16% 10% 53% 100%
Household contains at least one person age 75 or older
18% 17% 17% 12% 35% 100%
Households with one or more children 6 years old or younger
11% 13% 21% 55% 0% 100%
Source: 2010 CHAS data * The highest income category for these family types is >80% ‐100% HAMFI

Housing Needs Summary Tables for Several Types of Housing Problems
Housing cost burden is a fraction of a household’s total gross income spent on housing costs. For renters, housing costs include rent paid by the tenant plus utilities. For owners, housing costs include mortgage payment, taxes, insurance and utilities. Households with housing cost burden greater than 50% of household income are identified in this table, and do not have problems identified with substandard housing, severely overcrowding, and overcrowding. Housing cost burden of greater than 30% is similar to 50% of household income issues, and similarly does not have the other housing problem. Households with zero negative income (and none of the other housing problems) are also identified in this table.
Table 6 displays the overall number of households with housing problems by tenure and HUD Adjusted Area Median Income (AMI). The table is pre‐populated with 2010 CHAS data developed by HUD. Substandard Housing include households by income level without hot and cold piped water, a flush toilet and a bathtub or shower, and kitchen facilities that lack a sink with piped water, a range or stove, or a refrigerators. Severely Overcrowded households have complete kitchens and bathrooms, but house more than 1.5 persons per room, excluding bathrooms, porches, foyers, halls, or half‐rooms. Overcrowded households have complete kitchens and bathrooms, but house more than 1 to 1.5 persons per room excluding bathrooms, porches, foyers, halls, or half‐rooms.
Needs Assessment Section\Section C NA 10 Housing Assessment Tables 2‐7.xls
NA 10 Table 6 Housing Problems (Households with one of the listed needs) Renter Owner
0‐30% AMI
>30‐50% AMI
>50‐80% AMI
>80‐100% AMI
Total 0‐30% AMI
>30‐50% AMI
>50‐80% AMI
>80‐100% AMI
Total
Substandard Housing ‐ Lacking complete plumbing or kitchen facilities
260 120 135 40 555 60 40 95 25 220
Severely Overcrowded ‐ With >1.51 people per room (and complete kitchen and plumbing)
110 290 95 125 620 15 75 80 35 205
Overcrowded ‐ With 1.01‐1.5 people per room (and none of the above problems)
470 290 715 140 1,615 85 115 320 310 830
Housing Cost Burden greater than 50% of income (and none of the above problems)
4,420 1,640 210 50 6,320 1,995 1,460 1,350 385 5,190
Housing Cost Burden greater than 30% of income (and none of the above problems)
870 3,220 3,410 645 8,145 200 715 2,850 2,480 6,245
Zero/negative Income (and none of the above problems)
175 0 0 0 175 120 0 0 0 120
Source: 2010 CHAS
Table 5a shows 47% (260/555) of Renters with a 0‐30% AMI live in substandard housing in the city. And, 70% (4,420/6,320) of renters in the same AMI (0‐30%) have a Housing Cost Burden greater than 50% of income. Also, 47% (290/620) of Renters with a >30 – 50% AMI live in Severely Overcrowded conditions in comparison with the other AMI in the same row which includes 18%, 15% and 20% respectively. Renters in the >30‐50% AMI are represented at 40% (3,220/8,145), a little less than Renters in the >50‐80% AMI which shows 42% (3,410/8,145) for Housing Cost Burden greater than 30% of income in comparison with the other AMI. Renters in the >50‐80% AMI show a much greater percentage of 44% (715/1,615) for Overcrowded conditions in comparison with the other AMI.
Table 6a also shows 38% (1,995/5,190) of Owners with a 0‐30% AMI have a Housing Cost Burden greater than 50% of income. Owners with a >30‐50% are represented at 37% (75/205) for Severely Overcrowded. Owners with a >50 – 80% AMI are represented higher than other AMI for the following: at 43% (95/220) for Substandard Housing, at 39% (80/205) for Severely Overcrowded, at 39% (320/830) for Overcrowded, and 46% (2,480/6,245) for Housing Cost Burden greater than 30% of income. Owners in the >80‐100% AMI represent 37% (310/830) for Overcrowded housing Problems. Owners at >80‐100%AMI represent 40% (2,480/6,245) for Housing Cost Burden greater than 30%.
NA 10 Table 6a Housing Problems (Households with one of the listed needs) by Percentage
Renter Owner
0‐30% AMI
>30‐50% AMI
>50‐80% AMI
>80‐100% AMI
Total 0‐30% AMI
>30‐50% AMI
>50‐80% AMI
>80‐100% AMI
Total

Renter Owner
0‐30% AMI
>30‐50% AMI
>50‐80% AMI
>80‐100% AMI
Total 0‐30% AMI
>30‐50% AMI
>50‐80% AMI
>80‐100% AMI
Total
Substandard Housing ‐ Lacking complete plumbing or kitchen facilities
47% 22% 24% 7% 100% 27% 18% 43% 11% 100%
Severely Overcrowded ‐ With >1.51 people per room (and complete kitchen and plumbing)
18% 47% 15% 20% 100% 7% 37% 39% 17% 100%
Overcrowded ‐ With 1.01‐1.5 people per room (and none of the above problems)
29% 18% 44% 9% 100% 10% 14% 39% 37% 100%
Housing Cost Burden greater than 50% of income (and none of the above problems)
70% 26% 3% 1% 100% 38% 28% 26% 7% 100%
Housing Cost Burden greater than 30% of income (and none of the above problems)
11% 40% 42% 8% 100% 3% 11% 46% 40% 100%
Zero/negative Income (and none of the above problems)
100% 0 0 0 100% 100% 0 0 0 100%
Table 7 displays the number of households with no housing problems, one or more housing problems, and negative income by tenure and HUD adjusted Area Median Income (AMI). The table is populated by HUD’s 2010 CHAS data. Based on HUD’s definition, having one or more of four housing problems means the households have at least one of the following: cost burden, overcrowding, lack of a complete kitchen, or plumbing facilities.

NA 10 Table 7 Housing Problems (Households with one or more Housing problems: Lacks kitchen or bathroom, Overcrowding, cost burden)
Renter Owner
0‐30% AMI
>30‐50% AMI
>50‐80% AMI
>80‐100% AMI
Total 0‐30% AMI
>30‐50% AMI
>50‐80% AMI
>80‐100% AMI
Total
Having 1 or more of four housing problems
5,260 2,335
1,155
350 9,100 2,155 1,690
1,840
760 6,445
Having none of four housing problems
1,545 4,550
9,040
4,330 19,465 420 1,805
5,780
6,235 14,240
Household has negative income, but none of the other housing problems
175 0 0 0 175 120 0 0 0 120
Source: 2010 CHAS
Table 7a for Housing Problems shows Renters with a 0‐30% AMI have a much greater percentage of 58% (5,260/9,100) for having 1 or more of four housing problems. A little over a quarter Renters at 26% (2,335/9,100) with a >30‐50% AMI also have a high representation for housing problems.
Owners in the 0‐30% AMI have the greatest percentage of 33% (2,155/6,445) as having 1 or more of four housing problems. Owners at the >30‐50% AMI with 26% (1,690/6,445) and at the >50‐80% AMI with 29% (1,840/6,445) also have high percentages for housing problems.
NA 10 Table 7a Housing Problems (Households with one or more Housing problems: Lacks kitchen or bathroom, Overcrowding, cost burden by Percentage
Renter Owner
0‐30% AMI
>30‐50% AMI
>50‐80% AMI
>80‐100% AMI
Total 0‐30% AMI
>30‐50% AMI
>50‐80% AMI
>80‐100% AMI
Total
Having 1 or more of four housing problems
58% 26% 13% 4% 100% 33% 26% 29% 12% 100%
Having none of four housing problems
8% 23% 46% 22% 100% 3% 13% 41% 44% 100%
Household has negative income, but none of the other housing problems
100% 0% 0% 0% 100% 100% 0 0 0 100%
Table 8 displays the number of households with Housing Cost Burdens more than 30% by household type and income based on Area Median Income (AMI).
NA 10 Table 8 Cost Burden > 30% Area Median Income
Renter Owner 0‐30%
AMI >30‐50% AMI
>50‐80% AMI
Total 0‐30% AMI
>30‐50% AMI
>50‐80% AMI
Total
Small Related 2,170 2,295 1,625 6,090 635 810 2,225 3,670
Large Related 550 370 435 1,355 150 250 565 965
Elderly 1,150 445 205 1,800 850 805 635 2,290
Other 2,195 2,175 1,470 5,840 690 425 1,040 2,155
Total need by income
6,065 5,285 3,735 15,085 2,325 2,290 4,465 9,080
Source: 2010 CHAS Data
Table 8a for Cost Burden greater than 30% of AMI shows Elderly Renters with a 0‐30% AMI are disproportionately represented at 64% (1,150/1,800) far exceeds the Total need by income at 40% (6,065/15,085). In the 0‐30% AMI Large Related Renters at 41% (550/1,335) are slighter higher than the 40% of Total need by income. Small Related Renters in the >30‐50% AMI at 38%

(2,295/6,090) and Other Renters in the same AMI at 37% (2,175/5,840) are both greater than the Total need by income at 35% (5,285/15,085). Small Related Renters in the >50‐80% AMI are represented at 27% (1,625/6,090) and Large Related Renters in the same AMI at 32% (435/1,355) are disproportionately greater than the Total need by income of 25% (3,735/15,085).
Elderly Owners with a 0‐30% AMI are disproportionately represented at 37% (850/2,290) and Other Owners at 32% (690/2,155) compared to Total Need by Income of 26% (2,325/9,080). Large Related Owners with a >30‐50% AMI represented at 26% (250/965) and Elderly Owners at 35% (805/2,290) are disproportionately greater than the Total need by income of 25% (2,290/9,080). Small Related Owners at the >50‐80% AMI represent 61% (2,225/3,670) and Large Related Owners at the >50‐80% AMI represent at 59% (565/965) are disproportionately represented in comparison to the Total need by income of 49% (4,465/9,080).
NA 10 Table 8a Cost Burden > 30% Area Median Income by Percentage
Renter Owner
0‐30% AMI
>30‐50% AMI
>50‐80% AMI Total
0‐30% AMI
>30‐50% AMI
>50‐80% AMI Total
Small Related 36% 38% 27% 100% 17% 22% 61% 100%
Large Related 41% 27% 32% 100% 16% 26% 59% 100%
Elderly 64% 25% 11% 100% 37% 35% 28% 100%
Other 38% 37% 25% 100% 32% 20% 48% 100%
Total need by income
40% 35% 25% 100% 26% 25% 49% 100%
Table 9 displays the number of households with housing cost burdens more than 50% by household type and income based on Area Median Income (AMI).
NA 10 Table 9 Cost Burden > 50%
Renter Owner
0‐30% AMI
>30‐50% AMI
>50‐80% AMI
Total 0‐30% AMI
>30‐50% AMI
>50‐80% AMI
Total
Small Related 1,860 855 40 2,755 570 690 620 1,880
Large Related 455 115 45 615 130 125 180 435
Elderly 810 125 20 955 765 375 195 1,335
Other 1,930 565 105 2,600 630 315 400 1,345
Total need by income
5,055 1,660 210 6,925 2,095 1,505 1,395 4,995
Source: 2010 CHAS Data
Table 9a shows Elderly Renters far exceed at 85% (810/955) in the 0‐30% AMI and is greater than the Total need by income of 73% (5,055/6,925). Also in the 0‐30% AMI column Large Related Renter households at 74% (455/615) and Other Renter households at 74% (1,930/2,600) have percentages greater than the Total need by income of 73%. Small Related Renters in the >30‐50% AMI at 31% (855/2,755) is greater than the Total need by income of 24% (1,660/6,925). Large Related Renters in the >50‐80% at 7% (45/615) are greater than the Total need by income of 3% (210/6,925).
Table 9a shows that Elderly Owners far exceed at 57% (765/1,335) in the 0‐30% AMI the Total need by income of 42% (2,095/4,995). In the same column, Other Owner households at 47% (630/1,345) exceed Total need by income of 42%. Small Related Owners in the >30‐50% AMI at 37% (690/1,880) exceed the Total need by income of 30% (1,505/4,995). In the >50‐80% AMI column for Owners, Small Related at 33% (620/1,880), Large Related at 41% (180/435) and Other households at 30% (400/1,345) exceed the Total need by income of 28% (1,395/4,995).
NA 10 Table 9a Cost Burden > 50% by Percentage
Renter Owner
0‐30% AMI
>30‐50% AMI
>50‐80% AMI
Total 0‐30% AMI
>30‐50% AMI
>50‐80% AMI
Total
Small Related 68% 31% 0.01% 100% 30% 37% 33% 100%

Large Related 74% 19% 7% 100% 30% 29% 41% 100%
Elderly 85% 13% 2% 100% 57% 28% 15% 100%
Other 74% 22% 4% 100% 47% 23% 30% 100%
Total need by income
73% 24% 3% 100% 42% 30% 28% 100%
Table 10 shows the number of households that are overcrowded, defined by HUD as households with more than one person per room excluding bathrooms, porches, foyers, halls or half‐rooms. The data is presented by household type, tenancy, and household income based on Area Median Income (AMI).
NA 10 Table 10 Crowding Information
Renter Owner
0‐30% AMI
>30‐50% AMI
>50‐80% AMI
>80‐100% AMI
Total 0‐30% AMI
>30‐50% AMI
>50‐80% AMI
>80‐100% AMI
Total
Single family households 545 550 750 0 1,845 100 175 355 0 630
Multiple, unrelated family households 0 10 55 0 65 0 10 70 0 80
Other, non‐family households 35 20 35 0 90 0 0 0 0 0
Total need by income
580 580 840 0 2,000 100 185 425 0 710
Source: ACS – Per HUD IDIS
Table 10a shows Single family household Renters in the 0‐30% AMI at 30% (545/1,845) and Other, non‐family households at 39% (35/90) exceed the Total need by income of 29% (580/2,000). Single family households in the >30‐50% AMI at 30% (550/1,845) exceed the Total need by income of 29% (580/2,000). Multiple, unrelated family households in the >50‐80% AMI at 85% (55/65) far surpasses the Total need by income of 42% (840/2,000).
Single family household Owners in the 0‐30% AMI at 16% (100/630) exceed the Total need by income of 14% (100/710). Single family household Owners in the 30‐50% AMI at 28% (175/630) exceeds the Total need by income of 26% (185/710). Also Multiple, unrelated family household Owners at >50‐80% AMI at 88% (70/80) is greater than the Total need by income at 60% (425/710).

NA 10 Table 10a Crowding Information by Percentage
Renter Owner
0‐30% AMI
>30‐50% AMI
>50‐80% AMI
>80‐100% AMI Total
0‐30% AMI
>30‐50% AMI
>50‐80% AMI
>80‐100% AMI Total
Single family households
30% 30% 41% 0% 100% 16% 28% 56% 0% 100%
Multiple, unrelated family households
0% 15% 85% 0% 100% 0% 13% 88% 0% 100%
Other, non‐family households
39% 22% 39% 0% 100% 0% 0% 0% 0% 0%
Total need by income
29% 29% 42% 0% 100% 14% 26% 60% 0% 100%
NA 10 Table 11 Households with Children
Renter Owner
0‐30% AMI
>30%‐50% AMI
>51%‐80% AMI
Total 0‐30% AMI
>30%‐50% AMI
>51%‐80% AMI
Total
Households with Children Present
Alternate Data
HUD table; however, no information is available.
The most common housing problem is the lack of housing, especially affordable housing. Second most common housing problem is the lack of funds for general maintenance.

Most common housing problems
HUD definitions for at‐risk and imminent risk of homeless
This section introduces HUD’s definitions and guidelines that recognize at‐risk individuals and families with children, with especially low‐incomes. The outline below will help to identify and then describe at‐risk individuals and families in Anchorage.
HUD’s At‐Risk of Homelessness definition has three categories applicable to:1
1. Individuals/families who Have annual incomes below 30% AMI; AND Do not have sufficient resources or support networks immediately available to prevent literal homelessness; AND Meet at least one of the following 7 conditions:
Moved two or more times due to economic reasons in 60 days prior to application for assistance
Living in home of another due to economic hardship
Losing housing within 21 days after application date
Live in hotel/motel not paid for by charitable organizations or Fed/state/local government programs
Lives in severely overcrowded unit as defined by the US Census Bureau
Exiting publicly funded institution or system of care
Lives in housing associated with instability and increased risk of homelessness, per recipient Con Plan
2. Unaccompanied children/youth who qualify under other federal statutes Does not include children/youth who qualify under the homeless definition Does not include parents or guardians Regulations include the list of applicable other federal statutes
3. Families with Children and Youth Children/youth who qualify under the Education for Children and Youth program (§ 725(2) McKinney‐Vento Act) and the parents or guardians of that child/youth if living with him/her.
HUD recognizes imminent risk of homelessness as an individual or family who will within 14 days their primary nighttime residence provided that no subsequent residence has been identified and the individual or family lacks the resources or support networks needed to obtain other permanent housing.
Economic and Social Factors Related to Homelessness
In addition of HUD’s outline of at‐risk individuals and families with children, well known research in the field of homelessness serves as a guide to identify other populations in Anchorage who do not fit HUD’s “at‐risk” definition, but do fall under related factors for homelessness. First and foremost, it is well understood that housing is the largest expense for the majority of low‐income households; 70 percent of whom rent.2 In 2009 across the U.S. there were 10 million extremely low‐income renter households, and only 3.6 million units were affordable and available to them.3 Homelessness is essentially caused by the inability of households to pay for housing.4
There are also risk factors associated with becoming homeless, including households with issues related to: extremely low‐ and very low‐ median income, lack of employment or employability, history of incarceration, head of household or household
1 Determining Homeless and At‐Risk Status, Income, and Disability, Presentation by HUD, Community Planning and Development, December 20, 2011 and ESG Interim Rule: 576.500(c) 2 Evidence Matters, A Spotlight on Rental Market Research, HUD PD&R, Spring 2011, found at http://www.huduser.org/portal/periodicals/em/spring11/highlight2.html
3 Evidence Matters, A Spotlight on Rental Market Research, HUD PD&R, Spring 2011
4 National Alliance to End Homelessness, found at
http://www.endhomelessness.org/library/entry/the‐state‐of‐homelessness‐2013
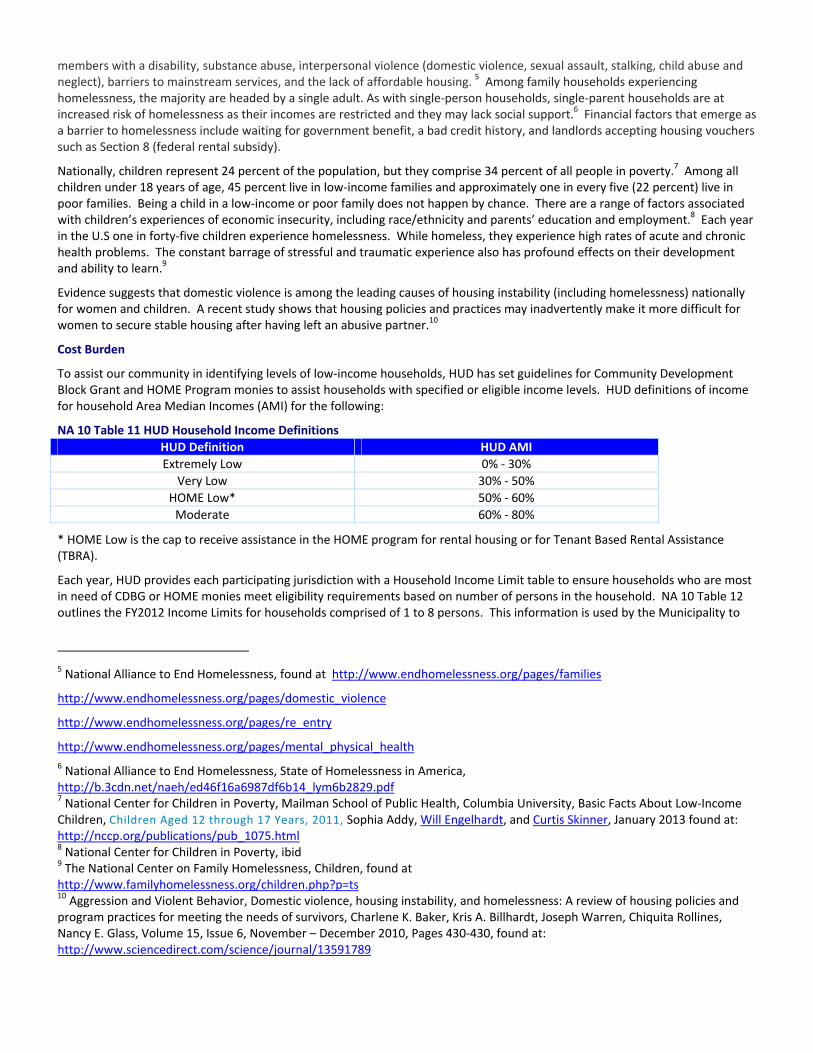
members with a disability, substance abuse, interpersonal violence (domestic violence, sexual assault, stalking, child abuse and neglect), barriers to mainstream services, and the lack of affordable housing. 5 Among family households experiencing homelessness, the majority are headed by a single adult. As with single‐person households, single‐parent households are at increased risk of homelessness as their incomes are restricted and they may lack social support.6 Financial factors that emerge as a barrier to homelessness include waiting for government benefit, a bad credit history, and landlords accepting housing vouchers such as Section 8 (federal rental subsidy).
Nationally, children represent 24 percent of the population, but they comprise 34 percent of all people in poverty.7 Among all children under 18 years of age, 45 percent live in low‐income families and approximately one in every five (22 percent) live in poor families. Being a child in a low‐income or poor family does not happen by chance. There are a range of factors associated with children’s experiences of economic insecurity, including race/ethnicity and parents’ education and employment.8 Each year in the U.S one in forty‐five children experience homelessness. While homeless, they experience high rates of acute and chronic health problems. The constant barrage of stressful and traumatic experience also has profound effects on their development and ability to learn.9
Evidence suggests that domestic violence is among the leading causes of housing instability (including homelessness) nationally for women and children. A recent study shows that housing policies and practices may inadvertently make it more difficult for women to secure stable housing after having left an abusive partner.10
Cost Burden
To assist our community in identifying levels of low‐income households, HUD has set guidelines for Community Development Block Grant and HOME Program monies to assist households with specified or eligible income levels. HUD definitions of income for household Area Median Incomes (AMI) for the following:
NA 10 Table 11 HUD Household Income Definitions
HUD Definition HUD AMI
Extremely Low 0% ‐ 30%
Very Low 30% ‐ 50%
HOME Low* 50% ‐ 60%
Moderate 60% ‐ 80%
* HOME Low is the cap to receive assistance in the HOME program for rental housing or for Tenant Based Rental Assistance (TBRA).
Each year, HUD provides each participating jurisdiction with a Household Income Limit table to ensure households who are most in need of CDBG or HOME monies meet eligibility requirements based on number of persons in the household. NA 10 Table 12 outlines the FY2012 Income Limits for households comprised of 1 to 8 persons. This information is used by the Municipality to
5 National Alliance to End Homelessness, found at http://www.endhomelessness.org/pages/families
http://www.endhomelessness.org/pages/domestic_violence
http://www.endhomelessness.org/pages/re_entry
http://www.endhomelessness.org/pages/mental_physical_health
6 National Alliance to End Homelessness, State of Homelessness in America, http://b.3cdn.net/naeh/ed46f16a6987df6b14_lym6b2829.pdf 7 National Center for Children in Poverty, Mailman School of Public Health, Columbia University, Basic Facts About Low‐Income Children, Children Aged 12 through 17 Years, 2011, Sophia Addy, Will Engelhardt, and Curtis Skinner, January 2013 found at: http://nccp.org/publications/pub_1075.html 8 National Center for Children in Poverty, ibid 9 The National Center on Family Homelessness, Children, found at http://www.familyhomelessness.org/children.php?p=ts 10 Aggression and Violent Behavior, Domestic violence, housing instability, and homelessness: A review of housing policies and program practices for meeting the needs of survivors, Charlene K. Baker, Kris A. Billhardt, Joseph Warren, Chiquita Rollines, Nancy E. Glass, Volume 15, Issue 6, November – December 2010, Pages 430‐430, found at: http://www.sciencedirect.com/science/journal/13591789

match funding with projects that apply this information to their beneficiaries. This table also illustrates the Extremely Low, Very Low, and Low income limits as described above.

NA 10 Table 12 Anchorage Household Income* in the Past 12 Months (In 2010 Inflation‐Adjusted Dollars) FY 2012 Income
Limit Area Median Income
FY 2012 Income Limit Category
1 Person
2 Person
3 Person
4 Person
5 Person
6 Person
7 Person
8 Person
Very Low (50%) Income Limits
$29,850 $34,100 $38,350 $42,600 $46,050 $49,450 $52,850 $56,250
Extremely Low (30%) Income Limits
$17,900 $20,450 $23,000 $25,550 $27,600 $29,650 $31,700 $33,750 Anchorage $85,200
Low (80%) Income Limits
$45,500 $52,000 $58,500 $65,000 $70,200 $75,400 $80,600 $85,800
Source: HUD found at http://www.huduser.org/portal/datasets/il/il2012/2012summary.odn.
Anchorage Children in Poverty
Table 14 shows the greatest percentage (41%) of male children in poverty is under the age of 5 years and between 6 to 11 years of age (28%). Female children in poverty show a similarity, with the greatest percentage (34%) of female children in poverty under 5 years of age and between 6 to 11 years of age (26%). According to the U.S. Census, a total of 7,986 Anchorage children live in poverty; with the largest percentage under five years of age.11
NA 10 Table 13 Anchorage figures for Children in Poverty
Anchorage Population Total Population for Whom Poverty Status is
Determined 281,124
Male Female
Under 5 years 1,749 41% 1,234 34%
5 years 176 4% 305 8%
6 to 11 years 1,224 28% 966 26%
12 to 14 years 498 12% 565 15%
15 years 251 6% 159 4%
16 and 17 years 416 10% 443 12%
Total 4,314 100% 3,672 100%
U.S. Census, American Community Survey, 2007‐2011 5‐Year Data for Anchorage Municipality
Poverty thresholds are the dollar amounts used to determine poverty status. The same thresholds are used throughout the United States (do not vary geographically). This information is updated annually for inflation using the Consumer Price Index for All Urban Consumers (CPI‐U). Although the thresholds in some sense reflect family needs, they are intended for use as a statistical yardstick, not as a complete description of what people and families need in order to live.
Each person or family is assigned one out of 48 possible poverty thresholds.
Thresholds vary according to:
Size of the family
Ages of the members
NA 10 Table 14 Poverty Thresholds for 2010 by Size of Family and Number of Related Children Under 18 Years
Related children under 18 years
Size of Family Unit
Weighted average
thresholds None One Two Three Four Five Six Seven Eight or
more
One person (unrelated 11,139
11 U.S. Census, American Community Survey, 2007‐2011

individual)
Under 65 years 11,344 11,344
65 years and over 10,458 10,458
Two people 14,218
Householder under 65 years 14,676 14,602 15,030
Householder 65 years and over 13,194 13,180 14,973
Three people 17,374 17,057 17,552 17,568
Four people 22,314 22,491 22,859 22,113 22,190
Five people 26,439 27,123 27,518 26,675 26,023 25,625
Six people 29,897 31,197 31,320 30,675 30,056 29,137 28,591
Seven people 34,009 35,896 36,120 35,347 34,809 33,805 32,635 31,351
Eight people 37,934 40,146 40,501 39,772 39,133 38,227 37,076 35,879 35,575
Nine people or more 45,220 48,293 48,527 47,882 47,340 46,451 45,227 44,120 43,845 42,156
Source: http://www.census.gov/hhes/www/poverty/data/threshld/thresh10.xls
At‐Risk Families with Children and Youth in Anchorage School District
The Anchorage School District (ASD), Child In Transition/Homeless (CIT/H) Project is an integral part of the District's Title I Program which provides services to homeless children and youth. The CIT/H goal is to promote school stability and success for homeless students. The McKinney‐Vento Homeless Education Assistance Improvements Act, which was reauthorized as part of No Child Left Behind in 2002, guides decisions in determining eligibility and services provided.
Homeless children and youth defined by CIT/H Project
Many families experience unemployment, job changes, health crisis, or other circumstances that can cause the loss of a permanent home. Students in homeless situations lack fixed, regular and adequate nighttime residence. Examples of homeless living situations include:
Living in an emergency shelter, transitional residence or a domestic violence shelter
Staying in a motel or hotel for economic reasons
Living with a friend, relative or someone else because they lost their home or can't afford a home
Emergency foster care or awaiting foster care placement
Living in cars, at campgrounds, or other public places
Staying in substandard housing
Living in a runaway or homeless youth shelter
CIT/H in the Anchorage community
In the 2010‐11 school year, more than 3,800 homeless children and youth were identified by CIT/H in the Anchorage community. Of these, more than 2,400 were enrolled as students in the Anchorage School District. The CIT/H staff collaborates with ASD teachers, principals, nurses and counselors, as well as community agencies to serve homeless students and their families.
In addition to the children and youth temporarily residing in shelters, the CIT/H Project also works with children and youth who stay in other transitional living situations such as tents, campgrounds, motels, cars or with friends. CIT/H staff works with parents to assist them with their roles as first educator, helper and advocate in their child's continuing educational experience.
Child in Transition Data 2008/09‐2011/12: Families, Students and Children Served
ASD is required to identify all children within the Anchorage School District that meet the Department of Education’s (DOE) definition of homeless. Families with children that meet this definition may be living in any of the following situations:

Emergency shelter
Transitional housing
Awaiting foster care placement
Car/camping
Motels*
Doubled‐up/couch surfing*
Unaccompanied youth
Families living in motels or doubled‐up may qualify if they have lost their housing and can no longer afford housing of their own.
NA 10 Table 15 ASD Children Meeting the DOE Definition of Homeless
School Year Families ASD Students Children and Youth
2007/2008 856 1,752 2,829
2008/2009 1,130 2,010 3,435
2009/2010 1,264 2,331 3,765
2010/2011 1,371 2,431 3,829
2011/2012 1,493 2,645 4,227
% Change from 2008 to 2012 +74% +51% +49%
Initial Nighttime Residence
At intake ASD is required to document where the family is currently staying and the type of living situation that is: shelter, transitional housing, and doubled‐up/couch surfing or other (includes awaiting foster care, car/camping). Child in Transition receives daily lists from Anchorage shelters serving families and children.

NA 10 Table 16 Living Conditions for ASD Families
Shelter Motel Doubled‐Up
Transitional Housing
Other Car / Camping
2007/08 932 274 885 196 487 28
2008/09 1041 232 1202 152 420 44
2009/10 603 253 1390 163 444 50
2010/11 849 268 1662 190 584 107
2011/12 781 360 1862 150 634 67
Number of Nighttime Residences
Because CIT provides transportation assistance to school, we usually know where our students are staying and track that information for the school year. The chart below shows the percentage of our children and youth that stayed in 1‐2 residences in the year, 3‐4, 5‐6, and 7+ for the past five years.
NA 10 Table 17 Percentage of Children/Youth Staying in a Residence per Year
1‐2 3‐4 5‐6 7+ >2
2007/08 77.7% 15.9% 5.0% 1.8% 22.3%
2008/09 78.1% 15.8% 4.3% 3.0% 21.9%
2009/10 78.2% 14.9% 7.4% 3.2% 21.8%
2010/11 79.5% 14.5% 6.2% 2.3% 20.5%
2011/12 79.3% 13.3% 3.1% 4.3% 20.7%
The following NA Tables are from ASD Children In Transition/Homeless Data.
NA 10 Table 18 Episodes of Homelessness 2004/2005 ‐ 2008/2009

NA 10 Table 19 Episodes of Homelessness 2005/2006 ‐ 2009/2010
Episodes of Homelessness
2005/06‐2009/10
3834
827
23697 12
5006
1172
345109
120
1000
2000
3000
4000
5000
6000
1 Year 2 Years 3 Years 4 Years 5 Years
Only
At Least
1 Year‐‐76.6%
2 Years‐16.5%
3 Years‐‐4.7%
4 Years‐‐1.9%
5 Years‐‐0.2%
NA 10 Table 20 Episodes of Homelessness 2007‐2011
Episodes of Homelessness
2007‐2011
4319
742
15529 2
5247
928
18631 2
0
1000
2000
3000
4000
5000
6000
1 2 3 4 5
Number of Years CIT
Series2
1 Year in CIT: 82.3%
2 Years in CIT: 14.2%
3 Years in CIT: 3.0%
4 Years in CIT: 0.6%
5 Years in CIT: 0.04%
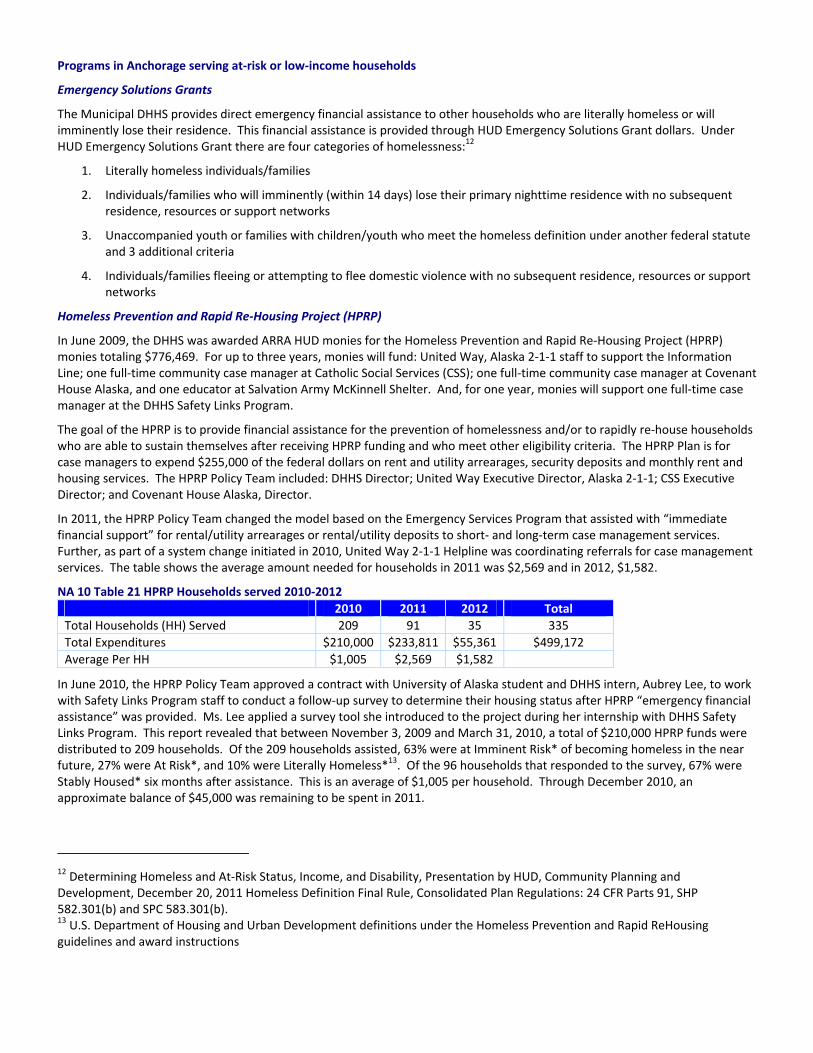
Programs in Anchorage serving at‐risk or low‐income households
Emergency Solutions Grants
The Municipal DHHS provides direct emergency financial assistance to other households who are literally homeless or will imminently lose their residence. This financial assistance is provided through HUD Emergency Solutions Grant dollars. Under HUD Emergency Solutions Grant there are four categories of homelessness:12
1. Literally homeless individuals/families
2. Individuals/families who will imminently (within 14 days) lose their primary nighttime residence with no subsequent residence, resources or support networks
3. Unaccompanied youth or families with children/youth who meet the homeless definition under another federal statute and 3 additional criteria
4. Individuals/families fleeing or attempting to flee domestic violence with no subsequent residence, resources or support networks
Homeless Prevention and Rapid Re‐Housing Project (HPRP)
In June 2009, the DHHS was awarded ARRA HUD monies for the Homeless Prevention and Rapid Re‐Housing Project (HPRP) monies totaling $776,469. For up to three years, monies will fund: United Way, Alaska 2‐1‐1 staff to support the Information Line; one full‐time community case manager at Catholic Social Services (CSS); one full‐time community case manager at Covenant House Alaska, and one educator at Salvation Army McKinnell Shelter. And, for one year, monies will support one full‐time case manager at the DHHS Safety Links Program.
The goal of the HPRP is to provide financial assistance for the prevention of homelessness and/or to rapidly re‐house households who are able to sustain themselves after receiving HPRP funding and who meet other eligibility criteria. The HPRP Plan is for case managers to expend $255,000 of the federal dollars on rent and utility arrearages, security deposits and monthly rent and housing services. The HPRP Policy Team included: DHHS Director; United Way Executive Director, Alaska 2‐1‐1; CSS Executive Director; and Covenant House Alaska, Director.
In 2011, the HPRP Policy Team changed the model based on the Emergency Services Program that assisted with “immediate financial support” for rental/utility arrearages or rental/utility deposits to short‐ and long‐term case management services. Further, as part of a system change initiated in 2010, United Way 2‐1‐1 Helpline was coordinating referrals for case management services. The table shows the average amount needed for households in 2011 was $2,569 and in 2012, $1,582.
NA 10 Table 21 HPRP Households served 2010‐2012
2010 2011 2012 Total
Total Households (HH) Served 209 91 35 335
Total Expenditures $210,000 $233,811 $55,361 $499,172
Average Per HH $1,005 $2,569 $1,582
In June 2010, the HPRP Policy Team approved a contract with University of Alaska student and DHHS intern, Aubrey Lee, to work with Safety Links Program staff to conduct a follow‐up survey to determine their housing status after HPRP “emergency financial assistance” was provided. Ms. Lee applied a survey tool she introduced to the project during her internship with DHHS Safety Links Program. This report revealed that between November 3, 2009 and March 31, 2010, a total of $210,000 HPRP funds were distributed to 209 households. Of the 209 households assisted, 63% were at Imminent Risk* of becoming homeless in the near future, 27% were At Risk*, and 10% were Literally Homeless*13. Of the 96 households that responded to the survey, 67% were Stably Housed* six months after assistance. This is an average of $1,005 per household. Through December 2010, an approximate balance of $45,000 was remaining to be spent in 2011.
12 Determining Homeless and At‐Risk Status, Income, and Disability, Presentation by HUD, Community Planning and Development, December 20, 2011 Homeless Definition Final Rule, Consolidated Plan Regulations: 24 CFR Parts 91, SHP 582.301(b) and SPC 583.301(b). 13 U.S. Department of Housing and Urban Development definitions under the Homeless Prevention and Rapid ReHousing guidelines and award instructions

After the HPRP monies expired in 2012, the Municipality worked with Catholic Social Services, to continue the Rapid Re‐housing model using ESG funds.
Project Homeless Connect
Additional information regarding poor or low‐income families can be gleaned from Project Homeless Connect (PHC), a single day event that provides essential services and referrals to those in need. This sections reviews three years of data (2010 – 2012) collected for PHC and collapsed through the Alaska Homeless Management Information System staff into annual reports of the participants.14
For purposes of this report, rounded percentages to whole numbers were made with the exception of percentages below 1%. For this report as well, categories which were not included “Null (No Response)” or “No” responses when a “Yes” response was available. To help identify trends, percentages were used for all tables. Some information was not collected until 2011; therefore, there are missing data points in some of the 2010 columns.
Following the three year assessment, the percentage of Female and Males participants has remained consistent. The majority of PHC attendees were male (63%) in comparison to female (36%).
NA 10 Table 22 Gender of PHC Households
Total Count 2010 2011 2012
Female 282 37% 308 36% 266 36%
Male 480 62% 535 63% 463 63%
Transgender 2 .3% 1 .1% 1 0%
No Response 5 1% 3 .4% 0 0%
Total 769 100% 847 100% 730 100%
PHC Age Groups
Table NA 10 Table 23 shows the two age groups with the greatest percentage of representation and consistency over three years at PHC are 41‐50 and 51‐61.
NA 10 Table 23 Age Groups of PHC Households by Percentage 2010‐2012
Household Type 2010r 2011 2012
Less than 18 .3% 4% 0%
18 ‐ 21 4% 6% 2%
22 ‐ 30 12% 14% 14%
31 ‐ 40 17% 17% 18%
41 ‐ 50 38% 29% 29%
51 ‐ 61 21% 26% 30%
62 and over 6% 7% 6%
No Response 2% 1% 0%
Total Count 769 847 730
PHC Household Types
NA 10 Table 24 shows for Adult Households (no children) types, there was a significant percentage drop in 2011. The percentage for Households w/ Children under the age of 18 has been fairly consistent with an average of 13% over three years. In 2011, there were 149 more adults in households than in 2012 (1,129‐980). However, the average number of Adults in Households is 1.3 over a two year review.
NA 10 Table 24 PHC Household Type
Household Type 2010 2011 2012
Adult Household (no children) 82% 67% 88%
14 See Alaska Homeless Management Information website and reports at: http://www.muni.org/Departments/health/community/Pages/link.aspx

Household w/ Children under the age of 18 15% 13% 12%
Household with 2+ Adults 18%
Unaccompanied Minor (Under 18) .3% .1% 0%
Total Households 755 831 707
# of Adults in Households 1,129 980
Average # of Adults in Households 1.36 1.38
PHC Household Member Information
Beginning in 2011, NA 10 Table 25 reflects total percentage of Adults and Children with Disabilities. This table also identifies the average number of children per household. Research suggests that stable housing is important for healthy child development.15 However, children living in low‐income families are twice as likely as other children to have moved in the past year and three times as likely to live in families that rent a home. According to date collected from PHC for three years, the average number of children under the age of 18 in PHC participant homes per year is 222 (666/3 years).
NA 10 Table 25 PHC Household Member Information
Household Member Information 2010 2011 2012
# of Adults in Household 1,129 980
% of Adults with Disability 9% 14%
# of Children Under 18 in Households
200 262 204
% of Children with Disability 3% 2%
# of Attendees plus Household Members
1,391 1,184
Average Children per Household 1.9 2.3 2.4
PHC Information on Location Where Last Slept
Further, information regarding last location where the family or individual slept shows patterns of housing instability. Table 26 shows the highest percent of participants were already in an emergency shelter throughout each of the three years under review. Most likely these households represent single adult males and/or females. Many households were in the category for Renting Apartment/House or under Stayed With Friends or Family. It is most likely households in these categories are families with children.
15 National Center for Children in Poverty, referencing Aratani, Y. (2009). Homeless children and youth. New York, NY: National Center for Children in Poverty, Columbia University, Mailman School of Public Health, found at http://nccp.org/publications/pub_1075.html#9
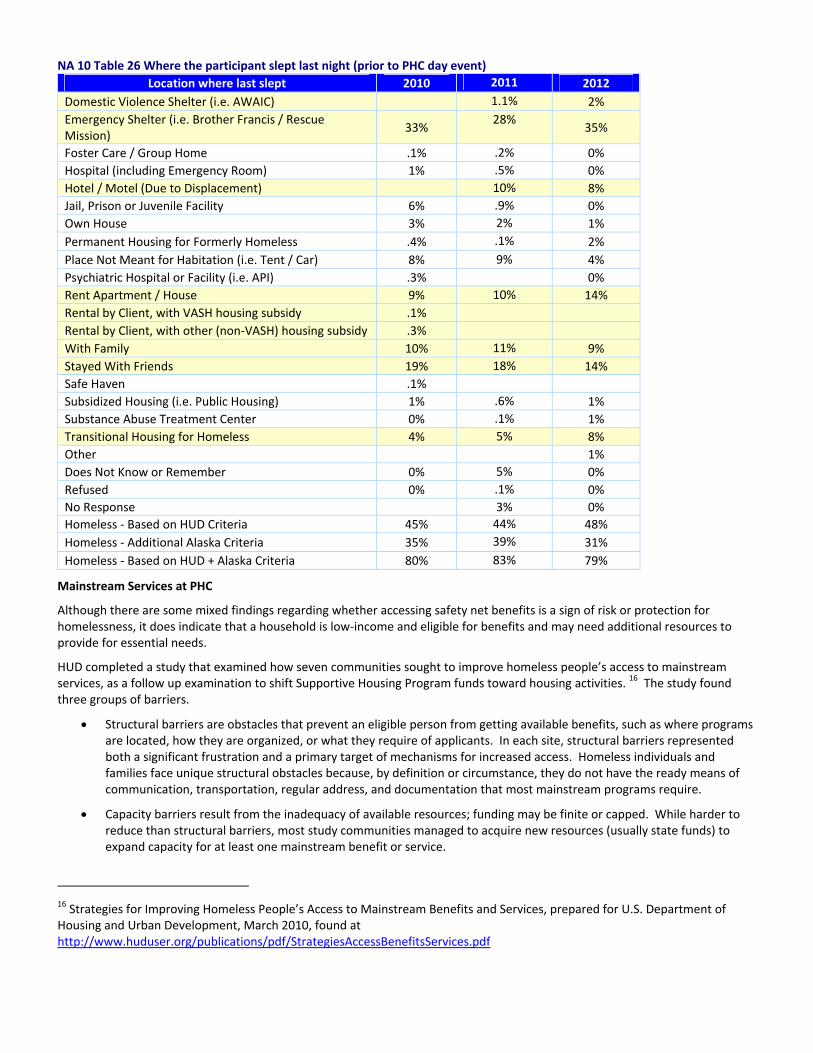
NA 10 Table 26 Where the participant slept last night (prior to PHC day event)
Location where last slept 2010 2011 2012
Domestic Violence Shelter (i.e. AWAIC) 1.1% 2%
Emergency Shelter (i.e. Brother Francis / Rescue Mission)
33% 28%
35%
Foster Care / Group Home .1% .2% 0%
Hospital (including Emergency Room) 1% .5% 0%
Hotel / Motel (Due to Displacement) 10% 8%
Jail, Prison or Juvenile Facility 6% .9% 0%
Own House 3% 2% 1%
Permanent Housing for Formerly Homeless .4% .1% 2%
Place Not Meant for Habitation (i.e. Tent / Car) 8% 9% 4%
Psychiatric Hospital or Facility (i.e. API) .3% 0%
Rent Apartment / House 9% 10% 14%
Rental by Client, with VASH housing subsidy .1%
Rental by Client, with other (non‐VASH) housing subsidy .3%
With Family 10% 11% 9%
Stayed With Friends 19% 18% 14%
Safe Haven .1%
Subsidized Housing (i.e. Public Housing) 1% .6% 1%
Substance Abuse Treatment Center 0% .1% 1%
Transitional Housing for Homeless 4% 5% 8%
Other 1%
Does Not Know or Remember 0% 5% 0%
Refused 0% .1% 0%
No Response 3% 0%
Homeless ‐ Based on HUD Criteria 45% 44% 48%
Homeless ‐ Additional Alaska Criteria 35% 39% 31%
Homeless ‐ Based on HUD + Alaska Criteria 80% 83% 79%
Mainstream Services at PHC
Although there are some mixed findings regarding whether accessing safety net benefits is a sign of risk or protection for homelessness, it does indicate that a household is low‐income and eligible for benefits and may need additional resources to provide for essential needs.
HUD completed a study that examined how seven communities sought to improve homeless people’s access to mainstream services, as a follow up examination to shift Supportive Housing Program funds toward housing activities. 16 The study found three groups of barriers.
Structural barriers are obstacles that prevent an eligible person from getting available benefits, such as where programs are located, how they are organized, or what they require of applicants. In each site, structural barriers represented both a significant frustration and a primary target of mechanisms for increased access. Homeless individuals and families face unique structural obstacles because, by definition or circumstance, they do not have the ready means of communication, transportation, regular address, and documentation that most mainstream programs require.
Capacity barriers result from the inadequacy of available resources; funding may be finite or capped. While harder to reduce than structural barriers, most study communities managed to acquire new resources (usually state funds) to expand capacity for at least one mainstream benefit or service.
16 Strategies for Improving Homeless People’s Access to Mainstream Benefits and Services, prepared for U.S. Department of Housing and Urban Development, March 2010, found at http://www.huduser.org/publications/pdf/StrategiesAccessBenefitsServices.pdf

Eligibility barriers are program rules that establish the criteria for who may receive the benefit as well as time limits on receipt. Many eligibility restrictions are embedded in federal policy and cannot easily be influenced at the local level.
Although Anchorage does not have a similar study to compare to HUD’s study, a review of PHC information shows the highest percentage identifying a primary source of cash include: Social Security (SSI, SSDI, SSA), Adult Public Assistance, and Native Dividends. Data was not available for 2010; however, the two year coverage displays consistent percentages for each mainstream service. Although it is important to point out: (1) the impressive drop in “Other Sources” in 2011 from 21% to 12% in 2012; and, (2) the increase of “No Income” in 2011 at 5% to 12% in 2012.
NA 10 Table 27 Participant Income
Primary Sources of Cash in Last 30 Days (Some attendees provided more than one primary source.)
Mainstream Services 2011 2012
Adult Public Assistance 16% 14%
ATAP / TANF 6% 3%
Child Support .8% 1%
Family / Friend Gifts 7% 6%
Native Dividends 13% 13%
Panhandling 4% 3%
Pension 1%
Social Security (SSI / SSDI / SSA) 23% 26%
Unemployment 10% 9%
Wages 9% 12%
Other Sources 21% 12%
No Income 5% 12%
PHC Participant History of Homelessness, Employability and Health Insurance
Table 28 shows consistency at “4+ times for “homeless over the three year span”. However, the “1 to 3 times” percentage rose from 54% to 67%. It will be important to compare this trend to information collected for 2013 PHC.
NA Table 28 Participant History of Homelessness and General Information
Participant History of Homelessness, Employment, Health Care, Veteran Status, and Receipt of Eviction Notice
Participant Response 2010 2011 2012
0 times 1% 9%
1 to 3 times 54% 67%
4+ times 24% 21% 23%
Times Homeless in Last 3 Years
Total Homeless (Homeless in Last 3 Years)
75% 91%
Employed Yes 8% 9%
Has Health Care (e.g. Indian Health Care, Denali Kid Care, etc.)
Yes
72% 74%
U.S. Military Veteran Yes 13% 15% 16%
Received Eviction Notice this Month (if Housed)
Yes 6%
5% 6%
Additional information from the PHC also identified characteristics of homelessness, such as chronic substance abuse, domestic violence, mental illness, and physical disability.
PHC Participant Conditions Affecting Homeless or At‐Risk for Homelessness
NA 10 Table 29 Participant identifying conditions affecting their ability to retain housing
Conditions Affecting Ability to Retain Housing
Participant Response 2010 2011 2012
Chronic Substance Abuse Yes 27% 20% 22%

Yes (Women) 29% 9% 9%
Yes (Men) 4% 4% 4% Domestic Violence
Yes (Total % of Participants) 13% 13% 4%
HIV / AIDS Yes 8% 1% 0.5%
Mental Illness Yes 21% 15% 14%
Physical Disability Yes 30% 22% 20%
Continuum of Care Funded Agencies Assistance for Participants to Mainstream Services
According to information collected for the Anchorage CoC FY2012 Application, for participants who were engaged in CoC‐funded projects 70% were receiving mainstream benefits at program exit.17 The Anchorage CoC far surpassed HUD’s national goal of 20% for CoCs across the country.
A significant number of CoC‐funded agency beneficiaries rely on Medicaid and Medicare Health Insurance, Supplemental Nutritional Assistance Program, and, Section 8, Public Housing, Rental Assistance. To continue meeting and surpassing the national goal the CoC‐funded agencies will: support case manager trainings by ACMHS for SSI/SSDI Outreach, Access, & Recovery otherwise known as SOAR, funded by the AK Mental Health Trust Authority; ensure all mainstream benefits are available at Project Homeless Connect (ACH); support RurAL CAP’s hosting quarterly training sessions to complete mainstream assessment during intakes; support AWAIC’s partnerships with AHFC to implement voucher programs for the Empowering Choice Housing Program (95 vouchers); ACH will work to ensure mainstream benefit organizations are members of the CoC; and, ACH will email SOAR training announcements.
17 CoC‐funded agencies included in the 70% are: Covenant House Alaska, Rights of Passage; Abused Women’s Aid In Crisis, Inc, Moving Forward Program; RurAL CAP, Homeward Bound; Anchorage Housing Initiatives (AHI), Coming Home I; Alaska Housing Finance Corporation (AHFC), Anchorage Community Mental Health Services (ACHMS) Supportive Permanent Housing; ACMHS, Transitional SRO Housing Project; AHFC, RurAL CAP, Sponsor Based Rental Assistance; AHFC, Four As SRA; AHFC, AHI Coming Home II; Four As 6‐Plex Project.

Cost Burden
To assist our community in identifying levels of low‐income households, HUD has set guidelines for Community Development Block Grant and HOME Program monies to assist households with specified or eligible income levels. HUD definitions of income for household Area Median Incomes (AMI) for the following:
NA 10 Table 11 HUD Household Income Definitions
HUD Definition HUD AMI
Extremely Low 0% ‐ 30%
Very Low 30% ‐ 50%
HOME Low* 50% ‐ 60%
Moderate 60% ‐ 80%
* HOME Low is the cap to receive assistance in the HOME program for rental housing or for Tenant Based Rental Assistance (TBRA).
Each year, HUD provides each participating jurisdiction with a Household Income Limit table to ensure households who are most in need of CDBG or HOME monies meet eligibility requirements based on number of persons in the household. NA 10 Table 12 outlines the FY2012 Income Limits for households comprised of 1 to 8 persons. This information is used by the Municipality to match funding with projects that apply this information to their beneficiaries. This table also illustrates the Extremely Low, Very Low, and Low income limits as described above.
NA 10 Table 12 Anchorage Household Income* in the Past 12 Months (In 2010 Inflation‐Adjusted Dollars) FY 2012 Income
Limit Area
Median Income
FY 2012 Income Limit Category
1 Person
2 Person
3 Person
4 Person
5 Person
6 Person
7 Person
8 Person
Very Low (50%) Income
Limits
$29,850 $34,100 $38,350 $42,600 $46,050 $49,450 $52,850 $56,250
Extremely Low (30%)
Income Limits
$17,900 $20,450 $23,000 $25,550 $27,600 $29,650 $31,700 $33,750 Anchorage $85,200
Low (80%) Income Limits
$45,500 $52,000 $58,500 $65,000 $70,200 $75,400 $80,600 $85,800
Source: HUD found at http://www.huduser.org/portal/datasets/il/il2012/2012summary.odn.

NA 15 Table 1 0%‐30% of Area Median Income Disproportionate: = or > 34% for Owner and = or > 74% for Renter
Population Has one or more of
four housing problems
Has none of the four housing problems
Household has no/negative
income, but none of the other housing
problems
Percentage with Housing Problems
Owner Renter Owner Renter Owner Renter Owner Renter
All 2,600 6,775 220 345 170 540 24% 64%
White 1,695 3,555 130 155 170 415 28% 58%
Black 235 1,255 0 0 0 0 16% 84%
American Indian/AK Native 215 715 35 110 0 35 19% 64%
Hispanic 195 470 0 0 0 70 27% 64%
Other 140 380 0 0 0 10 26% 72%
Asian 115 315 0 55 0 0 24% 65%
Pacific Islander 0 85 0 25 0 15 0% 68%
Source: CHAS Data, 2006 – 2008, Table 1

NA 15 Table 2 30.1%‐50% of Area Median Income Disproportionate: = or > 35% for Owner and = or > 62% for Renter
Population Has one or more of four housing
problems
Has none of the four housing problems
Household has no/negative
income, but none of the other housing
problems
Percentage with Housing Problems
Owner Renter Owner Renter Owner Renter Owner Renter
All 2,695 5,535 925 1,005 0 585 25% 52%
White 1,485 365 705 530 0 305 44% 11%
Black 355 235 20 55 0 90 47% 31%
American Indian/ AK Native 355 460 40 110 0 0 37% 48%
Hispanic 265 570 35 125 0 10 26% 57%
Other 215 545 15 0 0 0 28% 70%
Asian 25 200 85 65 0 170 5% 37%
Pacific Islander 0 3,165 30 120 0 10 0% 95%
Source: CHAS Data, 2006 – 2008, Table 1

NA 15 Table 3 50.1%‐80% of Area Median Income Disproportionate: = or > 34% for Owner and = or > 36%for Renter
Population Has one or more of four housing
problems
Has none of the four housing problems
Household has no/negative income, but none of the other housing problems
Percentage with Housing Problems
Owner Renter Owner Renter Owner Renter Owner Renter
All 4,340 4,630 3,205 4,930 0 750 24% 26%
White 3,020 2,765 2,430 3,165 0 510 25% 23%
Black 505 760 100 280 0 160 28% 42%
American Indian/AK Native 420 355 195 225 0 20 35% 29%
Hispanic 215 285 190 555 0 0 17% 23%
Other 90 270 0 20 0 0 24% 71%
Asian 90 145 145 290 0 55 12% 20%
Pacific Islander 0 50 150 390 0 0 0% 8%
Source: CHAS Data, 2006 – 2008, Table 1

NA 15 Table 4 NA 15 – 80.1%‐100% of Area Median Income Disproportionate: = or > 24% for Owner and = or > than 12% for Renter
Population Has one or more of four housing
problems
Has none of the four housing problems
Household has no/negative income, but none of the other housing problems
Percentage with Housing Problems
Owner Renter Owner Renter Owner Renter Owner Renter
All 9,100 1,405 39,220 12,740 0 745 14% 2%
White 6,600 760 33,575 9,400 0 530 13% 1%
Black 705 290 995 985 0 40 23% 10%
American Indian/AK Native 540 160 1,545 395 0 10 20% 6%
Hispanic 460 75 940 590 0 10 22% 4%
Other 395 60 0 120 0 0 69% 10%
Asian 290 45 1,445 725 0 35 11% 2%
Pacific Islander 115 15 725 520 0 30 8% 1%
Source: CHAS Data, 2006 – 2008, Table 1

NA 20 Table 1 0%‐30% Area Median Income Disproportionate: = or > 39% for Owner and = or > 66% for Renter
Population Has Severe Housing
Problem
Does not have Severe Housing
Problem
Household has no/negative income, but none of the other housing problems
Percentage with Severe Housing Problems
Owner Renter Owner Renter Owner Renter Owner Renter
All 2,365 6,000 455 1,125 170 540 29% 56%
White 1,570 3,220 255 490 170 415 35% 53%
Black 235 1,150 0 105 0 0 19% 77%
Asian 95 210 55 215 0 35 18% 34%
American Indian/AK Native 145 715 130 0 0 70 16% 67%
Pacific Islander 0 85 0 0 0 10 0% 89%
Hispanic 180 345 15 180 0 0 33% 48%
Other 140 280 0 130 0 15 33% 50%
Source: CHAS Data, 2006 – 2008, Table 2

NA 20 Table 2 30.1%‐50% Area Median Income Disproportionate; = or > 26% for Owner and = or > 30% for Renter
Population Has Severe Housing
Problem Does not have Severe Housing Problem
Household has no/negative income, but none of the other housing problems
Percentage with Severe Housing
Problems
Owner Renter Owner Renter Owner Renter Owner Renter
All 1,760 2,170 1,865 4,360 0 595 16% 20%
White 885 1,055 1,305 2,640 0 305 14% 17%
Black 245 325 35 190 0 90 28% 37%
Asian 180 70 220 275 0 0 24% 9%
American Indian/AK Native 135 55 115 425 0 20 18% 7%
Pacific Islander 0 105 15 95 0 0 0% 49%
Hispanic 290 330 145 310 0 170 23% 27%
Other 25 230 30 430 0 10 3% 32%
Source: CHAS Data, 2006 – 2008, Table 2

NA 20 Table 3 50.1%‐80% Area Median Income Disproportionate: = or > 19% for Owner and = or > 12% for Renter
Population Has Severe
Housing Problem
Does not have Severe Housing
Problem
Household has no/negative
income, but none of the other
housing problems
Percentage with Severe Housing
Problems
Owner Renter Owner Renter Owner Renter Owner Renter
All 1,625 375 5,920 9,170 0 765 9% 2%
White 1,205 245 4,240 5,670 0 530 10% 2%
Black 40 45 150 995 0 160 3% 3%
Asian 215 10 405 500 0 20 19% 1%
American Indian/AK Native 15 0 265 705 0 0 2% 0%
Pacific Islander 0 0 0 70 0 0 0% 0%
Hispanic 60 0 590 645 0 55 4% 0%
Other 85 75 275 585 0 0 8% 7%
Source: CHAS Data, 2006 – 2008, Table 2

NA 20 Table 4 80.1%‐95% Area Median Income Disproportionate: = or > 13% for Owner and = or > 11% for Renter
Population Has Severe Housing
Problem Does not have Severe Housing Problem
Household has no/negative income, but none of the other housing problems
Percentage with Severe Housing
Problems
Owner Renter Owner Renter Owner Renter Owner Renter
All 225 70 4,875 2,985 0 310 3% 1%
White 155 40 3,580 2,160 0 185 3% 1%
Black 0 0 200 225 0 0 0% 0%
Asian 15 20 370 160 0 0 3% 4%
American Indian/AK Native 35 10 315 90 0 80 7% 2%
Pacific Islander 0 0 25 0 0 0 0% 0%
Hispanic 0 0 320 225 0 15 0% 0%
Other 10 0 70 125 0 30 4% 0%
Source: CHAS Data, 2006 – 2008, Table 2
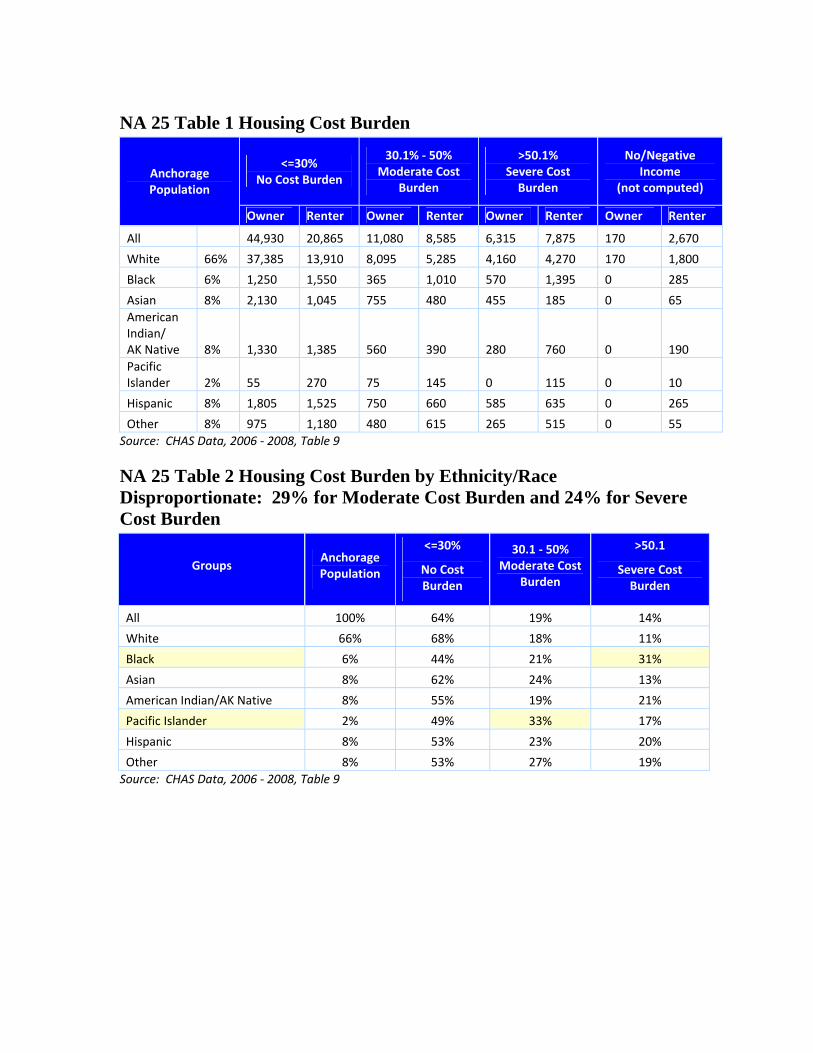
NA 25 Table 1 Housing Cost Burden
<=30% No Cost Burden
30.1% ‐ 50% Moderate Cost
Burden
>50.1% Severe Cost Burden
No/Negative Income
(not computed) Anchorage Population
Owner Renter Owner Renter Owner Renter Owner Renter
All 44,930 20,865 11,080 8,585 6,315 7,875 170 2,670
White 66% 37,385 13,910 8,095 5,285 4,160 4,270 170 1,800
Black 6% 1,250 1,550 365 1,010 570 1,395 0 285
Asian 8% 2,130 1,045 755 480 455 185 0 65
American Indian/ AK Native 8% 1,330 1,385 560 390 280 760 0 190
Pacific Islander 2% 55 270 75 145 0 115 0 10
Hispanic 8% 1,805 1,525 750 660 585 635 0 265
Other 8% 975 1,180 480 615 265 515 0 55
Source: CHAS Data, 2006 ‐ 2008, Table 9
NA 25 Table 2 Housing Cost Burden by Ethnicity/Race Disproportionate: 29% for Moderate Cost Burden and 24% for Severe Cost Burden
Groups Anchorage Population
<=30%
No Cost Burden
30.1 ‐ 50% Moderate Cost
Burden
>50.1
Severe Cost Burden
All 100% 64% 19% 14%
White 66% 68% 18% 11%
Black 6% 44% 21% 31%
Asian 8% 62% 24% 13%
American Indian/AK Native 8% 55% 19% 21%
Pacific Islander 2% 49% 33% 17%
Hispanic 8% 53% 23% 20%
Other 8% 53% 27% 19%
Source: CHAS Data, 2006 ‐ 2008, Table 9
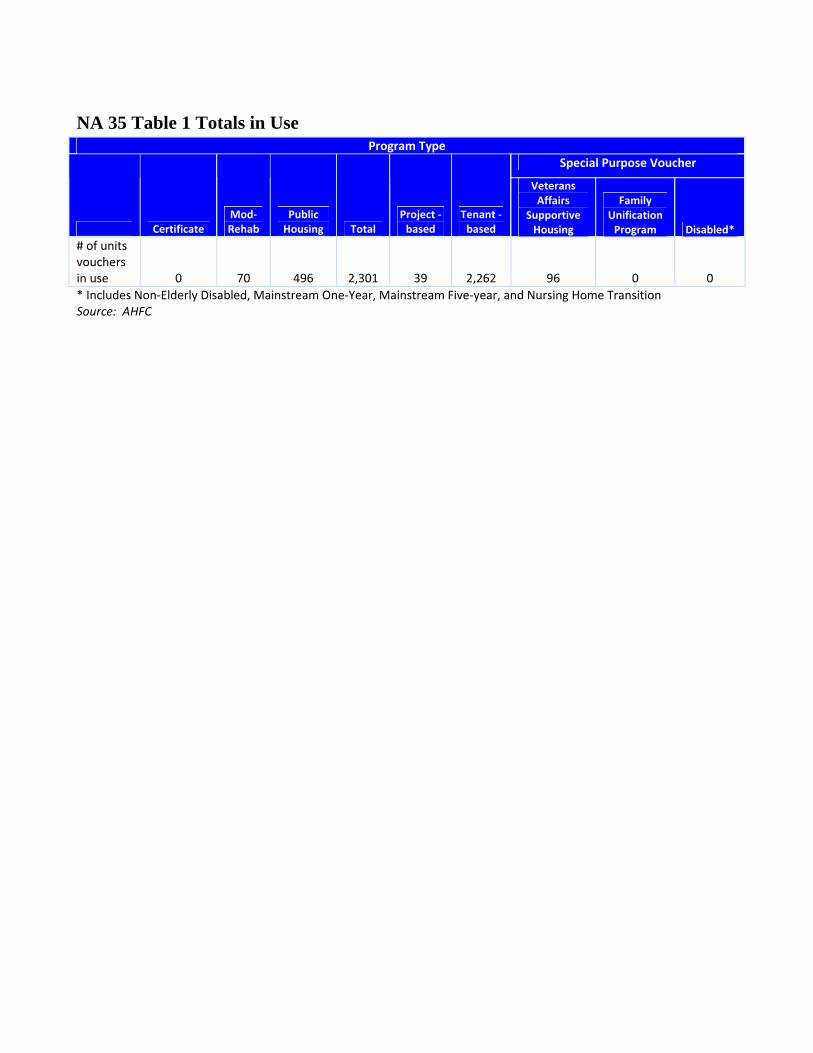
NA 35 Table 1 Totals in Use Program Type
Special Purpose Voucher
Certificate Mod‐Rehab
Public Housing Total
Project ‐based
Tenant ‐based
Veterans Affairs
Supportive Housing
Family Unification Program Disabled*
# of units vouchers in use 0 70 496 2,301 39 2,262 96 0 0
* Includes Non‐Elderly Disabled, Mainstream One‐Year, Mainstream Five‐year, and Nursing Home Transition Source: AHFC

NA 35 Table 5 Data Related to First Two Questions Type of Accessibility Type of Household
Total Hearing Mobility Sight Disabled Elderly Homeless
Public Housing (2 lists) 2,037 7 84 30 498 350 117
Housing Choice Vouchers
1,913 18 47 22 421 99 209
Source: AHFC

NA 35 Table 2 Characteristics of Residents by Program Type Program Type
Special Purpose Voucher
Certificate Mod‐Rehab
Public Housing Total
Project ‐based
Tenant ‐based
Veterans Affairs
Supportive Housing
Family Unification Program Disabled*
Average Annual Income 0 9,261 18,147 16,779 20,617 16,713 11,093 0 0 Average length of stay 0 3.3 6 6.25 N/A 6.25 1.5 0 0 Average Household size 0 1 3 2 3 2 1 0 0 # Homeless at admission 0 0 0 0 0 0 0 0 0 # of Elderly Program Participants (>62) 0 6 119 347 8 339 0 0 0 # of Disabled Families 0 26 146 804 12 792 35 0 0 # of Families requesting accessibility features 0 0 0 0 0 0 0 0 0 # of HIV/AIDS program participants 0 0 0 0 0 0 0 0 0 # of DV victims 0 0 0 0 0 0 0 0 0 * Includes Non‐Elderly Disabled, Mainstream One‐Year, Mainstream Five‐year, and Nursing Home Transition Source: AHFC

NA 35 Table 3 Race of Public Housing Residents by Program Type Program Type
Special Purpose Voucher
Race Certificate Mod‐Rehab
Public Housing Total
Project ‐based
Tenant ‐based
Veterans Affairs
Supportive Housing
Family Unification Program Disabled*
White 0 49 243 1,026 11 1,015 53 0 0
Black /African American 0 8 89 617 3 614 39 0 0
Asian 0 2 58 174 16 158 1 0 0
American Indian /Alaska Native 0 10 80 318 1 317 12 0 0
Pacific Islander 0 0 25 118 5 113 0 0 0
Other 0 1 5 45 0 45 1 0 0
* Includes Non‐Elderly Disabled, Mainstream One‐Year, Mainstream Five‐year, and Nursing Home Transition Source: AHFC

NA 35 Table 4 Ethnicity of Public Housing Residents by Program Type Program Type
Special Purpose Voucher
Race Certificate Mod‐Rehab
Public Housing Total
Project ‐based
Tenant ‐based
Veterans Affairs
Supportive Housing
Family Unification Program Disabled*
Hispanic 0 6 44 138 2 136 4 0 0
Not Hispanic 0 64 451 2,163 37 2,126 92 0 0
* Includes Non‐Elderly Disabled, Mainstream One‐Year, Mainstream Five‐year, and Nursing Home Transition Source: AHFC

NA 40 Table 1 Homeless Needs Assessment
Population
Estimate the # of persons experiencing homelessness on
a given night.
From January 26, 2011 Point in Time
Estimate the # experiencing homelessness each year.
From Annual Homeless Assessment
Report (AHAR) for Emergency Shelter (ES) & Transitional Housing (TH): Excludes
Permanent Housing
Estimate the # becoming homeless each year.
From AHAR
Living Situation Prior to Program Entry
Estimate the # exiting
homelessness each year.
From 2011 Annual
Performance Reports for Anchorage
Continuum of Care
Estimate the # of days persons
experience homelessness.
From 2011
AHAR (ES) and Annual
Performance Report (TH)
Sheltered Un‐
sheltered Total 2011 2011 2011
2011 AHAR ES
2011 APR TH
Persons in Households with Adult(s) and Child(ren)
405 24 429 1,257 131 236 35 195
Persons in Households with Only Children
12 0 12 120 9 20 14* 221*
Persons in Households with Only Adults
665 117 782 5,323 797 78 33 152
Total 1,082 141 1,223 6,700 937 334
Chronically Homeless Individuals
94 18 112 766 255 36 64 115
Chronically Homeless Families
15 2 17 144 21 28 32 143
Veterans 168 31 199 607 106 25 127
Unaccompanied Child/ Youth
6 0 6 113 17 20 14 221
Persons with HIV
21 2 23 4 18
Persons with Disability
911 134
Source: 2011 Point in Time, Alaska Homeless Management Information System data for 2011 as provided by Sandy Olibrice at [email protected]; Dewayne Harris, HAND Commission; John Pendrey, Anchorage Veterans Administration; and, Covenant House Alaska, Alaska FY 11 At A Glance, www.covenanthouseak.org

HUD Definitions for NA 40 Table 1
Homeless Management Information System The U.S. Department of Housing and Urban Development was directed by Congress to work with jurisdictions to gather homeless data by 2004. The following reports and materials provide communities with valuable direction and technical assistance resources on strategies to collect information on homeless persons. Congress noted that jurisdictions should be collecting an array of data on homelessness in a Homeless Management Information System (HMIS), including unduplicated counts, use of services and the effectiveness of the local homeless assistance system. In turn, local jurisdictions collect the data and submit reports to HUD for Congressional review.
The Alaska HMIS (AKHMIS) provides for data collection, training, and assists in meeting reporting requirements to HUD such as the Annual Homeless Assessment Report (AHAR). Other reports such as Point‐in‐Time, Housing Inventory Chart, and Project Homeless Connect in Anchorage, Fairbanks, and the Mat‐Su Valley are also generated by the system. To date 57 homeless provider programs participate in AKHMIS.
Homeless On December 5, 2011, HUD published the final rule on the definition of homelessness under the Homeless Emergency Assistance and Rapid Transition Housing (HEARTH) Act, Federal Register/Vol.76. No. 233. This rule integrates the regulation for the definition of “homeless” and the corresponding recordkeeping requirements, and is applicable to the Emergency Solutions Grants Program, the Shelter Plus Care Program, and the Supportive Housing Program.
Individuals and families who lack a fixed, regular, and adequate nighttime residence and includes a subset for an individual who resided in an emergency shelter or a place not meant for human habitation and who is exiting an institution where he or she temporarily resided;
Individual and families who will imminently lose their primary nighttime residence;
Unaccompanied youth (under 25) and families with children and youth who are defined as homeless under other federal statutes who do not otherwise qualify as homeless under this definition; and,
Individuals and families who are fleeing, or are attempting to flee, domestic violence, dating violence, sexual assault, stalking or other dangerous or life‐threatening conditions that related to violence.
Chronically Homeless Individuals and Families Person(s) who lives or resides in a place not meant for human habitation, a safe haven, or in an emergency shelter; or, has been living or residing in a place not meant for human habitation, a safe haven, or in an emergency shelter continuously for at least 1 year or on at least 4 separate occasions in the last 3 years; and is adult head of household (or a minor head of household if no adult is present in the household) with a diagnosable substance use disorder, serious mental illness, developmental disability (as defined in section 102 of the Developmental Disabilities Assistance and Bill of Rights Act of 2000 (42 U.S.C. 15002)), post traumatic stress disorder, cognitive impairments resulting from a brain injury, or chronic physical illness or disability, including the co‐occurrence of 2 or more of those conditions.
Unaccompanied Youth Person under 25 years of age, or families with children and youth, who do not otherwise qualify as homeless under this definition, but who do meet all of the following criteria:
Are defined as homeless under Section 387 of the Runaway and Homeless Youth Act (42 U.S.C. 5732a), Section 637 of the Head Start Act (42 U.S.C. 9832), Section 41403 of the Violence Against Women Act of 1994 (42 U.S.C. 14043e‐2), Section 330(h) of the Public Health Service Act (42 U.S.C. 254b(h)), Section 3 of the Food and Nutrition Act of 2008 (7 U.S.C. 2012), Section 17(b) of the Child Nutrition Act of 1966 (42 U.S.C. 1786(b)), or Section 725 of the McKinney‐Vento Homeless Assistance Act (42 U.S.C. 11434a);

Have not had a lease, ownership interest, or occupancy agreement in permanent housing at any time during the 60 days immediately preceding the date of application for homeless assistance;
Have experienced persistent instability as measured by two or more moves during the 60‐day period immediately preceding the date of applying for homeless assistance; and,
Can be expected to continue in such status for an extended period of time because of chronic disabilities, chronic physical health or mental health conditions, substance addiction, histories of domestic violence or childhood abuse (including neglect), the presence of a child or youth with a disability, or two or more barriers to employment, which include the lack of a high school degree or General Education Development (GED), illiteracy, low English proficiency, a history of incarceration or detention for criminal activity, and a history of unstable employment.
Persons with a Disability Any person who has a physical or mental impairment that substantially limits one or more major life activities; has a record of such impairment; or, is regarded as having impairment. In general, a physical or mental impairment includes hearing, mobility and visual impairments, chronic alcoholism, chronic mental illness, AIDS, AIDS Related Complex, and mental retardation that substantially limit one or more major life activities. Major life activities include walking, talking, hearing, seeing, breathing, learning, performing manual tasks, and caring for oneself.
Permanent Housing Community‐based housing with a designated length of stays, and includes both permanent supportive housing and permanent housing without supportive services.
Transitional Housing Housing that facilitates the movement of individuals and families experiencing homelessness to permanent housing within 24 months.
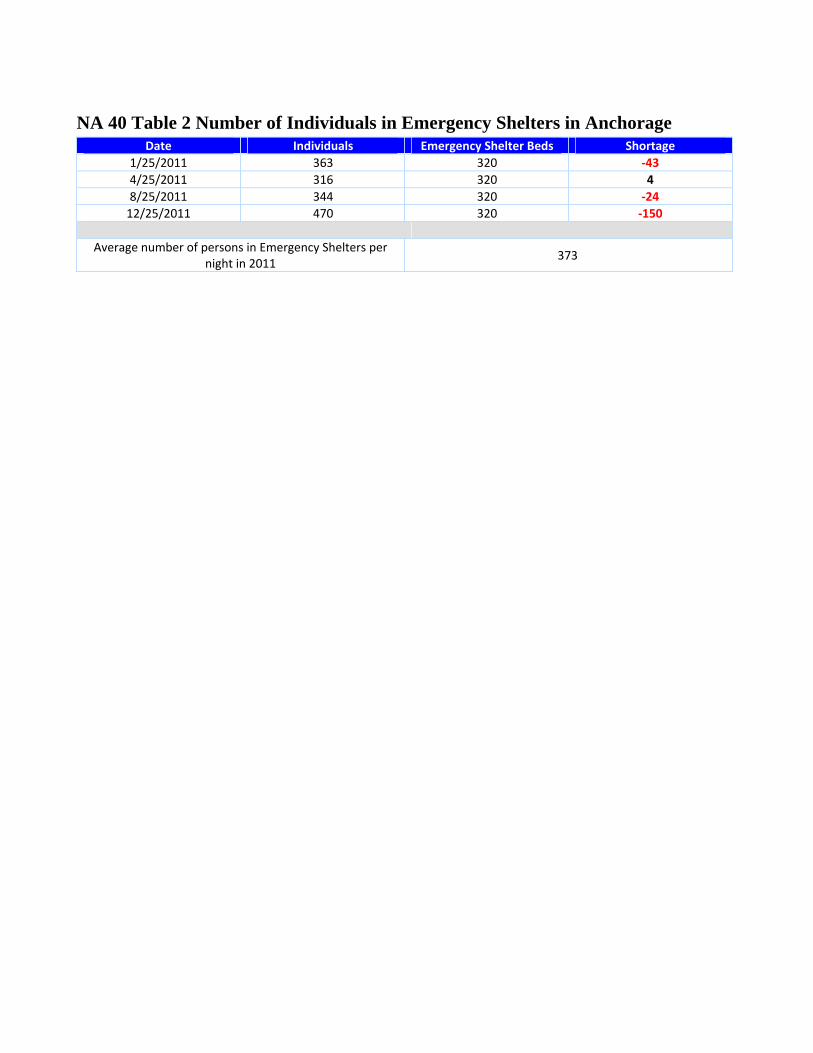
NA 40 Table 2 Number of Individuals in Emergency Shelters in Anchorage Date Individuals Emergency Shelter Beds Shortage
1/25/2011 363 320 ‐43
4/25/2011 316 320 4
8/25/2011 344 320 ‐24
12/25/2011 470 320 ‐150
Average number of persons in Emergency Shelters per night in 2011
373

NA 40 Table 3 Veterans
Individual Veterans
% of Veterans
Veteran Family
% of Veterans Total Veterans
Emergency Shelter
530 16% 14 4% 544
Transitional Housing
61 15% 2 1% 63
Total 591 16 607

NA 40 Table 4 Race/Ethnic Groups in Emergency Shelters or Transitional Housing
Race or Ethnic Group
Emergency Services Individual
Transitional Housing Individual
Emergency Services Families
Transitional Housing Families
Total for ES & TH
% of Homeless Population
Anchorage Populatio
n
White Non‐Hispanic 1233 154 128 75 1,590 30% 62%
White Hispanic/Latino 69 6 19 15 109 2% 8%
Black or African American 394 46 113 33 586 11% 6%
Asian 46 3 13 2 64 1% 8%
American Indian/AK Native 1616 103 197 154 2070 39% 8%
Native Hawaiian/Pacific Islander 70 5 148 56 279 5% 2%
Multiple Races 429 67 113 44 653 12% 8%
Total Population: 5,351
Source: AKHMIS, DHHS, Human Services Division, Community Safety and Development Program and 2010 US Census

NA 40 Table 5 Homeless Population in Anchorage’s Emergency Shelters and Transitional Housing: By Race or Ethnicity, Ethnic Individuals
Race or Ethnic Group
Emergency Services
for Individual
Percentage of ES
Homeless Population
Anchorage Population
Race or Ethnic Group
Transitional Housing for Individuals
Percentage of TH Homeless Population
Anchorage Population
White Non‐Hispanic
1,233 32% 62%
White Non‐Hispanic
154 40% 62%
White Hispanic/Latino
69 2% 8%
White Hispanic/Latino
6 2% 8%
Black or African American
394 10% 6%
Black or African American
46 12% 6%
Asian 46 1% 8% Asian 3 1% 8%
American Indian/AK Native
1,616 42% 8%
American Indian/AK Native
103 27% 8%
Native Hawaiian/Pac Islander
70 2% 2%
Native Hawaiian/Pac Islander
5 1% 2%
Multiple Races 429 11% 8% Multiple Races 67 17% 8%
Total 3,857 100% Total 384 100%
Source: AKHMIS, DHHS, Human Services Division, Community Safety and Development Program and 2010 US Census

NA 40 Table 6 Homeless Population in Anchorage’s Emergency Shelters and Transitional Housing: By Race or Ethnicity or Ethnic Families
Race or Ethnic
Group
Emergency Services
for Families
Percentage of ES
Homeless Population
Anchorage Population
Race or Ethnic Group
Transitional Housing for Families
Percentage of TH Homeless Population
Anchorage Population
White Non‐Hispanic
128 18% 62%
White Non‐Hispanic
75 20% 62%
White Hispanic/Latino
19 3% 8%
White Hispanic/Latino
15 4% 8%
Black or African American
113 15% 6%
Black or African American
33 9% 6%
Asian 13 2% 8% Asian 2 1% 8%
American Indian/AK Native
197 27% 8%
American Indian/AK Native
154 41% 8%
Native Hawaiian/Pac Islander
148 20% 2%
Native Hawaiian/Pac Islander
56 15% 2%
Multiple Races 113 15% 8% Multiple Races 44 12% 8%
Total 731 100% Total 379 100%
Source: AKHMIS, DHHS, Human Services Division, Community Safety and Development Program and 2010 US Census

1. Newly Released Prisoners and Homelessness
The State of Alaska, Department of Corrections (DOC), released Alaska’s Five‐Year Prisoner Reentry Strategic Plan, 2011‐2016, (5‐Year Plan), which sets forth a plan for new and more effective strategies to reduce recidivism and make our communities safer. The following are excerpts of the DOC Plan.1
This 5‐ Year Plan is the culmination of the work undertaken by the Alaska Prisoner Reentry Task Force, created by the Criminal Justice Work Group in February 2010 and endorsed by Governor Sean Parnell. The Plan sets forth a seamless set of best practices aimed at reducing the number of adult offenders who return to custody, whether for a new crime or for a violation of probation or parole.
The Plan was prompted in large measure by unsettling criminal justice data: 95 percent of prisoners are eventually released from prison in Alaska; more than 289 convicted felons were released into Alaska’s communities each month in 2009 and subsequently, two out of three prisoners returned to custody within three years of their release. Alaska’s recidivism rate is far too high, both in terms of the human and financial costs.
Chapter Seven – Housing Newly Released Prisoners
Anchorage Field Probation Office observed that in 2008, field probation officers found approximately 25 percent of the felons released to Anchorage Adult Probation had no resources of any kind, including housing. The vast majority of these people were housed in the homeless shelters or in the homeless camps that have proliferated in the Anchorage area over the last several years.
An ADOC 2010 Housing Survey, reflected 30 percent of Alaska’s prisoners and probation/parolees responded to the 2010 Housing Survey of incarcerated inmates and probationers. Of those who responded, 1270 individuals or almost 40 percent reported being homeless at least once prior to their incarceration. 2
In January 2009, the Anchorage Police Department reported there were 2,962 homeless individuals living in the Anchorage area, an increase of 35 percent from 2008. 3
When individuals are released from prison or jail, the ability to access safe and secure housing within the community is crucial to their successful reentry. Studies have shown that the first month after release is a vulnerable period “during which the risk of becoming homeless and/or returning to criminal justice involvement is high.”4
In most communities to which individuals return after incarceration, accessible and affordable housing is in exceedingly short supply. The additional challenges unique to people with criminal histories make it even more difficult for them to obtain stable housing.
Although many people leaving prison or jail would like to live with family or friends, those households may be unable or unwilling to receive them.5
According to the 2007 Alaska Judicial Council recidivism study, one of the greatest contributing factors to recidivism was indigence, a condition impacting an individual’s ability to find housing.
Throughout Alaska there is an insufficient supply of accessible and affordable housing stock. In Anchorage the high cost of housing is well documented.
1 See the DOC website for more information of the Plan at: http://www.correct.state.ak.us/TskForce/documents/Five‐Year%20Prisoner%20Reentry%20Plan.pdf
2 The ADOC 2010 Housing Survey, complied by Tim Leyden. 3 Cook Inlet Tribal Council, Inc. White Paper, September 25, 2009. 4 Council of State Governments, Report of the Re‐Entry Policy Council (New York: Council of State Governments, 2005), 272. 5 Council of State Governments, Report of the Re‐Entry Policy Council, 258.

In 2009, fifty‐two percent of Anchorage residents spent more than thirty percent of their net income on housing, up eight percent from the previous year.6 A quarter of these individuals paid 75 percent of their income on housing.
In 2009, the median gross rental was over $1,000 per month, an 18 percent increase in the median gross rent over the last several years. 7 Such rental prices are completely out of reach for minimum wage earners. A minimum wage earner would have to work 99 hours of work each to pay the rent for a two bedroom housing unit in Anchorage. Or he would have to earn $17.71 an hour in order to afford to stay within the federal guidelines of 30 percent of income spent on housing.8 A minimum wage earning job is a luxury for the majority of newly released prisoners.
Illustrative of the number of people arrested for misdemeanor offenses, seventy‐eight percent of the ADOC total bookings are for misdemeanor offenses.9 On any single day, on average, 13.7 percent of the inmate population is incarcerated for a misdemeanor. Other states, recognizing the deleterious impact an arrest and short‐ term incarceration may have to the individual’s employment and housing, have started to look for other means of sanctioning non‐violent criminal conduct in lieu of incarceration.
The Housing workgroup recommends ten approaches to turn the curve in making stable housing more accessible to people with criminal convictions.
6 2009 United Way Anchorage Community Assessment
7 2009 United Way Anchorage Community Assessment
8 2009 United Way Anchorage Community Assessment
9 ISER Study

NA 50 Table 1 Top seven Public Facility needs in Anchorage Rank Public Facility High Priority
1 Homeless Facilities 223
2 Abused/Neglected Children Facilities 218
3 Mental Health Facilities 158
4 Child Care Centers 151
5 Youth Centers 150
6 Senior Centers 122
7 Handicapped Centers 121

NA 50 Table 2 Top three Public Improvement needs in Anchorage Rank Public Improvements High Priority
1 Sidewalks 151
2 Street Improvements 114
3 Flood Drainage Improvements 94

NA 50 Table 3 Top Five Public Service Needs Rank Public Service Priorities for Non‐Homeless Special Needs High Priority
1 Victims of Domestic Violence or Similar Life Threatening Condition 202
2 Persons at Risk of Homelessness 173
3 Frail Elderly 170
4 Severe Mental Illness 169
5 Families with Children 164
NA 50 Table 4 Homeless Subpopulation Priority Needs Rank Homeless ‐ Subpopulations High Priority
1 Chronically Homeless Individuals and Families 210
2 Families with children 207
3 Victims of Domestic Violence or Similar Life Threatening Condition 206
4 Unaccompanied youth 165
5 Persons with Chronic Substance Abuse 160
NA 50 Table 5 Public Service Priorities Rank Public Service Priorities High Priority
1 Handicapped Services 214
2 Youth Services 168
3 Transportation Services 168
4 Senior Services 154
5 Child Care Services 148

D. Overview of How Housing and Community Development Needs Were Determined
The Municipality administered a Housing and Community Development Needs Survey in twenty meetings. The survey outlined areas of need that included Sections for: Public Facility; Infrastructure; Public Services; and Commercial/Industrial Land Acquisition/Disposition and Infrastructure Development and Construction/Rehabilitation and Economic Development.
Community members ranked the need of services for each Section using H, M, L, N or U for priority level. Each of the rankings (H, M, L, N, and U) could be used more than once for each line item in tables related to the above sections. See NA 50 Table 6 shows a total of 340 surveys were completed at twenty community‐based meetings.
See NA 50 Table 7 below for each group, date, time and location of these meetings.
NA 50 Table 6 Priority Needs Ranking levels
Priority Level
High More of these programs are needed
Medium Services should remain at the same level
Low Less programs are needed
None There is no need for these programs
Unsure Undecided or does not have knowledge of existing service level

NA 50 Table 7 Community Survey Presentations and Survey Distribution
2013 Action Plan Presentations and
2013‐2017 Consolidated Plan Date Time Location
1
Housing and Neighborhood Development (HAND) Commission Meeting 11/2/2011 4:00 PM
Assembly Conference Room, 1st Floor, Room 155, City Hall, 632 W. 6th Avenue
2 University Area Community Council 1/4/2012 7:00 PM College Gate Elementary School, 3101 Sunflower Street
3 Downtown Community Council 1/5/2012 5:30 PM Museum , 7th Avenue
4
Housing and Neighborhood Development (HAND) Commission Meeting 1/11/2012 4:00 PM
Assembly Conference Room, 1st Floor, Room 155, City Hall, 632 W. 6th Avenue
5 Senior Citizens Advisory Commission 1/25/2012 10:00 AM Anchorage Senior Center
6
Anchorage Coalition on Homelessness General Membership Meeting 1/26/2012 1:30 PM
Alaska Mental Health Trust Authority, 3745 Community Park Loop
7 Covenant House Staff Meeting 2/2/2012 8:00 AM Covenant House ‐ 6th Avenue
8 Bean’s Café Town Hall Meeting 2/2/2012 2:30 PM Bean’s Café
9 Loussac Sogn 2/7/2012 6:00 PM Loussac Sogn Apartments, 429 D Street
10 Anchorage Women's Commission 2/8/2012 12:30 PM DHHS, 825 L Street, 4th floor conference room
11 AWAIC Shelter 2/9/2012 1:30 PM 100 W. 13th Avenue
12 Fairview Community Council 2/9/2012 6:30 PM Fairview Community Recreation Center
13 RurAL CAP All Staff Meeting 2/13/2012 10:00 AM RurAL CAP central office in Fairview
14 STAR Alaska 2/16/2012 8:00 AM 1057 W. Fireweed Lane, Suite 230
15 The Adelaide 2/16/2012 6:00 PM Adelaide Apartments, 201 E. 9th
16 Community Stakeholder Meeting 2/21/2012 6:00 PM BP Energy Center, 900 East Benson Blvd.
17 Anchorage Senior Center Social Hour 2/22/2012 12:30 PM Anchorage Senior Center
18 ACCESS Alaska 2/24/2012 11:00 AM 121 W. Fireweed Lane, Suite 105
19 Muldoon Park Strip Committee 2/27/2012 7:00 PM Safe Harbor ‐ Muldoon Road
20 Alaska CARES 3/6/2012 10:00 AM 3925 Tudor Centre Drive, SART Center

HMA Table 1 Rental Housing Needed by Affordability Renter Housing Needed by Affordability Rental Units by # of Bedrooms Total
Renter AMI 0‐1 2 3+
Rent <30% AMI or less 2,495 2,145 1,235 5,875
Rent <=30.1 to 50% 940 1,820 870 3,630
<=51.1 to 80% 15 190 630 835
Total 3,435 3,965 2,105 10,340
HMA Table 2 Owner Housing Needed by Affordability Owner Housing Needed by Affordability Owner Units by # of Bedrooms Total
Owner AMI 0‐1 2 3+
<30% AMI or less 65 645 580 1,290
% 30.1‐50% 75 240 445 760
% 50.1‐80% 30 180 520 730
% 80.1‐95% 20 50 145 215
Total 190 1,115 1,690 2,995

MA 10 Table 1 Total Housing Units
Anchorage Housing Units Total Percent Occupied and Per
Household
Total Housing Units 112,166
Occupied 104,315 95%
Owner‐Occupied 64,368 62%
Population in Owner‐Occupied (# of individuals) 177,300 2.75 Per Household
Renter‐Occupied 39,947 38%
Population in Renter‐Occupied (# of individuals) 100,383 2.51 Per Household
Vacant 7,851 7%
Source: American Community Survey, 2006‐2010 5‐Year Data for Anchorage Municipality

MA 10 Table 2 Anchorage Housing Units Occupied
Anchorage Housing Units Occupied 2000 Census 2010 Census Difference Percent Change
Total Housing Units 100,368 112,166 11,798 12%
Occupied 94,822 104,315 47,362 50%
Owner‐Occupied 56,953 64,368 7,415 13%
Population in Owner‐Occupied (# of individuals) 160,038 177,300 17,262 11%
Renter‐Occupied 37,869 39,947 2,078 5%
Population in Renter‐Occupied (# of individuals) 93,158 100,383 7,225 8%
Vacant 5,546 7,851 2,305 42%
Source: 2000 US Census, 2010 US Census

MA 10 Table 3 Vacant Housing Units
Vacant Housing Units 7,851 Percentage
For Rent 1,747 22%
Rented, not occupied 443 6%
For sale only 803 10%
Sold, not occupied 478 6%
For seasonal, recreational, or occasional use 1,680 21%
For migrant workers 144 2%
Other Vacant 2,556 33%
Source: American Community Survey, 2006‐2010 5‐Year Data for Anchorage Municipality

A relatively young group of renters between 15 to 24 years of age represent 17% of renter occupants. The table also shows the largest percentage at 29% of renters is 25 to 34 years of age, followed at 20% for renters 35 to 44 years of age.
MA 10 Table 4 Renter occupied householder by age
Renter occupied Total Percent of Renter
Occupied
Total renter occupied units 39,947
Householder 15 to 24 years 6,728 17%
Householder 25 to 34 years 11,515 29%
Householder 35 to 44 years 8,074 20%
Householder 45 to 54 years 7,036 18%
Householder 55 to 59 years 2,465 6%
Householder 60 to 64 years 1,531 4%
Householder 65 to 74 years 1,481 4%
Householder 75 to 84 years 875 2%
Householder 85 years and over 242 1%
Source: American Community Survey, 2006‐2010, 5‐Year Data for Anchorage Municipality

The largest percentage at 29% of owner householders are 45 to 54 years, followed by 35 to 44 years at 21%, and 55 to 59 years of age at 13%. In comparison to the renter occupied information in Table 4, only 2% of the occupants are between 15 to 24 years of age, and only 12% of householders between 25 to 34 years of age are householders.
MA 10 Table 5 Owner occupied householder by age
Owner occupied Total Percent of Owner
Occupied
Total Owner occupied units 64,368
Householder 15 to 24 years 998 2%
Householder 25 to 34 years 7,986 12%
Householder 35 to 44 years 13,325 21%
Householder 45 to 54 years 18,654 29%
Householder 55 to 59 years 8,160 13%
Householder 60 to 64 years 5,955 9%
Householder 65 to 74 years 6,255 10%
Householder 75 to 84 years 2574 4%
Householder 85 years and over 461 1%
Source: American Community Survey, 2006‐2010, 5‐Year Data for Anchorage Municipality

MA 10 Table 10 Anchorage 2011‐2012 Apartment Rental Costs and Vacancy Rates
2011 2012 Percentage Change
Median Vacancy Median Vacancy Median Vacancy
Number of Bedrooms Rent Rate (%) Rent Rate (%) Rent %
Rate % Change
0 $ 845 5 $ 812 4.9 4% 2%
1 $ 985 1.7 $ 1,020 1.7 4% 0%
2 $ 1,202 1.9 $ 1,240 2.4 3% 26%
3 $ 1,344 3.9 $ 1,395 4.8 4% 23%
Source: Alaska Housing Finance Corporation, Alaska Annual Rental Market Survey40
40 Alaska Housing Finance Corporation information can be found at: http://www.ahfc.us/files/5813/5723/9360/2012_rental_survey.pdf

MA 10 Table 11 Anchorage 2011‐2012 Single Family Residence Rental Costs and Vacancy Rates
2011 2012 Percentage Change
Number of Median Vacancy Median Vacancy Median Vacancy
Bedrooms Rent Rate (%) Rent Rate (%) Rent % Rate % Change
1 $897 5 $928 4.9 3% ‐2%
2 $1,381 3.6 $1,458 1.7 6% 53%
3 $1,781 3.5 $1,824 2.4 2% 31%
4 $2,127 3.9 $2,217 4.8 4% 23%
Source: Alaska Housing Finance Corporation, Alaska Annual Rental Market Survey1
1 Alaska Housing Finance Corporation, ibid

MA 10 Table 12 JBER Wait List by Grade, # of Bedrooms Needed, and Earliest Wait List Dates
Grade # of Bedrooms Needed Earliest Wait List Date Shown for
Each Grade Category Listing Total Wait List
E07‐E08 2 5/14/2012 134
E01‐E06 3 8/12/2012 51
E06‐E06 4 6/29/2012 21
E01‐E06 5 8/4/2011 55
E07‐E08 3 11/2/2011 31
E07‐E08 4 7/11/2011 6
E09 3 12/1/2010 7
E09 4 7/30/2013 1
E07‐E09 5 6/1/2012 14
O01‐O03 2 2/8/2012 48
O01‐O03 3 10/29/2012 10
O01‐O03 4 1/19/2012 8
O01‐O03 5 10/11/2011 7
O04‐O05 3 2/5/2013 7
O04‐O05 4 1/11/2013 12
O04‐O05 5 11/6/2012 2
O06 4 3/6/2011 10
Total Households on Wait List 424
Source: Information collapsed from JBER Wait List as of May 7, 2013

Table 6 Unit Size by Tenure shows Owner housing units have a greater percentage of 3 bedrooms at 78% in comparison to Renter housing units at 31%. Renter households have a higher percentage at 44% for 2 bedrooms. This reflects the owner occupied household of 2.75 in comparison to the 2.51 Renter Occupied household.
MA 10 Table 6 Unit Size by Tenure
Owners Renters
Number % Number %
No bedroom 186 0% 1,307 3%
1 bedroom 1,755 3% 8,813 22%
2 bedrooms 11,645 18% 17,859 44%
3 bedrooms 49,570 78% 12,467 31%
Total 63,156 99% 40,446 100%
Source 2005‐2009 ACS, populated by HUD

MA 15 Table 1 Median Home Value and Median Contract Rent Cost
2000 Census (Base Year)
2005‐2009 ACS (Most Recent Year)
% Change
Median Home Value 160,700 255,900 59%
Median Contract Rent 736 921 25%
Sources: 2005‐2009 ACS Data, 2000 Census (Base Year), & 2005‐2009 ACS (Most Recent Year)

MA 15 Table 5 Rent Paid
Rent Paid Number %
Less than $500 2,567 6.84%
$500‐999 19,424 51.79%
$1,000‐1,499 10,209 27.22%
$1,500‐1,999 4,019 10.72%
$2,000 or more 1,287 3.43%
Total 37,506 100.00%
Source: 2006‐2010, American Community Survey, 5‐Year Data for Anchorage Municipality

B. Availability of Sufficient Housing
There is insufficient housing for renter and owner households. Anchorage needs are reflected in the table below by renter AMI and number of bedrooms. See information in tables MA 15 Table 19 & 20.
MA 15 Table 19 Renter Market Housing Need by Affordability
Renter Market Housing Needed by Affordability
Rental Units by # of Bedrooms Total
Renter I 0‐1 2 3+
Rent <30% AMI or less 2495 2145 1235 5875
Rent <=30.1 to 50% 940 1820 870 3630
<=51.1 to 80% 15 190 630 835
Total for Each Bedroom Unit 3435 3965 2105 10340
MA 15 Table 20 Owner Market Housing Need by Affordability
Owner Housing Units Needed by Affordability
Owner Units by # of Bedrooms Total
Owner AMI 0‐1 2 3+
<30% AMI or less 65 645 580 1290
% 30.1‐50% 75 240 445 760
% 50.1‐80% 30 180 520 730
% 80.1‐95% 20 50 145 215
Total 190 1115 1690 2995

Fair Market Rates1
The U.S. Department of Housing and Urban Development (HUD) annually estimates Fair Market Rents (FMRs) for 530 metropolitan areas and 2,045 nonmetropolitan county FMR areas. By law the final FMRs for use in any fiscal year must be published and available for use at the start of that fiscal year, beginning October 1 of each calendar year. Fair Market Rents (FMRs) are primarily used to determine:
payment standard amounts for the Housing Choice Voucher program,
initial renewal rents for some expiring project‐based Section 8 contracts,
initial rents for housing assistance payment (HAP) contracts in the Moderate Rehabilitation Single Room Occupancy program (Mod Rehab), and,
rent ceiling guide in the HOME rental assistance program.
FMRs are gross rent estimates. They include the shelter rent plus the cost of all tenant‐paid utilities, except telephones, cable or satellite television service, and internet service. HUD sets FMRs to assure that a sufficient supply of rental housing is available to program participants. To accomplish this objective, FMRs must be both high enough to permit a selection of units and neighborhoods and low enough to serve as many low‐income families as possible. HUD is required to ensure that FMRs exclude non‐market rental housing in their computation. Therefore, HUD excludes all units falling below a specified rent level determined from public housing rents in HUD’s program databases as likely to be either assisted housing or otherwise at a below‐market rent, and units less than two years old.
Table 6 shows HUD’s FY2012 Fair Market Rate for Efficiency, 1 Bedroom, 2 Bedroom, 3 Bedroom, and 4 Bedroom rental units. Also included in this table are HUD’s High and Low HOME rents for (Year?).
MA 15 Table 6 Cost of Housing by Monthly Rent
Monthly Rent ($) Efficiency
(no bedroom) 1 Bedroom 2 Bedroom 3 Bedroom 4 Bedroom
Fair Market Rate (FMR) 706 803 1,007 1,450 1,766
High HOME Rent 725 826 1,036 1,386 1,526
Low HOME Rent 725 787 945 1,092 1,218
Source: HUD Fair Market Rate and HOME Rents populated in HUD’s IDIS
Table 7 compares the differences between Anchorage’s 2012 Median Rent and HUD’s FY2012 FMR which shows significant differences for Efficiency, 1, and 2 bedrooms. For Efficiency, HUD’s FMR is $106 less than the median rent, and $217 for a 1 bedroom, and $233 for a 2 bedroom. For 3 bedrooms, HUD’s FMR is $55 more than the median rent. Local data is not available to compare the 4 bedroom FMR. The comparisons mean that HUD’s lower FMR for 0, 1, and 2 bedrooms can provide a lower costing rental unit for someone who is eligible under the HOME Program. The exception is the 3 bedroom FMR which is $55 higher than the median rent.
MA 15 Table 7 2012 Median Rent compared to HUD FY2012 Fair Market
Number of 2012 Median HUD FY2012
Bedrooms Rent FMR
2012 Median Rent compared to FY2012 Fair Market
0 812 706 ‐106
1 1,020 803 ‐217
2 1,240 1,007 ‐233
3 1,395 1,450 55
Sources: Alaska Housing Finance Corporation, Alaska Annual Rental Market Survey2, and HUD FY2012 Fair Market Rate
1 HUD’s Overview of Fair Market Rates found at http://www.huduser.org/portal/datasets/fmr.html
2 Alaska Housing Finance Corporation information can be found at: http://www.ahfc.us/files/5813/5723/9360/2012_rental_survey.pdf

The HOME Program
HUD provides monies through the HOME Investment Partnership to implement local housing strategies designed to increase homeownership and affordable housing opportunities for low and very low‐income Americans. The Municipality receives HOME monies to implement this strategy of increasing homeownership and affordable housing opportunities.
Eligible uses of funds include tenant‐based rental assistance; housing rehabilitation; assistance to homebuyers; and new construction of housing. HOME funding may also be used for site acquisition, site improvements, demolition, relocation, and other necessary and reasonable activities related to the development of non‐luxury housing.
All housing developed with HOME funds must serve low‐ and very low‐income families. For rental housing, at least 90 percent of the families benefited must have incomes at or below 60 percent of the area median income; the remaining 10 percent of the families benefited must have incomes at or below 80 percent of area median income. Homeownership assistance must be to families with incomes at or below 80 percent of the area median income. Each year, HUD publishes the applicable HOME income limits by area, adjusted for family size.
HOME‐assisted rental units must have rents that do not exceed the applicable HOME rent limits. Each year, HUD publishes the applicable HOME rent limits by area, adjusted for bedroom size. For projects with five or more HOME‐assisted rental units, 20 percent of the units must be rented to very low‐income families. See Appendix C for breakout of household size and eligibility.
MA15 Table 8 2012 HUD Income Limits
2012 HUD Income Limits
For Anchorage, Alaska
Annual Income
FY 2012 Median Family Income as Determined by HUD 85,200
Household Size
Extremely Low
Income 30%
Very Low Income 50%
HOME Low Income 60%
Low/Moderate Income 80%
Median Income (est.)
1 17,900 29,850 35,820 45,500 56,875
2 20,450 34,100 40,920 52,000 65,000
3 23,000 38,350 46,020 58,500 73,125
4 25,550 42,600 51,120 65,000 85,200
5 27,600 46,050 55,260 70,200 87,750
6 29,650 49,450 59,340 75,400 94,250
7 31,700 52,850 63,420 80,600 100,750
8 33,750 56,250 67,500 85,800 107,250
Table 9 shows the greatest percentage difference between Anchorage’s 2012 Median Rent in comparison to HUD’s High HOME Rent. For 1 Bedroom there is a $194 less difference and for a 2 Bedroom, a $204 less difference. This means a renter eligible under HOME would spend far less under the High HOME rent rates and save, depending on the number of bedrooms, up to $87, $194, $204, and $59. This savings could then be used for other high need items such as transportation (gas), food and medical care.
MA 15 Table 9 2012 Median Rent compared to HIGH HOME Rent.
Number of Bedrooms
2012 Median Rent High HOME Rent 2012 Median Rent Dollars
compared to High HOME RENT Dollars
0 812 725 ‐87
1 1,020 826 ‐194
2 1,240 1,036 ‐204
3 1,395 1,336 ‐59

Table 10 shows the greatest percentage difference for 3 Bedrooms at less than $303 difference, followed by $295 for 2 Bedrooms. The comparison between the 2012 median rent and the low HOME rent provides even more savings for an eligible renter under the HOME Program. Saving $87, $233, $295, and up to $303 for housing, depending on the number of bedrooms in the rental unit.
MA 15 Table 10 2012 Median Rent compared to low HOME Rent
Number of Bedrooms
2012 Median Rent Low HOME Rent 2012 Median Rent Dollars
compared to Low HOME RENT Dollars
0 812 725 ‐87
1 1,020 787 ‐233
2 1,240 945 ‐295
3 1,395 1,092 ‐303
Rental Affordability3
Using HUD’s guidelines, a rental housing is considered to be an affordable housing unit if it is occupied by a extremely low‐income, low‐income, or moderate‐income family or individuals and bears a rent that is the lesser of (1) the Existing Section 8 Fair Market Rent for comparable units in the area or, (2) 30% of the adjusted area median income of a family whose income equals 65% of the median income for the area. With the exception that HUD may establish income ceilings higher or lower than 65% of the AMI because of prevailing levels of constructions costs or fair market rents or unusually high or low family incomes.
Rental units set at 0‐30% in Table 4 are units with a current gross rent (rent and utilities) that are affordable to households with incomes at or below 30% of HUD AMI. For these rental units, affordable is defined as gross rent less than or equal to 30% of a household’s gross income. 4 Rental units set at 30‐50% are units with a current gross rent that is affordable to households with incomes greater than 30% and less than or equal to 50% of HUD AMI Family Income. Rental units set at 50‐80% are units with a current gross rent that is affordable to households with incomes greater than 50% and less than or equal to 80% of HUD Area Median Family Income.
HUD provides the Comprehensive Housing Affordability Strategy (CHAS) data base for jurisdictions to evaluate renter and homeownership household affordability. The CHAS data is used in this section to assess renter and homeownership affordability in the municipality and refers to HUD’s “affordability mismatch”. See Appendix D.
Rental Affordability Match
Table 11 shows available number of rental occupied units by Area Median Income (AMI), followed by the percentages of households occupying the units by their AMI. This table includes a yellow highlight for the percentages of occupants who fit or
3 Guidelines for Preparing Consolidated Plan and Performance and Evaluation Report Submissions for Local Jurisdictions, U.S. Department of Housing and Urban Development, Table 2a
4 Comprehensive Housing Affordability Strategy, found at http://www.huduser.org/portal/datasets/cp/CHAS/data_doc_chas.html

match the rent by their AMI. For example, Rent <=30%, occupants match with <30% AMI or less for 0‐1 bedrooms (51%), 2 bedrooms (33%), and 3+ bedrooms (29%).
MA 15 Table 11 Renter Affordability (RHUD)
Housing Units by Affordability (RHUD) Renters Units by # of Bedrooms in Percentage Total
0‐1 2 3+
1. Rent <=30%
# occupied units 810 1,620 1,885 4,315
% occupants <30% AMI or less 51% 33% 29%
30.1‐50% 27% 30% 17%
50.1‐80% 9% 24% 29%
80.1‐95% 9% 2% 11%
95.1% AMI and above 4% 11% 15%
2. Rent <=30.1 to 50%
# occupied units 4,180 7,780 1,225 9,295
% occupants <30% AMI or less 37% 21% 13%
30.1‐50% 29% 21% 24%
50.1‐80% 22% 31% 31%
80.1‐95% 7% 8% 12%
95.1% AMI and above 6% 19% 20%
3. Rent <=51.1 to 80%
# occupied units 5,255 3,890 5,830 20,890
% occupants <30% AMI or less 17% 21% 15%
30.1‐50% 18% 21% 13%
50.1‐80% 27% 31% 33%
80.1‐95% 10% 8% 8%
95.1% AMI and above 28% 19% 31%
4. Rent >80%
# occupied units 395 1,175 3,465 5,035
% occupants <30% AMI or less 11% 2% 6%
30.1‐50% 0% 10% 2%
50.1‐80% 4% 16% 18%
80.1‐95% 20% 12% 9%
95.1% AMI and above 65% 60% 64%
Source: CHAS Data, 2006 to 2008, Table 14B Standard Affordability (RHUD 30, 50, 80, and 80+) by # of Bedrooms, ACS 3‐Year Average
Rental Affordability Mismatch
Table 12 shows the match highlighted in yellow and those with an AMI that falls below the rent highlighted in rose. Households with a higher AMI account for 49% for 0‐1, 67% for 2, and 71% for 3 bedrooms.
In the <=30% category, there is a mismatch for renters with a higher AMI for 0‐1 (49%), 2 bedrooms (67%), and 3+ bedrooms (71%). Almost three quarters of the 3+ bedrooms are occupied by renters with a higher AMI than those that match the rental unit affordability at <=30%.
In the <+30.1 to 50% category, there is a mismatch for renters with a higher AMI for 0‐1 bedrooms (34%), 2 bedrooms (58%), and 3+ bedrooms (63%). The 63% of the mismatch represents the higher AMI households occupying rental units at the <=30.1 to 50%.

In the <=51.1 to 80% category, there is a mismatch with renters with a higher AMI for 0‐1 bedrooms (38%), 2 bedrooms (8%), and 3+ bedrooms (39%).
In the >80% the mismatch is 0‐1 bedrooms (65%), 2 bedrooms (60%), and 3+ bedrooms (64%). All bedroom units available for these rental units are occupied at an average of 63% by households with a higher AMI.
MA 15 Table 12 Renter Affordability and Mismatch for Renters with a Higher AMI
Housing Units by Affordability (RHUD) Renters Units by # of Bedrooms by Percentage and Mismatch
Total
0‐1 2 3+
1. Rent <=30%
# occupied units 810 1,620 1,885 4,315
% occupants <30% AMI or less 51% 33% 29%
Mismatch % for Renters with Higher AMI 49% 67% 71%
2. Rent <=30.1 to 50%
# occupied units 4,180 7,780 1,225 9,295
% occupants <30% AMI or less 37% 21% 13%
30.1‐50% 29% 21% 24%
Mismatch % for Renters with Higher AMI 34% 58% 63%
3. Rent <=51.1 to 80%
# occupied units 5,255 3,890 5,830 20,890
% occupants <30% AMI or less 17% 21% 15%
30.1‐50% 18% 21% 13%
50.1‐80% 27% 31% 33%
Mismatch % for Renters with Higher AMI 38% 8% 39%
19%
4. Rent >80%
# occupied units 395 1,175 3,465 5,035
% occupants <30% AMI or less 11% 2% 6%
30.1‐50% 0% 10% 2%
50.1‐80% 4% 16% 18%
80.1‐95% 20% 12% 9%
Mismatch % for Renters with Higher AMI 65% 60% 64%
Source: CHAS Data, 2006 to 2008, Table 14B Standard Affordability (RHUD 30, 50, 80, and 80+) by # of Bedrooms, ACS 3‐Year Average
Table 13 shows the total number of households exceeding their affordability highlighted in rose for rent in the:
<=30.1 to 50% category totals 2,500
<51.1 to 80% category totals 6,525
>80% category totals 1,315

MA 15 Table 13 Total of Renter Units Occupied by households below Rental AMI
Housing Units by Affordability (RHUD) Renters Units by # of Bedrooms Total
0‐1 2 3+
1. Rent <=30%
# occupied units 810 1,620 1,885 4,315
% occupants <30% AMI or less 415 540 545 1,500
30.1‐50% 220 485 320 1,025
50.1‐80% 70 385 540 995
80.1‐95% 70 35 205 310
95.1% AMI and above 35 175 275 485
2. Rent <=30.1 to 50%
# occupied units 4,180 3,890 1,225 9,295
% occupants <30% AMI or less 1,535 805 160 2,500
30.1‐50% 1,200 835 295 2,330
50.1‐80% 920 1190 375 2,485
80.1‐95% 285 330 145 760
95.1% AMI and above 240 730 250 1,220
Total occupants below AMI 1,535 805 160 2,500
3. Rent <=51.1 to 80%
# occupied units 5,255 9,805 5,830 20,890
% occupants <30% AMI or less 915 1,320 860 3,095
30.1‐50% 940 1,705 785 3,430
50.1‐80% 1,425 2630 1910 5,965
80.1‐95% 510 805 440 1,755
95.1% AMI and above 1465 3345 1,835 6,645
Total occupants below AMI 1,855 3,025 1,645 6,525
4. Rent >80%
# occupied units 395 1,175 3,465 5,035
% occupants <30% AMI or less 45 20 215 280
30.1‐50% 0 115 85 200
50.1‐80% 15 190 630 835
80.1‐95% 80 145 315 540
95.1% AMI and above 255 705 2,220 3,180
Total occupants below AMI 60 325 930 1,315
Source: CHAS Data, 2006 to 2008, Table 14B Standard Affordability (RHUD 30, 50, 80, and 80+) by # of Bedrooms, ACS 3‐Year Average
Table 14 collapses all renters in each of their affordable AMI. For example all % occupants <30% AMI or less are added in each column to illustrate the total number of renters in the AMI in need of a home by number of bedrooms. Therefore, <30% AMI adds 1,535, 915, and 45 to total 2,495 in the column for 0‐1 bedrooms. In the same renter AMI for <30% AMI or less for 2 bedrooms the figures 805, 1,320 and 20 are added to total 2,145; and in the same AMI for 3+ bedrooms add 160, 860, and 215 to total 1,235. The table is further completed for remaining renters by AMI.

MA 15 Table 14 Rental Units by Affordability and Number of Bedrooms
Renter Housing Needed by Affordability Rental Units by # of Bedrooms Total
Renter AMI 0‐1 2 3+
Rent <30% AMI or less 2,495 2,145 1,235 5,875
Rent <=30.1 to 50% 940 1,820 870 3630
<=51.1 to 80% 15 190 630 835
Total 3,435 3,965 2,105 10,340
Owner Affordability5
Housing that is for purchase (with or without rehabilitation) qualifies as affordable housing if it (1) is purchased by a extremely low‐income, low‐income, or moderate‐income first‐time homebuyer who will make the housing his or her principal residence; and (2) has a sale price that does not exceed the mortgage limit for the type of single family housing for the area under HUD’s single family insuring authority under the National Housing Act.
Also, homeownership affordability is for housing that is to be rehabilitated, but is already owned by a family when assistance is provided, qualifies as affordable housing if the housing (1) is occupied by a extremely low‐income, low‐income, or moderate‐income family which uses the house as its principal residence, and (2) has a value, after rehabilitation that does not exceed the mortgage limit for the type of single family housing for the area, as described in the above paragraph.
Owner VHUD50 is defined for homes with values affordable to households with incomes at or below 50% of HUD Area Median Family Income. Affordable is defined as annual owner costs less than or equal to 30% of annual gross income. Annual owner costs are estimated assuming the cost of purchasing a home at the time of the Census based on the reported value of the home. Assuming a 7.9% interest rate and national averages for annual utility costs, taxes, and hazard and mortgage insurances, multiplying incomes times 2.9 represents the value of a home a person could afford to purchase. For example, a household with an annual gross income of $30,000 is estimated to be able to afford an $87,000 home without having total costs exceed 30% of their annual household income.6
Owner VHUD80 is defined for are homes with a current value that are affordable to households with incomes greater than 50% and less than 80% of HUD Area Median Family Income. Owner VHUD100 are units with a current value that is affordable to households with incomes greater than 80% and less than 100% of the HUD Area Median Family Income.
Owner VHUD100 are affordable to households with incomes greater than 80% and less than 100% of HUD Area Median Family Income. Owner>VHUD100 are affordable to households with 95.1% AMI and above.
Owner Affordability Match
Following HUD’s guidelines for owner affordability, shows available number of Owner occupied units by Area Median Income (AMI), followed by the percentages of households occupying the units by their AMI. Table 15 includes a yellow highlight for the percentages of Owner occupants who fit or match the rent by their AMI. For example, Owner VHD50, households with 30.1‐50% AMI represent 27% of occupancy which matches affordability for homes with 0‐1 bedrooms, at 14% match for 2 bedrooms, and
5 Guidelines for Preparing Consolidated Plan and Performance and Evaluation Report Submissions for Local Jurisdictions, U.S. Department of Housing and Urban Development, Table 2a 6 Definitions taken from State of the Cities Data System, CHAS Data, Affordability Mismatch Output for All Households found at http://socds.huduser.org/chas/index.html
Anchorage Housing image found at: http://www.bing.com/images/search?q=anchorage+housing+pictures&qpvt=anchorage+housing+pictures&FORM=IQFRML

match at 23% for 3+ bedrooms. Also, for Owner VHUD80, households with 50.1‐80% match for 0‐1 bedrooms (11%), 2 bedrooms (22%), and 3+ bedrooms (19%). There are lower percentages for VHUD100 for 0‐1 bedrooms (0%), 2 bedrooms (11%), and 3+ bedrooms (8%). Percentages increase dramatically for the >VHUD100 for 0‐1 bedrooms (38%), 2 bedrooms (52%), and 3+ bedrooms (79%).
MA 15 Table 15 Owner Affordability (VHUD)
Owner Housing Units by Affordability Owner Units by # of Bedrooms Total
0‐1 2 3+
1. Owner VHUD50
# occupied units 245 1,410 1,515 3,170
% occupants <30% AMI or less 14% 30% 11%
% 30.1‐50% 27% 14% 23%
% 50.1‐80% 6% 31% 28%
% 80.1‐95% 43% 8% 13%
% 95.1% AMI and above 10% 17% 25%
2. Owner VHUD80
# occupied units 95 950 1,745 2,790
% occupants <30% AMI or less 0% 8% 8%
% 30.1‐50% 32% 9% 5%
% 50.1‐80% 11% 22% 19%
% 80.1‐95% 16% 19% 13%
% 95.1% AMI and above 42% 41% 54%
3. Owner VHUD100
# occupied units 45 615 1,495 2,155
% occupants <30% AMI or less 33% 18% 7%
% 30.1‐50% 0% 13% 10%
% 50.1‐80% 67% 15% 11%
% 80.1‐95% 0% 11% 8%
% 95.1% AMI and above 0% 44% 64%
4. Owner >VHUD100
# occupied units 130 500 4,210 4,840
% occupants <30% AMI or less 12% 6% 4%
% 30.1‐50% 35% 14% 5%
% 50.1‐80% 0% 18% 8%
% 80.1‐95% 15% 10% 3%
% 95.1% AMI and above 38% 52% 79%
Source: CHAS Data, 2006 to 2008, Table 14B Standard Affordability (VHUD50, 80, 100, Greater than VHD100%) and # of Bedrooms, ACS 3‐Year Average
Owner Affordability Mismatch
Table 14 shows the match highlighted in yellow and those with an AMI that fall below the Owner Affordability highlighted in rose. There is a mismatch in households in the:
VHUD50 category shows the mismatch for occupants with a higher AMI for 0‐1 bedrooms (59%), 2 bedrooms (56%), and 3+ bedrooms (66%).
VHUD80 category shows the mismatch for occupants with a higher AMI is 0‐1 bedrooms (58%), 2 bedrooms (60%), and 3+ bedrooms (67%).

VHUD100 category shows the mismatch is negligible for households with a higher AMI for 0‐1 bedrooms (0%); however, for the 2 bedrooms (44%), and the 3+ bedrooms (64) these percentages reflect a similar percentage for VHUD50 and VHUD80.
>VHUD100 category does not show a mismatch for occupants with a higher AMI, but does reflect a match occupancy for 0‐1 bedrooms (38%), 2 bedrooms (52%), and 3+ bedrooms (79%). This shows the higher AMI owners have the highest percentage of 3+ bedrooms (79%); a little over half of all 2 bedrooms (52%), and almost 40% of the 0‐1 bedrooms.
MA 15 Table 16 Owner Affordability and Mismatch for Owners with a Higher AMI
Owner Housing Units by Affordability Owner Units by # of Bedrooms Total
0‐1 2 3+
1. Owner VHUD50
# occupied units 245 1,410 1,515 3,170
% occupants <30% AMI or less 14% 30% 11%
% 30.1‐50% 27% 14% 23%
Mismatch for % for Higher AMI 59% 56% 66%
2. Owner VHUD80
# occupied units 95 950 1,745 2,790
% occupants <30% AMI or less 0% 8% 8%
% 30.1‐50% 32% 9% 5%
% 50.1‐80% 11% 22% 19%
Mismatch for % for Higher AMI 58% 60% 67%
3. Owner VHUD100
# occupied units 45 615 1,495 2,155
% occupants <30% AMI or less 33% 18% 7%
% 30.1‐50% 0% 13% 10%
% 50.1‐80% 67% 15% 11%
% 80.1‐95% 0% 11% 8%
Mismatch for % for Higher AMI 0% 44% 64%
4. Owner >VHUD100
# occupied units 130 500 4,210 4,840
% occupants <30% AMI or less 12% 6% 4%
% 30.1‐50% 35% 14% 5%
% 50.1‐80% 0% 18% 8%
% 80.1‐95% 15% 10% 3%
% 95.1% AMI and above 38% 52% 79%
Table 17 shows the total of owner households that are occupying housing units that exceed their AMI represented by:
VHUD50 category totals 630
VHUD80 category totals 430
VHUD100 category totals 745
>VHUD100 category totals 1,190
MA 15 Table 17 Total of Owner Units Occupied by households below Owner AMI
Owner Housing Units by Affordability Owner Units by # of Bedrooms Total
0‐1 2 3+
1. Owner VHUD50

# occupied units 245 1,410 1,515 3,170
% occupants <30% AMI or less 35 425 170 630
% 30.1‐50% 65 195 345 605
% 50.1‐80% 15 435 425 875
% 80.1‐95% 105 115 200 420
% 95.1% AMI and above 25 240 375 640
Total occupants below AMI 35 425 170 630
2. Owner VHUD80
# occupied units 95 950 1,745 2,790
% occupants <30% AMI or less 0 80 145 225
% 30.1‐50% 30 90 85 205
% 50.1‐80% 10 210 335 555
% 80.1‐95% 15 185 230 430
% 95.1% AMI and above 40 385 950 1,375
Total occupants below AMI 30 170 230 430
3. Owner VHUD100
# occupied units 45 615 1,495 2,155
% occupants <30% AMI or less 15 110 110 235
% 30.1‐50% 0 80 145 225
% 50.1‐80% 30 90 165 285
% 80.1‐95% 0 65 115 180
% 95.1% AMI and above 0 270 960 1,230
Total occupants below AMI 45 280 420 745
4. Owner >VHUD100
# occupied units 130 500 4,210 4,840
% occupants <30% AMI or less 15 30 155 200
% 30.1‐50% 45 70 215 330
% 50.1‐80% 0 90 355 445
% 80.1‐95% 20 50 145 215
% 95.1% AMI and above 50 260 3,340 3,650
Total occupants below AMI 80 240 870 1,190
Table 18 collapses all owners in each of their affordable AMI. For example all % occupants <30% AMI or less are added in each column to illustrate the total number of owners in the AMI in need of a home by number of bedrooms. Therefore, <30% AMI adds 35, 15, 15 to total 65 in the column for 0‐1 bedrooms. In the same owner AMI for <30% AMI or less for 2 bedrooms the figures 425, 80, 110, and 30 are added to total 645; and in the same AMI for 3+ bedrooms add 170, 145, 110 and 155 to total 580. The table is further completed for remaining owners by AMI.
MA 15 Table 18 Owner Housing Units Needed by Affordability
Owner Housing Units Needed by Affordability Owner Units by # of Bedrooms Total
Owner AMI 0‐1 2 3+
<30% AMI or less 65 645 580 1,290
% 30.1‐50% 75 240 445 760
% 50.1‐80% 30 180 520 730
% 80.1‐95% 20 50 145 215
Total 190 1,115 1,690 2,995

Availability of Sufficient Housing
There is insufficient housing for renter and owner households. Anchorage needs are reflected in the table below by renter AMI and number of bedrooms. See information in tables MA 15 Table 19 & 20.
MA 15 Table 19 Renter Market Housing Need by Affordability (info also in Table 14)
Renter Market Housing Needed by Affordability Rental Units by # of Bedrooms Total
Renter I 0‐1 2 3+
Rent <30% AMI or less 2,495 2,145 1,235 5,875
Rent <=30.1 to 50% 940 1,820 870 3,630
<=51.1 to 80% 15 190 630 835
Total for Each Bedroom Unit 3,435 3,965 2,105 10,340
MA 15 Table 20 Owner Market Housing Need by Affordability (info also in Table 18)
Owner Housing Units Needed by Affordability Owner Units by # of Bedrooms Total
Owner AMI 0‐1 2 3+
<30% AMI or less 65 645 580 1,290
% 30.1‐50% 75 240 445 760
% 50.1‐80% 30 180 520 730
% 80.1‐95% 20 50 145 215
Total 190 1,115 1,690 2,995

MA 15 Table 11 Renter Affordability (RHUD)
Housing Units by Affordability (RHUD) Renters Units by # of Bedrooms in Percentage Total
0‐1 2 3+
1. Rent <=30%
# occupied units 810 1,620 1,885 4,315
% occupants <30% AMI or less 51% 33% 29%
30.1‐50% 27% 30% 17%
50.1‐80% 9% 24% 29%
80.1‐95% 9% 2% 11%
95.1% AMI and above 4% 11% 15%
2. Rent <=30.1 to 50%
# occupied units 4,180 7,780 1,225 9,295
% occupants <30% AMI or less 37% 21% 13%
30.1‐50% 29% 21% 24%
50.1‐80% 22% 31% 31%
80.1‐95% 7% 8% 12%
95.1% AMI and above 6% 19% 20%
3. Rent <=51.1 to 80%
# occupied units 5,255 3,890 5,830 20,890
% occupants <30% AMI or less 17% 21% 15%
30.1‐50% 18% 21% 13%
50.1‐80% 27% 31% 33%
80.1‐95% 10% 8% 8%
95.1% AMI and above 28% 19% 31%
4. Rent >80%
# occupied units 395 1,175 3,465 5,035
% occupants <30% AMI or less 11% 2% 6%
30.1‐50% 0% 10% 2%
50.1‐80% 4% 16% 18%
80.1‐95% 20% 12% 9%
95.1% AMI and above 65% 60% 64%
Source: CHAS Data, 2006 to 2008, Table 14B Standard Affordability (RHUD 30, 50, 80, and 80+) by # of Bedrooms, ACS 3‐Year Average

MA 15 Table 15 Owner Affordability (VHUD)
Owner Housing Units by Affordability Owner Units by # of Bedrooms Total
0‐1 2 3+
1. Owner VHUD50
# occupied units 245 1,410 1,515 3,170
% occupants <30% AMI or less 14% 30% 11%
% 30.1‐50% 27% 14% 23%
% 50.1‐80% 6% 31% 28%
% 80.1‐95% 43% 8% 13%
% 95.1% AMI and above 10% 17% 25%
2. Owner VHUD80
# occupied units 95 950 1,745 2,790
% occupants <30% AMI or less 0% 8% 8%
% 30.1‐50% 32% 9% 5%
% 50.1‐80% 11% 22% 19%
% 80.1‐95% 16% 19% 13%
% 95.1% AMI and above 42% 41% 54%
3. Owner VHUD100
# occupied units 45 615 1,495 2,155
% occupants <30% AMI or less 33% 18% 7%
% 30.1‐50% 0% 13% 10%
% 50.1‐80% 67% 15% 11%
% 80.1‐95% 0% 11% 8%
% 95.1% AMI and above 0% 44% 64%
4. Owner >VHUD100
# occupied units 130 500 4,210 4,840
% occupants <30% AMI or less 12% 6% 4%
% 30.1‐50% 35% 14% 5%
% 50.1‐80% 0% 18% 8%
% 80.1‐95% 15% 10% 3%
% 95.1% AMI and above 38% 52% 79%
Source: CHAS Data, 2006 to 2008, Table 14B Standard Affordability (VHUD50, 80, 100, Greater than VHD100%) and # of Bedrooms, ACS 3‐Year Average

MA 15 Table 12 Renter Affordability and Mismatch for Renters with a Higher AMI
Housing Units by Affordability (RHUD) Renters Units by # of Bedrooms by Percentage and Mismatch
Total
0‐1 2 3+
1. Rent <=30%
# occupied units 810 1,620 1,885 4,315
% occupants <30% AMI or less 51% 33% 29%
Mismatch % for Renters with Higher AMI 49% 67% 71%
2. Rent <=30.1 to 50%
# occupied units 4,180 7,780 1,225 9,295
% occupants <30% AMI or less 37% 21% 13%
30.1‐50% 29% 21% 24%
Mismatch % for Renters with Higher AMI 34% 58% 63%
3. Rent <=51.1 to 80%
# occupied units 5,255 3,890 5,830 20,890
% occupants <30% AMI or less 17% 21% 15%
30.1‐50% 18% 21% 13%
50.1‐80% 27% 31% 33%
Mismatch % for Renters with Higher AMI 38% 8% 39%
19%
4. Rent >80%
# occupied units 395 1,175 3,465 5,035
% occupants <30% AMI or less 11% 2% 6%
30.1‐50% 0% 10% 2%
50.1‐80% 4% 16% 18%
80.1‐95% 20% 12% 9%
Mismatch % for Renters with Higher AMI 65% 60% 64%
Source: CHAS Data, 2006 to 2008, Table 14B Standard Affordability (RHUD 30, 50, 80, and 80+) by # of Bedrooms, ACS 3‐Year Average

MA 15 Table 21 ‐ Mobile Homes in Anchorage
Year Total Homes Percentage Change 1970 2,204 1980 7,398 236% 1990 6,754 9% 2000 5,824 14% 2010 5,139 12%
The greatest percentage of mobile homes can be found in Fairview at 33.2%, Bayshore/Klatt by 21.3% ; Spenard at 19.7%; University Area at 16.2%; and Northeast (Muldoon) at 16.1% . See MA 15 Table 22 for remaining top five.
MA 15 Table 22 ‐ Top 10 Highest Percentage of Mobile Homes by Census Tract
Community Council Census Tract
Percent Mobile Homes
Total Housing Stock
Fairview 9.01 33.2% 614 1,850
Bayshore/Klatt 27.12 21.3% 727 3,411
Spenard 20 19.7% 303 1,540
University Area 18.02 16.2% 363 2,237
Northeast (Muldoon) 7.01 16.1% 335 2,076
Abbott Loop 28.11 13.1% 362 2,762
Russian Jack Park 17.31 12.7% 276 2,181
Russian Jack Park 8.02 12.0% 235 1,955
Abbott Loop 26.01 11.0% 181 1,651
Northeast (Muldoon) 7.03 10.2% 235 2,312

MA 15 Table6 Cost of Housing by Monthly Rent
Monthly Rent ($) Efficiency
(no bedroom) 1 Bedroom 2 Bedroom 3 Bedroom 4 Bedroom
Fair Market Rate (FMR) 706 803 1,007 1,450 1,766
High HOME Rent 725 826 1,036 1,386 1,526
Low HOME Rent 725 787 945 1,092 1,218
Source: HUD Fair Market Rate and HOME Rents populated in HUD’s IDIS

MA 25 Table 1 Totals Number of Units by Program Type
Program Type Special Purpose Voucher
Certificate Mod‐Rehab
Public Housing Total
Project‐based
Tenant‐based
Veterans Affairs
Supportive Housing
Family Unification Program
Disabled*
# of units vouchers available 70 496 2,301 2,262 96 0 0
* Disabled includes Non‐Elderly Disabled, Mainstream One‐Year, Mainstream Five‐Year, and Nursing Home Transition Data Source: AHFC
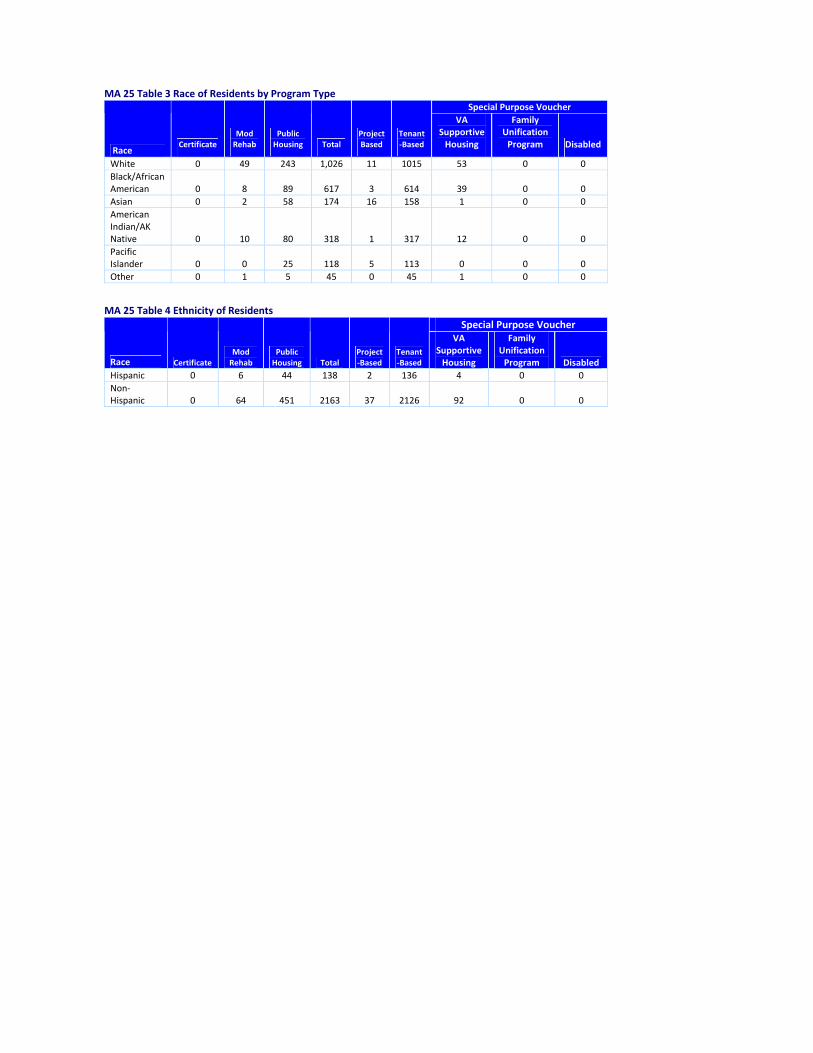
MA 25 Table 3 Race of Residents by Program Type Special Purpose Voucher
Race Certificate
Mod Rehab
Public Housing Total
Project Based
Tenant‐Based
VA Supportive Housing
Family Unification Program Disabled
White 0 49 243 1,026 11 1015 53 0 0
Black/African American 0 8 89 617 3 614 39 0 0
Asian 0 2 58 174 16 158 1 0 0
American Indian/AK Native 0 10 80 318 1 317 12 0 0
Pacific Islander 0 0 25 118 5 113 0 0 0
Other 0 1 5 45 0 45 1 0 0
MA 25 Table 4 Ethnicity of Residents
Special Purpose Voucher
Race Certificate Mod Rehab
Public Housing Total
Project‐Based
Tenant‐Based
VA Supportive Housing
Family Unification Program Disabled
Hispanic 0 6 44 138 2 136 4 0 0
Non‐Hispanic 0 64 451 2163 37 2126 92 0 0

Aside from CoC efforts, also on the map of known mainstream services, a total of 6,328 households were identified as receiving public assistance income in the past twelve months, accounting for 6% of households in the Anchorage community.
MA 30 Table 2 Household With and Without Public‐Assistance Income
Public Assistance Income in the Past 12 Months for Householder Estimate Percentage
Universe: Households 104,315 100%
With public assistance income 6,328 6%
No public assistance income 97,987 94%

MA 30 Table 3 Facilities with Supportive Services
Type of Program Name of Organization Services
ES Abused Women's Aid in Crisis
AWAIC Shelter – 24 Hour shelter for abused women and children, crisis intervention, case management, children’s programs, youth center, transitional housing, Willa’s Way, legal advocacy and emergency financial assistance.
ES Anchorage Rescue Mission
Anchorage Rescue Mission – Beds for single men & women 18 or older, hot meals, clothing and New Life Recovery program for men 18 and older.
ES Beyond Shelter Committee Cold Weather Plan – Provide temporary shelter during inclement weather conditions.
ES Catholic Social Services Brother Francis Shelter – Beds for single men and women 18 or older. Hot evening meal served.
ES Catholic Social Services
Clare House – 24 Hour shelter for women with children and expectant mothers over 18, receive referrals for child care, substance abuse/mental health, affordable permanent housing, employment and continuing educational opportunities.
ES Covenant House
Crisis Center + Overnights for homeless and runaway kids dealing with mental illness, substance abuse and affordable housing, help to finish school, vocational skills, find jobs and to reunify with families.
ES Municipality of Anchorage/DHHS
Anchorage Safety Center – Take persons incapacitated by alcohol in public places into protective custody and transport them to the Safety Center, assessed and taken to a hospital for medical clearance or further care if needed.
ES Salvation Army
McKinnell House – Temporary emergency shelter and case management for homeless families, educational support, meals and life skills development.
ES U.S. Department of Veterans Affairs
Domiciliary Care – Provides a 50 bed Homeless Domiciliary an Outreach Center, Transitional Housing, a Veterans Industries warehouse and the HUD‐VASH Program.
TH Abused Women's Aid in Crisis
Harmony House – Provides transitional housing and support for women without dependent children who are victims of domestic violence and who have a source of income.
TH Abused Women's Aid in Crisis
Willa's Way – Provides case management involving housing, mental health counseling and group counseling; addressing a range of topics for victims of domestic violence. A safe home program serving Alaska Native and American Indian women and their children who are homeless due to domestic violence.
TH Anchor Arms
Safe Harbor Inn – Provide transitional housing for homeless families and individuals, especially those with disabilities.
TH Anchorage Community Mental Health Services
Transitional SRO ‐ Provides housing and supportive services to individuals who are in transition from the streets and shelters into permanent housing.

TH Anchorage Rescue Mission New Life – Offers a 24 month residential Discipleship Program for men struggling to get their life back on track.
TH Catholic Social Services
Clare House Transitional ‐ A 24 hour shelter for women with children and expectant mothers over 18. Residents receive meals and referrals for child care, substance abuse/mental health, affordable permanent housing, employment and continuing educational opportunities. Case management services are an integral part of the program to help women transition from homelessness to independent living.
TH Covenant House Alaska
Passage House – Provides young mothers and their children with a place to live for up to 18 months while they gain the necessary skills and resources to become productive, successful and independent adults.
TH Covenant House Alaska
Rights of Passage – A transitional living program for homeless youth ages 18 to 21. Provides long term residential opportunities to 14 young people focusing on independent living skill for those who have had difficult experiences such as substance abuse, mental health issues, domestic violence and neglect. Program stay is up to 18 months with an additional 6 months of aftercare.
TH Lutheran Social Services
Transitions – Houses up to six homeless men for up to four months, helps them prepare financially to acquire their own place and provide a stable and sober environment.
TH Mary Magdalene Homes
Mary Magdalene House – A Christian non‐profit faith‐based organization providing care and support to women committed to escaping a life of sexual exploitation. Transitional housing accommodates seven women up to 18 months or longer.
TH New Life Development (NLD)
NLD Transitional Living – Provides help to men/women making the transition from incarceration back into the community. Provides housing in a structured family setting, will assist in finding a mentor, community support and employment.
TH Rural Alaska Community Action Program (RurAL CAP)
Homeward Bound – Provides 25 beds for transitional living for public inebriates and provides or facilitates all necessary supports to endure a successful transition from homelessness to permanent independent living.
TH Salvation Army
Eagle Crest – An affordable supportive housing designed to provide housing and appropriate support services to persons who are homeless or who are closer to homelessness. Helps them to be more self sufficient to move towards independent living. Services vary from substance abuse treatment to psychological assistance, job training, domestic violence assistance, etc.

TH Shiloh Community Housing, Inc.
L.I.F.E. Program – A program designed to help young adults 18 to 24 transition smoothly into adulthood by helping them understand the concepts of personal finance, etiquette, career development, health and social skills; consisting of four parts, housing, training, job placement and independent living skills.
TH U.S. Department of Veterans Affairs
Salvation Army Adult Rehab – Entails attendance in chapel services, work therapy, chemical dependency education, anger management/domestic violence therapy, life skills and spiritual monitoring, home group service, relationships and recovery and work therapy recovery. After the standard six month program a veteran may opt for a longer stay using an individualized treatment program.
TH U.S. Department of Veterans Affairs
VA Transitional – Provides housing for 24 homeless, veterans, male or female, willing to work or participate in a rehabilitative program. Estimated stay is six months and can be extended.
PSH Alaska Housing Finance Corporation
VASH Section 8 – The HUD Veterans Affairs Supportive Housing program combines Housing Choice Voucher rental assistance for homeless veterans with case management and clinical services provided by the Department of Veterans Affairs.
PSH Alaskan AIDS Assistance Association
6‐plex project – Houses those with HIV infection, offers supportive services whose household income is less than 80% of median income.
PSH Alaskan AIDS Assistance Association
Shelter + Care –Provides housing and/or supportive services to those with HIV/AIDS infection whose household income is less than 80% of median income, HIV prevention and education, street outreach, free HIV testing, safer sex kit distribution and educational presentations.
PSH Anchorage Community Mental Health Services
ACMHS SPC – Provides rental assistance to persons who are homeless and experience a severe mental illness and may experience co‐existing substance use disorders. Provides rental assistance to tenants in 40 apartment units.
PSH Anchorage Community Mental Health Services
Permanent Housing – Provides rental assistance for apartments in scattered sites throughout Anchorage and comprehensive, intensive mental health services.
PSH Anchorage Housing Initiatives
Coming Home I – The mission of Anchorage Housing initiatives is to provide access to decent, affordable, community‐integrated housing in South‐central Alaska for low‐to moderate‐income persons who experience disabilities.
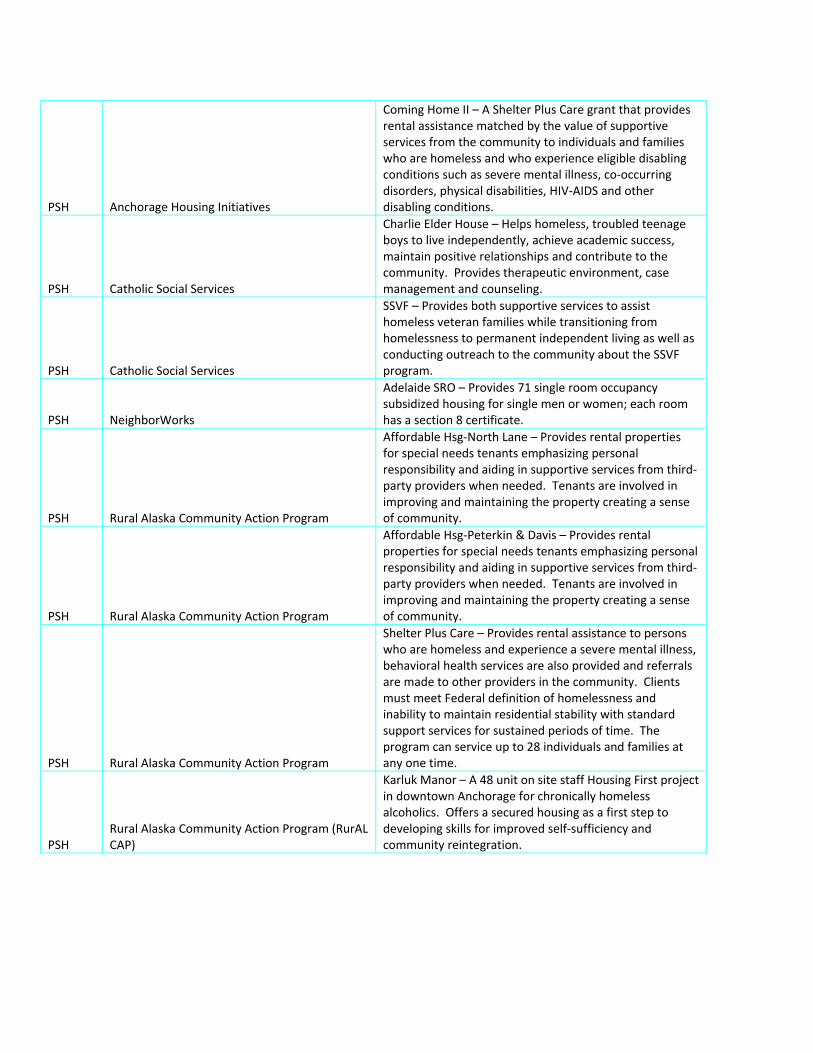
PSH Anchorage Housing Initiatives
Coming Home II – A Shelter Plus Care grant that provides rental assistance matched by the value of supportive services from the community to individuals and families who are homeless and who experience eligible disabling conditions such as severe mental illness, co‐occurring disorders, physical disabilities, HIV‐AIDS and other disabling conditions.
PSH Catholic Social Services
Charlie Elder House – Helps homeless, troubled teenage boys to live independently, achieve academic success, maintain positive relationships and contribute to the community. Provides therapeutic environment, case management and counseling.
PSH Catholic Social Services
SSVF – Provides both supportive services to assist homeless veteran families while transitioning from homelessness to permanent independent living as well as conducting outreach to the community about the SSVF program.
PSH NeighborWorks
Adelaide SRO – Provides 71 single room occupancy subsidized housing for single men or women; each room has a section 8 certificate.
PSH Rural Alaska Community Action Program
Affordable Hsg‐North Lane – Provides rental properties for special needs tenants emphasizing personal responsibility and aiding in supportive services from third‐party providers when needed. Tenants are involved in improving and maintaining the property creating a sense of community.
PSH Rural Alaska Community Action Program
Affordable Hsg‐Peterkin & Davis – Provides rental properties for special needs tenants emphasizing personal responsibility and aiding in supportive services from third‐party providers when needed. Tenants are involved in improving and maintaining the property creating a sense of community.
PSH Rural Alaska Community Action Program
Shelter Plus Care – Provides rental assistance to persons who are homeless and experience a severe mental illness, behavioral health services are also provided and referrals are made to other providers in the community. Clients must meet Federal definition of homelessness and inability to maintain residential stability with standard support services for sustained periods of time. The program can service up to 28 individuals and families at any one time.
PSH Rural Alaska Community Action Program (RurAL CAP)
Karluk Manor – A 48 unit on site staff Housing First project in downtown Anchorage for chronically homeless alcoholics. Offers a secured housing as a first step to developing skills for improved self‐sufficiency and community reintegration.

Mayor’s Homeless Leadership Team1 The Mayor’s Homeless Leadership Team (HLT) was established as part of Mayor Sullivan’s Strategic Action Plan to deal with chronic public inebriates and related issues of Homelessness in Anchorage. The HLT is comprised of numerous social service and government agencies and is reflective of the Municipality’s collaborative approach to dealing with this serious social and public safety issue.
The HLT’s focus is on that small number of citizens who are homeless and have chronic substance abuse and/or mental health issues. The purpose of the HLT is to provide the Mayor with short and long term strategies for effectively managing the challenges this population creates and to assist with identifying and leveraging community resources for implementing those strategies. During the course of HLT discussions, the group developed several recommendations, which includes
strategies for affordable housing.
Mayor’s HLT Recommendations, May 2010
The Mayor’s HLT formulated the following strategies and recommendations on how the community should deal with homeless chronic public inebriates and related issues of homelessness.
Mayoral and Municipal support for the development of Karluk Manor by RurAL CAP as the initial Housing First Project in Anchorage.
As RurAL Cap’s Karluk Manor project gained momentum, the HLT realized that implementation of Anchorage’s first “Housing First” project, initially perceived as long‐term, could occur within the year, offering the community a short‐term, effective strategy to help achieve the Mayor’s desired outcomes.
The HLT recommends that “Housing First” projects be clustered and not scattered‐site. Within the Municipality Of Anchorage, there is currently no means to deliver the level of services and support needed by the chronic homeless to improve their well being and lessen community impacts in scattered‐site facilities. One‐on‐One environments or small scattered‐sites would require an estimated 300 service personnel.
“Housing First” projects should be connected to services, due to the severity of alcohol abuse by potential residents of “Housing First” projects and the likelihood that they will have serious medical and psychiatric illnesses. Potential residents are also very likely to have major deficits in cognitive functioning, social functioning and independent living skills. Therefore, a variety of community resources and services are required to support a project of this magnitude.
Mayoral Support for Assessing, Developing and Evaluating Future “Housing First” Projects
The HLT recommends Mayoral support for the acquisition, development and operation of future “Housing First” projects in Anchorage as soon as possible. The “Housing First” model provides housing to chronic homeless inebriates with on‐site supportive services and case management. This model has been shown to keep individuals off the streets, out of emergency shelters, emergency rooms and the Transfer Station/sleep off center, and to be cost effective (published reports and research can be found at the end of this report).
Develop and implement strategies for public education and outreach around the approved recommendations.
The HLT was instrumental in creating a community informational resource on Health and Human Services webpage dealing with chronic public inebriation and related issues of homelessness, including existing and historic plans and reports. This resource can be found under the Mayor’s Strategic Action Plan.
Remove Regulatory Barriers: Clarify residential and facility land use types in Title 21 and Title 16
Title 21 (housing projects) and Title 16 (facility projects) often present regulatory barriers to development of much‐needed projects in Anchorage. This strategy would convene a
1 Mayor’s Homeless Leadership Team found at http://www.muni.org/Departments/health/Pages/HomelessLeadershipTeam.aspx

collaborative group of funders and service providers to define 2‐3 hypothetical but realistic housing projects that serve people with disabilities (i.e., 10‐plex supportive housing project with certain on‐site services located in an R‐3 district) and hold a mock “pre‐construction” meeting with the Planning Department to examine zoning implications for each scenario.
This exercise will better define current land use barriers, if any, to developing new supportive housing projects for people with disabilities, including both permanent and transitional housing. Identifying these regulatory barrier issues will aid housing providers, the Municipality of Anchorage, the Municipal Assembly, and/or the Planning and Zoning Commission in reducing or mitigating barriers.
The HLT recommends Mayoral support for this strategy, including Municipal Planning Department staff participation.
Implement the Municipal Cold Weather Plan (MCW) and Amend Municipal Code Title 16 to enable the MCW Plan.
The HLT recommends implementation of a cold weather plan for the Municipality of Anchorage, which would allow churches, designated by the Director of Health & Human Services or their designee, to act as temporary cold weather shelters for families and individuals who are not under the influence of intoxicants, Title 21 notwithstanding.
Camp closures should not take place unless housing options are in place
Anchorage is consistently at or above its emergency housing capacity and camp closures will not be an end to the cycle of illgal camping and chronic public inebriation if individuals do not have a place to go when an illegal camp is closed. Housing of all types (Affordable, Housing First, Low‐Barrier, etc.) must be available before closing down an illegal camp if the city wants lasting solutions in getting individuals out of illegal camps that are on public land permanently.
This strategy will also ensure better results for the Homeless Action & Response Team (H.A.R.T.) when they undertake outreach to illegal campers.
Develop a Collaborative Homeless Action & Response Team (H.A.R.T.) to do outreach to illegal campers when a campsite is posted for closure
The H.A.R.T. will assist all persons in illegal camps posted for closure, not just those persons who are chronically homeless due to substance addiction and/or mental health issues. Possible services offered include: Housing/Shelter; Housing Vouchers; Public Assistance; Social Security Benefits; Veteran’s Benefits; Medical; Mental Health; Jobs; Case Management; Substance Use/Abuse Treatment.
A commitment to work with stakeholders to increase detox beds and services for chronic homeless alcoholics.
Currently, Anchorage has two detox facilities, Ernie Turner Center and the Salvation Army’s Clitheroe Center. Facilities are at capacity, and service providers are overwhelmed with both bed and service wait lists of up to three months. CITC’s Ernie Turner Center has no room for growth, while the Salvation Army’s Clitheroe Center has room for 4‐6 additional detox beds if funding is made available, at $125,000 per year per bed.
Increasing detox beds and services would help meet the needs of individuals who are requesting assistance to get clean and sober when they request treatment and services, instead of putting them on a wait list and keeping them on the streets until space is available.

Support for increasing the number of case managers who work with chronic homeless alcoholics. Strive for a ratio of 1:10 case managers to clients.
The HLT recommends a collaborative effort to look at advocacy opportunities and create a working model which would increase case managers within the MOA to a ratio of 1:10 case manager to client.
Most case managers in Anchorage currently have case loads of up to 50 clients at a time. This places an inordinate burden on case managers and reduces the level of care and attention that they are able to dedicate o individual clients. Reduced case loads would allow for more robust services for homeless chronic alcoholics, resulting in a more successful intervention.
Continued Mayoral support for the Anchorage Coalition on Homelessness and implementation of the 10 Year Plan.
The HLT recommends continued support for the Anchorage Coalition on Homelessness and implementation of Anchorage’s 10 year plan. The HLT acknowledges there is a serious lack of affordable housing in Anchorage that must be addressed as part of a larger solution for housing for our homeless population. The absence of affordable housing is a barrier for individuals and families who are ready to exit homeless shelters and programs. There is currently a lack of inventory and the affordability gap is increasing.
Mayor’s Kitchen Cabinet’s Work Group on Affordable Housing The Mayor’s Kitchen Cabinet was convened by the Mayor, to assess needs of housing development and treatment and related services in Anchorage. As a result of the two pronged approached, the Kitchen Cabinet formed two work groups; one to focus on affordable housing; and, the other to focus on substance abuse treatment services. The two groups are staffed by the Municipal Department of Health and Human Services.
In May 2012, the Mayor’s Kitchen Cabinet’s Work Group on Affordable Housing (WGAH) submitted recommendations for policy and regulatory changes that the Municipality of Anchorage could implement that would help spur housing development in Anchorage. The WGAH recommendations are:
1. Assign a single department head to act as a liaison with home builders when needed through the permitting process.
2. Create or authorize an entity or partnership, such as the Anchorage Community Development Authority, to specifically plan for, spur, and coordinate comprehensive housing development. That entity should be tasked with implementing the Anchorage 2020, Anchorage Downtown Comprehensive plan, and various Anchorage neighborhood plans to catalyze housing and economic development.
3. Continue to research the viability of using Tax Increment Financing in Anchorage.
4. Consider changes to MOA regulatory requirements that will help increase the likelihood of housing development.
a. Examine and extend the number of years required for code changes beyond three years.
b. Adopt an ordinance that accepts the premise of SB104 ‐ A deferral of municipal property taxes on the increase in value of real property attributable to subdivision of that property.
Image found at http://www.google.com/imgres?imgurl=http://www.catholicanchor.org

c. Examine MOA code to allow for an alternative engineered design that may not meet MASS requirements on private on‐site roads and driveways.
d. Adopt lower parking policy requirements proposed in Title 21.
According to the WGAH memorandum to the Mayor, the recommendations should be considered helpful as immediate next steps to benefit all types of public, private, and non‐profit housing development. The WGAH recognizes these recommendations standing alone will not catalyze sufficient development to meet the community’s need for housing. The recommendations should be viewed as first in a series of changes and initiatives which place housing in Anchorage as a very high priority both for the MOA and for the larger community. A large challenge remains: to identify and implement creative strategies that actually spurs housing development to ensure safe, affordable homes for all Anchorage residents.2
Mayor’s Work Group on Substance Abuse Treatment & Services In February 2013, the Mayor’s Work Group on Substance Abuse Treatment & Services made recommendations to enhance services to homeless individuals with substance abuse disorders. The group’s goal was to look for low cost opportunities, policy changes and opportunities to enhance services and access to treatment for homeless individuals in Anchorage experiencing substance use disorders.
The following are the top recommendations put forth by the Work Group on Substance Abuse Treatment and Services.
1. High priority‐‐no cost recommendations for the MOA regarding substance abuse treatment and services in Anchorage:
1. Support existing and future expansion of research based supportive housing programs and service models, such as Karluk Manor, which are associated with longer stays in housing and reduction of alcohol use. Such programs pair housing with intensive case management services to dramatically reduce the use of emergency services.
2. Develop an overarching advocacy effort to build community support for sober housing development as a long term strategy.
a. Target a specific area of town, identify large housing or mixed use development or redevelopment and leverage MOA investments and expertise in partnership with the private sector to develop long term and short term sober housing units (a recommendation forwarded by the Housing Workgroup).
3. Weigh in on the FY12 alcohol tax funding for alcohol related projects by collaborating with the Recover Alaska Initiative, a public/private collaborative working to reduce the negative effects of alcohol and drug abuse in Alaska. The Mayor may recommend projects that could have positive impact in Anchorage.
2. High priority‐‐low cost recommendations for the Municipality regarding substance abuse treatment and services in Anchorage:
1. Reinstitute the Pathways to Recovery Program (or similar model) located at the Anchorage Safety Center. The Pathways program focuses on outreach, engagement, detoxification, and long term treatment with the goal of housing and employment. This program has demonstrated success in reducing the number of transfer station admissions by focusing on housing and linking to detox and treatment. Programming needs to include ongoing engagement and coordination of services for individuals prior to discharge from the Safety Center such as linking directly to day engagement options to avoid discharging directly to the streets of Anchorage.
2. Re‐invigorate use of the Alaska Center for Treatment Needs Assessment as commissioned by DHSS to analyze and inform current and future need for adult residential treatment beds in Anchorage.
a. Assign a single project coordinator within DHHS for service providers, community members and other interested stakeholders regarding addiction services and supports in Anchorage. This coordinator should participate in the Anchorage Regional Behavioral Health Providers stakeholder process to effectively advocate on behalf of the needs of providers in Anchorage, to help reduce barriers and inefficiencies (both
2 Mayor’s Kitchen Cabinet’s Work Group on Affordable Housing recommendations to Mayor Daniel Sullivan, May 10, 2012

regulatory and governmental) that interfere with access to and provision of treatment services in Anchorage.
b. Establish a municipal/provider task force to work with treatment providers, outreach/engagement programs and housing programs to maximize access, expand treatment capacity and increase housing stability.
c. Review the workgroup summary for recommendations and issues identified by the committee that are within the purview and responsibility of DHSS. We recommend the MOA engage with DHSS to advocate for department action on a state level to address the issues outlined in the summary.
3. Re‐engage and move forward plans for the Alaska Recovery Center in collaboration with the State of Alaska and the Alaska Mental Health Trust Authority.

B. Anchorage’s Major Employment Sectors
Anchorage’s largest economic sectors are: transportation (air and water); federal, state and municipal government; natural resource development (petroleum, mining); health care; tourism/leisure; and, construction.
Transportation
Ted Stevens Anchorage International Airport serves Anchorage and all major U.S. airlines. The airport is recognized as a major air cargo hub and is among the world's largest cargo airports. Located in Anchorage, the airport is strategically located on the shortest route between many points in North American and Asia, and due to the lower range capabilities of most cargo aircraft, it has become an important cargo transit facility.60 Both FedEx and UPS are major operators in Anchorage, and operate cargo service to many Asian destinations. Over 30 cargo airlines from around the world operate to Anchorage. In 2010, the airport became the 5th world’s top cargo airports.
Table 1 for cargo metric tonnes show where Anchorage was rate in the first half of 2012. According to data compiled by Airports Council International and presented by AviationBusinessMe:
1. Memphis was the world’s busiest cargo airport in the first half of 2012, handling 1 980 812 tonnes. The hub airport of FedEx Express recorded year on year growth of 3.2%, one of only a few airports in the top ten to register an increase.
2. Memphis and Hong Kong have historically placed at the top of the list and at halfway through 2012, Hong Kong lies in second place. The airport handled 1 942 000 tonnes of cargo in the first half, which represents no change over last year’s figure.
3. Shanghai Pudong is third and handled 1 429 846 tonnes of cargo in the first half. The figure represented a 6.6% year on year decline.
4. Fourth at this time is Incheon Seoul, which handled 1 205 030 tonnes of cargo in the first half. This represented a year on year fall of 5.3%.
5 Anchorage’s location makes it a natural stop‐off point for cargo heading from the Far East to the Western half of the United States. It handled 1 175 612 tonnes in the first half, a year on year decline of 5.6%
60 Centre for Aviation (CAPA), http://www.centreforaviation.com/profiles/airports/anchorage‐international‐airport‐anc
Image found at: https://www.google.com/#sclient=psy‐ab&q=ted+stevens+international+airport+images

MA 45 Table 1 World’s Airports Handling Largest Cargo Metric Tonnes
2012 (first half of year) Airport Cargo Metric Tonnes
1 Memphis 1 980 812
2 Hong Kong 1 942 000
3 Shanghai Pudong 1 429 846
4 Incheon 1 205 030
5 Anchorage 1 175 612
Source AviationBusinessMe.com61
Information on the Port of Anchorage (POA) comes from their website.62 The POA receives 95 percent of all goods destined for Alaska. Ships from Totem Ocean Trailer Express and Horizon Lines arrive twice weekly from the Port of Tacoma in Washington. Along with handling these activities, the port is a storage
facility for jet fuel from Alaskan refineries, which is utilized at Joint Base Elmendorf‐Richardson (JBER).
The POA is a deep‐water port located in Anchorage, Alaska with 4 bulk carrier berths and two petroleum berths. The Port of Anchorage is an enterprise department under the Municipality of Anchorage. As an enterprise, the Port is distinguished from other types of municipal departments, largely because it creates enough revenue to support its operations along with paying annual fees to the municipality.
The POA sits in a strategic location for global commerce, fuel and cargo distribution, and military response. It is the only intermodal deep‐water port in Alaska. The Port is operational year round, and located only a few miles away from one of the busiest cargo airports in the United States.
The Port of Anchorage is essential to Alaska's Armed Forces providing deployment and staging areas, essential fuel supplies, and consumer and business goods. Between 2005 and 2010, the port supported over 20 military deployments including Stryker Brigade deployments to Iraq and Afghanistan. During that same time period over 18,000 pieces of military equipment passed through the Port's facilities. In 2006, the Port of Anchorage was designated as a Department of Defence Nationally Strategic Seaport. Only 19 ports in the United States have this designation.
61Aviation Businessme.com at http://aviationbusinessme.com/gallery/2012/sep/30/260280/#3‐third‐in‐the‐list‐is‐shanghai‐pudong‐which‐handled‐1‐429‐846‐tonnes‐of‐cargo‐in 62 Port of Anchorage website found at http://www.portofalaska.com/
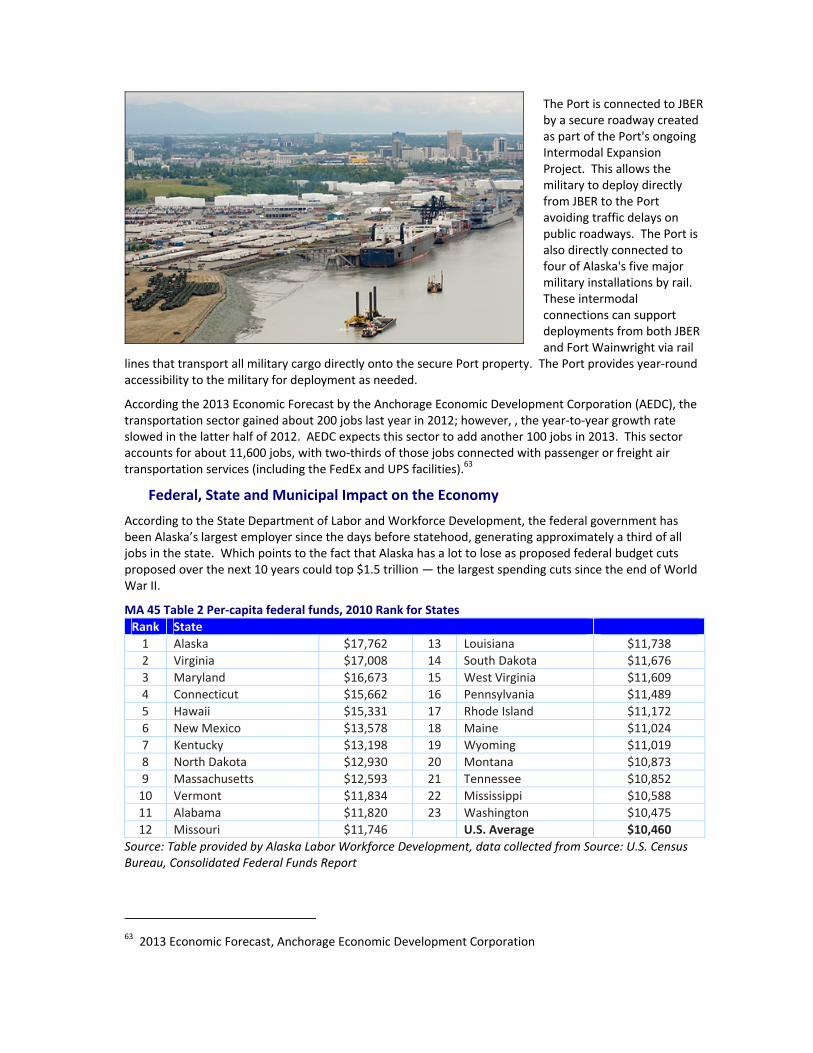
The Port is connected to JBER by a secure roadway created as part of the Port's ongoing Intermodal Expansion Project. This allows the military to deploy directly from JBER to the Port avoiding traffic delays on public roadways. The Port is also directly connected to four of Alaska's five major military installations by rail. These intermodal connections can support deployments from both JBER and Fort Wainwright via rail
lines that transport all military cargo directly onto the secure Port property. The Port provides year‐round accessibility to the military for deployment as needed.
According the 2013 Economic Forecast by the Anchorage Economic Development Corporation (AEDC), the transportation sector gained about 200 jobs last year in 2012; however, , the year‐to‐year growth rate slowed in the latter half of 2012. AEDC expects this sector to add another 100 jobs in 2013. This sector accounts for about 11,600 jobs, with two‐thirds of those jobs connected with passenger or freight air transportation services (including the FedEx and UPS facilities).63
Federal, State and Municipal Impact on the Economy
According to the State Department of Labor and Workforce Development, the federal government has been Alaska’s largest employer since the days before statehood, generating approximately a third of all jobs in the state. Which points to the fact that Alaska has a lot to lose as proposed federal budget cuts proposed over the next 10 years could top $1.5 trillion — the largest spending cuts since the end of World War II.
MA 45 Table 2 Per‐capita federal funds, 2010 Rank for States
Rank State
1 Alaska $17,762 13 Louisiana $11,738
2 Virginia $17,008 14 South Dakota $11,676
3 Maryland $16,673 15 West Virginia $11,609
4 Connecticut $15,662 16 Pennsylvania $11,489
5 Hawaii $15,331 17 Rhode Island $11,172
6 New Mexico $13,578 18 Maine $11,024
7 Kentucky $13,198 19 Wyoming $11,019
8 North Dakota $12,930 20 Montana $10,873
9 Massachusetts $12,593 21 Tennessee $10,852
10 Vermont $11,834 22 Mississippi $10,588
11 Alabama $11,820 23 Washington $10,475
12 Missouri $11,746 U.S. Average $10,460
Source: Table provided by Alaska Labor Workforce Development, data collected from Source: U.S. Census Bureau, Consolidated Federal Funds Report
63 2013 Economic Forecast, Anchorage Economic Development Corporation

Neal Fried, state economist, outlines in Alaska Trends, the most dramatic rise in federal expenditures in Alaska has been in salaries and wages — the largest spending category — which doubled over the past decade. In 2010, Alaska ranked second for per capita federal wages and salaries at $5,710 — five times the national average. Average salaries also increased, and the typical civilian federal worker earned $68,484 in 2010 — considerably more than the $47,724 earned by the average Alaska worker.64 Much of the growth in wages and salaries is attributable to the military’s expansion, and the U.S. Census Bureau also assembled a large temporary workforce to conduct the decennial census.
MA 45 Table 3 Anchorage and Alaska federal expenditures
Population
Federal governmentexpenditure
Total
Retirement and
disability
Other direct
payments Grants Procurement
Salaries and
wages
Alaska 710,231 12,615,329 1,590,715 1,040,048 3,465,207 2,464,278 4,055,081
Anchorage 291,826 4,812,379 700,804 245,278 1,472,426 1,262,683 1,131,189
Anchorage % 41.10% 38.10% 44.10% 23.60% 42.50% 51.20% 27.90%
Source: U.S. Census Bureau’s Consolidated Federal Funds Report for 2010
Table 4 shows when the public sector is included in the state’s largest employers, the highest ranked average monthly employment for 2010 was the military, followed by state, federal and educational institutions.
MA 45 Table 4 Top 10 Private and Public Sector Employers in Alaska, 2010
Top 10 Private and Public Sector Employers in Alaska, 2010
Average Monthly Employment
1 Uniformed military 22,796
2 State of Alaska 18,337
3 Federal civilians 17,535
4 University of Alaska 7,579
5 Anchorage School District 7,157
6 Providence Health and Services 4,000+
7 Wal‐Mart/Sam’s Club 3,000 to 3,249
8 Carrs/Safeway 2,750 to 2,999
9 Municipality of Anchorage 2,846
10 Fred Meyer 2,500 to 2,749
Source: Alaska Department of Labor and Workforce Development, Research and Analysis Section, Alaska Economic Trends, July 2010 found at http://laborstats.alaska.gov/trends/jul10art1.pdf
In prior years, the United States military had two large installations, Elmendorf Air Force Base and Fort Richardson, which originally stemmed from the branching off of the U.S. Air Force and U.S. Army after World War II. In a cost cutting effort initiated by the 2005 Base Realignment and Closure proceedings, the two bases were unified. JBER was created and also incorporated Kulis Air National Guard Base. Kulis was a 127 acre base adjacent to the Ted Stevens International Airport, and became unified with JBER in February 2011. The land reverted to the ownership of the State of Alaska. The top 10 private and public sectors show the uniformed military as having the largest number of monthly employed at 22,796.
The Alaska Department of Labor and Workforce Develop identify local, state, and federal government as important employers in Alaska. Local governments provide some of the most direct public services, often
64 Alaska Trends, found at http://labor.alaska.gov/trends/feb12.pdf
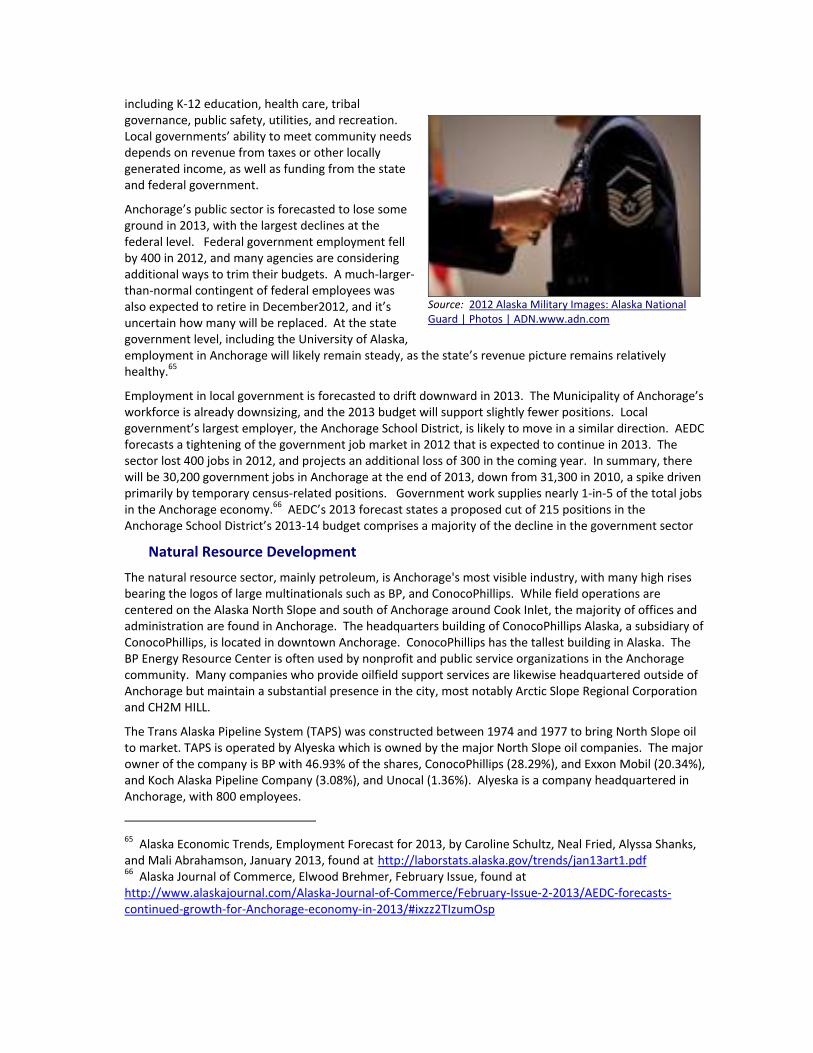
including K‐12 education, health care, tribal governance, public safety, utilities, and recreation. Local governments’ ability to meet community needs depends on revenue from taxes or other locally generated income, as well as funding from the state and federal government.
Anchorage’s public sector is forecasted to lose some ground in 2013, with the largest declines at the federal level. Federal government employment fell by 400 in 2012, and many agencies are considering additional ways to trim their budgets. A much‐larger‐than‐normal contingent of federal employees was also expected to retire in December2012, and it’s uncertain how many will be replaced. At the state government level, including the University of Alaska, employment in Anchorage will likely remain steady, as the state’s revenue picture remains relatively healthy.65
Employment in local government is forecasted to drift downward in 2013. The Municipality of Anchorage’s workforce is already downsizing, and the 2013 budget will support slightly fewer positions. Local government’s largest employer, the Anchorage School District, is likely to move in a similar direction. AEDC forecasts a tightening of the government job market in 2012 that is expected to continue in 2013. The sector lost 400 jobs in 2012, and projects an additional loss of 300 in the coming year. In summary, there will be 30,200 government jobs in Anchorage at the end of 2013, down from 31,300 in 2010, a spike driven primarily by temporary census‐related positions. Government work supplies nearly 1‐in‐5 of the total jobs in the Anchorage economy.66 AEDC’s 2013 forecast states a proposed cut of 215 positions in the Anchorage School District’s 2013‐14 budget comprises a majority of the decline in the government sector
Natural Resource Development
The natural resource sector, mainly petroleum, is Anchorage's most visible industry, with many high rises bearing the logos of large multinationals such as BP, and ConocoPhillips. While field operations are centered on the Alaska North Slope and south of Anchorage around Cook Inlet, the majority of offices and administration are found in Anchorage. The headquarters building of ConocoPhillips Alaska, a subsidiary of ConocoPhillips, is located in downtown Anchorage. ConocoPhillips has the tallest building in Alaska. The BP Energy Resource Center is often used by nonprofit and public service organizations in the Anchorage community. Many companies who provide oilfield support services are likewise headquartered outside of Anchorage but maintain a substantial presence in the city, most notably Arctic Slope Regional Corporation and CH2M HILL.
The Trans Alaska Pipeline System (TAPS) was constructed between 1974 and 1977 to bring North Slope oil to market. TAPS is operated by Alyeska which is owned by the major North Slope oil companies. The major owner of the company is BP with 46.93% of the shares, ConocoPhillips (28.29%), and Exxon Mobil (20.34%), and Koch Alaska Pipeline Company (3.08%), and Unocal (1.36%). Alyeska is a company headquartered in Anchorage, with 800 employees.
65 Alaska Economic Trends, Employment Forecast for 2013, by Caroline Schultz, Neal Fried, Alyssa Shanks, and Mali Abrahamson, January 2013, found at http://laborstats.alaska.gov/trends/jan13art1.pdf 66 Alaska Journal of Commerce, Elwood Brehmer, February Issue, found at http://www.alaskajournal.com/Alaska‐Journal‐of‐Commerce/February‐Issue‐2‐2013/AEDC‐forecasts‐continued‐growth‐for‐Anchorage‐economy‐in‐2013/#ixzz2TIzumOsp
Source: 2012 Alaska Military Images: Alaska National Guard | Photos | ADN.www.adn.com
According to findings released by the Alaska Department of Natural Resources (DNR), Alaska’s economy depends heavily on revenues related to petroleum development, which totaled $4.57 billion in fiscal year 2007. 67 The petroleum industry is Alaska’s largest industry, annually spending $2.1 billion, including $422 million on payroll and $1.7 billion on goods and services. Overall, this spending generates 33,600 jobs, $1.4 billion in payroll, and value added to the Alaska economy of $1.8 billion for total output of $3.1 billion. The findings include that oil and gas accounts for 12 percent of private sector jobs and 20 percent of private sector payroll. The oil and gas industry has the highest monthly wage in Alaska, averaging $7,754, which is 2.8 times higher than the statewide average of $2,798. The DNR findings note that in Anchorage, it is estimated that about 2,400 workers are employed by the oil and gas industry. Estimated total payroll is over $239 million with an additional $845 million in goods and services in the Anchorage economy. Indirect impact of the oil and gas industry is estimated to be 11,600 jobs.
Some facts featured by the Resource Development Council are listed below:68
The oil industry continues to be the largest source of unrestricted revenue to the state, accounting for approximately 93 percent, or $8.86 billion, of all unrestricted state revenue in FY 2012. The State’s unrestricted general fund revenues from the oil and gas industry in FY 2013 is expected to reach $6.9 billion and $6.4 billion in FY 2014. (Alaska Department of Revenue)
A third of Alaska jobs – about 127,000 – are oil‐related, dependent in some way on oil production or spending of state oil revenue. Close to 20 percent more jobs – 60,000 – can be traced to the spinoff benefits of oil wealth. Altogether, half of Alaska’s jobs – 187,000 – can be traced to oil development. These spinoffs have helped other parts of the economy prosper and add more jobs than they otherwise could have (University of Alaska Institute of Social and Economic Research).
Health Care Services
Alaska’s elderly population is expected to grow by at least 50 percent from 2008 to 2018.69 State economists identified 17 of Alaska’s 20 fastest growing occupations as health care related. These occupations will likely serve the elderly and include: home health aides, pharmacists, pharmacy technicians, and personal and home care aides. Other health care occupations among the 10 fastest growing are respiratory therapists, licensed practical and vocational nurses, medical assistants, surgical technologists, registered nurses, and physician assistants.
Health care is one of the largest and most dynamic industries in Alaska, accounting for eight percent of total employment and around 16 percent of the value produced by the state’s economy. Between 2000 and 2009, health care employment increased 46 percent, about five times as fast as the state’s population and three times as fast as all other sectors of the economy.70
While job growth is good news for the economy it also places heavy strains on an industry already burdened by unacceptably high vacancy rates in key occupations. State rates for primary care professions, as determined by the 2009 Health Workforce Vacancy Study conducted by the Alaska Center for Rural Health, range from 12.9 percent for community health aides and practitioners to 37.4 percent for pediatric nurse practitioners. Though registered nurses had a comparatively moderate vacancy rate at 10.1 percent,
67 Department of Natural Resources, Chapter Eleven: Summary and Director’s Final Finding, 2009, http://dog.dnr.alaska.gov/Leasing/Documents%5CBIF%5CCook_Inlet%5CCookInlet_BIF2009_11_Summary.pdf
68 Resource Development Council, website found at http://www.akrdc.org/issues/oilgas/overview.html
69 Alaska’s 10‐Year Occupational Forecast, 2008 to 2018, by Kelsey Kost and Todd Mosher, Alaska Economic Trends, September 2010
70 Health Workforce Development Plan, found at http://labor.alaska.gov/awib/forms/Healthcare_Workforce_Plan.pdfAlaska

this relatively large profession was calculated to have over 320 vacant positions. The above vacancy rates are statewide averages; rates in rural Alaska are even more dramatic. These vacancy figures coupled with anticipated high increases in demand for workers indicate a significant skills gap in the health care workforce at the present time, a gap that without increased attention can only worsen.
The Anchorage Economic Development Corporation points to health care services which began expansion in 2009, adding 500 in 2012. The 2013 Economic Forecast points to the addition of 2,500 health care jobs that have been added in Anchorage, to account for approximately 17,700 local jobs. AEDC expects this sector to add 400 jobs in 2013. Hospital employment accounts for one third of all health care jobs in Anchorage, and continues to grow slowly. AEDC reports over the past three years, hospital employment is up 5 percent, while out‐patient health care employment is up 21 percent (now totaling about 9,000 jobs), and nursing and residential care is up 55 percent (now with 2,700 jobs).
Tourism and Leisure
The leisure and hospitality industry in Anchorage which includes accommodation, food services, arts, entertainment, and recreation grew by 2.4 percent last year, or 400 jobs from 2011 to 2012.71 Neal Fried, state economists with the Alaska Department of Labor and Workforce projects this trend to continue in 2013. State economists speculate that food service, which represents two‐thirds of industry employment, will also continue to grow. Restaurants benefit from the visitor industry as well as w hat appears to be an insatiable local demand or new eateries. During the past decade, employment in this industry has grown by more than 1,000. The list of new restaurants that opened in Anchorage continues to grow, with Olive Garden opening its first Alaska restaurant at the beginning of 2012 and a second at the end of the year.
Table 5 is consist with expected employment forecasts and economic sectors, showing the largest private employers are related to transportation, health care, retail, natural resources (oil, mining), and tourism and leisure.
71 Alaska Economic Trends, Anchorage poised for fourth straight year of growth, Neal Fried, January 2013
Providence Hospital, Anchorage, Alaska

MA 45 Table 5 Anchorage’s Largest Private Sectors in 2010 by Average Number Monthly Employment
Anchorage’s Largest Private Sector in 2010 Employers with
4,000+ to 1,000 Average Monthly Employment
Rank1 Firm Name Average Monthly
Employment in 20102 Type of Business
1 Providence Health & Services 4,000+ Hospital/medical center
2 Wal‐Mart/Sam’s Club 3,000 to 3,249 Grocery/general merchandise
3 Carrs/Safeway 2,750 to 2,999 Grocery
4 Fred Meyer 2,500 to 2,749 Grocery/general merchandise
5 ASRC Energy Services " Oil field services
6 BP Exploration Alaska 2,000 to 2,249 Oil and gas extraction
7 CH2M HILL 1,750 to 1,999 Oil and gas extraction
8 NANA Management Services " Catering/lodging/security
9 Alaska Native Tribal Health Consortium (ANTHC)3
1,500 to 1,749 Hospital/medical center
10 Alaska Airlines " Air carrier
11 GCI Communications 1,250 to 1,499 Communications
12 Southcentral Foundation4 1,250 to 1,499 Hospital/medical Center
13 FedEx 1,000 to 1,249 Air freight/courier service
14 ConocoPhillips Alaska 1,000 to 1,249 Oil and gas extraction
15 AK USA Federal Credit Union 1,000 to 1,249 Financial services
16 UPS (United Parcel Service) 1,000 to 1,249 Air freight/courier service
Source: Alaska Department of Labor and Workforce Development, Research and Analysis Section, Alaska Economic Trends, July 2010 found at http://laborstats.alaska.gov/trends/jul10art1.pdf
1 When two or more employers had the same number of employees, they were ranked by unrounded employment.
2 These are ranges that a company’s or organization’s specific employment number falls into: the ranking is based on the specific employment number.
3 This count excludes approximately 293 of ANTHC’s federal employees.
4 This count excludes approximately 130 of Southcentral Foundation’s federal employees.

Table 6 shows Anchorage’s largest percentage of new hires in 2010 was for retail sales workers (13%), followed by food and beverage serving workers (11%). This information is consistent with an expected upward trend toward tourism and leisure.
MA 45 Table 6 2010 Total New Hires in Anchorage by Occupation and Percentage
2010 Anchorage New Hires By Occupation and Percentage 52,314 100%
Retail Sales Workers 7,032 13%
Food and Beverage Serving Workers 5,748 11%
Construction Trades Workers 4,311 8%
Cooks and Food Preparation Workers 3,463 7%
Other Office and Administrative Support Workers 3,428 7%
Information and Record Clerks 2,985 6%
Other Food Preparation and Serving Related Workers 2,957 6%
Material Moving Workers 2,740 5%
Other Personal Care and Service Workers 2,709 5%
Building Cleaning and Pest Control Workers 2,695 5%
Motor Vehicle Operators 1,689 3%
Entertainers and Performers, Sports and Related Workers 1,565 3%
Secretaries and Administrative Assistants 1,509 3%
Financial Clerks 1,343 3%
Other Healthcare Support Occupations 1,288 2%
Other Sales and Related Workers 1,204 2%
Material Recording, Scheduling, Dispatching, and Distributing Workers 1,175 2%
Grounds Maintenance Workers 1,156 2%
Nursing, Psychiatric, and Home Health Aides 1,125 2%
Other Protective Service Workers 1,097 2%
Vehicle and Mobile Equipment Mechanics, Installers, and Repairers 1,095 2%
Source: Alaska Department of Labor and Workforce Development, New Hire Data, Excel Spreadsheet, found at http://labor.alaska.gov/research/newhire/newhire.htm
Construction
Anchorage construction employment fell each year between 2007 and 2011; but, in 2012 it changed course and grew moderately. Building values in Anchorage also increased somewhat for the first time in four years, based on data through October.72 Residential building is expected to pick up in 2013 after a number of lackluster years, spurred by low interest rates, greater consumer confidence, and the smallest housing inventory since 2005. Commercial activity, on the other hand, is expected to stay about the same. Government will remain an important source of construction projects, with a bright outlook at the state and local levels. Large state capital budgets have been a significant asset for a number of years, and November brought an additional plus with the voter approval of a $453.5million statewide bond package. The biggest downside in the near term is the rapidly shrinking Army Corps of Engineers construction budget. The Corps was a major source of work for a decade, underwriting annual construction budgets that topped $550 million statewide. That amount fell to $269 million in 2012, and 2013 is forecasted at just 20 percent of that amount.
72 Ibid, Alaska Economic Trends, January 2013

Table 7 shows the significant drop in new housing units built in Anchorage from 2005 through 2011. The greatest drop was from 2009 to 2010, with a 174% decrease.
MA 45 Table 7 Total New Housing Units, Anchorage, 2005‐2011
Year Total Percentage Change 2005 673 2006 701 4% 2007 382 84% 2008 217 76% 2009 269 24% 2010 98 174% 2011 186 90%
MA 45 Table 8 Total New Single Family & Duplex Units, 2005‐2011
Year Total Percentage Change 2005 1049 2006 669 36% 2007 479 28% 2008 311 54% 2009 296 5% 2010 370 20% 2011 275 26%

Table 9 below shows a percentage changes by business activity. Area that shows an increase is in oil and gas (15%) and local education (11%) and Professional & Business Services (6%). Both Educational & Health Services and Health Care each grew by 4%. Businesses areas of loss reflect Information (‐3%) and Financial Activities (‐4%). State economists are forecasting a growing demand for health care.1 These economists point to an expected additional 38,749 jobs between 2010 and 2020, an overall increase of 12%. Health care and social assistance, related to Alaska’s aging population, is projected to grow by 31%‐‐the highest of any industry. The second highest growth will be in mining, minus oil and gas, at 19%.
MA 45 Table 9 Business Activity, 2011 to 2012
Municipality of 2012 Annual Average
2011 Annual Average
Number of Workers Change
Percentage
Anchorage Number of Workers Annual Average 2011 to 2012 Change 2011 to 2012 Total Nonfarm Wage & Salary 157,200 153,800 3,400 2% Goods‐Producing 14,100 13,200 900 6% Mining and Logging 3,400 3,000 400 12% Mining 3,000 ‐3,000 0% Oil & Gas 3,300 2,800 500 15% Construction 8,400 8,100 300 4% Manufacturing 2,300 2,100 200 9% Service‐Providing 143,000 140,700 2,300 2% Trade, Transportation, Utilities 33,000 33,100 ‐100 0% Wholesale Trade 4,600 4,600 0 0% Retail Trade 17,100 17,100 0 0% Trans/Warehouse/Utilities 11,300 11,300 0 0% Air Transportation 3,000 2,900 100 3% Information 3,900 4,000 ‐100 -3% Financial Activities 8,200 8,500 ‐300 -4% Professional & Business Services 20,000 18,900 1,100 6% Educational & Health Services 24,600 23,700 900 4% Health Care 18,000 17,200 800 4% Leisure & Hospitality 16,900 16,600 300 2% Accommodation 3,200 3,200 0 0% Food Services & Drinking Places 11,400 11,000 400 4% Other Services 5,800 5,800 0 0% Government 30,700 30,200 500 2% Federal Government 9,100 9,500 ‐400 ‐4% State Government 10,700 10,700 0 0% State Education 2,600 2,500 100 4% Local Government 10,800 10,000 800 7% Local Education 8,000 7,100 900 11% Data Source: Alaska Department of Labor and Workforce Development found at http://live.laborstats.alaska.gov/ces/ces.cfm?at=04&a=000020&adj=0
1 Alaska Economic Trends, October 2012, Industry and Occupational Forecasts, 2010 to 2020, Health Care to Lead Industry Growth, by Paul Martz, Economist, October 2012, Volume 32, Number 10

Alaska Workforce Investment Board
Under the Alaska Department of Labor and Workforce Development, the Alaska Workforce Investment Board (AWIB) is “building connections that put Alaskans into good jobs.”[3] The board provides policy oversight of state and federally funded job training and vocational education programs. Board members, a majority of whom are business and industry leaders, look at employment trends and emerging occupations to ensure training is customized and Alaskans are prepared for high demand, good wage jobs. Because of their oversight, public and private educators and training providers connect with employers to ensure the right people are being trained for the right jobs.
The Alaska Career and Technical Education (CTE) Plan, is a joint effort of the Department of Labor and Workforce Development (DOLWD), Department of Education & Early Development (EED), and the University of Alaska (UA) system. The Plan was finalized in August 2010. The legislature appropriated $625,000 to the AWIB for implementation of the state CTE Plan in FY2012 and again in FY2013. Some of the FY2013 grant awardees are listed below. The importance of these awards in relationship to the Anchorage Consolidated Plan, 2013‐2017, is the development of a young labor pool, with specialized skills in computers, construction, law enforcement, and health care is critical to support the Anchorage economy. Many victims of violence throughout the state come to Anchorage for health care, mental health services, and/or relocate for safety reasons. Any developed skilled through any of these types of awarded programs will support the economic structure of the Municipality.
AVTEC – Alaska’s Institute of Technology
Upgrade Structural Welding program
Purchase Submerged‐Arc Welding (SAW) system and train instructor in its use
Update welding curriculum to include SAW training and certifications
Copper River School District
Expand implementation of Personal Learning and Career Planning from grades 6 – 12; emphasis on parent involvement and training for all middle and high school staff
Implement IC3 Program (Internet and Computing Core Certification), an industry‐validated, standards‐based training and certification program for computing and Internet knowledge and skills
Provide IC3 testing and certification for high school, postsecondary, and adults in partnership with Job Center and Prince William Sound Community College
Hiland Mountain Correctional Center
Implement new construction‐related CTE programs for incarcerated women to prepare them for re‐entry into the workforce in high‐skill, high‐wage, high‐demand jobs
Develop programs in Electrical, Forklift Training, and First Aid/CPR
Participants may earn industry certifications and college credit
Lower Yukon School District
Develop and implement the Community Public Safety and Service Training Program in all 10 village school sites
Provide students with foundational knowledge/skills to pursue further coursework in law enforcement, firefighting, healthcare, and social services pathways
Partner with public agencies (Alaska State Troopers, Kuskokwim Campus, Tundra Women’s Coalition, Civil Air Patrol, Rural Fire Protection, Departments of Natural Resources and Fish and Game, and Alaska Highway Safety Office) to provide onsite training at each school
[3] Alaska Department of Labor and Workforce Development, Alaska Workforce Investment Board found at http://labor.alaska.gov/awib/

University of Alaska Anchorage Center for Rural Health
Expand Health Sciences Program of Study in Galena and Tok
Implement Health Sciences Program of Study in Nenana and Delta‐Greely School Districts
Align the secondary programs to post‐secondary programs and credit

Description of the workforce and infrastructure needs of the business community Table 9 below shows a percentage changes by business activity. Area that shows an increase is in oil and gas (15%) and local education (11%) and Professional & Business Services (6%). Both Educational & Health Services and Health Care each grew by 4%. Businesses areas of loss reflect Information (‐3%) and Financial Activities (‐4%). State economists are forecasting a growing demand for health care.1 These economists point to an expected additional 38,749 jobs between 2010 and 2020, an overall increase of 12%. Health care and social assistance, related to Alaska’s aging population, is projected to grow by 31%‐‐the highest of any industry. The second highest growth will be in mining, minus oil and gas, at 19%.
MA 45 Table 9 Business Activity, 2011 to 2012
Municipality of 2012 Annual Average
2011 Annual Average
Number of Workers Change
Percentage
Anchorage Number of Workers Annual Average 2011 to 2012
Change 2011 to 2012
Total Nonfarm Wage & Salary 157,200 153,800 3,400 2% Goods‐Producing 14,100 13,200 900 6% Mining and Logging 3,400 3,000 400 12% Mining 3,000 ‐3,000 0% Oil & Gas 3,300 2,800 500 15% Construction 8,400 8,100 300 4% Manufacturing 2,300 2,100 200 9% Service‐Providing 143,000 140,700 2,300 2% Trade, Transportation, Utilities 33,000 33,100 ‐100 0% Wholesale Trade 4,600 4,600 0 0% Retail Trade 17,100 17,100 0 0% Trans/Warehouse/Utilities 11,300 11,300 0 0% Air Transportation 3,000 2,900 100 3% Information 3,900 4,000 ‐100 -3% Financial Activities 8,200 8,500 ‐300 -4% Professional & Business Services 20,000 18,900 1,100 6% Educational & Health Services 24,600 23,700 900 4% Health Care 18,000 17,200 800 4% Leisure & Hospitality 16,900 16,600 300 2% Accommodation 3,200 3,200 0 0% Food Services & Drinking Places 11,400 11,000 400 4% Other Services 5,800 5,800 0 0% Government 30,700 30,200 500 2% Federal Government 9,100 9,500 ‐400 -4% State Government 10,700 10,700 0 0% State Education 2,600 2,500 100 4% Local Government 10,800 10,000 800 7% Local Education 8,000 7,100 900 11% Data Source: Alaska Department of Labor and Workforce Development found at http://live.laborstats.alaska.gov/ces/ces.cfm?at=04&a=000020&adj=0
1 Alaska Economic Trends, October 2012, Industry and Occupational Forecasts, 2010 to 2020, Health Care to Lead Industry Growth, by Paul Martz, Economist, October 2012, Volume 32, Number 10

Table 10 shows that 93% (140,992) of the total population in the civilian labor force (16+ years) is employed. This table also shows a very high unemployment rate for ages 16‐24. However, the unemployment rate at 7.28 is high. Consequently, Table 11 provides more up to date information showing Anchorage’s average unemployment rate was 5.4 in 2012.
MA 45 Table 10 Labor Force
Labor Force
Total Population in the Civilian Labor Force 152,056
Civilian Employed Population 16 years and over 140,992
Unemployment Rate 7.28
Unemployment Rate for Ages 16‐24 25.58
Unemployment Rate for Ages 25‐65 4.36
Data Source: 2005‐2009 ACS Data, HUD populated
MA 45 Table 11 Anchorage Annual Unemployment Rate, 2000‐2012
Annual Unemployment Rates for Municipality of Anchorage
1998 to 2012
Year Annual
2012 5.4
2011 6.1
2010 6.8
2009 6.5
2008 5.2
2007 4.9
2006 5.2
2005 5.5
2004 5.9
2003 6.2
2002 5.7
2001 4.8
2000 4.9
Source: Alaska Department of Labor and Workforce Development found at: http://live.laborstats.alaska.gov/labforce/labdata.cfm?s=5&a=0

Table 12 shows the categories with the greatest percentage of new hires was for retail sales workers (13%) and food and beverage serving workers (11), followed by construction trade (8%), and cooks (7%) and other administrative support workers (7%).
MA 45 Table 12 Total New 2010 Hires in Anchorage by Occupation and Percentage
Anchorage 2010 New Hires By Occupation 52,314 100%
Retail Sales Workers 7,032 13%
Food and Beverage Serving Workers 5,748 11%
Construction Trades Workers 4,311 8%
Cooks and Food Preparation Workers 3,463 7%
Other Office and Administrative Support Workers 3,428 7%
Information and Record Clerks 2,985 6%
Other Food Preparation and Serving Related Workers 2,957 6%
Material Moving Workers 2,740 5%
Other Personal Care and Service Workers 2,709 5%
Building Cleaning and Pest Control Workers 2,695 5%
Motor Vehicle Operators 1,689 3%
Entertainers and Performers, Sports and Related Workers 1,565 3%
Secretaries and Administrative Assistants 1,509 3%
Financial Clerks 1,343 3%
Other Healthcare Support Occupations 1,288 2%
Other Sales and Related Workers 1,204 2%
Material Recording, Scheduling, Dispatching, and Distributing Workers 1,175 2%
Grounds Maintenance Workers 1,156 2%
Nursing, Psychiatric, and Home Health Aides 1,125 2%
Other Protective Service Workers 1,097 2%
Vehicle and Mobile Equipment Mechanics, Installers, and Repairers 1,095 2%
Source: Alaska Department of Labor and Workforce Development, New Hire Data, Excel Spreadsheet, found at http://labor.alaska.gov/research/newhire/newhire.htm

Table 13 shows the greatest percent of workers are in Trade, Transportation and Utilities category (22.3%), Educational and Health Services (14.5%), and Professional and Business Services (11.5%), and Leisure and Hospitality (11.3%). Females are employed in the Educational and Health Services by the greatest number (14,247), while males have a greater number of employed in the Trade, Transportation and Utilities category. The largest number for workers age 50+ is with the Trade, Transportation and Utilities (7,001), followed by Educational and Health Services (5,330), and followed by local government (4,690).
MA 45 Table 13 2010 Anchorage Workers by Industry
Number of workers
Percent of total employed Female Male
Age 45 and over
Age 50 and over
Natural Resources and Mining 5,257 4.1 1,144 4,112 2,498 1,820
Construction 7,036 5.5 1,036 5,999 2,482 1,652
Manufacturing 2,061 1.6 593 1,468 825 554
Trade, Transportation and Utilities 28,723 22.3 11,324 17,390 10,030 7,001
Information 3,548 2.8 1,558 1,989 1,415 977
Financial Activities 7,745 6 4,888 2,856 2,838 1,941
Professional and Business Services 14,819 11.5 6,740 8,072 5,737 4,058
Educational and Health Services 18,693 14.5 14,247 4,440 7,457 5,330
Leisure and Hospitality 14,544 11.3 7,314 7,223 3,243 2,207
State Government 9,140 7.1 4,995 4,141 5,072 3,803
Local Government 11,699 9.1 7,357 4,340 6,369 4,690
Other 5,185 4 3,048 2,136 1,926 1,382
Unknown 405 0.3 183 222 98 65
Source: Alaska Department of Labor and Workforce Development, Alaska Local and Regional Information found at: H:\Anchorage Motherload AK Dept of Labor.mht
Table 14 shows that similar to other cities across the nation, at 84% the majority of the labor pool takes less than thirty minutes to arrive at work.2 According to a recent Census report in 2009 it took an average 25 minutes for workers across the U.S. to travel to work. Average travel time to work was highest in Maryland (31.8 minutes), followed by New York (31.3 minutes). Both North and South Dakota had the shortest travel time with 16.1 minutes and 16.8 respectively.
MA 45 Table 14 Labor Pool Travel Time
Travel Time Number Percentage
< 30 Minutes 115,924 84%
30‐59 Minutes 18,265 13%
60 or More Minutes 3,165 2%
Total 137,354 100%
Data Source: 2005‐2009 ACS Data
Table 15 shows the greatest number of persons employed are those with Some college or Associate’s degree (41,083) and Bachelor’s degree or higher (41,668); while those with less than a high school education have a comparatively smaller number (5,963) in the labor force. Overall, education is aligned with employment. For example, for those with Some college or Associate’s degree, there is a higher number employed (41,083) rather than not employed (2,742), especially when compared to those with a High school graduate (25,013) that are employed and those who are not employed (2,298).
MA 45 Table 15 Educational Attainment by Employment Status (Population 16 and Older)
In Labor Force Educational Attainment Civilian Employed Unemployed Not in Labor Force
Less than high school graduate 5,963 733 3,586
High school graduate (includes equivalency) 25,013 2,298 8,245
Some college or Associate's degree 41,083 2,742 9,743
Bachelor's degree or higher 41,668 954 6,876
Data Source: 2005‐2009 ACS Data
2 Census Bureau Releases 2010 American Community Survey Single Year Estimates, September 22, 2011 found at: http://www.census.gov/newsroom/releases/archives/american_community_survey_acs/cb11‐158.html

Table 16 shows the 45‐65 age group has the largest number of bachelor’s and graduate degrees; while the 18‐24 years of age group has the least amount of college education. However, there is a large population (14,217) in the 25‐34 years of age that have some college, but no degree. The largest percentage (34%) in the labor pool is aged 45‐65, which also has the largest number of college degree (some college thru graduate or professional degree) totaling 49,866.
MA 45 Table 16 Educational Attainment by Age
Age Total
18–24 yrs 25–34 yrs 35–44 yrs 45–65 yrs 65+ yrs for All
Less than 9th grade 434 803 789 1,470 2,024 5,520
9th to 12th grade, no diploma 4,622 2,378 2,247 2,660 1,648 13,555
High school graduate, GED, or alternative
12,187 10,958 9,224 15,857 5,174 53,400
Some college, no degree 13,575 14,217 10,503 19,047 4,242 61,584
Associate's degree 980 3,030 3,771 6,153 885 14,819
Bachelor's degree 2,014 10,058 9,326 14,195 2,580 38,173
Graduate or professional degree 140 2,753 4,268 10,471 2,293 19,925
Total 33,952 44,197 40,128 69,853 18,846 206,976
Percent 16% 21% 19% 34% 9% 100%
Data Source: 2005‐2009 ACS Data, HUD populated with exceptions of percentages
Table 17 is consistent with the expectations shown in Table 13, where the largest percentage in the labor pool aged 45‐65 years of age are making the highest median earnings, compared to those with no high school or the equivalency of high school.
MA 45 Table 17 Educational Attainment – Median Earnings in the Past 12 Months
Educational Attainment Median Earnings in the Past 12 Months
Less than high school graduate 23,226
High school graduate (includes equivalency) 32,296
Some college or Associate's degree 39,546
Bachelor's degree 50,430
Graduate or professional degree 66,575
Data Source: 2005‐2009 ACS Data, HUD populated

MA 45 Table 18 Wages for Occupational Categories
Occupational Category *Average Annual Wages
1 Architecture and Engineering $84,900
2 Arts/Design/Entertainment/Sports/Media $42,600
3 Building/Grounds Cleaning & Maintenance $29,500
4 Business and Financial Operations $64,000
5 Community and Social Services $45,600
6 Computer and Mathematical $66,700
7 Construction and Extraction $57,900
8 Education, Training, and Library $49,800
9 Food Preparation and Serving Related $24,000
10 Healthcare Practitioners and Technical $76,100
11 Healthcare Support $35,000
12 Installation, Maintenance, and Repair $53,600
13 Legal $80,000
14 Life, Physical, and Social Science $62,600
15 Management $85,700
16 Office and Administrative Support $38,000
17 Personal Care and Service $28,300
18 Production $35,200
19 Protective Service $49,700
20 Sales and Related $30,500
21 Transportation and Material Moving $44,600
Source: Alaska Department of Labor and Workforce Development, Alaska’s 10‐Year Occupational Forecast, 2008 to 2018, by Kelsey Kost and Todd Mosher, Economists, Alaska Economic Trends, September 2010 found at: http://laborstats.alaska.gov/trends/sep10art1.pdf
*1 Wages are based on May 2009 OES occupation wage estimates for Alaska weighted by base year (2008) employment.

Table 10 shows the greatest percent of workers are in Trade, Transportation and Utilities category (22.3%), Educational and Health Services (14.5%), and Professional and Business Services (11.5%), and Leisure and Hospitality (11.3%). Females are employed in the Educational and Health Services by the greatest number (14,247), while males have a greater number of employed in the Trade, Transportation and Utilities category. The largest number for workers age 50+ is with the Trade, Transportation and Utilities (7,001), followed by Educational and Health Services (5,330), and followed by local government (4,690).
MA 45 Table 10 2010 Anchorage Workers by Industry
Number of
workers
Percent of total
employed Female Male
Age 45 and over
Age 50 and over
Natural Resources and Mining 5,257 4.1 1,144 4,112 2,498 1,820
Construction 7,036 5.5 1,036 5,999 2,482 1,652
Manufacturing 2,061 1.6 593 1,468 825 554
Trade, Transportation and Utilities 28,723 22.3 11,324 17,390 10,030 7,001
Information 3,548 2.8 1,558 1,989 1,415 977
Financial Activities 7,745 6 4,888 2,856 2,838 1,941
Professional and Business Services 14,819 11.5 6,740 8,072 5,737 4,058
Educational and Health Services 18,693 14.5 14,247 4,440 7,457 5,330
Leisure and Hospitality 14,544 11.3 7,314 7,223 3,243 2,207
State Government 9,140 7.1 4,995 4,141 5,072 3,803
Local Government 11,699 9.1 7,357 4,340 6,369 4,690
Other 5,185 4 3,048 2,136 1,926 1,382
Unknown 405 0.3 183 222 98 65
Source: Alaska Department of Labor and Workforce Development, Alaska Local and Regional Information found at: H:\Anchorage Motherload AK Dept of Labor.mht

Anchorage School District
The Anchorage School District (ASD) offers a Science, Technology, Engineering, and Math (STEM) curriculum.[2] The STEM curriculum encompasses the desired learning that students will need to prepare them for their lives in a future that perhaps they don’t quite understand themselves. In the ASD, efforts are combining these areas into one realm does not mean that the instruction will immediately change. The ASD has been doing very well at educating students and there is no reason to change that. ASD can improve, however, and are making steps to prepare the students a bit better for the rapidly changing technological world they will enter in the labor force. A primary objective of the STEM curriculum is to integrate the teaching of the four composite areas so that the students better understand the connections among the areas. Most students already understand this concept, but all students must understand it. Highlighted below are some ASD Programs related to STEM.
ASD Robotics competitions
Beginning in 1999, the ASD has been involved in robotics competitions to involve students in STEM activities. The number of schools involved in this exciting team sport has increased dramatically. ASD anticipates that more schools will try some level of the competitions, and that more students will participate. The FIRST competitions, in particular, are friendly while also being competitive. The goal is not to trash another team’s robot, but instead to work with it to achieve a goal. Bartlett High School's robotics team competed in the World Robotics Festival in April 2011.
Dimond High School Engineering Academy
The DHS Engineering Academy is designed to prepare students for a two‐year or a four‐year engineering degree program. Five engineering courses follow the Project Lead the Way (PLTW) curriculum that may qualify for articulated agreements with universities in Alaska and across the U.S. Engineering Academy courses are project‐based. Students are connected with engineering professors at UAA and with engineers in businesses that serve on the Engineering Academy Advisory Council.
Students may enter the Engineering Academy as freshmen and continue the four‐year sequence or they may take individual courses when space is available.
Service High, Biomedical Career Academy (BCA)
The Biomedical Career Academy at Service aims to prepare students for a successful career in the health care industry. Classes within the BCA focus heavily on rigorous academics within a traditional curriculum, integrating health care and medically based activities within the classroom and community. Students have the option of preparing themselves for a position directly after high school within a health care setting and/or to focus on preparation for a traditional college degree.
All students are required to be members of Health Occupation Students of America, a nationally recognized student health care organization, and will also be obtaining current first‐aid/CPR certification. Seniors, upon the successful completion of prerequisites, will take a capstone class which focuses on individual research and hands‐on learning. The BCA students will be interacting with business partners in the community thus will be held to high standards of professional conduct and communication.
[2] Anchorage School District found at http://www.asdk12.org/depts/stem/

Table 13 shows the 45‐65 age group has the largest number of bachelor’s and graduate degrees; while the 18‐24 years of age group has the least amount of college education. However, there is a large population (14,217) in the 25‐34 years of age that have some college, but no degree. The largest percentage (34%) in the labor pool is aged 45‐65, which also has the largest number of college degree (some college thru graduate or professional degree) totaling 49,866.
MA 45 Table 13 Educational Attainment by Age
Age Total
18–24 yrs 25–34 yrs 35–44 yrs 45–65 yrs 65+ yrs for All
Less than 9th grade 434 803 789 1,470 2,024 5,520
9th to 12th grade, no diploma
4,622 2,378 2,247 2,660 1,648 13,555
High school graduate, GED, or alternative
12,187 10,958 9,224 15,857 5,174 53,400
Some college, no degree 13,575 14,217 10,503 19,047 4,242 61,584
Associate's degree 980 3,030 3,771 6,153 885 14,819
Bachelor's degree 2,014 10,058 9,326 14,195 2,580 38,173
Graduate or professional degree
140 2,753 4,268 10,471 2,293 19,925
Total 33,952 44,197 40,128 69,853 18,846 206,976
Percent 16% 21% 19% 34% 9% 100%
Data Source: 2005‐2009 ACS Data, HUD populated with exceptions of percentages

MA 45 Table 15 Wages for Occupational Categories
Occupational Category *Average Annual Wages
1 Architecture and Engineering $84,900
2 Arts/Design/Entertainment/Sports/Media $42,600
3 Building/Grounds Cleaning & Maintenance $29,500
4 Business and Financial Operations $64,000
5 Community and Social Services $45,600
6 Computer and Mathematical $66,700
7 Construction and Extraction $57,900
8 Education, Training, and Library $49,800
9 Food Preparation and Serving Related $24,000
10 Healthcare Practitioners and Technical $76,100
11 Healthcare Support $35,000
12 Installation, Maintenance, and Repair $53,600
13 Legal $80,000
14 Life, Physical, and Social Science $62,600
15 Management $85,700
16 Office and Administrative Support $38,000
17 Personal Care and Service $28,300
18 Production $35,200
19 Protective Service $49,700
20 Sales and Related $30,500
21 Transportation and Material Moving $44,600
Source: Alaska Department of Labor and Workforce Development, Alaska’s 10‐Year Occupational Forecast, 2008 to 2018, by Kelsey Kost and Todd Mosher, Economists, Alaska Economic Trends, September 2010 found at: http://laborstats.alaska.gov/trends/sep10art1.pdf
*1 Wages are based on May 2009 OES occupation wage estimates for Alaska weighted by base year (2008) employment.

MA 50 Table 1– Anchorage Median Household Income Below 80% AMI by Census Tract , 2010
Census Tracts below 80% Area Median Income $66,880
Census Tract Total Population Population In Households Total Households
Median Household Income
6 7,747 7,250 2,297 $35,788
19 4,194 3,881 1,647 $39,390
9.01 4,906 4,153 1,802 $39,481
14 5,224 5,101 2,378 $39,521
5 1,988 1,975 956 $41,330
10 4,131 3,712 1,900 $42,022
7.03 5,706 5,445 2,051 $44,567
20 3,748 3,748 1,275 $45,605
9.02 3,141 3,141 1,402 $47,154
8.02 4,407 4,351 1,860 $48,190
11 940 635 428 $49,826
21 3,787 3,773 1,686 $50,217
8.01 7,323 7,206 2,380 $50,952
3 8,000 6,059 1,707 $51,582
18.02 5,537 5,184 2,125 $54,777
22.02 2,960 2,936 1,296 $56,681
4 5,937 5,199 1,246 $58,651
7.01 5,949 5,934 1,969 $63,276
17.31 5,823 5,784 2,064 $63,404
Total: 91,448 85,467 32,469

MA 50 Table 2 Census Tracts above 80% Median Income and below Median Income $83,600
Community Council Census Tract Total Population Population In Households
Total Households Median Household
Income
Girdwood 29 2,570 2,566 925 $67,983
Abbott Loop 28.11 6,313 6,304 2,574 $68,824
Campbell Park 18.01 4,907 4,900 1,900 $68,860
Bay Shore/Klatt 27.12 9,068 8,966 3,069 $69,508
Abbott Loop 26.01 4,784 4,750 1,473 $69,608
Sand Lake 23.03 9,273 9,199 3,158 $69,657
Airport Heights 16.01 4,092 3,924 1,480 $72,021
Northeast (Muldoon) 7.02 5,107 5,062 1,853 $72,883
Spenard 24 3,299 3,161 1,187 $72,946
University Area, Scenic Foothills 17.01 6,843 6,817 2,658 $73,276
University Area 16.02 4,224 3,705 1,368 $73,971
Eagle River 2.01 4,110 4,110 1,532 $75,164
Eagle River 2.02 5,947 5,932 2,113 $76,837
Sand Lake 23.02 4,791 4,753 1,784 $78,358
Taku/Campbell 25.02 5,236 5,228 2,213 $78,480
Russian Jack Park 17.02 5,258 5,225 1,888 $78,662
South Addition 12 3,718 3,531 1,918 $81,167
Birchwood 1.02 5,259 5,243 1,654 $81,273
Taku/Campbell 25.01 4,993 4,971 1,925 $82,750

MA 50 Table 3– Percentage of American Indian/AK Native Households by Census Tracts At Least 20% Greater than Citywide Percentage
Anchorage Census Tract
Percentage of American Indian/AK Native Households by Census Tract At
Least 20% Greater than Citywide Percentage of 7.9%
20% Higher = or > 9%)
Community Council
Ranking by Unemployment Rate, Estimate; Population 16 years and Over by
Census Tract
Ranking by Percentage of People Whose
Income in the Past 12 Months is Below the Poverty Level—All
People by Census Tract
Ranking of Vacant Housing
By Census Tract
9.01 21% Fairview/Airport Heights 11 2 9
6 17% Mt. View 6 1 7
11 16% Downtown 1 6 2
20 14% Spenard 24 5 8
18.02 13% University Area/Campbell Park
8 21 12
7.03 13% Northeast (Muldoon) 2 13 5
19 13% Midtown 29 3 23
14 12% North Star 12 14 14
8.02 12% Russian Jack 3 8 31
16.02 11% University Area 10 26 21
8.01 11% Russian Jack Park 7 4 33
21 11% Spenard 15 19 6
24 10% Spenard 14 29 25
7.01 10% Northeast (Muldoon) 17 16 32
28.11 10% Abbott Loop 18 20 17
17.31 10% Northeast (Muldoon) 5 11 27

MA 50 Table 4– Percentage of African American Households by Census Tract At Least 20% Greater than Citywide Percentage
Anchorage Census Tract
Percentage of African American Households by Census Tract At Least 20% Greater than Citywide Percentage of 5.6%
20% = or > 7%
Community Council
Ranking by Unemployment Rate, Estimate Ranking by Unemployment Rate,
Estimate; Population 16 years and Over by Census Tract; Population 16 years and Over by Census Tract
Ranking by Percentage of People Whose Income in the Past 12 Months is
Below the Poverty Level—All People by Census Tract
Ranking of Vacant Housing
By Census Tract
9.02 15% Fairview 4 15 24
6 14% Mt. View 6 1 7
7.02 13% Northeast (Muldoon) 42 7 29
7.01 13% Northeast (Muldoon) 17 16 32
9.01 13% Fairview/Airport Heights 11 2 9
3 12% JBER 36 35 22
8.02 11% Russian Jack Park 3 8 31
8.01 10% Russian Jack Park 7 4 33
7.03 10% Northeast (Muldoon) 2 13 5
17.31 10% Northeast (Muldoon) 5 11 27
4 10% JBER 9 23 55
17.01 9% University Area/Scenic Foothills
28 10 40
17.32 9% Scenic Foothills 39 33 49
10 7% Fairview 16 9 4
11 7% Downtown 1 6 2
19 7% Midtown 29 3 23
5 7% Government Hill 47 28 18
17.02 7% Northeast (Muldoon) 20 30 51

MA 50 Table 5– Percentage of Asian Households by Census Tract At Least 20% Greater than Citywide Percentage
Anchorage Census Tract
Percentage of Asian Households by Census Tract At Least 20%
Greater than Citywide Percentage 8.10%
20% = or > 10%
Community Council
Ranking by Unemployment Rate, Estimate Ranking by Unemployment Rate,
Estimate; Population 16 years and Over by Census Tract; Population 16 years and Over by Census Tract
Ranking by Percentage of People Whose Income in the Past 12 Months is
Below the Poverty Level—All People by Census Tract
Ranking of Vacant Housing
By Census Tract
6 18% Mt. View 6 1 7
22.01 17% Turnagain 32 44 28
19 17% Midtown 29 3 23
7.03 16% Northeast (Muldoon) 2 13 5
5 16% Government Hill 47 28 18
8.01 15% Russian Jack Park 7 4 33
20 15% Spenard 24 5 8
27.12 14% Bayshore/Klatt 25 24 19
26.01 13% Abbott Loop 30 34 13
18.02 13% University Area/Campbell
Park 8 21 12
28.11 13% Abbott Loop 18 20 17
26.02 12% Abbott Loop 23 39 43
8.02 12% Russian Jack 3 8 31
9.01 11% Fairview/Airport Heights 11 2 9
23.03 11% Sand Lake 34 12 34
23.01 10% Sand Lake 41 50 48
9.02 10% Fairview 4 15 24

MA 50 Table 6– Percentage of Native‐Hawaiian/Pacific Islander Households by Census Tract At Least 20% Greater than Citywide Percentage
Anchorage Census Tract
Percentage of Native‐Hawaiian/Pacific Islander Households by Census Tract At Least 20%
Greater than Citywide Percentage of 2%
20% = or > 2.4%
Community Council/Area
Ranking by Unemployment Rate, Estimate Ranking by Unemployment Rate,
Estimate; Population 16 years and Over by Census Tract; Population 16 years and Over by Census Tract
Ranking by Percentage of People Whose Income in the Past 12 Months is
Below the Poverty Level—All People by Census Tract
Ranking of Vacant Housing
By Census Tract
6 9% Mt. View 6 1 7
9.02 7% Fairview 4 15 24
8.01 7% Russian Jack Park 7 4 33
9.01 5% Fairview/Airport Heights 11 2 9
8.02 5% Russian Jack Park 3 8 31
21 4% Spenard 15 19 6
7.02 4$ Northeast (Muldoon) 42 7 29
16.01 4% Airport Heights 44 32 36
19 4% Midtown 29 3 23
20 4% Spenard 24 5 8
24 3% Spenard 14 29 25
5 3% Government Hill 47 28 18
10 3% Fairview 16 9 4
17.31 3% Northeast (Muldoon) 5 11 27
23.02 3% Sand Lake 13 27 35
14 3% North Star 12 14 14
23.03 3% Sand Lake 34 12 34
7.03 3% Northeast (Muldoon) 2 13 5
25.02 3% Taku/Campbell 51 17 15
17.01 2% University Area/Scenic
Foothills 28 10 40
16.02 2% University Area 10 26 21
7.01 2% Northeast (Muldoon) 17 16 32
15 2% Rogers Park/Tudor Area 35 41 42
25.01 2% Taku Campbell 22 25 30
17.32 2% Scenic Foothills 39 33 49

22.02 2% Turnagain 21 18 10
26.01 2% Abbott Loop 30 34 13
17.02 2% Northeast (Muldoon) 20 30 51
26.02 2% Abbott Loop 23 39 43
26.03 2% Abbott Loop 27 36 52

MA 50 Table 7– Percentage of 2 or more Race Households by Census Tract At Least 20% Greater than Citywide Percentage
Anchorage Census Tract
Percentage of 2 or more Race Households by
Census Tract At Least 20% Higher than Citywide Percentage of 8.10%
20% = or > 10%
Community Council/Area
Ranking by Unemployment Rate, Estimate Ranking by Unemployment Rate,
Estimate; Population 16 years and Over by Census Tract; Population 16 years and Over by Census Tract
Ranking by Percentage of People Whose Income in the Past 12 Months is
Below the Poverty Level—All People by Census Tract
Ranking of Vacant Housing
By Census Tract
9.01 12% Fairview/Airport Heights 11 2 9
26.01 12% Abbott Loop 30 34 13
8.01 11% Russian Jack Park 7 4 33
6 11% Mt. View 6 1 7
18.02 11% University Area/ Campbell Park
8 21 12
17.31 11% Northeast 5 11 27
7.01 11% Northeast (Muldoon) 17 16 32
7.03 11% Northeast (Muldoon) 2 13 5
7.02 11% Northeast (Muldoon) 42 7 29
20 10% Spenard 24 5 8
17.32 10% Scenic Foothills 39 33 49
14 10% North Star 12 14 14
19 10% Midtown 29 3 23
9.02 10% Fairview 4 15 24
23.03 10% Sand Lake 34 12 34

This table shows the top 20 Census Tracts by Owner and Renter Percentage. It is evident there are a significant percentage of renters occupying Census Tracts: 6; 7.03; 8.01; 9.01; 9.02; and 19. Therefore, the minorities and ethnic groups identified above live in the highlighted Census Tracts below with a large percentage of renters.
MA 50 Table 8 Census Tracts ‐Top 20 Census Tracts by Owner and Renter Percentage
In by % Census Tract Owner Percentage
Occupied Census Tract Renter Percentage
Occupied
1 28.21 93% 4 99% 2 28.13 91% 3 94% 3 28.22 89% 5 80% 4 28.23 88% 10 77% 5 28.12 86% 6 73% 6 2.04 85% 14 71% 7 13 83% 19 70% 8 2.03 83% 11 69% 9 26.02 83% 20 67%
10 27.11 82% 18.01 65% 11 26.03 82% 9.01 65% 12 23.01 81% 9.02 62% 13 1.01 80% 22.02 57% 14 27.02 78% 21 55% 15 17.32 76% 8.01 54% 16 17.02 73% 18.02 51% 17 2.02 72% 7.02 50% 18 22.01 70% 7.03 49% 19 17.01 70% 8.02 48% 20 17.31 69% 25.02 48%

MA 50 Table 9 Census Tracts –Median Household Incomes in Ascending Order
Census Tract Median Household Income
6 $35,788
19 $39,390
9.01 $39,481
14 $39,521
5 $41,330
10 $42,022
7.03 $44,567
20 $45,605
9.02 $47,154
8.02 $48,190
11 $49,826
21 $50,217
8.01 $50,952
3 $51,582
18.02 $54,777
22.02 $56,681
4 $58,651
7.01 $63,276

Map 1 shows the percentage of Extremely Low Income Households with Substandard Living Conditions, which means households without hot and cold piped water, a flush toilet and a bathtub or shower; and kitchen facilities that lack a sink with piped water, a range or stove, or a refrigerator.
MA‐50 Map 1 Extremely Low Income Households with Substandard Living Conditions

Map2 shows sites for the Low Income Housing Tax Credit (LIHTC) Program, created by Congress to generate equity capital for the construction and rehabilitation of affordable rental housing. HUD notes tax credits alone are not always sufficient to allow developers to reduce the debt burden to a point where project costs can be paid solely through affordable rents allowed by LIHTC regulations. Often, developers must seek additional subsidies to make a low‐income housing project feasible.
MA 50 Map 2 Low Income Housing Tax Credit

SP 05 Strategic Plan Overview
Affordable Housing
Owners
The Municipality identified several “owner” housing problems by AMI. High priorities address substandard housing, severely overcrowded housing, living with housing costs greater than 30% or 50% of income, and housing with one or more housing problems. The Municipality will work with the HAND Commission, HCOSH members, and Mayor’s Kitchen Cabinet to explore assisting owners living with any of the described housing problems. In addition, the HAND/HCOSH will work towards identifying potential housing projects using CDBG and/or HOME dollars to create affordable housing for owners. (See SP 25 Priority Needs)
Renters
The Municipality identified several “renter” housing problems by AMI. High priorities address substandard housing, severely overcrowded housing, living with housing costs greater than 30% or 50% of income, and housing with one or more housing problems. The Municipality will work with the HAND Commission, HCOSH members, and Mayor’s Kitchen Cabinet to explore assisting renters living with any of the described housing problems. In addition, the HAND/HCOSH will work towards identifying potential housing projects using CDBG and/or HOME dollars to create affordable housing for renters. (See SP 25 Priority Needs)
By Ethnicity or Race
The Municipality identified both Owners and Renters by ethnicity or race that disproportionately experiencing housing problems. The Municipality will work with the HAND Commission, the HCOSH members’ and local community groups serving the target populations identified in the SP 25. Priority Needs section to gain an understanding of why some groups experience housing problems more than others. The Municipality will also work to identify any household members who can share their experience. This information will be included in the Housing Affordability Action Plan and the Ten‐Year Plan. These Plans will be a vehicle to alert the community of this issue.
Homeless The Municipality coordinated efforts with HCOSH members to develop this Consolidated Plan’s Needs Assessment Section for homeless populations; consequently this group has very extensive knowledge and understanding on the scope of homelessness. In addition, HCOSH members represent a diverse set of agencies, including the Anchorage Veteran’s Office, Standing Together Against Rape, Alaska Housing Finance Corporation, and, the Catholic Archdiocese. Alaska Legal Services is also available to step in as needed at HCOSH meetings. The Municipality will work with the HCOSH to review Point In Time data annually and provide comment on data findings to the Alaska Homeless Management Information System. The HAND and HCOSH will also provide comment on drafts of the Anchorage Continuum of Care, by coordinating efforts with the Anchorage Coalition to End Homelessness. The HCOSH will also receive information from the Emergency Solutions Grant Administrator to assist in offering strategies for funding distribution, which will be identified in the Ten Year Plan. The HCOSH will oversee updating Ten Year Plan which will provide strategies and action steps needed to reduce homelessness in Anchorage.
Non‐Homeless Special Needs Under the Public Service priorities, Victims of Domestic Violence or Similar Life Threatening Condition ranked higher than Persons at Risk of Homelessness with a twenty‐nine spread (202 vs 173); with Frail Elderly at a close 170 and persons with Severe Mental Illness at 169. Public Service priorities identified handicapped services as the clearly highest priority (214), some distance away from Youth Services (168). The Municipality will recognize these areas with the same degree of importance as the needs of the homeless. The Municipality will work with the HAND Commission and HCOSH to implement strategies that serve special needs populations identified in SP25 Priority Needs.
Non‐Housing Community Development In recognition of the Community Survey that was filled out by 340 community members, the Municipality will give high deference to all areas that were identified as “high”. (See NA 50 Non‐Housing Community Development Needs.) In particular, the community believed that homeless facilities and abused/neglected children facilities ranked the highest—with a five number spread (223 vs 218) therefore “homeless” should not necessarily be ranked higher than abused/neglected children facilities. For Homeless Subpopulations, Chronically Homeless Individuals and Families ranked highest at 210, followed very closely Families

with Children. The Municipality will work with the HAND Commission and HCOSH to implement strategies identified in SP25 Priority Needs, non‐housing community development.
Commercial/Industrial At this time, the Municipality is not implementing a strategy for this area of service, as Public Improvements was ranked very low in the community survey. For example, Sidewalks received 151 votes for high priority, followed by 114 for street improvements and 94 for Flood Drainage Improvements. However, the Municipality may determine that a new community survey and needs assessment is needed to keep pace with any emergent needs in the community and will take action as needed for a substantial amendment to the Consolidated Plan.

MAP NA‐10.1. Anchorage Vicinity Map

Summary of Demographics Table 1 presents Anchorage’s population, number of households, and median income, as well as the percentage change from 2000 to 2010.
NA 10 Table 1 Housing Needs Assessment Demographics
Demographics Based Year: 2000 Most Recent Year: 2010 % Change
Population 260,283 291,826 12%+
Households 100,368 113,032 12%+
Median Income $73,004 $75,485 3%+
Source: 2010 U.S. Census/American FactFinder/People QuickFacts @: http://factfinder2.census.gov/faces/tableservices/jsf/pages/productview.xhtml?src=bkmk.
Table 2 shows the majority of the Anchorage population at 66% is White, followed by persons reporting two or more races at 8.1% and Asian at 8.1%, and American Indian and Alaska Native at 7.9%.
NA 10 Table 2 U.S. Census 2010 Demographic Information for Anchorage
Race Percentage
White 66.0%
Black 5.6%
American Indian and Alaska Native 7.9%
Asian 8.1%
Native Hawaiian and Other Pacific Islander 2.0%
Persons reporting two or more races 8.1%
Persons of Hispanic or Latino origin 7.6%
White persons not Hispanic 62.6%
This Consolidated Plan will cover Anchorage’s population needs 2013 through 2017 for decent housing, suitable living environment, and expanded economic opportunities. According to the U.S. Census and state economists estimates, Anchorage will have an average growth rate of 3,019 per year beginning in 2013 through 2017. The table below shows this growth rate per year, and estimated population for Anchorage for each year.
NA 10 Table 3 Municipality of Anchorage Population
Year Population
2013 302,009
2014 304,555
2015 307,606
2016 310,658
2017 313,709
Source: Estimates based on 2010 U S Census and AK Dept of Labor and Workforce Development, Alaska Population Projections, 2010‐2034, Section 3, February, 2011

U.S. Census by Tract The U.S. Census recognizes census tracts as permanent statistical subdivisions of a county. Census tract boundaries are delineated so that statistical comparisons can be made from census year to census year. The spatial size of census tracts varies on the density of the geographical area. Anchorage has a total of 55 census tracts. See 2010 U S Census Tract information outlined and related populations.
NA 10 Table 4 Municipality of Anchorage, 2010 U.S. Census by Tracts
Anchorage Census Tract Total
Population
Anchorage Census Tract
Total Population
1.01 5,736 17.31 5,823
1.02 5,259 17.32 6,179
2.01 4,110 18.01 4,907
2.02 5,947 18.02 5,537
2.03 10,549 19 4,194
2.04 3,381 20 3,748
3 8,000 21 3,787
4 5,937 22.01 5,053
5 1,988 22.02 2,960
6 7,747 23.01 7,088
7.01 5,949 23.02 4,791
7.02 5,107 23.03 9,273
7.03 5,706 24 3,299
8.01 7,323 25.01 4,993
8.02 4,407 25.02 5,236
9.01 4,906 26.01 4,784
9.02 3,141 26.02 5,805
10 4,131 26.03 6,341
11 940 27.02 9,670
12 3,718 27.11 6,589
13 3,059 27.12 9,068
14 5,224 28.11 6,313
15 5,104 28.12 7,166
16.01 4,092 28.13 4,579
16.02 4,224 28.21 5,050
17.01 6,843 28.22 4,020
17.02 5,258 28.23 5,217
17.31 5,823 29 2,570
17.32 6,179

Individual census tracts in the MOA with the largest populations include Tract 2.03, Eagle River at 10,549; Tract 27.02 Old Seward/Ocean View at 9,670; Tract 23.03, Sand Lake at 9,273; and Tract 27.17, Bay Shore/Klatt at 9,068. Tract 11, representing Downtown had the lowest population at 940.
Chugiak and Eagle River became annexed to the Municipality of Anchorage, when the City of Anchorage and the Greater Anchorage Area Borough were unified in 1975. The area north of Fort Richardson to the municipal boundary includes Eagle River, Chugiak, Birchwood, Peters Creek, Thunderbird Falls, and Eklutna. The 2010 Census reflects a population of 23,987 in Eagle River and an additional 10,995 in Chugiak, Birchwood, Peters Creek, Thunderbird Falls, and Eklutna.
Girdwood adds another 2,570 to Anchorage’s population. Girdwood is located on Turnagain Arm in the Municipality of Anchorage, 35 miles southeast of downtown Anchorage. The area is accessed by the Seward Highway. Girdwood is bordered on three sides by the Chugach State Park and Chugach National Forest.1
1 Alaska Community Database Community Information Summaries Alaska Department of Commerce, Community, and Economic Development Division of Community & Regional Affairs
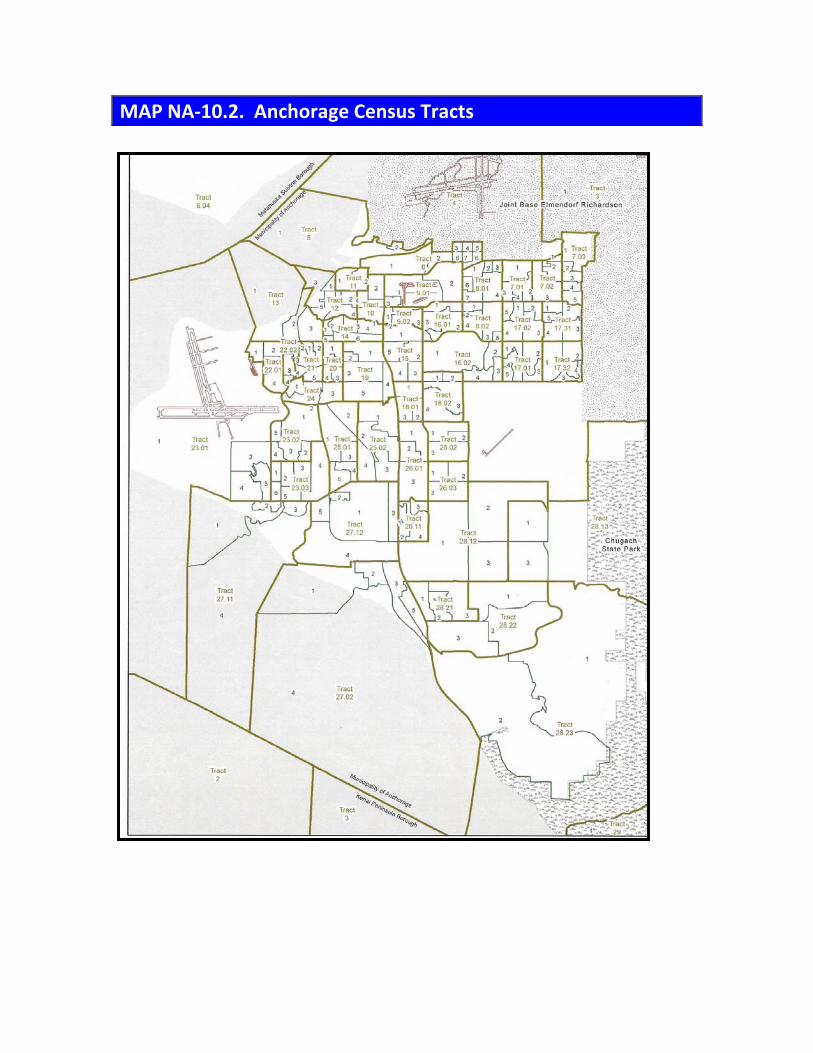
MAP NA‐10.2. Anchorage Census Tracts

SP-55 Barriers to Affordable Housing The barriers to affordable housing in Anchorage are complex. The economy is stable, especially in comparison to the lower‐48 which has experienced serious housing crashes and foreclosures. However, in Anchorage there are increasing numbers of homeless individuals and families. An examination of the jurisdiction’s economy shows business factors which are strong and steady; however, there has been flat growth in leisure and hospitality (such as tourism), similarly with construction, both of which have been viable economic bases. The economic downfall in the lower‐48 has contributed to the downfall in tourism.
New hires in 2010 were primarily for retail and food and beverage; however, these positions tend to offer lowering paying wages. Construction was identified in third place for new hires in 2010; however, construction has been slow in comparison to earlier years. There has been a 59% increase in the median home value from 2010 to 2009, but the percent change for median household income is only 31% for almost the same period. The vacancy rate in Anchorage for 2012 is low for all rental units, showing: 0 bedrooms at 4.9, 1 bedrooms at 1.7, 2 bedrooms at 2.4 and 3 bedrooms at 4.8. At the same time vacancy rates are dropping, median rent is rising on an average of 4%. There is a relatively young group of renters, aged 15 to 24% that account for 17% of renter occupied households; and those aged 25 to 34 years account for 29%. There are approximately 17,205 owner households who are paying more than 30% of their household income on housing; and 16,865 of renters who are paying 30% more than their household income on rent.
While the civilian population is experiencing the lack of affordable housing, our local military community is equally in need of housing. As of May 7, 2013 there were 424 households on the wait list. Of those on the wait list, the type of housing needed was: 43% for 2 bedrooms, 25% for 3 bedrooms, 18% for 5 bedrooms, and 14% for 4 bedrooms. At this time, these households are living off JBER in our local community until military housing is available.
The lack of available housing is driving up the median rent, the median income has not kept pace with housing values, our young population are likely in lower‐paying occupations that cannot afford the higher median rents required.
Although there are some builders looking at the prospects for building new housing, there are also barriers to this effort, such as suitable buildable land and the type of housing needed to accommodate Anchorage’s population. For example, the elderly and extra elderly, and the disabled populations were identified in the Needs Assessment Section of this Draft Consolidated Plan as being disproportionately represented for several types of housing problems.
The Municipality plans to establish planning discussions with other funding agencies to determine the rising numbers of homeless individuals seen in emergency shelters, as well as discuss options for housing to accommodate Anchorage’s youngest and older populations; both of whom are likely to be low‐income.

Strategy to Remove or Ameliorate the Barriers to Affordable Housing The Municipality has worked with the community leaders and providers to identify barriers to affordable housing. This section describe the jurisdiction's strategy to remove or ameliorate negative effects of public policies that serve as barriers to affordable housing, as identified in accordance with 91.210(e).
1. Mayor’s Homeless Leadership Team1
The Mayor’s Homeless Leadership Team (HLT) was established as part of Mayor Sullivan’s Strategic Action Plan to deal with chronic public inebriates and related issues of Homelessness in Anchorage. The HLT is comprised of numerous social service and government agencies and is reflective of the Municipality’s collaborative approach to dealing with this serious social and public safety issue.
The HLT’s focus is on that small number of citizens who are homeless and have chronic substance abuse and/or mental health issues. The purpose of the HLT is to provide the Mayor with short and long term strategies for effectively managing the challenges this population creates and to assist with identifying and leveraging community resources for implementing those strategies. During the course of HLT discussions, the group developed several recommendations, which includes strategies for affordable housing.
In May 2010, the Mayor’s HLT formulated the following strategies and recommendations on how the community should deal with homeless chronic public inebriates and related issues of homelessness.
1. Mayoral and Municipal support for the development of Karluk Manor by RurAL CAP as the initial Housing First Project in Anchorage.
As RurAL Cap’s Karluk Manor project gained momentum, the HLT realized that implementation of Anchorage’s first “Housing First” project, initially perceived as long‐term, could occur within the year, offering the community a short‐term, effective strategy to help achieve the Mayor’s desired outcomes.
The HLT recommends that “Housing First” projects be clustered and not scattered site. Within the Municipality Of Anchorage, there is currently no means to deliver the level of services and support needed by the chronic homeless to improve their well being and lessen community impacts in scattered site facilities. One-on-One environments or small scattered sites would require an estimated 300 service personnel.
“Housing First” projects should be connected to services, due to the severity of alcohol abuse by potential residents of “Housing First” projects and the likelihood that they will have serious medical and psychiatric illnesses. Potential residents are also very likely to have major deficits in cognitive functioning, social functioning and independent living skills. Therefore, a variety of community resources and services are required to support a project of this magnitude.
2. Mayoral Support for Assessing, Developing and Evaluating Future “Housing First” Projects
The HLT recommends Mayoral support for the acquisition, development and operation of future “Housing First” projects in Anchorage as soon as possible. The “Housing First” model provides housing to chronic homeless inebriates with on‐site supportive services and case management. This model has been shown to keep individuals off the streets, out of emergency shelters, emergency rooms and the Transfer Station/sleep off center, and to be cost effective (published reports and research can be found at the end of this report).
3. Develop and implement strategies for public education and outreach around the approved recommendations.
The HLT was instrumental in creating a community informational resource on Health and Human Services webpage dealing with chronic public inebriation and related issues of homelessness, including existing and historic plans and reports. This resource can be found under the Mayor’s Strategic Action Plan.
4. Remove Regulatory Barriers: Clarify residential and facility land use types in Title 21 and Title 16
Title 21 (housing projects) and Title 16 (facility projects) often present regulatory barriers to development of much‐needed projects in Anchorage. This strategy would convene a collaborative group of funders and service providers to define 2‐3 hypothetical but realistic
1 Mayor’s Homeless Leadership Team found at http://www.muni.org/Departments/health/Pages/HomelessLeadershipTeam.aspx

housing projects that serve people with disabilities (i.e., 10‐plex supportive housing project with certain on‐site services located in an R‐3 district) and hold a mock “pre‐construction” meeting with the Planning Department to examine zoning implications for each scenario.
This exercise will better define current land use barriers, if any, to developing new supportive housing projects for people with disabilities, including both permanent and transitional housing. Identifying these regulatory barrier issues will aid housing providers, the Municipality of Anchorage, the Municipal Assembly, and/or the Planning and Zoning Commission in reducing or mitigating barriers.
The HLT recommends Mayoral support for this strategy, including Municipal Planning Department staff participation.
5. Implement the Municipal Cold Weather Plan (MCW) and Amend Municipal Code Title 16 to enable the MCW Plan.
The HLT recommends implementation of a cold weather plan for the Municipality of Anchorage, which would allow churches, designated by the Director of Health & Human Services or their designee, to act as temporary cold weather shelters for families and individuals who are not under the influence of intoxicants, Title 21 notwithstanding.
6. Camp closures should not take place unless housing options are in place
Anchorage is consistently at or above its emergency housing capacity and camp closures will not be an end to the cycle of illegal camping and chronic public inebriation if individuals do not have a place to go when an illegal camp is closed. Housing of all types (Affordable, Housing First, Low‐Barrier, etc.) must be available before closing down an illegal camp if the city wants lasting solutions in getting individuals out of illegal camps that are on public land permanently
This strategy will also ensure better results for the Homeless Action & Response Team (H.A.R.T.) when they undertake outreach to illegal campers. The H.A.R.T.
7. Develop a Collaborative Homeless Action & Response Team (H.A.R.T.) to do outreach to illegal campers when a campsite is posted for closure
The H.A.R.T. will assist all persons in illegal camps posted for closure, not just those persons who are chronically homeless due to substance addiction and/or mental health issues. Possible services offered include: Housing/Shelter; Housing Vouchers; Public Assistance; Social Security Benefits; Veteran’s Benefits; Medical; Mental Health; Jobs; Case Management; Substance Use/Abuse Treatment.
8. A commitment to work with stakeholders to increase detox beds and services for chronic homeless alcoholics.
Currently, Anchorage has two detox facilities, Ernie Turner Center and the Salvation Army’s Clitheroe Center. Facilities are at capacity, and service providers are overwhelmed with both bed and service wait lists of up to three months. CITC’s Ernie Turner Center has no room for growth, while the Salvation Army’s Clitheroe Center has room for 4‐6 additional detox beds if funding is made available, at $125,000 per year per bed.
Increasing detox beds and services would help meet the needs of individuals who are requesting assistance to get clean and sober when they request treatment and services, instead of putting them on a wait list and keeping them on the streets until space is available.
9. Support for increasing the number of case managers who work with chronic homeless alcoholics. Strive for a ratio of 1:10 case managers to clients.
The HLT recommends a collaborative effort to look at advocacy opportunities and create a working model which would increase case managers within the MOA to a ratio of 1:10 case manager to client.
Most case managers in Anchorage currently have case loads of up to 50 clients at a time. This places an inordinate burden on case managers and reduces the level of care and attention that they are able to dedicate o individual clients. Reduced case loads would allow for more robust services for homeless chronic alcoholics, resulting in a more successful intervention.
10. Continued Mayoral support for the Anchorage Coalition on Homelessness and implementation of the 10 Year Plan.
The HLT recommends continued support for the Anchorage Coalition on Homelessness and implementation of Anchorage’s 10 year plan. The HLT acknowledges there is a serious lack of affordable housing in Anchorage that must be addressed as part of a larger solution for housing for our homeless population. The absence of affordable housing is

a barrier for individuals and families who are ready to exit homeless shelters and programs. There is currently a lack of inventory and the affordability gap is increasing.
2. Mayor’s Kitchen Cabinet’s Work Group on Affordable Housing
The Mayor’s Kitchen Cabinet was convened by the Mayor, to assess needs of housing development and treatment and related services in Anchorage. As a result of the two pronged approached, the Kitchen Cabinet formed two work groups; one to focus on affordable housing; and, the other to focus on substance abuse treatment services. The two groups are staffed by the Municipal Department of Health and Human Services.
In May 2012, the Mayor’s Kitchen Cabinet’s Work Group on Affordable Housing (WGAH) submitted recommendations for policy and regulatory changes that the Municipality of Anchorage could implement that would help spur housing development in Anchorage. The WGAH recommendations are:
1. Assign a single department head to act as a liaison with home builders when needed through the permitting process.
2. Create or authorize an entity or partnership, such as the Anchorage Community Development Authority, to specifically plan for, spur, and coordinate comprehensive housing development. That entity should be tasked with implementing the Anchorage 2020, Anchorage Downtown Comprehensive plan, and various Anchorage neighborhood plans to catalyze housing and economic development.
3. Continue to research the viability of using Tax Increment Financing in Anchorage.
4. Consider changes to MOA regulatory requirements that will help increase the likelihood of housing development.
a. Examine and extend the number of years required for code changes beyond three years.
b. Adopt an ordinance that accepts the premise of SB104 ‐ A deferral of municipal property taxes on the increase in value of real property attributable to subdivision of that property.
c. Examine MOA code to allow for an alternative engineered design that may not meet MASS requirements on private on‐site roads and driveways.
d. Adopt lower parking policy requirements proposed in Title 21.
According to the WGAH memorandum to the Mayor, the recommendations should be considered helpful as immediate next steps to benefit all types of public, private, and non‐profit housing development. The WGAH recognizes these recommendations standing alone will not catalyze sufficient development to meet the community’s need for housing. The recommendations should be viewed as first in a series of changes and initiatives which place housing in Anchorage as a very high priority both for the MOA and for the larger community. A large challenge remains: to identify and implement creative strategies that actually spurs housing development to ensure safe, affordable homes for all Anchorage residents.2
3. Mayor’s Work Group on Substance Abuse Treatment & Services
In February 2013, the Mayor’s Work Group on Substance Abuse Treatment & Services made recommendations to enhance services to homeless individuals with substance abuse disorders. The group’s goal was to look for low cost opportunities, policy changes and opportunities to enhance services and access to treatment for homeless individuals in Anchorage experiencing substance use disorders.
The following are the top recommendations put forth by the Work Group on Substance Abuse Treatment and Services.
High priority‐‐no cost recommendations for the MOA regarding substance abuse treatment and services in Anchorage:
1. Support existing and future expansion of research based supportive housing programs and service models, such as Karluk Manor, which are associated with longer stays in housing and reduction of alcohol use. Such programs pair housing with intensive case management services to dramatically reduce the use of emergency services.
2. Develop an overarching advocacy effort to build community support for sober housing development as a long term strategy.
a. Target a specific area of town, identify large housing or mixed use development or redevelopment and leverage MOA investments and expertise in partnership with the private sector to develop long term and short term sober housing units (a recommendation forwarded by the Housing Workgroup).
2 Mayor’s Kitchen Cabinet’s Work Group on Affordable Housing recommendations to Mayor Daniel Sullivan, May 10, 2012

3. Weigh in on the FY12 alcohol tax funding for alcohol related projects by collaborating with the Recover Alaska Initiative, a public/private collaborative working to reduce the negative effects of alcohol and drug abuse in Alaska. The Mayor may recommend projects that could have positive impact in Anchorage.
High priority‐‐low cost recommendations for the Municipality regarding substance abuse treatment and services in Anchorage:
1. Reinstitute the Pathways to Recovery Program (or similar model) located at the Anchorage Safety Center. The Pathways program focuses on outreach, engagement, detoxification, and long term treatment with the goal of housing and employment. This program has demonstrated success in reducing the number of transfer station admissions by focusing on housing and linking to detox and treatment. Programming needs to include ongoing engagement and coordination of services for individuals prior to discharge from the Safety Center such as linking directly to day engagement options to avoid discharging directly to the streets of Anchorage.
2. Re‐invigorate use of the Alaska Center for Treatment Needs Assessment as commissioned by DHSS to analyze and inform current and future need for adult residential treatment beds in Anchorage.
a. Assign a single project coordinator within DHHS for service providers, community members and other interested stakeholders regarding addiction services and supports in Anchorage. This coordinator should participate in the Anchorage Regional Behavioral Health Providers stakeholder process to effectively advocate on behalf of the needs of providers in Anchorage, to help reduce barriers and inefficiencies (both regulatory and governmental) that interfere with access to and provision of treatment services in Anchorage.
b. Establish a municipal/provider task force to work with treatment providers, outreach/engagement programs and housing programs to maximize access, expand treatment capacity and increase housing stability.
c. Review the workgroup summary for recommendations and issues identified by the committee that are within the purview and responsibility of DHSS. We recommend the MOA engage with DHSS to advocate for department action on a state level to address the issues outlined in the summary.
3. Re‐engage and move forward plans for the Alaska Recovery Center in collaboration with the State of Alaska and the Alaska Mental Health Trust Authority.
4. Anchorage Housing Market Analysis
This Housing Market Analysis was funded by the Energy Efficiency and Conservation Block Grant, a program of the American Recovery and Reinvestment Act, and overseen by the Municipal Department of Planning, May 2012. The recommendation below will also be considered as a strategy under the Consolidated Plan.
Set maximum lot sizes and require minimum residential densities in certain zoning districts. This recommendation is noted by the Analysis: Provisionally adopted T21 includes maximum lot sizes for single family in R‐2M and a proposed amendment will also include R3. Limits single family use in R‐3 and R‐4 and includes a minimum density in R‐4A for mixed‐use projects.

SP60 Table 1 Number of Homeless Individuals vs Available Emergency Shelter Beds
Date Number of
Homeless Individuals Emergency
Shelter Beds* Difference
1/25/2012 428 320 ‐108
4/25/2012 359 280 ‐79
8/25/2012 309 280 ‐29
12/25/2012 317 280 ‐96
How are the Jurisdiction poverty reducing goals, programs, and policies coordinated with this affordable housing plan
1. Alaska Homeless Management Information System (HMIS)
AKHMIS provides the Anchorage community an opportunity to examine how and who provides homeless services, the number of persons who are homeless and non‐homeless, demographic information, and how local figures compare with other cities across the country. Most importantly, the AKHMIS information provides a landscape of persons living below the poverty line (in shelters, transitional housing, or seeking emergency financial assistance for housing). These figures can be compared to U.S. Census Tract numbers that are also available to consumers. By understanding the scope of homelessness and number of households living below the poverty line, policy makers, supportive agencies, and local, and state agencies can develop strategies to address the issue. Below is an outline of how the Anchorage community is evaluating the issue with the assistance of AKHMIS, Project Homeless Connect, and, the Housing and Neighborhood Development Commission’s Oversight Subcommittee on Homelessness.
2. Identify those living below the Poverty Line through the Alaska Homeless Management Information System (AKHMIS)
Funded by the U.S. Department of Housing and Urban Development (HUD) Continuum of Care Grant and Alaska Housing Finance Corporation (AHFC), the AKHMIS Project hosts a web‐based computerized case management data system for local and Balance of State emergency homeless shelters, transitional housing providers and permanent supportive housing providers. In tandem with HUD requirements, HMIS implementation presents communities with an opportunity to re‐examine how homeless services are provided in their community, and to make informed decisions, and develop appropriate action steps. The AKHMIS computerized data collection is designed to capture client level information over time on the characteristics and service needs of men, women and children experiencing homelessness. AKHMIS adopted the use of Bowman System's ServicePoint (SP) as its platform for a coordinated community‐wide HMIS. SP is a secure web‐based application, which can be accessed through encrypted Internet connections from program offices. SP is the most widely used HMIS application in the country. The DHHS staff manages the AKHMIS project and provides oversight, training and technical assistance. Aggregated, anonymous data from AKHMIS is used to generate reports for federal, state and local funders. The effective implementation of AKHMIS benefits homeless and near homeless persons, homeless service providers, agency heads, public policy makers and the community as a whole.
In 2012, a total of 23 agencies with 53 projects in Anchorage, and 19 agencies with 37 projects in Balance of State are entering data into the AKHMIS. The majority of the clients served by these agencies were homeless, but a substantial number of them were near homeless people who received assistance to prevent them from becoming homeless (Emergency Services Grant, Homeless Prevention Funds for example).
3. AKHMIS and Identifying Extent of Homelessness For Anchorage’s Point In Time Count and Housing Inventory Chart (note – PIT and HIC not yet finalized for 2013)
AKHMIS is used for Anchorage’s Point In Time (PIT) Count and the Housing Inventory Chart (HIC), both necessary in order to identify the number of homeless in need for Continuum of Care grant applications. AKHMIS is for de‐duplicating numbers for the PIT in comparison with annual Project Homeless Connect (PHC) events. For example, there were a total of 1,062 persons in the 2011 count compared to 1,062 in the 2012 count, resulting in a decrease of 4.6% (51) sheltered persons. De‐duplication methods showed the drop was primarily related to a drop of persons in households with only one adult and one child: 405 persons in 2011 versus 405. Other factors relating to the reduction were agencies providing services for this target group accounted for larger families seeking services for longer periods of time rather than assistance for a shorter period of time. This is substantiated by the offset of an increased number of unsheltered persons in households with one adult and one child that more than doubled. Figures show an increase from 24 in 2011 to 24 in 2012 for a total increase of 13 persons. Further, households without children accounted for 10 more in 2012 than 2011.
AKHMIS is also critical in determining HIC. For example, data collected for the 2012 HIC shows that thirty‐one beds were added to the Emergency Shelter bed inventory. This addition was due primarily to including the U.S. Department of Veteran’s Domiciliary in the emergency shelter inventory.
4. Identify those Living Below the Poverty Line through Project Homeless Connect
The AKHMIS team organized data entry volunteers from the community and entered data for Project Homeless Connect (PHC), held January 29, 2013 at the Egan Center. A total of 730 individuals were identified as participants, of whom 61% were male,

71% were 41 years of age or older; and 85% were single adults. Of the total participants, 81% were recognized as fitting the HUD or AK Criteria definition of homelessness.
To see detailed reports for both 2011 PHC events, view the DHHS website @ http://www.muni.org/Departments/health/services/Documents/AKHMIS/PHCReport2011.1.pdf (note: do not have 2013 posted yet – work is being done on website).
5. AHMIS and Anchorage’s Annual Homeless Assessment Report (AHAR)
The AKHMIS is responsible for generating data to HUD for Anchorage’s Annual Homeless Assessment Report (AHAR). HUD has placed increased emphasis on HMIS to learn more about people who are receiving homeless assistance. AHAR participation is used in the scoring of the Continuum of Care funding application each year. The greater the number of accepted tables completed in the CoC under AKHMIS, the higher the CoC score for the homeless management information system section.
The Anchorage AHAR reporting period is October 1, 2011 – September 30, 2012 and pulls data from participating emergency shelters, transitional housing, and permanent supportive housing Programs in the city. The AHAR also includes veterans in shelters and housing. The AHAR includes demographic data (required data elements), such as gender, race, age, the last zip code used, and disability. The AHAR also measures bed utilization and length of stay, or the amount of time clients stay in a program. All of the data is reported on an aggregate level, no program level or client level data is given to HUD.

Written standards for providing ESG assistance
Standard policies and procedures for evaluating individuals’ and families’ eligibility for assistance under ESG.
Emergency Solution funds will target the following.
Homelessness Prevention
Provide financial assistance and services to help individuals and families at‐risk of homelessness to maintain permanent housing and who have an annual income below 30 percent of median family income for the area as determined by HUD Type of assistance: rent and utility assistance/subsidy, rent/utility deposits, and case management.
Rapid Re‐Housing
Provide financial assistance and services to individuals and families who are homeless and help them move as quickly as possible into permanent housing and achieve stability in that housing. Type of assistance: rent and utility assistance/subsidy; rent/utility deposits, and case management.
Emergency Shelter
Funds to be allocated for maintenance and operations of emergency shelters (as defined in §576.102) that house families and individuals who meet the criteria of homeless.
All ESG‐assisted households must meet the revised HUD definition for at risk for homeless and/or homeless. The following are the criteria for Eligibility under the ESG program
Homelessness Prevention
ESG funds may be used to provide housing relocation and stabilization services and short‐and/or medium‐term rental assistance necessary to prevent an individual or family from becoming homeless as defined by HUD. The following requirements apply to eligible beneficiaries for Homeless Prevention:
Individuals/families must be residents of the Municipality of Anchorage
Individuals/families must have an income at or below 30% of the area median income (AMI) as determined by HUD.
Individuals/families eligible for assistance must be lacking sufficient resources or support networks, e.g. family, friends, faith‐based or other social networks, immediately available to prevent them from moving into an emergency shelter or primary nighttime residence that is not designed for or ordinarily used as regular sleeping accommodation for human beings
Priority will be given to individuals and families who are currently in housing but are at risk of becoming homeless and need temporary rent or utility assistance to prevent them from becoming homeless or who need assistance to move to another unit; and fall into at least one of the secondary risk criteria:
Household has moved 2 or more times due to economic reasons over a 60 day period immediately preceding application for assistance
Individual or family is living in the home of another because of economic hardship
Have an eviction notice to vacate current housing within 21 days of application for assistance.
Individual or family is living in a hotel or motel not paid for by government or charitable organization
Household lives in an overcrowded housing unit as defined by the US Census Bureau
Individual is exiting a publicly funded institution or system of care

Otherwise lives in housing that is associated with instability and an increased risk of homelessness as identified in the consolidated plan and includes: extremely low‐income renters who are single parents, minorities, single elderly and disabled.
Rapid Re‐housing Assistance
ESG funds may be used to provide housing relocation and stabilization services and short‐and/or medium‐term rental assistance as necessary to help a homeless family move as quickly as possible into permanent housing and achieve stability in that housing. The following requirements apply to beneficiaries for Rapid Re‐housing Assistance.
Individuals/families receiving rapid re‐housing assistance must be literally homeless as defined by ESG criteria in 24 CFR §576.2
Individuals/families must be living in the Municipality of Anchorage or residing in a shelter within the municipality.
AK 2‐1‐1 and social service/homeless providers will be provided information regarding availability of ESG funds to provide information for potential applicants through the provider network. Applicants will contact ESG providers directly.
Determination of eligibility for ESG assistance will begin with a standardized screening tool and assessment conducted by the ESG sub‐grantees.
At the time a centralized or coordinated assessment system is implemented by the CoC, the ESG sub‐grantees will implement the use of this tool for purposes of coordination and streamlining access for consumers.
The assessment, conducted by a case manager will determine current living situation; income based on area median income, and ability to obtain and maintain subsequent housing options without assistance. The assessment will determine eligibility, type and length of assistance to be provided. The case manager and client(s) will develop a self‐sufficiency plan that will be mutually signed and adhered to during course of service.
When determining the annual income of an individual or family, the recipient or sub recipient must use the standard for calculating annual income under 24 CFR §5.609. Grantees must document and date the determination of income eligibility. This documentation will be included in the program participant record.
Re‐evaluation of individuals and families receiving ESG assistance will be conducted not less than every 3 months to assure eligibility and will be documented in client’s file.
Documentation of participants’ homelessness situation is an important aspect of ESG program compliance. ESG grantees and sub‐grantees are required to maintain adequate documentation of homelessness or at‐risk status to determine the eligibility of each person served by ESG. Documentation will be obtained from the participant or a third party at the time of entry into the program. Sufficient records must be established and maintained to enable the grantee and HUD to determine whether ESG requirements are being met as outlined in §576.500.
All applicants for assistance will affirm the information provided and authorize the sharing of information between agencies to assure coordination of services.
Policies and procedures for coordination among emergency shelter providers, essential service providers, homelessness prevention and rapid re‐housing assistance providers, other homeless assistance providers, and mainstream service and housing providers.
As the CoC Lead Agency, the Municipality of Anchorage works closely with the Anchorage Coalition on Homelessness (ACH) to establish a seamless system of services. The ACH represents both private and public sectors of the community.

ESG grantees and sub‐grantees are required to be an active member of the CoC and participate in Anchorage Homeless Coalition committees and sub‐committees. As a member of the CoC, the ESG sub‐grantees will participate in system change activities that enhance coordination among service providers.
It is expected that ESG sub‐grantees will actively coordinate with service providers including AK 2‐1‐1 and the Aging and Disability Resource Center to assure that individuals and families experiencing homelessness have the most up to date information and access to mainstream resources available to meet their needs and assist with housing stabilization. To the extent possible, ESG grantee and sub‐grantees will seek Memorandums of Understanding with key referral sources to assure seamless referral process for ESG clients.
For those clients identified as disabled or elderly, a referral will be made to the Aging and Disability Resource Center for options counseling regarding long‐term care support services available in the community to assist with stabilization of those services for the eligible clients.
ESG sub‐grantees are required to report program participant‐level data and update client information into AK‐HMIS. ESG grantees and sub‐grantees will participate in HMIS trainings and adhere to HMIS data entry expectations.
All grantees and sub‐grantees will take appropriate measures to provide for program participant confidentiality. Grantees and sub‐grantees will develop and implement procedures to guarantee the confidentially of records concerning program participants.
Note that domestic violence programs are exempt from the HMIS requirement,
However, they are required to provide aggregate data for reporting purposes.
Policies and procedures for determining and prioritizing which eligible families and individuals will receive homelessness prevention assistance and which eligible families and individuals will receive rapid re‐housing assistance.
Households are expected to independently maintain and sustain housing, either subsidized or unsubsidized, at the end of rental assistance; therefore it is crucial that households are appropriately assessed. Each program that provides ESG rapid re‐housing and homelessness prevention services will determine the prioritization of eligible individuals and families based on assessment by a case manager.
The determination will be guided by the use of the Homeless Assessment Matrix‐AK version, assessing barriers to housing and the ability to sustain housing after ESG assistance ends.
(Note: More formal use of the Homeless Assessment Matrix—AK version is under discussion among the CoC. At such time it is determined that the matrix will be used for prioritizing applicants across the continuum, ESG providers will incorporate into their prioritization procedure).
Rapid re‐housing funds will target families that are homeless and assist them to move as quickly as possible into permanent housing and achieve stability. Due diligence will be employed to identify appropriate families who demonstrate the ability to maintain and sustain housing, either subsidized or unsubsidized, at the end of the rental assistance through ESG. Case management will be provided during the term of participation with the goal of case management to ensure that the households enrolled in ESG will identify the reasons for homelessness and address these barriers for long term success.
Homelessness Prevention funds will target individuals and families that are imminently at risk or at‐risk of homelessness with an income below 30% of Area Median Income (AMI). Due diligence will be employed to identify individuals who “but for ESG assistance” will become homeless and who demonstrate the ability to maintain and sustain housing, either subsidized or unsubsidized after receiving assistance for rental and/or utility arrearages. At the time of initial screening and assessment, case manager will fully assess other possible resources including formal and informal that are available to applicant. Case manager will “coach” applicant in applying for and accessing available resources and provide the necessary amount of service coordination to assure success in maintaining housing.
Beyond targeting and using a standardized assessment tool, households will be served on a first‐come, first‐served basis.
Standards for determining the share of rent and utilities costs that each program participant must pay, if any, while receiving homelessness prevention or rapid re‐housing assistance.
The ESG‐funded sub‐grantees will set individual polices for cost sharing based on program design and the population being served.
It is expected that program participants will assist with paying rent and utilities while receiving rapid re‐housing assistance. Specific amount of cost‐sharing will be set in consultation with client and case manager and based on family situation and agency policies. Expectations will be clearly stated in self‐sufficiency plan and reviewed with case manager.
At such time the CoC sets system wide standards for cost‐sharing, ESG‐funded agencies will implement agreed upon standards in program policies and procedures.
To the extent possible, ESG providers will work to leverage other funding sources in assisting program participants in order to serve the greatest number of at risk or homeless individuals/families.
Standards for determining how long a particular program participant will be provided with rental assistance and whether and how the amount of that assistance will be adjusted over time.
Subject to the general conditions under §576.103 and §576.104 the recipient or subrecipent may provide a program participant with up to 24 months of rental assistance during any 3 year period.
As ESG funding for rental assistance is very limited and based on prior experience with HPRP, the ESG allocation for rental assistance will be limited to 6 months or less. The ESG provider and applicant for services will come to an agreement on the length of assistance needed and jointly develop a long‐term self‐sufficiency plan to quickly move clients to housing stability and sustainment. Adherence to the plan will help to determine on‐going assistance and requests for assistance in the future.
It is expected that during the course of rental assistance, the client contribution will increase incrementally and the agency contribution will decrease in anticipation of termination of services at the end of the agreed upon time. Case managers will work closely with households to identify housing that is sustainable based on family income and size.
Rental assistance will end if and when other subsidy begins (i.e. Section 8 voucher, public housing, etc.).
Updates and input from the CoC will help to determine if limits on rental assistance should be increased or decreased based on community need, outcomes, and available budget within the HUD guidelines. At such time that standards for client contribution are set by the continuum, the ESG funded agencies will incorporate these into overall procedures and policies.
Standards for determining the type, amount, and duration of housing stabilization and/or relocation services to provide a program participant, including the limits, if any, on the homelessness prevention or rapid re‐housing assistance that each program participant may receive, such as the maximum amount of assistance, maximum number of months the program participants receives assistance; or the maximum number of times the program participants may receive assistance.
Based on previous experience with HPRP, limited ESG funding, and the current RRH program implemented in the community, the standard will be limited to no more than 6 months of tenant‐based rental assistance, plus security deposit and utility deposit if needed.
Homelessness Prevention services, delivered through Emergency Outreach Services, Department of Health and Human Services are designed to prevent an individual or family from becoming homeless and are to be a one time assistance for rental and utility arrearages and financial assistance costs as described in §576.105. Average amount of assistance per household will average less than $1,000 with exceptions granted based on extenuating circumstances.

To avoid duplication of ESG services, ESG sub‐grantees will be entering data into a shared HMIS system. ESG grantee/sub‐grantee will meet on a regularly scheduled basis to review program policies and procedures and staff potential homeless clients requiring additional assistance above and beyond above stated limits and HUD guidelines.
Updates and input from the CoC will help to determine if duration of housing stabilization and/or relocation services provided to each program participant should be increased or decreased based on project indicators and available budget. At such time that standards for client contribution are set for the continuum, the ESG funded agencies will incorporate into overall procedures and policies.