es risks and shareholder voice - drexel university
TRANSCRIPT

ES Risks and Shareholder Voice
Yazhou Ellen He
University of Oxford
Bige Kahraman
University of Oxford and CEPR
Michelle Lowry
Drexel University
June 2019
Abstract:
Over the 2004 – 2016 period over 20% of all shareholder proposals relate to environmental and
social (ES) issues, and slightly more than half are sponsored by asset management companies.
Support for these proposals has increased substantially over this period, but it remains the case
that virtually none receive the minimum threshold support rate to pass. We find that failed ES
proposals with higher investor support significantly predict future firm risk, measured in
extreme negative stock returns and real events such as negative ES incidents. Examining the
detailed records of mutual fund votes, we uncover that myopia within investors and
management contributes to these proposals not receiving greater support.
Yazhou Ellen He: Said Business School, University of Oxford, email: [email protected]; Bige
Kahraman: Said Business School, University of Oxford and CEPR, email: [email protected]; Michelle
Lowry: Drexel University, email: [email protected]. We thank participants at the University of Oxford
Business Research Hub seminar series, the 2019 Mutual Funds, Hedge Funds and Factor Investing Conference in
Lancaster, and the 2019 Sustainable Finance Forum Shenzhen for their useful comments. This paper was
previously circulated under the title ‘Mutual Fund Voting on Environmental and Social Proposals’.
ES Risks and Shareholder Voice
June 2019
Abstract:
Over the 2004 – 2016 period over 20% of all shareholder proposals relate to environmental and
social (ES) issues, and slightly more than half are sponsored by asset management companies.
Support for these proposals has increased substantially over this period, but it remains the case
that virtually none receive the minimum threshold support rate to pass. We find that failed ES
proposals with higher investor support significantly predict future firm risk, measured in
extreme negative stock returns and real events such as negative ES incidents. Examining the
detailed records of mutual fund votes, we uncover that myopia within investors and
management contributes to these proposals not receiving greater support.

1
1. Introduction
Environmental and social issues represent an area of growing concern for companies
and investors alike. A challenging aspect of these issues is that their underlying value
proposition is to lessen the probability of rare disasters, but the very fact that such events are
rare means that it is enormously difficult within an individual firm to quantify the change in
their likelihood and the associated monetary benefits. The presence of such uncertainty
arguably facilitates the tendency of multiple parties to focus on objectives other than
shareholder value maximization. Benabou and Tirole (2010) demonstrate that managerial
short-termism can cause firms to under-invest in these areas even when the initiatives would
contribute positively to firm value.1 Investors’ propensities to similarly suffer from short-term
biases can contribute to further myopia.
These issues give rise to two questions, which represent the focus of this paper. First,
over a large sample, we evaluate the extent to which firm-specific environmental and social
(ES) issues voiced by a group of shareholders are related to subsequent company risks. Second,
having established the strength of this relation, we assess the determinants of shareholder
support for ES initiatives, exploiting heterogeneity in shareholder characteristics that plausibly
relate to their incentives to focus on long-term value.
To capture a set of potentially salient ES issues across publicly listed companies, we
focus on shareholder proposals, where we can observe the specific nature of the proposal, the
identity of the person / organization sponsoring the proposal, and the level of support across a
broad group of shareholders. Across our 2004 – 2016 sample period, more than 20% of all
shareholder proposals relate to ES issues. A unique feature of these types of proposals,
compared to other shareholder proposals, is that they almost never receive the 50% required
1 Benabou and Tirole (2010) also show that managers with a high personal utility on social and environmental
issues may over-invest along these dimensions, undertaking negative NPV projects.
2
support rate to pass. However, several factors suggest that this single statistic belies their
importance. First, the average support rate of ES proposals is increasing rapidly: for instance,
average mutual fund support for these issues was less than 5% in 2004, compared to
approximately 20% in 2016, a four-fold increase. Second, the greatest percent of these
proposals, 53%, is brought by asset management companies, who have a fiduciary duty to focus
on shareholder value. Third, ISS, the largest proxy advisory service company is increasingly
recommending for these proposals.
We start by examining the relations between shareholder proposals on environmental
and social issues and future firm risk. Findings are striking. ES proposals that receive higher
support rates, but not enough to pass, significantly predict downside tail risk (an annualized
abnormal return of -1.4% in the subsequent year, for a one standard deviation increase in
mutual fund support). Results are strongest for abnormal stock returns, consistent with these
risks being largely firm-specific in nature.
Further analyses provide more detailed evidence on the channels underlying these
relations. We use RepRisk data to examine the relation between the support rate on ES
proposals and subsequent negative ES incidents, defined as the number of news reports on
negative ES events at the firm. We find that a one standard deviation increase in mutual fund
support for ES proposals predicts a 24% increase in the number of negative ES incidents in the
subsequent year. In sum, investors’ concerns as expressed through their votes are justified:
they are significantly related to firm downside risk, measured in terms of both extreme negative
stocks returns and real events.
A variety of tests confirm the robustness of our findings and associated conclusions.
First, to mitigate concerns related to sample selection, we include firm fixed effects in all
regressions, thus ensuring that results are not driven by the greater tendency of certain firms to
receive ES proposals. Consistent with sample selection not biasing our conclusions, we find

3
no evidence that the existence of an ES proposal predicts subsequent firm risk. Rather,
predictive power comes from the level of support conditional on the presence of an ES
proposal. Second, to further confirm the role of ES versus other issues, we compare investor
support for failed ES versus failed non-ES initatives, within the same firm. In contrast to the
strong predictability results for the ES issues, we find no evidence that the non-ES issues (that
fail to gain majority support) similarly relate to subsequent downside tail risk. This contrast is
consistent with investors having greater ability to assesss the expected impact of non-ES issues,
and with failed non-ES issues representing the subset that are least likely to be value relevant.
Finally, we also conduct a bevy of placebo tests to strengthen the interpretation of the findings.
The positive relations between investor support and downside risk, combined with the
fact that essentially none of these proposals pass, highlight the importance of understanding
the factors underlying investors’ votes. This motivates our second objective, which is to
examine the relation between investor characteristics and voting behavior.
We focus on mutual fund investors, where publicly available data on voting behavior
enable us to conduct detailed investor-level analyses. Mutual funds’ views on these issues can
be influenced by multiple factors, and the uncertainty surrounding the value effects of the
proposals can lead mutual funds to place more weight on factors other than long-term value
maximization. First, more short-term focused funds will be less supportive of ES proposals if
the cash flows related to these proposals are predicted to be negative in the short-term and if
uncertainty impedes the market’s ability to incorporate the positive long-run impacts into price.
Second, funds that are friendlier to management may oppose ES proposals as a way to appease
myopic managers. As shown by Cvijanović, Dasgupta, and Zachariadis (2016), Davis and Kim
(2007), and Francis and Philbrick (1993), the existence of other business relationships with the
firm and the desire to maintain access to management as a source of information can motivate
mutual funds to vote with management.

4
Consistent with certain investors deeming ES issues to have an indeterminate (or
negative) impact on company value, 19.6% of the mutual funds in our sample blanket vote
against every ES proposal over the 2010 – 2016 period. This compares to an analogous rate of
only 1.6% across all other shareholder proposals. Consistent with variation in investor
incentives, the set of mutual funds engaging in blanket voting against ES proposals is far from
random. Using fund turnover and flow-performance sensitivity to proxy for fund managers’
horizons, (see, e.g., Iliev and Lowry (2015) and Giannetti and Kahraman (2017)), we find that
funds who are incentivized to focus more on long-term outcomes are significantly less likely
to blanket vote against. Regressions at the mutual fund, firm, and agenda level provide further
support for the influence of fund horizon. Across all ES proposals, a one standard deviation
increase in fund-flow performance is, on average, associated with a 5.61% lower likelihood of
voting for an ES proposal.
Furthermore, we find that funds’ friendliness toward management has an effect that is
both economically and statistically significant. We measure friendliness from funds’ past
voting records, following Matvos and Ostrovsky (2008). Consistent with predictions, we find
that management-friendly funds are significantly more likely to vote against the ES proposals.
On average, a one standard deviation increase in management friendliness decreases the
probability of a fund supporting an ES proposal by 22%. Furthermore, the effect of
management friendliness is pronounced among firms in which past management behavior
suggests a greater focus on short-term goals, as measured by the percent of recent firm-years
in which earnings are just above zero (following Dechow and Sloan (1991), Bergstresser and
Philippon (2006), and Roychowdhury (2006)). In sum, the combination of managerial myopia
and funds’ concerns about confronting management appears to impede efforts aimed at
reducing ES risks.
In the final portion of the paper, we examine the extent to which these effects vary

5
across types of proposals. For these tests, we first take advantage of the fact that proposals are
sponsored by different types of entities. The majority of ES proposals, 53%, are sponsored by
asset management companies. The rest are from religious organizations (21%) and a
combination of individuals, unions, and NGOs (26%). Proposals sponsored by asset
management companies are more likely to be value-increasing as asset management companies
face strict fiduciary duty obligations to maximize shareholder value. It follows that the
distortionary incentives of certain investors should be most evident within this subsample:
funds focused on shareholder value will be more likely to support these proposals, whereas
more short-term focused funds and funds that are friendlier toward management will be more
likely to oppose. In contrast, among proposals sponsored by other entities that are less likely
to be value-increasing, we expect all funds to be similarly against the proposal.
Results support these predictions. Both for fund horizon and friendliness measures,
estimated effects are significantly greater among proposals sponsored by asset management
companies. In a similar vein, we also find that the effects of fund horizon and fund-management
friendliness are substantially larger within proposals supported by ISS, which are arguably
more likely to be value-increasing given ISS’ stated objective.2 These results provide further
evidence on the importance of fund horizons and concerns about confronting management.
Our paper is related to several streams of literature. First and foremost, our paper
contributes to the burgeoning literature examining shareholder activism by institutional
investors on environmental and social issues. Thus far, most evidence on institutional activism
on ES issues has focused on engagements. Both Dimson, Karakas and Li (2015) and Hoepner
et al (2018) look at the engagements of a single large institutional investor, and they find that
2 ISS states that ‘the overall principle guiding all [social/environmental issues] vote recommendations focuses
on how the proposal may enhance or protect shareholder value in either the short or long term.” U.S. Proxy
Voting Guidelines, January 4, 2018: https://www.issgovernance.com/file/policy/active/americas/US-Voting-
Guidelines.pdf.

6
successful engagements contribute positively to firm value, but the probability of success is
relatively low. Survey evidence of Krueger, Sautner and Starks (2018) highlights the extent to
which institutions employ multiple channels in addition to engagements, in particular
submitting shareholder proposals and voting against management. Moreover, evidence in
McCahery, Sautner, and Starks (2016) suggests that shareholder proposals are utilized when
private discussions fail, suggesting that they represent more contentious issues. Different from
engagement studies (which typically uses data from one large shareholder), our setting enables
us to examine the ways in which incentives of multiple entities– management, mutual fund
investors, ES proposal sponsors and proxy advisors – interact to influence final outcomes on
ES issues.
Second, there is a growing body of work studying the relation between ES scores and
stock returns. Evidence remains to be mixed.3 We focus on investors’ support of salient ES
initiatives as an alternative measure of ES-related concerns. We find that this measure contains
important information related to future firm risk even when the initiative does not pass the 50%
threshold. Our analysis provides insights on the reasons why these initiatives do not receive
stronger support, by considering the underlying incentives of both management and investors.4
While Brandon and Krüger (2018) and Starks, Venkat and Zhu (2017) examine the relation
between investor horizon and ownership, we focus on shareholder activism. Our results
highlight the role of distortionary incentives on shareholder activism and its relation with
subsequent firm risk.
3 See, for instance, Dimson, Karakas and Li (2015), Lins, Servaes and Tamayo (2017), Cheng, Hong and Shue
(2013) and Krüger (2015), Edmans (2011, 2012), Oikonomou, Brooks, and Pavelin (2012), Diemont, Moore and
Soppe (2016), Flammer (2015), Fabozzi, Ma and Oliphant (2008), Hong and Kacperczyk (2009), Khan, Serafeim
and Yoon (2016), Grewal, Serafeim and Yoon (2016), Dyck, Lins, Roth, and Wagner (2018), amongst others 4 In this vein, our work is also related to a stream of papers that consider the influence of investor characteristics
on firm’s ES investments, for example Dyck, Lins, Roth, and Wagner (2018) who focus on investors’ country of
origin, Hong and Kostovetsky (2012) focus on political preferences, Riedl and Smeets (2017) on social
preferences, and Brandon and Krüger (2018).

7
Finally, our paper contributes to the growing literature on mutual funds’ votes. Prior
literature in this area has mostly focused on agenda items related to director appointments,
compensation, and governance. With respect to these issues, Davis and Kim (2007) and
Cvijanović, Dasgupta, and Zachariadis (2016) show the role of business ties influencing funds’
votes; Cai, Garner and Walkling (2009) and Iliev and Lowry (2015) examine the extent to
which funds simply follow ISS’s recommendations in proxy votes. Recently, Bolton, Li,
Ravina, Rosenthal (2018) and Bubb and Catan (2018) place fund companies on a political scale
from left (socially oriented investors) to right (greedy) according to the patterns in their votes.
Their methodology is agnostic as to where ideology comes from and what it represents. In
contrast, our approach links differences in voting behavior to economic incentives driven by
differences in fund horizons and concerns about confronting management.
2. Data and Measures
Our primary data source is the ISS Voting Analytics database, from which we obtain
shareholder proposals, as well as ISS’s recommendations and mutual funds’ votes on these
proposals, over the 2004 – 2016 period. The beginning of our sample is dictated by data
availability. Mutual funds have only been required to report their votes to the SEC since 2003,
and 2004 represents the first year with high quality data. We end our sample in 2016 to enable
us to follow the firms for several years after the vote. For each firm, ISS reports all proposals
up for vote in each annual meeting and each special meeting, as well as the identity of the
person, firm, or organization sponsoring the proposal. The proposals are categorized based on
the issue. Our main analyses focus on the subset of proposals related to environmental and
social (ES) issues. The most common ES proposals in our sample, as listed in the Voting
Analytics database, include ‘Social Proposal’ (169), ‘Improve Human Rights Standards or
Policies’ (149), ‘Report on Sustainability’ (149), ‘GHG Emissions’ (125), and ‘Climate

8
Change’ (102). Appendix Table A1 provides a complete list of all ES proposals, along with
the number of each proposal type within our sample.
For each fund across the largest 250 mutual fund families, the Voting Analytics
database provides detail on whether the fund voted for or against, voted for, or abstained on
each proposal in each firm-meeting. Throughout our main analyses, mutual fund support is
defined as voting for the proposal, and all other actions (voting against and abstaining) are
categorized together as being opposed to the proposal.5 We merge these data with CRSP and
Compustat, to obtain stock price and financial information for each firm, yielding a firm-year
panel of 26,884 observations. Within this sample, there are 3,971 firm-years across 1,444
unique firms with shareholder proposals, and 1,196 firm-years across 400 unique firms with
one or more ES proposals.
For each proposal, we obtain the name of the person or entity sponsoring the proposal.
Based on name and extensive Google searches, we classify these sponsors into three groups:
asset management companies, religious groups, and other, where other includes unions, NGOs,
and individuals.
For each firm in our sample, we obtain data on media articles related to negative
environmental and social issues from RepRisk. RepRisk screens over 80,000 public sources
in 20 languages on a daily basis, with sources including print media, online media, social
media, government bodies, regulators, think tanks, newsletters, and other online sources.
Across these sources, they search for 28 mutually exclusive ESG issues that were defined in
accordance with key international standards as set for example by the World Bank and OECD,
plus three other categories more loosely named ‘other environmental’, ‘other social’, and ‘other
governance’. We restrict our analysis to the 20 issues that relate to ES issues, with examples
5 About 20% of mutual fund votes are ‘Abstain’. As described later in the paper, we find no significant differences
between voting against and abstaining.

9
of categories including “local pollution”, social discrimination”, and “child labor”.6 Each
identified ESG event is linked to all companies identified in the original source. Finally, for
each firm month, RepRisk tabulates the number of articles on such issues.
For each firm in our sample, we also obtain MSCI KLD data, which represents a
ranking for each firm-year that summarizes the firm’s ES profile. For each category, KLD
summarizes the strengths and concerns. Our firm-year score represents the average of strengths
minus concerns, across five main categories: product, community, employee relations,
environment, and human rights.7
2.1. Basic Descriptive Statistics
Figure 1 shows the number of shareholder proposals per year, categorized by whether
they relate to ES issues (blue bars) or other issues (orange bars). In the average year, there are
128 (median=133) ES proposals, with 23% of all shareholder proposals relating to ES issues.
While the number of ES proposals varies over time, we do not observe a strong time trend.
Grewal, Serafeim and Yoon (2016) shows that there was an upward trend in ES proposals
between 1997 and 2002, but it has been relatively flat since then.
A distinctive feature of ES proposals is that they hardly ever pass. Across our sample
period, 16 ES proposals passed and 1750 failed. In comparison, 1,555 non-ES proposals passed
and 4664 failed. Panel A of Figure 2 shows the level of support over time for these proposals.
We plot both ISS support and average mutual fund support.
Over our 2004 – 2016 sample period, ISS support has increased dramatically; they
recommended for less than 20% of ES proposals in 2004, compared to over 60% in 2016.
6 A full list of the RepRisk topics, as well as more detail on RepRisk, can be found here:
https://www.reprisk.com/content/static/reprisk-methodology-overview.pdf 7 As discussed in detail by Grewal, Serafeim and Yoon (2016), KLD data provides many advantages over other
data sources, including for example a broader set of covered firms and more consistent coverage.

10
Average support among mutual funds has also increased, though the magnitude and rate of
increase have been lower, increasing from less than 5% in 2004 to approximately 20% since
2013. Panel B of Figure 2 highlights this divergence. We categorize all fund-votes across all
ES proposals in our sample into four bins: both ISS and the fund supports (orange bars), both
ISS and the fund are against (blue bars), only ISS supports (gray bars), and only the fund
supports (yellow bars). There are very few cases in which only the fund supports (less than
3% of proposals each year). The category with the greatest growth is cases in which only ISS
supports, and this coincides with a dramatic decrease in the percent of proposals that both ISS
and the fund opposes.
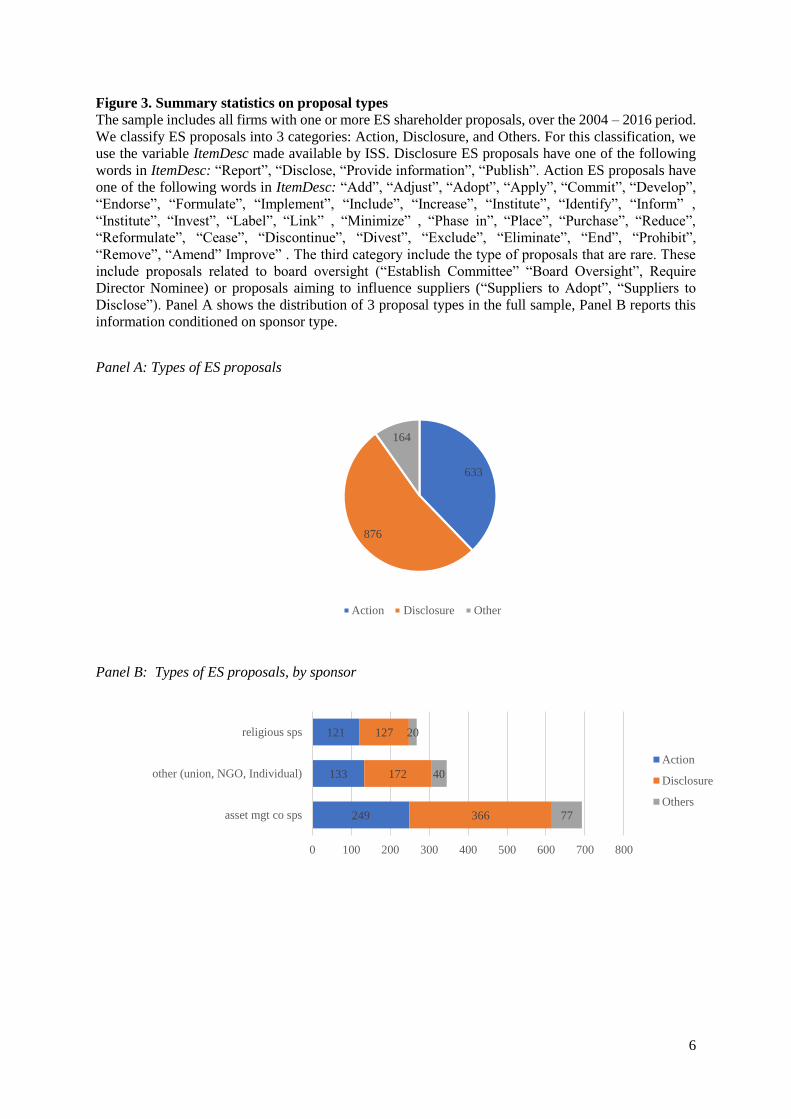
Figure 3 provides further insight on the types of issues on which ES proposals are
focused. We group all ES proposals into three groups: ‘action’ includes all proposals that are
focused on the firm making specific changes (e.g., implementing changes in investment
policies); ‘disclosure’ includes all proposals that request the firm to provide more information
related to their environmental and social policies; and, ‘other’ includes proposals related to all
other issues that are relatively rare, such as Board oversight (e.g., to establish a committee) and
proposals aimed at influencing suppliers (e.g., suppliers to adopt). Further details on this
classification are included with the variable definitions in Appendix I. As shown in Panel A
of Figure 3, disclosure proposals are the most common, with 876 proposals in this category.
This is closely followed by action proposals, of which there are 633. The other category
includes 164 proposals. Panel B shows the relative frequency of these different proposal types
by sponsor. Approximately half of proposals by religious groups and entities in the other
category relate to action items. Among asset management companies, proposals related to
disclosure are somewhat more common.
Appendix Table A2 lists the five most frequent sponsors within each group, and
Appendix Table A3 provides more detail on the most frequent types of proposals, within each

11
sponsor group. For example, asset management companies are most likely to bring proposals
asking for a ‘Report on Sustainability’, whereas religious groups are most likely to bring
proposals asking to ‘Improve Human Rights Standards or Policies’.
Figure 4 depicts the frequency of each sponsor type. As shown in Panel A, 53% of the
ES proposals are sponsored by asset management companies, compared to 21% by religious
groups and 26% by all other entities, which includes NGOs, unions, and individuals. The
finding that more than half of all ES proposals are sponsored by asset management companies
is striking, as these firm owners have a fiduciary duty to focus on shareholder value. Appendix
Figure A1 shows that across all these sponsor types, we observe a divergence between ISS
recommendations and average fund votes similar to that observed in Figure 2. The divergence
is pronounced for proposals sponsored by asset management companies.
Panel B of Figure 4 shows that asset management companies sponsor a total of over
3,000 proposals over our sample period, with ES proposals representing 23% of this set.
Religious group sponsors, on the other hand, initiate far fewer proposals (less than 500) and
ES issues are a greater 61% of all sponsored proposals. The remaining sponsor group sponsors
a considerable amount of proposals (2,500 in total), however only 13% of their proposals are
focused on ES issues.
Table 1 describes the characteristics of the firms receiving these ES proposals, where
Panel A focuses on firm-level statistics and Panel B focuses on proposal-level statistics.
Looking first at Panel A, we compare the 1,196 firm-years (400 unique firms) with ES
proposals to two alternative samples: a broad sample of 36,926 firm-years (5,138 unique firms)
with no ES proposals, and a subsample of 2,775 firm-years (1,044 unique firms) with at least
one shareholder proposal but no ES proposals. We find that firm-years with ES-proposals tend
to have a greater total number of proposals (13.4 on average), including more shareholder
proposals (2.6 on average). The firms are also significantly larger (average market

12
capitalization of $46.4 billion), higher market-book (3.22), higher sales growth (0.06), higher
ROA (0.15), and lower cash balances as a fraction of assets (0.11). They have significantly
lower ES scores: -0.7, versus -0.1 across all firms with no ES proposals and 0.0 for the
subsample with at least one shareholder proposal. Variable descriptions are provided in
Appendix I.
The top of Panel B describes the mutual fund owners of firm-years with ES proposals,
compared to those with at least one shareholder proposal but no ES proposals. Among the ES
proposal sample, mutual fund owners have significantly lower turnover (0.70 vs 0.72), where
turnover is calculated as the rolling average of the fund’s past 12-month turnover ratio (equal
to minimum of aggregated sales or aggregated purchases of securities, divided by fund’s
average past 12-month total net assets). They also have lower flow-performance sensitivity
(0.97 vs 1.14), calculated from rolling regressions of fund flows on the average four-factor
alpha over the past 12 months. The mutual fund owners are slightly less likely to be index
funds, slightly smaller, and have slightly lower returns over the past 12 months.
Finally, the last row of Panel B describes mutual fund owners’ tendency to vote with
management. Following Matvos and Ostrovsky (2008), we measure fund-management
friendliness as the percent of past proposals on which the mutual fund voted with management,
where proposals are restricted to management proposals on which ISS recommended against
management. Overall, this measure of fund-management friendliness is slightly lower in the
ES sample: 3.4% vs 3.7%.
3. Investor support for failed ES proposals and subsequent firm downside tail risk
Our first objective is to evaluate whether salient ES concerns expressed via votes in
shareholder proposals are informative of subsequent firm downside tail risk. We limit our
sample to proposals that fail (which eliminates less than 1% of all ES proposals), meaning it is

13
unlikely that management implements these initiatives. As noted above, the fact that the
concern is being raised in the form of a shareholder proposal generally indicates that
management has not voluntarily agreed to the initiative. Further, proposals that receive less
than the threshold level of support have a lower rate of implementation (compared to initiatives
that pass).8 If managerial opposition stems from myopia and at least a portion of mutual funds
are more long-term focused and have the ability to assess the salience of a proposal, then we
would expect a positive relation between mutual fund support and future firm risk.
We use the full sample of firm years with CRSP, Compustat, and Voting Analytics data
over the 2004 - 2016 period, a total of 26,884 observations. Following Hoepner, Oikonomou,
Sautner, Starks and Zhou (2018), we define firm downside risk based on the firm’s four-factor
alpha calculated in year t. Downside risk equals this alpha if the alpha falls below the 25th
percentile across all sample observations, and it equals zero otherwise. We regress the
downside risk measure on various proxies for the salience of ES-related concerns, measured
from t-2 to t-1. All regressions include control variables that have been shown in prior literature
to be related to firm risk as well as both year and firm fixed effects.
We begin in column 1 of Table 2 by examining the extent to which the presence of an
ES proposal is related to subsequent firm risk. Specifically, we regress downside risk on a
dummy equal to one if there was a failed ES proposal from year t-2 to t-1, and a dummy for
whether there was a failed non-ES proposal in the same period. The omitted category against
which these measures are compared includes firm-years with no failed shareholder proposals
(either ES or non-ES), which includes both firm-years with no shareholder proposals and firm-
years in which all shareholder proposals passed. The objective is to compare firm years with
salient shareholder concerns that were rejected by firm management and therefore plausibly
8 Cuñat, Giné and Guadalupe (2012) find a sharp discontinuity in the probability of implementing changes
around the threshold point, generally 50%.

14
relate to subsequent firm risk, to firm years in which shareholders and management were in
greater agreement on the appropriate course of action.
We find no evidence that the presence of an ES proposal itself is related to subsequent
firm risk. First, this mitigates concerns related to sample selection. If some types of firms
were more likely than others to receive such proposals and our controls did not completely
capture such dynamics, we would have found a significant relation. Second, it is also consistent
with the simple presence of an ES proposal being a poor proxy for the level of concern
surrounding these issues. As discussed earlier, there is substantial heterogeneity in the type of
proposal, in the objective of the proposal sponsor, and in the level of investor support.
Column 2 adds the presence of an ES proposal interacted with support rate as a more
precise measure of the salience of these issues, where the support rate is measured as average
mutual fund support rate in the case of one or more failed ES proposals. Findings are
illuminating: greater mutual fund support for ES initiatives predicts greater tail risk in the
subsequent year. One standard deviation increase in mutual fund support predicts 1.4% lower
annualized abnormal returns (specifically tail risk) within the subsample of firm-year
observations with at least one ES proposal. Column 3 shows that inferences are similar when
we measure support for the issue in terms of ISS support. Finally, Column 4 also shows that
overall investor support, measured across all investors instead of just across mutual fund
investors, is also positively related to subsequent firm downside tail risk, though statistical
significance level is lower.
In contrast, these regressions provide no evidence that support for failed non-ES
proposals similarly predict subsequent downside risk. This lack of significance is consistent
with the market’s greater understanding of issues underlying other shareholder proposals.9 In
9 The most common failed non-ES proposals include proposals related to compensation and the calling of special
meetings, issues about which we have considerably more evidence and arguably a better ability to evaluate.

15
a world of perfect information and undistorted incentives, all proposals that contributed
positively toward firm value would pass and all others would fail. This is obviously an extreme
scenario and no shareholder proposals could plausibly be characterized as such. However,
information quality is arguably lower on average for ES proposals. When combined with
distortionary incentives such as myopia, this leads to a greater percentage of relevant ES
proposals failing, and to a subsequent increase in firm risk.
The inclusion of firm and year fixed effects in all these regressions, combined with the
fact that our measure of firm tail risk is measured as abnormal returns, should mitigate any
concerns related to sample selection issues. Also, as noted above, the simple presence of an
ES proposal is unrelated to subsequent firm downside risk. The results are obtained on the
intensive margin, as captured by the interaction of ES proposal dummy and the support rate.
The significant relation between support for ES initatives and subsequent firm tail risk
suggests that these support levels capture the probability of a negative incident at the firm.
Table 3 examines this directly. To capture the frequency of negative incidents, we use RepRisk
data on the number of negative ES issues during the year; this represents the dependent
variable. Similar to Table 2, we use the full sample of firm-years, and independent variables
of interest include a dummy for the presence of an ES (or non-ES) proposal, interacted with
the level of support. Consecutively, we examine mutual fund support, the level of ISS support,
and the aggregate support across all investors. We also include the same set of controls and
fixed effects.
Column 1, which only includes dummy variables to denote the incidence of these ES
and non-ES proposals, suggests that the existence of an ES proposal significantly positively
predicts future negative ES incidents. However, subsequent columns indicate that this
predictability is completely isolated within cases that receive higher support. Columns 2 – 4
indicate that support by mutual funds, by ISS, and by aggregate investors all significantly

16
predict negative future ES incidents. A one standard deviation increase in mutual fund support
for ES proposals predicts a 24% increase in the number of negative ES incidents in subsequent
two years.10 After controlling for these support levels, the dummy for the existence of a
proposal is no longer significant. It is also worth highlighting that, similar to Table 2, support
for failed non-ES proposals do not have a simlar positive predictive effect.
Our findings of negative relations between mutual fund support for issues and negative
subsequent firm outcomes provides an informative contrast to the engagement literature.
Dimson et al (2015) and Hoepner et al (2018) find that ES engagements are most effective in
lowering downside risk when the engagement is more successful. Our findings in Tables 2 and
3 suggest that a group of shareholders can identify the ES issues that are most likely to
contribute to downside risk. The fact that management rejects these initiatives and shareholder
support falls short of the threshold rate causes these salient ES issues to not be implemented.
Consequently, ES related problems are likely to arise in the future.
Table 4 contains a series of placebo tests. The dependent variaable is firm upside tail
returns, which represents the analog of downside tail risk but captures the right tail of returns.
Specifically, it is defined as the firm alpha if this alpha is above the 75th percentile, and zero
otherwise. To the extent that ES initaitives are largely focused on lessening the probability of
rare disasters, we would not expect a relation with this upside return measure. Results across
Table 4 confirm this to be the case.11 Results on both the existence of ES proposals and support
for these proposals by mutual funds, by ISS, and across all investors are insignificant at
conventional levels.
10 To accurately capture economic magnitudes, we focus on the standard deviation of fund support within the
subsample of observations with an ES proposal. A one standard deviation increase in fund support times the
coefficient on fund support in column 2 of Table 3 (0.73) equals 0.1. Because the dependent variable represents
ln (1+ES incidents), the associated percentage increase in the number of ES incidents equals 7.5^0.1=1.24. 11 We are unable to do a placebo test with real events, as measured by media coverage captured by RepRisk,
because RepRisk only collects information on negative news.

17
In sum, results throughout this section are consistent with the idea that there are ES
proposals aimed at reducing the incidents of rare disasters. These initiatives receive
considerable investor support but not enough to pass the 50% threshold; therefore they are
unlikely to be implemented. We find that such proposals predict negative firm outcomes. On
the one hand, these results highlight the ability of some investors to identify the most salient
ES issues. However, they also raise questions regarding the opposition to these initiatives by
both management and remaining shareholders. The next section examines the incentives of
both these parties, to understand this apparent contrast.
4. Funds’ tendencies to vote for ES proposals
A broad body of literature, starting with Stein (1988, 1989) demonstrates that market
forces can incentivize managers to be myopic. Similarly, mutual funds also face short-term
pressures, for example as might arise from the structure of compensation contracts or career
concerns. Following Benabou and Tirole (2010), we hypothesize that such short-term
pressures contribute to the tendencies of both management and many investors to oppose these
ES initiatives, even when they predict subsequent negative firm outcomes.
4.1. Blanket against votes in ES proposals: summary statistics
Table 5 examines the extent to which mutual funds indiscriminately vote against all ES
issues, and it also provides initial evidence on heterogeneity across mutual funds. Funds that
vote against 100% of ES proposals (and analogously 100% of non-ES proposals) are
characterized as ‘blanket voting’ on ES (non-ES) issues.
We begin by examining blanket against votes at the fund family level, because many
fund families vote as a unit on many issues. To this end, we identify all mutual fund families
that voted on 30 or more ES proposals as well as those that voted on 30 or more non-ES
18
shareholder proposals. As shown in Panel A of Table 5, blanket voting is significantly more
common on ES proposals, compared to other shareholder proposals. Across the earlier 2004 –
2009 portion of our period, 15.42% of mutual fund families blanket voted against ES proposals,
compared to only 1.95% for non-ES shareholder proposals. Interestingly, mutual fund families
have become less likely to blanket vote against ES proposals in the more recent 2010-2016
period, with the rate declining to 7.94%.
We obtain similar statistics when we extend the sample by relaxing the minimum
number of proposals per fund to three (instead of 30). The first observation is that the rate of
blanket voting against both ES and non-ES proposals appears higher – this reflects the fact that
voting against three proposals is a less stringent condition than voting against 30. The second
and arguably more important observation is that overall conclusions regarding differences
between ES versus non-ES proposals are similar.
In Panel B, we report the summary statistics on blanket (against) voting at the fund
level for funds of families that do not vote as a bloc. We observe that similar inferences are
obtained if we define blanket voting at the fund level instead of at the fund family level. The
rate of blanket voting against ES proposals is higher at the fund level, which is consistent with
it being a less stringent criteria for a single fund to vote against all ES issues, compared to all
funds across an entire fund family voting against. More importantly, conclusions are consistent
with those from Panel A: the rate of blanket voting is substantially higher among ES issues
than non-ES issues, and the rate of blanket voting in ES issues has declined over time.
Panel C of Table 5 provides descriptive evidence on the types of mutual funds that tend
to blanket vote against on ES proposals, versus those that do not. As in panel B, we use the
funds of families which do not vote as a bloc. Looking first at rows 1 and 2, funds that blanket
vote against are much smaller, a significant difference of 2.30 billion vs 5.88 billion, and they
have slightly lower returns over the past 12 months.

19
More directly related to the focus of the paper, the descriptive statistics provide initial
suggestive evidence consistent with our conjecture that more short-term focused funds are
more likely to vote against ES proposals. First, funds that blanket vote against, which we
define using the 30-vote minimum, have significantly higher flow-performance sensitivity.
This is our preferred measure of short-termism as it directly incorporates investor preferences,
i.e., the extent to which the fund investors (and potential investors) increase or decrease their
positions in response to performance. As originally proposed by Shleifer and Vishny (1997),
funds with high flow-performance sensitivity are reluctant to invest in companies that may
experience poor performance in the short-run, even if these companies have strong long-term
prospects. This measure has been employed by Giannetti and Kahraman (2017) and Hombert
and Thesmar (2014), among others.
Also consistent with the effects of investor short-termism, Panel C shows that the funds
that blanket vote against have significantly higher turnover, 0.76 versus 0.68. Turnover is a
commonly used metric of a short horizon, as funds that hold securities for short periods
rationally seek to maximize firm performance over similar time frames.12 In a similar vein,
funds that blanket vote against are also significantly less likely to be index funds, 23% versus
36%.
Finally, the blanket vote against funds are significantly friendlier toward management,
which we measure as the percent of past proposals on which the fund voted for management,
among the set of past management proposals where ISS recommended against management.
By definition, these ES shareholder proposals are all opposed by management, suggesting that
investors who tend to be more supportive of management would be more likely to similarly
oppose the initiatives. The motivations for investors to support management potentially derive
12 Prior literature on short-termism among 13F institutions, including for example Gaspar, Massa and Matos
(2005), generally use the churn ratio. This is driven by the lack of turnover data at the institutional level. Because
turnover ratios are available for mutual funds, we do not use the churn ratio, which is arguably less precise.

20
from multiple sources. Davis and Kim (2007) and Cvijanović, Dasgupta, and Zachariadis
(2016) conclude that mutual fund families are more likely to vote with management if they
manage the firm’s pension fund assets. Iliev and Lowry (2015) find that 8% of mutual funds
vote with management on all issues up for vote across all firms, over a five-year sample period.
We do not take a stance on why certain mutual funds are more likely to vote with management,
but just recognize that certain funds are incentivized to behave in this manner. We find that
the blanket-vote against funds vote for 4% of ES issues, compared to only 3% among other
cases, with the t-stat of 10.4.
4.2. Fund heterogeneity in tendency to support ES proposals: regression analysis
This section examines the differences in investors’ tendencies to support ES issues
within a regression framework. Table 6 focuses on the influence of investors’ horizon, and
Table 7 focuses on funds’ friendliness toward management and managerial short-termism. For
each, the sample consists of mutual funds’ votes on shareholder proposals related to ES issues,
in annual and special meetings over the 2004 – 2016 period. Regressions are OLS, and the
dependent variable equals one if the mutual fund votes for the proposal in the firm meeting,
and zero if it votes against or abstains. We control for a variety of firm characteristics as well
as ISS’s recommendation. All regressions also include firm fixed effects, sponsor type fixed
effects (asset management, religious group, or other), proposal category fixed effects (ISS 4-
digit code), and year fixed effects. We include specifications both with and without fund fixed
effects, to enable us to examine both cross-fund and within-fund effects.
Looking first at Table 6, independent variables of interest include our two measures of
short-termism: flow-performance sensitivity in columns 1 and 2, and turnover in columns 3
and 4. Looking first at Column 1, results indicate that a one standard deviation increase in
flow performance sensitivity is associated with a 5.61% lower likelihood of voting for ES

21
proposals.13 Mutual funds who tend to experience greater inflows when performance is higher
(and outflows when performance is lower) are more concerned with the short-term
performance of every firm in their portfolio. As such, they are less likely to support firm
initiatives that will only contribute positively to value over the long-run, with the possibility of
negative repercussions in the shorter term. Finally, while it is presumably not surprising that
ES funds are significantly more likely to vote for ES proposals, the magnitude is striking, at
33%. The other most economically significant variable is the ISS recommendation, which is
consistent with findings in prior literature. Even after controlling for all other observable
factors, mutual funds are 27% more likely to vote for a proposal that ISS supported.
Column 2 shows a similar regression, but it includes fund fixed effects. As such, it is
testing whether a given fund is less likely to vote for an ES proposal in years when its flow-
performance sensitivity is higher. This much more stringent specification further highlights
the effects of funds’ incentives on their voting behavior. Within a given fund, a one standard
deviation increase in flow-performance sensitivity is associated with a 2.72% lower likelihood
of voting for an ES proposal. A comparison of economic magnitudes across columns 1 and 2
suggests that approximately half of the effect is driven by differences across funds (that are not
accounted for by observable fund characteristics included as controls) and half by inter-
temporal differences within each fund.
Columns 3 and 4 show similar specifications, using turnover as a measure of a fund’s
short-term incentives. A fund with higher turnover is less likely to own any stock far into the
future. If the positive effects of ES initiatives are more likely to only be realized far into the
future, then high turnover funds will be less likely to vote for them. This is exactly what we
find, both across fund-years (column 3) and across years within a given fund (column 4).
13 The standard deviation of flow-performance sensitivity is 0.0593, times the coefficient of -0.128 equals -
0.00759, which divided by the sample mean of the dependent variable (0.1353) equals -5.61%

22
Table 7 presents a similar set of regressions, but the focus is fund friendliness toward
management. We start in column 1 by regressing fund votes on fund-management friendliness.
As before, fund vote is defined as a dummy equal to one if the fund votes for the ES proposal
and zero otherwise. Fund-management friendliness is defined as the percent of proposals on
which the fund voted for, among the subset of past proposals where ISS recommended against.
Consistent with certain mutual funds having incentives to be friendlier toward management
and thus not supporting initiatives that management opposes, we find that greater fund-
management friendliness is associated with a significantly lower probability of voting for ES
proposals. A one standard deviation increase in friendliness is associated with a 22.0% lower
likelihood of voting for the shareholder proposal.14
Subsequent columns explore this finding further, by relating it to management’s
preferences. The fact that a shareholder proposal is up for vote provides a strong signal that
management opposes the initiative. In many cases, the proposal’s sponsor has previously
discussed the issue with management, and they have been unable to reach an agreement (see,
e.g., McCahery, Sautner, and Starks (2016)). Following Benabou and Tirole, we hypothesize
that myopia among top management contributes to their opposition of at least some ES
initiatives.
To proxy for the extent of managerial short-termism, we use a dummy equal to one if
the firm’s earnings per share (EPS) or net income (NI) in the past year is just above zero.
Alternatively, we also use the percent of the past five years in which EPS and NI, respectively,
were just above zero. Hayn (1995) and Burgstahler and Dichev (1997) find a discontinuity in
firms’ earnings, with firms being significantly more likely to have values just above zero than
just below zero. Roychowdhury (2006) concludes that firms engage in real earnings
14 This is calculated as the standard deviation of friendliness of 0.0976, times the coefficient of -0.310, divided by
the sample mean of the dependent variable (0.1372).

23
management, i.e., altering operational-related factors such as R&D, inventories, and
receivables, to avoid negative earnings. This earnings management indicates a focus on short-
term goals, suggesting that these managers would be particularly opposed to undertaking ES
proposals; many of these projects are characterized by upfront costs, with many benefits only
recognized far into the future. Based on this logic, we predict that the lower likelihood of
management-friendly funds to vote for ES proposals will be more pronounced among firms
where management is under more short-term pressure, as proxied by these earnings
management metrics.
Columns 2 – 5 of Table 7 provide strong support for these predictions. In columns 2
and 3, we introduce a dummy equal to one if EPS over the past year was between 0 and 0.10,
and a dummy equal to one if NI over the past year was between 0 and $20 million, respectively.
In columns 3 and 4 earnings management is based on firm financial performance over the past
five years, defined as the percent of years in which each of these measures, respectively, was
within the defined narrow band just above zero. Results across all specifications are consistent
with predictions. The coefficient on fund-management friendliness continues to be
significantly negative, indicating that these funds are less likely to vote for ES proposals.
Moreover, the magnitude of the effect is significantly larger in firm-years in which recent
earnings were barely above zero, as evidenced by the significantly negative interaction terms.
The incremental effect on funds’ propensities to vote for the proposal is -1.2 to -4.2%, relative
to the -22.0% effect from Column 1.15
Results throughout this section highlight the extent to which fund short-termism and
fund-management friendliness contribute to funds’ lack of support for ES issues, despite their
significant relation with subsequent firm downside risk. In addition, short-termism among
15 Table A6 of the Internet Appendix shows the robustness of these results to controlling for fund fixed effects,
suggesting that these effects also vary over time within a fund.

24
management also plays a role, with management-friendly funds being significantly more likely
to vote against ES proposals when management is more short-term focused.
4.3. Differences in voting behavior conditional on proposal sponsor characteristics
If the disparities in funds’ likelihoods of voting for ES proposals are driven by short-
termism, then the differences should be greatest within the subsample of ES proposals that are
more likely to be value-increasing. If we could perfectly measure the value effects of each ES
proposal, we would expect no mutual funds to vote for proposals that are value-decreasing. In
contrast, we would observe a disparity among proposals that were value-increasing, with short-
term focused funds being less supportive. We test this conjecture in Tables 8 and 9, using two
proxies for the likelihood that a proposal is value-increasing. In each table, we first subset by
whether the proposal is sponsored by an asset management company (columns 1 – 3).
Compared to other proposal sponsors, asset management companies have a stronger fiduciary
duty obligation.16 Second, we subset by whether it is supported by ISS (columns 4 – 6). We
note that these categorizations are correlated, but not perfectly so. Internet Appendix Table A5
shows that ISS is significantly more likely to recommend for proposals sponsored by asset
management companies, even after controlling for firm financial characteristics and even firm,
year, and proposal category fixed effects.
Looking first at Table 8, columns 1 and 2 split the sample based on whether or not the
proposal was sponsored by an asset management company. Results are consistent with the
above predictions. The coefficient on our proxy for fund horizon, flow-performance
sensitivity, is greater within the subset of proposals sponsored by asset management
companies. Column 3 confirms that this difference is significant. We combine all proposals
16 In our main specifications, all religious affiliated entities are included in the non-asset management company
category. Results are qualitatively similar if we instead include religious funds with the asset management
companies.

25
into a single sample, and we regress the dummy Vote For on fund-performance sensitivity and
fund-performance sensitivity interacted with a dummy equal to one if the proposal was
sponsored by an asset management company. Both flow-performance sensitivity and the
interaction term are significantly negative. A one standard deviation increase in flow-
performance sensitivity is associated with a 6.38% lower likelihood of voting for a proposal
sponsored by an asset management company, compared to a lower 4.39% likelihood among
other proposals.
Columns 4 – 6 provide even stronger evidence. We find that the greater propensity of
funds with greater flow-performance sensitivity to vote against ES proposals is entirely
concentrated within the subsample of proposals for which ISS recommends for. Among cases
where ISS recommends for, a one standard deviation increase in flow-performance sensitivity
is associated with an 8.69% lower likelihood of voting for the ES proposal relative to the mean,
compared to no significant effect among the cases that ISS does not support. Column 6
confirms this conclusion and shows that the difference between these subsamples is statistically
significant.
Table 9 explores similar dynamics, with a focus on the relation between fund
management friendliness and the likelihood that the ES proposal is value-increasing. Using a
structure that follows Table 8, columns 1 and 2 partition the sample based on the identity of
the proposal sponsor. Results are consistent with earlier findings. Focusing on column 3 where
we combine all ES proposals together, the coefficient on the interaction term is significantly
negative. Inferences from columns 4 – 6 are similar, but as in Table 8 the effects are
substantially stronger when we partition by ISS’s recommendation. Across proposals on which
ISS recommends For, a one standard deviation increase in management friendliness is
associated with an 6.35% lower probability of voting For. In contrast, across proposals on
which ISS recommends Against, management friendliness has a much smaller effect, only -

26
1.92%. Column 3 confirms that this difference is statistically significant, with a t-statistic of
over 14.
In sum, across proposals that are less likely to be value-increasing we find more
evidence of all shareholders voting against, with investor’ specific characteristics and
incentives playing less of a role. In contrast, within the sample of proposals that are more likely
to be value-increasing, both shareholders’ horizon and fund-management friendliness are
significant determinants of their level of support.
5. Conclusion
Environmental and social issues are a topic of increasing focus, within regulatory,
academic and executive circles, in part because various factors make it difficult for firms and
investors to choose the ‘right’ course of action. First, the objective of many of these initiatives
is to mitigate the likelihood of rare events, and it is difficult to estimate changes in low
probability events and even harder to estimate the associated monetary benefits. Second, when
the value proposition of an initiative is uncertain, individuals can be more easily influenced by
other factors. In a perfect information world, advocating a value-decreasing course of action
is more likely to have adverse consequences. At a minimum, there would be some reputation
costs. In contrast, when uncertainty is higher, it is less clear whether an individual’s decision
is motivated by distortionary incentives, for example short-termism, or by disagreement
regarding the underlying value effects of the proposal. ES-related investments tend to have
long time horizons, with many unknown factors that make it difficult to ascertain effects on
firm value.
It is arguably not surprising that there exists considerable heterogeneity in the quality
of ES shareholder proposals. However, our results highlight the extent to which mutual funds,
as a group, identify this heterogeneity. Proposals with higher investor support, but which

27
management opposes and which do not pass, are associated with significantly higher
subsequent firm risk. This finding relates to risk measured in terms of stock returns and to risk
measured in terms of real events. While each individual investor may struggle to identify the
value proposition of these proposals, there is significant information in the aggregate group
behavior.
The finding that the failed proposals with highest investor support significantly predict
future firm downside risk raises the question of why more than 50% of mutual funds are voting
against these initiatives. Along this dimension, our results highlight the ways in which myopia
among mutual funds, myopia among firm managers, and funds’ concerns about confronting
management represent an impediment to improvements on ES issues. Investors that are more
focused on long-term value creation, for example less myopic and less influenced by
management recommendations, are more likely to support these proposals.

1
References
Benabou, R., Tirole, J., 2010. Individual and corporate social responsibility. Economica 77,
1-19.
Bergstresser, D., Philippon, T., 2006. CEO incentives and earnings management. Journal of
Financial Economics 80, 511-529.
Bolton, P., Li, T., Ravina, E. and Rosenthal, H., 2018. Investor ideology. Working paper.
Brandon, R.G., Krüger, P., 2018. The Sustainability Footprint of Institutional Investors.
Working paper.
Bubb, R. and Catan, E., 2018. The party structure of mutual funds. Working paper.
Burgstahler, D., Dichev, I., 1997. Earnings management to avoid earnings decreases and
losses. Journal of Accounting and Economics 24, 99-126.
Cai, J., Garner, J.L., Walkling, R.A., 2009. Electing directors. The Journal of Finance 64, 2389-
2421.
Cheng, I., Hong, H., Shue, K., 2013. Do managers do good with other people's money?
Working paper.
Cuñat, V., Giné, M., Guadalupe, M., 2012. The vote is cast: the effect of corporate governance
on shareholder value. Joual of Finance 67, 1943 – 1977.
Cvijanović, D., Dasgupta, A., Zachariadis, K., 2016. Ties that bind: how business connections
affect mutual fund activism. Journal of Finance 71, 2933 – 2966.
Davis, G., Kim, E., 2007. Business ties and proxy voting by mutual funds. Journal of Financial
Economics 85, 552 – 570.
Dechow, P., Sloan, R., 1991. Executive incentives and the horizon problem. Journal of
Accounting and Economics 14, 51 – 89.
Diemont, D., Moore, K., Soppe, A., 2016. The downside of being responsible: Corporate social
responsibility and tail risk. Journal of business ethics, 137, 213-229.
Dimson, E., Karakas, O., Li, X., 2015. Active Ownership. Review of Financial Studies 28,
3225 - 3268.
Dyck, A., Lins, K.V., Roth, L., Wagner, H.F., 2018. Do institutional investors drive corporate
social responsibility? International evidence. Journal of Financial Economics.
Edmans, A., 2011. Does the stock market fully value intangibles? Employee satisfaction and
equity prices. Journal of Financial economics 101, 621-640.
Edmans, A., 2012. The link between job satisfaction and firm value, with implications for
corporate social responsibility. Academy of Management Perspectives 26, 1-19.
Fabozzi, F.J., Ma, K.C., Oliphant, B.J., 2008. Sin stock returns. Journal of Portfolio
Management 35, 82.

2
Flammer, C., 2015. Does corporate social responsibility lead to superior financial
performance? A regression discontinuity approach. Management Science 61, 2549-
2568.
Francis, J. and Philbrick, D., 1993. Analysts' decisions as products of a multi-task environment.
Journal of Accounting Research, 216-230.
Friedman, M., 1970. The social responsibility of business is to increase its profits. New York
Times Magazine, 9/13/1970.
Gantchev, N., Giannetti, M., 2018. The Costs and Benefits of Shareholder Democracy.
Working paper.
Gaspar, J.M., Massa, M., Matos, P., 2005. Shareholder investment horizons and the market for
corporate control. Journal of financial economics 76, 135-165.
Giannetti, M., Kahraman, B., 2017. Open-end organizational structures and limits to arbitrage.
The Review of Financial Studies 31, 773-810.
Grewal, J., Serafeim, G., Yoon, A., 2016. Shareholder activism on sustainability issues.
Working paper.
Hayn, C., 1995. The information content of losses. Journal of Accounting and Economics 20,
125-153.
Hoepner, A.G., Oikonomou, I., Sautner, Z., Starks, L.T., Zhou, X., 2018. ESG shareholder
engagement and downside risk. Working paper.
Hombert, J., Thesmar, D., 2014. Overcoming limits of arbitrage: Theory and evidence. Journal
of Financial Economics 111, 26-44.
Hong, H., Kacperczyk, M., 2009. The price of sin: The effects of social norms on markets.
Journal of Financial Economics 93, 15-36.
Hong, H., Kostovetsky, L., 2012. Red and blue investing: Values and finance. Journal of
Financial Economics 103, 1-19.
Iliev, P., Lowry, M., 2015. Are mutual funds active voters? Review of Financial Studies 28,
446 – 485.
Khan, M., Serafeim, G., Yoon, A., 2016. Corporate sustainability: First evidence on
materiality. The accounting review 91, 1697-1724.
Krueger, P., Sautner, Z., Starks, L.T., 2018. The Importance of Climate Risks for Institutional
Investors. Working paper.
Krüger, P., 2015. Corporate goodness and shareholder wealth. Journal of financial economics
115, 304-329.
Lins, K.V., Servaes, H., Tamayo, A., 2017. Social capital, trust, and firm performance: The
value of corporate social responsibility during the financial crisis. The Journal of
Finance 72, 1785-1824.

3
McCahery, Sautner, Z., Starks, L., 2016. Behind the scenes: the corporate governance
preferences of institutional investors. Journal of Finance 71, 2905 – 2932.
Matvos, G., Ostrovsky, M., 2008. Cross-ownership, returns, and voting in mergers. Journal of
Financial Economics 89, 391-403.
Oikonomou, I., Brooks, C., Pavelin, S., 2012. The impact of corporate social performance on
financial risk and utility: A longitudinal analysis. Financial Management 41, 483-515.
Roychowdhury, S., 2006. Earnings management through real activities manipulation. Journal
of accounting and economics 42, 335-370.
Riedl, A., Smeets, P., 2017. Why do investors hold socially responsible mutual funds?. The
Journal of Finance 72, 2505-2550.
Shleifer, A., Vishny, R.W., 1997. The limits of arbitrage. The Journal of Finance 52, 35-55.
Starks, L., Venkat, P., Zhu, Q., 2017. Corporate ESG profiles and investor horizons. Working
paper.
Stein, J., 1989. Efficient capital markets, inefficient firms: a model of myopic corporate
behavior. Quarterly Journal of Economics 104, 655 – 669.

1
Appendix I: Variable Descriptions
Variable Label Definition
Proposal variables
ES proposal A dummy variable that equals one if the proposal relates to
environmental or social (ES) issues
ISS for A dummy variable that equals one if ISS recommends for the
proposal
Asset mgmt sponsor A dummy variable that equals one if the proposal is
sponsored by an asset management company
Religious group sponsor A dummy variable that equals one if the proposal is
sponsored by a religious group (including religious funds)
Other sponsor A dummy variable that equals one if the proposal is
sponsored by individuals, union, or NGOs
Mutual Fund variables
Vote For A dummy variable that equals one if the fund votes for the
proposal, zero otherwise
FPS Flow-performance sensitivity estimated from 36 month
rolling regressions where fund flows are regressed on
average 4-factor alpha in the past 12 months. It is divided by
100 in regressions.
Turnover Rolling average of fund’s past 12-month turnover ratio;
turnover ratio is defined as the minimum (of aggregated sales
or aggregated purchases of securities) divided by fund’s
average past 12-month total net assets
Fund-mgmt friendliness Historical average of fraction (in %) of management-
sponsored proposals that fund supports when ISS
recommends against until time t
ES fund A dummy variable that equals one if the fund has one of ES
related words (“environment”, “environmentally”, “climate”,
“green”, “social”, “socially”, “responsible”) in its reported
name
Index fund A dummy variable that equals one if the fund is identified as
an index fund by CRSP or the fund has the word “index” in
its reported name
Log TNA Natural logarithm of fund’s total net assets as of month-end
(in billions)
Fund alpha Average monthly 4-factor alpha estimated from past 12
month rolling regressions
Firm variables
Downside Tail Risk Value of firm’s 12-month average 4-factor alpha if alpha is
below the 25th percentile of the sample; equals zero
otherwise. Estimated using daily data; daily alphas are then
annualized
Upside Tail Return
(analogous to downside tail
risk)
Value of firm’s 12-month average 4-factor alpha if alpha is
above the 75th percentile of the sample; equals zero

2
otherwise. Estimated using daily data; daily alphas are then
annualized
Incident incidents count Natural logarithm of one plus the total number of news
reports on negative environmental and social incidents of the
firm in a given year. Data provided by RepRisk and is
available from January 2007
Mutual fund support Average fund support across all ES proposals in a given
company over a k year period; k equals 2
ISS support Average ISS support across all ES proposals in a given
company over a k year period; k equals 2
Overall support Average fund support across all ES proposals in a given
company over a k year period; k equals 2
Log MV Natural logarithm of market capitalization defined as price
times shares outstanding as of fiscal year-end (in millions)
IVOL Idiosyncratic volatility of firm’s 12-month abnormal daily
stock returns (4-factor alpha)
M/B Market value of equity divided by book value of equity as of
fiscal year-end. Book Equity is the book value of
stockholders’ equity, plus balance sheet deferred taxes and
investment tax credit (if available), minus the book value of
preferred stock. Depending on availability, we use the
redemption, liquidation, or par value (in that order) to
estimate the book value of preferred stock. Stockholders’
equity is the value reported by Moody’s or Compustat, if it is
available. If not, we measure stockholders’ equity as the book
value of common equity plus the par value of preferred stock,
or the book value of assets minus total liabilities (in that
order). Market equity is price times shares outstanding.
ROA Earnings before interest, tax, depreciation and
amortization (EBITDA) as of fiscal year-end divided by
previous year’s total assets
Dividend yield Common plus preferred dividends divided by the sum of
market value of common stocks and book value of preferred
stocks, as of fiscal year-end
Past firm return 12-month buy-and-hold stock (raw) return
Cash Sum of cash and cash equivalents divided by total assets, as
of fiscal year-end
Sales growth Growth rate of sales over the fiscal year
Amihud illiquidity 12-month average of daily illiquidity ratio:
1000√|𝑅𝑒𝑡𝑢𝑟𝑛|/(𝐷𝑜𝑙𝑙𝑎𝑟 𝑇𝑟𝑎𝑑𝑖𝑛𝑔 𝑉𝑜𝑙𝑢𝑚𝑒)
Inst ownership Total number of shares held by 13F institutions divided by
stock’s total shares outstanding, as of (calendar) quarter-end
Earning mgmt EPS (Net
Income) 1yr
A dummy variable that equals to one if EPS in the most
recent fiscal year before the meeting was between 0 and 0.1
(NI between 0 and $20 million) .
Earning mgmt EPS (Net
Income) 5yr
The fraction of years where the EPS was between 0 and 0.1
(NI between 0 and $ 20 million) in the most recent past five
years before the meeting.

3
ES score Equal-weighted average of company’s net strength (strengths
minus concerns) across ES-related KLD categories. To be
consistent with our definition of ES proposals, we use the
KLD categories of “product”, “community”, “employee
relation”, “environment”, and “human rights”. Available
annually and through 2014
Proposal Categorizations We use the variable ItemDesc made available by ISS to
categorize all ES proposals as Disclosure, Action, or Other.
Proposals are categorized as Disclosure if ItemDesc includes
one of the following words: “Report”, “Disclose, “Provide
information”, “Publish”.
Proposals are categorized as Action if ItemDesc includes one
of the following words: “Add”, “Adjust”, “Adopt”, “Apply”,
“Commit”, “Develop”, “Endorse”, “Formulate”,
“Implement”, “Include”, “Increase”, “Institute”, “Identify”,
“Inform” , “Institute”, “Invest”, “Label”, “Link” ,
“Minimize” , “Phase in”, “Place”, “Purchase”, “Reduce”,
“Reformulate”, “Cease”, “Discontinue”, “Divest”,
“Exclude”, “Eliminate”, “End”, “Prohibit”, “Remove”,
“Amend” Improve” .
The Other category includes proposal types that are rare, for
example proposals related to board oversight (“Establish
Committee” “Board Oversight”, Require Director Nominee)
or proposals aiming to influence suppliers (“Suppliers to
Adopt”, “Suppliers to Disclose”).

4
Figure 1. Number of ES and non-ES proposals over time
The sample includes all firms with one or more shareholder proposals, over the 2004 – 2016 period.
For each year, we tabulate the total number of ES proposals and the total number of non-ES shareholder
proposals.
135 127 134 143161
139 133 12399 99
117139
124
493
381
461 470
427
463 469
335
396412 414
465
396
0
100
200
300
400
500
600
2004 2005 2006 2007 2008 2009 2010 2011 2012 2013 2014 2015 2016
ES proposals Non-ES shareholder proposals

5
Figure 2. Distribution of fund votes and ISS recommendations on ES proposals over time
The sample includes all firms with one or more ES shareholder proposals, over the 2004 – 2016 period.
In Panel A, for each year, the solid line shows the percent of proposals on which ISS recommends
support for the proposal. The dashed line shows the average percent of mutual funds that vote in favor
of each proposal. Panel B categorizes all mutual fund votes on ES proposals each year into one of four
categories: both ISS and the funds support (orange bars), both ISS and the fund are against (blue bars),
only ISS supports (gray bars), and only the fund supports (yellow bars). Each year, we tabulate the
percent of votes that fall into each category.
Panel A: Fund and ISS support rate over the sample period
Panel B: Distribution of fund votes, conditional on ISS recommendation
0%
10%
20%
30%
40%
50%
60%
70%
80%
90%
100%
2004 2005 2006 2007 2008 2009 2010 2011 2012 2013 2014 2015 2016
ISS For Fund For
0%
10%
20%
30%
40%
50%
60%
70%
80%
90%
100%
2004 2005 2006 2007 2008 2009 2010 2011 2012 2013 2014 2015 2016
Fund vote against, ISS recommend against Fund vote for, ISS recommend for
Fund vote against, ISS recommend for Fund vote for, ISS recommend against
6
Figure 3. Summary statistics on proposal types
The sample includes all firms with one or more ES shareholder proposals, over the 2004 – 2016 period.
We classify ES proposals into 3 categories: Action, Disclosure, and Others. For this classification, we
use the variable ItemDesc made available by ISS. Disclosure ES proposals have one of the following
words in ItemDesc: “Report”, “Disclose, “Provide information”, “Publish”. Action ES proposals have
one of the following words in ItemDesc: “Add”, “Adjust”, “Adopt”, “Apply”, “Commit”, “Develop”,
“Endorse”, “Formulate”, “Implement”, “Include”, “Increase”, “Institute”, “Identify”, “Inform” ,
“Institute”, “Invest”, “Label”, “Link” , “Minimize” , “Phase in”, “Place”, “Purchase”, “Reduce”,
“Reformulate”, “Cease”, “Discontinue”, “Divest”, “Exclude”, “Eliminate”, “End”, “Prohibit”,
“Remove”, “Amend” Improve” . The third category include the type of proposals that are rare. These
include proposals related to board oversight (“Establish Committee” “Board Oversight”, Require
Director Nominee) or proposals aiming to influence suppliers (“Suppliers to Adopt”, “Suppliers to
Disclose”). Panel A shows the distribution of 3 proposal types in the full sample, Panel B reports this
information conditioned on sponsor type.
Panel A: Types of ES proposals
Panel B: Types of ES proposals, by sponsor
633
876
164
Action Disclosure Other
249
133
121
366
172
127
77
40
20
0 100 200 300 400 500 600 700 800
asset mgt co sps
other (union, NGO, Individual)
religious sps
Action
Disclosure
Others

7
Figure 4. Proposals by sponsor types
The sample in Panel A includes all firms with one or more ES shareholder proposals, over the 2004 –
2016 period, and it shows the percent that are sponsored by an asset management company, by a
religious sponsor, and by others (which includes individual, unions, and NGOs). Panel B includes both
ES (blue bars) and non-ES (orange bars) proposals over this period, and it shows the number of each
proposal type that are sponsored by asset management companies, by religious sponsors, and by others.
Finally, it tabulates the percent of all shareholder proposals (by each sponsor type) that relate to ES
issues.
Panel A: Distribution of ES Proposals, by sponsor type
Panel B: Distribution of ES and Other Shareholder Proposals, by sponsor type
53%
21%
26%
asset mgt co sps religious sps others (individuals, unions, NGOs)
23%
14%
61%
0 500 1000 1500 2000 2500 3000 3500
asset mgt co sps
other (union, NGO, Individual)
religious sps
ES proposals Non-ES shareholder proposals

8
Table 1. Descriptive Statistics
The sample includes firm-years over the 2004 – 2016 period. Panel A presents statistics at the firm-
year level. The first column includes 1,196 firm-years with one or more ES proposals. Column 2
includes 36,926 firm years in which there are no ES proposals, and column 3 shows the difference
between column 1 and column 2, with asterisks ***, **, and * denoting significance level of the
difference at the 1%, 5%, and 10% levels, respectively. Column 4 includes 2,775 firm years in which
there are one or more shareholder proposals, none of which pertain to ES issues, and column 5 shows
differences between columns 1 and 3, with asterisks similarly denoting significance levels. Variables
related to the number of proposals represent the total number of each proposal type at the annual
meeting. Past return and Amihud illiquidity are calculated in the 12 months preceding the meeting date.
Institutional ownership is as the quarter end before the meeting date. All other variables are calculated
in the fiscal year end before the meeting. The ES score is based on the more limited 2004 – 2014 sample
period, due to data availability. All variables are defined in the Appendix I. Panel B shows average
fund characteristics statistics at the proposal × mutual fund investor level. Column 1 includes 376,058
fund × proposal observations on ES proposals, and column 2 includes 1,160,536 fund × proposal
observations on non-ES shareholder proposals. Column 3 shows the difference between the columns.
Panel A: Firm level
All ES firms
#unique firms = 400
# firm-yrs =1,196
All Non-ES Firms
#unique firms = 5,138
# firm-yrs = 36,926
Non-ES firms with 1+ SH props
#unique firms = 1,044
# firm-yrs =2,775 Average Average Avg. Diff Average Avg. Diff
#proposals 13.41 7.42 5.99*** 11.18 2.23***
#Shr
proposals 2.64 0.11 2.54*** 1.56 1.09***
#ES
proposals 1.39 0 1.39*** 0 1.39***
MV
(Millions) 46,214.18 4,355.92 41,894.66*** 21,541.51 24,672.67***
M/B 3.22 2.90 0.32*** 3.00 0.22
ROA 0.15 0.08 0.06*** 0.11 0.03***
Dividend
yield 0.02 0.01 0.01*** 0.02 0.00
Cash 0.11 0.18 -0.07*** 0.12 -0.01**
Sales
growth 0.06 0.15 -0.09*** 0.07 -0.02*
Past firm
return 0.13 0.13 -0.00 0.13 0.01
Amihuld
illiquidity 0.02 0.09 -0.08*** 0.03 -0.02***
Inst
ownership 0.70 0.58 0.11*** 0.70 -0.01
ES Score -0.7 -0.1 -0.6*** 0.0 -0.7***

9
Panel B. Proposal × Mutual Fund Investor level
All ES Proposals
(N=376,058)
All Non-ES Shareholder Proposals
(N=1,160,536) Average Average Avg. Diff
Fund characteristics
Turnover 0.70 0.72 -0.02***
FPS 0.97 1.14 -0.16***
Index fund 0.34 0.35 -0.02***
TNA (Billions) 5.22 5.38 -0.16***
Fund alpha 0.60% 0.63% -0.03%***
Fund-mgmt friendliness 3.4% 3.7% -0.3%***

10
Table 2. Support for failed ES proposals and subsequent downside tail returns
This table shows the relation between failed shareholder proposals and subsequent downside tail risk.
The dependent variable, Downside Tail Risk, equals the firm’s 12-month average 4-factor alpha in
year t if alpha is below the 25th percentile of the sample; it equals zero otherwise. ES Proposal is a
dummy variable that equals 1 if the firm has at least one failed ES proposal from t-1 to t-2. Non-ES
Proposal is a dummy variable that equals 1 if the firm has at least one failed non-ES proposal from t-1
to t-2. Support for ES equals the average support rate in firm’s failed ES proposals from t-1 to t-2.
Similarly, Support for non-ES equals the average support rate in firm’s failed non-ES proposals from t-
1 to t-2. From column (2) to (4), we use average mutual fund support, ISS support and overall
shareholder support, respectively. Baseline category includes firm x month observations with no failed
shareholder proposals (either ES or non-ES), which includes both firm-years with no shareholder
proposals and firm-years in which all shareholder proposals passed. Regressions are OLS, with standard
errors clustered at the fund level. Regressions include firm and year fixed effects. Control variables are
lagged dependent variable and several firm characteristics, which are defined in Appendix I. Constant
terms are not reported. T-statistics are shown in parentheses, and ***, **, and * denote significance at
the 1%, 5%, and 10% levels, respectively.
Dependent Variable: Downside Tail Risk
Fund
Support
ISS
Support
Overall
Support
(1) (2) (3) (4)
ES Proposal 0.001 0.018 0.016 0.013
[0.105] [1.536] [1.437] [1.127]
Non-ES Proposal -0.016*** -0.019* -0.019* -0.014*
[-3.090] [-1.949] [-1.867] [-1.894]
ES Proposal Support for ES -0.101** -0.032** -0.097
[-2.137] [-2.144] [-1.571]
Non-Es Proposal Support 0.004 0.003 -0.007
for Non-ES [0.306] [0.314] [-0.458]
Cash 0.048** 0.049** 0.049** 0.048**
[2.067] [2.076] [2.083] [2.055]
Growth -0.004 -0.004 -0.004 -0.004
[-0.529] [-0.529] [-0.529] [-0.540]
M/B 0.001 0.001 0.001 0.001
[1.098] [1.105] [1.109] [1.097]
ROA -0.019 -0.019 -0.019 -0.019
[-0.667] [-0.677] [-0.687] [-0.683]
Dividend yield -0.353*** -0.352*** -0.353*** -0.353***
[-3.476] [-3.464] [-3.470] [-3.468]
Log MV 0.122*** 0.122*** 0.122*** 0.122***
[29.744] [29.750] [29.744] [29.763]
Lagged dep variable -0.495*** -0.495*** -0.495*** -0.495***
[-47.222] [-47.210] [-47.215] [-47.208]
Amihud Illiquidity 0.315*** 0.315*** 0.315*** 0.315***
[9.998] [9.996] [9.997] [10.000]
Inst ownership -0.030** -0.030** -0.030** -0.030**
[-2.558] [-2.571] [-2.571] [-2.571]
IVOL -0.784*** -0.782*** -0.782*** -0.783***
[-10.837] [-10.795] [-10.804] [-10.824]
Observations 26,884 26,884 26,884 26,884
R-squared 0.361 0.361 0.361 0.361
Year FE x x x x
Firm FE x x x x
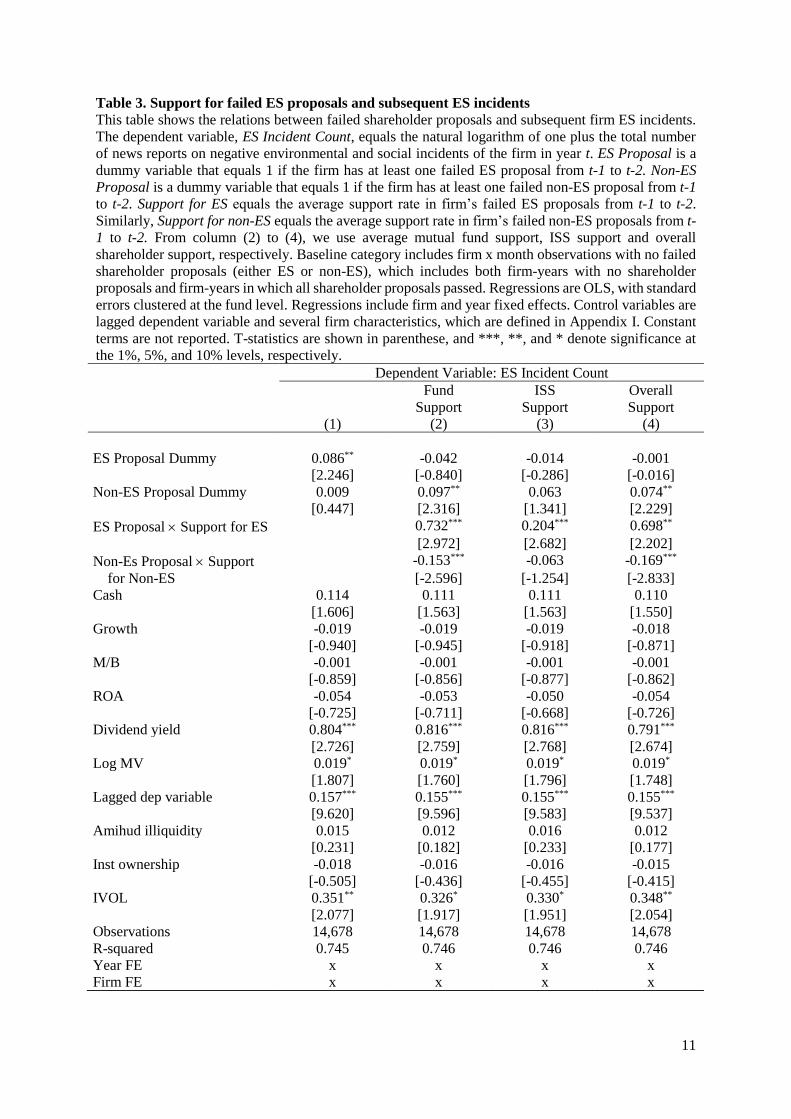
11
Table 3. Support for failed ES proposals and subsequent ES incidents
This table shows the relations between failed shareholder proposals and subsequent firm ES incidents.
The dependent variable, ES Incident Count, equals the natural logarithm of one plus the total number
of news reports on negative environmental and social incidents of the firm in year t. ES Proposal is a
dummy variable that equals 1 if the firm has at least one failed ES proposal from t-1 to t-2. Non-ES
Proposal is a dummy variable that equals 1 if the firm has at least one failed non-ES proposal from t-1
to t-2. Support for ES equals the average support rate in firm’s failed ES proposals from t-1 to t-2.
Similarly, Support for non-ES equals the average support rate in firm’s failed non-ES proposals from t-
1 to t-2. From column (2) to (4), we use average mutual fund support, ISS support and overall
shareholder support, respectively. Baseline category includes firm x month observations with no failed
shareholder proposals (either ES or non-ES), which includes both firm-years with no shareholder
proposals and firm-years in which all shareholder proposals passed. Regressions are OLS, with standard
errors clustered at the fund level. Regressions include firm and year fixed effects. Control variables are
lagged dependent variable and several firm characteristics, which are defined in Appendix I. Constant
terms are not reported. T-statistics are shown in parenthese, and ***, **, and * denote significance at
the 1%, 5%, and 10% levels, respectively.
Dependent Variable: ES Incident Count
Fund
Support
ISS
Support
Overall
Support
(1) (2) (3) (4)
ES Proposal Dummy 0.086** -0.042 -0.014 -0.001
[2.246] [-0.840] [-0.286] [-0.016]
Non-ES Proposal Dummy 0.009 0.097** 0.063 0.074**
[0.447] [2.316] [1.341] [2.229]
ES Proposal Support for ES 0.732*** 0.204*** 0.698**
[2.972] [2.682] [2.202]
Non-Es Proposal Support -0.153*** -0.063 -0.169***
for Non-ES [-2.596] [-1.254] [-2.833]
Cash 0.114 0.111 0.111 0.110
[1.606] [1.563] [1.563] [1.550]
Growth -0.019 -0.019 -0.019 -0.018
[-0.940] [-0.945] [-0.918] [-0.871]
M/B -0.001 -0.001 -0.001 -0.001
[-0.859] [-0.856] [-0.877] [-0.862]
ROA -0.054 -0.053 -0.050 -0.054
[-0.725] [-0.711] [-0.668] [-0.726]
Dividend yield 0.804*** 0.816*** 0.816*** 0.791***
[2.726] [2.759] [2.768] [2.674]
Log MV 0.019* 0.019* 0.019* 0.019*
[1.807] [1.760] [1.796] [1.748]
Lagged dep variable 0.157*** 0.155*** 0.155*** 0.155***
[9.620] [9.596] [9.583] [9.537]
Amihud illiquidity 0.015 0.012 0.016 0.012
[0.231] [0.182] [0.233] [0.177]
Inst ownership -0.018 -0.016 -0.016 -0.015
[-0.505] [-0.436] [-0.455] [-0.415]
IVOL 0.351** 0.326* 0.330* 0.348**
[2.077] [1.917] [1.951] [2.054]
Observations 14,678 14,678 14,678 14,678
R-squared 0.745 0.746 0.746 0.746
Year FE x x x x
Firm FE x x x x

12
Table 4. Support for failed ES proposals and subsequent upside tail returns
This table shows the relations between failed shareholder proposals and subsequent firm tail risk. The
dependent variable, Upside Tail Return, equals the firm’s 12-month average 4-factor alpha in year t
if alpha is below the 75th percentile of the sample; it equals zero otherwise. ES Proposal is a dummy
variable that equals 1 if the firm has at least one failed ES proposal from t-1 to t-2. Non-ES Proposal is
a dummy variable that equals 1 if the firm has at least one failed non-ES proposal from t-1 to t-2.
Support for ES equals the average support rate in firm’s failed ES proposals from t-1 to t-2. Similarly,
Support for non-ES equals the average support rate in firm’s failed non-ES proposals from t-1 to t-2.
From column 2 to 4, we use average mutual fund support, ISS support and overall shareholder support,
respectively. Baseline category includes firm x month observations with no failed shareholder proposals
(either ES or non-ES), which includes both firm-years with no shareholder proposals and firm-years in
which all shareholder proposals passed. Regressions are OLS, with standard errors clustered at the fund
level. Regressions include firm and year fixed effects. Control variables are lagged dependent variable
and several firm characteristics, which are defined in Appendix I. Constant terms are not reported. T-
statistics are shown in parenthese, and ***, **, and * denote significance at the 1%, 5%, and 10% levels,
respectively.
Dependent Variable: Upside Tail Return
Fund
Support
ISS
Support
Overall
Support
(1) (2) (3) (4)
ES Proposal Dummy 0.003 -0.007 -0.002 0.005
[0.139] [-0.309] [-0.084] [0.239]
Non-ES Proposal Dummy 0.008 -0.008 -0.000 0.008
[0.785] [-0.424] [-0.007] [0.489]
ES Proposal Support for ES 0.062 0.010 -0.021
[0.573] [0.300] [-0.195]
Non-Es Proposal Support 0.027 0.010 0.002
for Non-ES [0.996] [0.476] [0.054]
Cash 0.201*** 0.201*** 0.201*** 0.201***
[3.905] [3.910] [3.903] [3.906]
Growth -0.009 -0.009 -0.009 -0.009
[-0.517] [-0.510] [-0.516] [-0.518]
M/B 0.004*** 0.004*** 0.004*** 0.004***
[2.867] [2.865] [2.866] [2.867]
ROA -0.148** -0.148** -0.148** -0.148**
[-2.341] [-2.335] [-2.338] [-2.341]
Dividend yield -1.529*** -1.533*** -1.530*** -1.529***
[-8.380] [-8.398] [-8.386] [-8.380]
Log MV 0.130*** 0.130*** 0.130*** 0.130***
[14.601] [14.600] [14.602] [14.597]
Lagged dep variable -0.403*** -0.403*** -0.403*** -0.403***
[-45.117] [-45.113] [-45.123] [-45.112]
Amihud illiquidity 1.224*** 1.225*** 1.225*** 1.224***
[13.255] [13.256] [13.257] [13.254]
Inst ownership -0.190*** -0.190*** -0.190*** -0.190***
[-8.013] [-8.013] [-8.013] [-8.013]
IVOL 0.987*** 0.984*** 0.986*** 0.987***
[5.986] [5.968] [5.979] [5.987]
Observations 26,884 26,884 26,884 26,884
R-squared 0.275 0.275 0.275 0.275
Year FE x x x x
Firm FE x x x x

13
Table 5. Mutual funds’ blanket against votes
This table presents the summary statistics on mutual funds’ “blanket against votes” – votes against all
ES (or non-ES) proposals among the subset on which they voted during the respective period. The
sample consists of mutual funds’ votes on shareholder proposals in annual and special meetings, over
the 2004 – 2016 period. Panel A reports the frequency of blanket against votes for fund families; Panel
B reports frequency of blanket against votes for funds of families which do not vote as a bloc. In each
panel, the left-hand side consists of families (or funds) that voted on 30 or more ES proposals (column
1-2) or non-ES proposals (column 3-4), with the top of the table focusing on the earlier 2004 – 2009
period and the subsequent rows on the later 2010 – 2016 period. The right-hand side of the table is
analogous, with the exception that each sample is broadened to funds that voted on three or more
proposals during the respective period. Panel C is based on the subsample of mutual funds that vote on
30 or more ES proposals, and it compares the characteristics of the mutual funds that vote against all
the ES proposals (the “Blanket-Against” sample) to all other funds (the “Non-Blanket Against” Funds).
Columns 3 and 4 show differences between these samples and associated t-statistics for the significance
levels of these differences. Asterisks ***, **, and * denoting significance level of the difference at the
1%, 5%, and 10% levels, respectively. Variables are defined in Appendix I.
Panel A. Blanket votes at the family level
Families that voted on 30+
proposals
Families that voted on
3+ proposals
ES Non ES ES Non ES
Early subsample: 2004 –
2009
15.42% 1.95% 22.55% 3.55%
33 of 214
families
5 out of 256
families
62 out of 275
families
10 out of 282
families
Late subsample: 2010 –
2016
7.94% 2.31% 13.75% 3.58%
17 of 214
families
6 out of 260
families
37 out of 269
families
10 out of 279
families
Panel B. Blanket votes at the fund level (for funds of families which do not vote as a bloc)
Funds that voted on 30+
proposals
Funds that voted on
3+ proposals
ES Non ES ES Non ES
Early subsample: 2004 –
2009
24.38% 0.33% 33.21% 1.16%
326 of 1337
funds
7 out of 2129
funds
804 out of
2421 funds
35 out of
3028 funds
Late subsample: 2010 –
2016
19.62% 1.55% 29.82% 2.77%
266 out of
1356 funds
34 out of
2189 funds
715 out of
2398 funds
81 out of
2927 funds

14
Panel C: Descriptive Statistics on Blanket-Against Funds versus Non-Blanket-Against Funds (for
funds of families which do not vote as a bloc)
Blanket-Against
Funds
Non-Blanket-
Against
Funds
Average Average Avg. Diff T-stats
TNA(Billions) 2.30 5.88 -3.58*** -30.63
Fund alpha 0.0057 0.0061 -0.0004*** -4.56
Turnover 0.76 0.68 0.08*** 15.99
FPS 1.07 0.97 0.10** 2.91
Index fund 0.23 0.36 -0.13*** -51.05
Fund-mgmt
friendliness 0.04 0.03 0.01*** 10.40

15
Table 6. Role of funds’ horizon
The sample consists of mutual funds’ votes in shareholder proposals related to ES issues, in annual and
special meetings over the 2004 – 2016 period. Regressions are OLS, with standard errors clustered at
the fund level. In each column, the dependent variable, Vote For, equals one if the mutual fund vote
for the proposal in the firm meeting, zero otherwise. FPS is the flow-performance sensitivity estimated
from 36 month rolling regressions where fund flows are regressed on average 4-factor alpha in the past
12 months. Turnover is the rolling average of fund’s past 12-month turnover ratio; turnover ratio is
defined as the minimum (of aggregated sales or aggregated purchases of securities) divided by fund’s
average past 12-month total net assets. All other explanatory variables are defined in Appendix I.
Constant terms are not reported. T-statistics are shown in parenthese, and ***, **, and * denote
significance at the 1%, 5%, and 10% levels, respectively.
Dependent variable: Vote For
(1) (2) (3) (4)
FPS -0.128*** -0.062**
[-2.912] [-2.097]
Turnover -0.008* -0.023***
[-1.693] [-5.042]
ES fund 0.330*** 0.321***
[2.877] [2.815]
ISS for 0.269*** 0.269*** 0.270*** 0.270***
[26.031] [25.706] [25.350] [25.104]
Fund alpha 0.808** -0.079 0.594** -0.090
[2.452] [-0.540] [1.998] [-0.648]
Log TNA -0.026*** -0.014*** -0.025*** -0.012***
[-14.810] [-2.900] [-12.900] [-3.066]
Cash -0.019 -0.018* -0.026** -0.022**
[-1.630] [-1.908] [-2.326] [-2.357]
Sales growth -0.014*** -0.016*** -0.017*** -0.018***
[-2.700] [-3.537] [-3.283] [-3.983]
M/B 0.001*** 0.000** 0.001*** 0.000***
[2.626] [2.405] [3.060] [2.601]
ROA 0.073*** 0.066*** 0.072*** 0.063***
[3.640] [4.019] [3.601] [3.881]
Dividend yield 0.021 0.016 0.022 0.042
[0.233] [0.207] [0.249] [0.567]
Log MV 0.007** 0.003 0.008** 0.003
[2.161] [1.091] [2.391] [1.282]
Past firm return 0.003 0.002 0.002 0.001
[0.962] [0.866] [0.814] [0.428]
Amihud illiquidity 0.831** 0.453 0.922** 0.437
[2.179] [1.508] [2.545] [1.544]
Inst ownership -0.000 -0.002 0.001 0.000
[-0.055] [-0.308] [0.113] [0.009]
Observations 298,515 298,307 309,867 309,671
R-squared 0.209 0.434 0.208 0.431
Firm FE × × × ×
Fund FE × ×
Sponsor Type FE × × × ×
Proposal Category FE × × × ×
Year FE × × × ×
%(Dep.var=1) 13.53% 13.53% 13.36% 13.36%

16
Table 7. Role of funds’ friendliness toward management
The sample consists of mutual funds’ votes in shareholder proposals related to ES issues, in annual and
special meetings over the 2004 – 2016 period. Regressions are OLS, with standard errors clustered at
the fund level. The dependent variable, Vote For, equals one if the mutual fund vote for the proposal
in the firm meeting, zero otherwise. Fund mgmt friendliness is the historical average of fraction (in %)
of management-sponsored proposals that fund supports when ISS recommends against until time t. In
column 1 (column 2), earnings management is defined as a dummy equal to one if EPS over the past
year was between 0 and 0.1 (NI over the past year was between 0 and $20 million), zero otherwise. In
columns 3 and 4, earnings management is defined over the past five years, as the percent of years in
which each of these measures, respectively, was within the defined band just above zero. All other
variables are defined in Appendix I. Constant terms are not reported. T-statistics are shown in
parentheses, and ***, **, and * denote significance at the 1%, 5%, and 10% levels.
Dependent variable: Vote For
Earning
Management:
EPS 1yr
Earning
Management:
NI 1yr
Earning
Management:
EPS 5yr
Earning
Management:
NI 5yr
(1) (2) (3) (4) (5)
Fund mgmt -0.310*** -0.268*** -0.265*** -0.267*** -0.266***
friendliness [-15.416] [-14.815] [-14.761] [-14.723] [-14.727]
Earnings mgmt × Fund -0.960*** -0.669*** -0.529 -0.618**
Mgmt. friendliness [-2.587] [-4.333] [-1.073] [-2.240]
Earnings mgmt -0.072*** -0.063*** -0.015 -0.076***
[-4.503] [-4.207] [-0.305] [-2.915]
ES fund 0.302** 0.361*** 0.361*** 0.361*** 0.361***
[2.324] [2.964] [2.964] [2.965] [2.964]
ISS for 0.254*** 0.253*** 0.253*** 0.253*** 0.253***
[20.661] [19.448] [19.460] [19.436] [19.441]
Fund alpha 1.113** 0.873** 0.874** 0.864** 0.872**
[2.512] [2.286] [2.289] [2.261] [2.283]
Log TNA -0.028*** -0.022*** -0.022*** -0.022*** -0.022***
[-12.625] [-11.677] [-11.678] [-11.674] [-11.667]
Cash -0.005 0.042** 0.042** 0.040** 0.041**
[-0.349] [2.385] [2.411] [2.303] [2.321]
Sales growth -0.035*** -0.024*** -0.023*** -0.024*** -0.024***
[-5.144] [-3.316] [-3.205] [-3.299] [-3.282]
M/B 0.000 -0.000 -0.000 -0.000 -0.000
[0.226] [-1.183] [-1.421] [-1.103] [-1.250]
ROA 0.098*** 0.174*** 0.179*** 0.160*** 0.170***
[3.933] [5.554] [5.620] [5.149] [5.372]
Dividend yield -0.173 -0.057 -0.050 -0.064 -0.073
[-1.416] [-0.443] [-0.388] [-0.500] [-0.569]
Log MV 0.004 0.009** 0.010** 0.010** 0.009**
[1.110] [2.044] [2.201] [2.171] [2.129]
Past firm return -0.002 -0.000 0.002 0.001 0.002
[-0.491] [-0.034] [0.565] [0.203] [0.467]
Amihud illiquidity 0.796* 1.274** 1.405*** 1.237** 1.431***
[1.681] [2.572] [2.814] [2.499] [2.874]
Inst ownership 0.007 -0.013 -0.010 -0.013 -0.011
[0.841] [-1.277] [-0.998] [-1.265] [-1.065]
Observations 194,845 146,443 146,443 146,443 146,443
R-squared 0.219 0.221 0.222 0.221 0.221
Firm FE × × × × ×
Year FE × × × × ×
Sponsor Type FE × × × × ×
Proposal Category FE × × × × ×
%(Dep.var=1) 13.72% 12.55% 12.55% 12.55% 12.55%

17
Table 8. Role of funds’ horizon, conditional on sponsor type and on ISS recommendation
The sample consists of mutual funds’ votes in shareholder proposals related to ES issues, in annual and special meetings over the 2004 – 2016 period.
Regressions are OLS, with standard errors clustered at the fund level. In each column, the dependent variable, Vote For, equals one if the mutual fund votes
for the proposal in the firm meeting, zero otherwise. Column 1 (Column 2) includes the subset of ES proposals sponsored by (not sponsored by) an asset
management company. Column 4 (Column 5) includes the subset of ES proposals for which ISS recommends for (against). Columns 3 and 6 include the full
sample. All regressions include controls previously used in Table 6 but are not tabulated. All varaibles are defined in Appendix I. Constant terms are not
reported. T-statistics are shown in parenthese, and ***, **, and * denote significance at the 1%, 5%, and 10% levels, respectively.
Dependent variable: Vote For
Asset mgmt co
sponsor
Non-asset mgmt
co sponsor All ES proposals ISS For ISS against All ES proposals
(1) (2) (3) (4) (5) (6)
FPS -0.175*** -0.099*** -0.100*** -0.336*** -0.009 -0.022
[-3.030] [-2.651] [-2.640] [-3.237] [-0.389] [-0.848]
Asset mgmt co. sponsor × FPS -0.071**
[-2.250]
ISS for × FPS -0.288***
[-2.679]
Asset mgmt co. sponsor 0.008***
[4.474]
ISS for 0.273*** 0.269*** 0.269*** 0.272***
[27.101] [24.167] [26.044] [25.877]
Observations 119,903 178,612 298,515 115,463 183,052 298,515
R-squared 0.197 0.209 0.209 0.096 0.078 0.210
Other controls × × × × × ×
Firm FE × × × × × ×
Year FE × × × × × ×
Proposal Category FE × × × × × ×
Sponsor Type FE × × ×
%(Dep.var=1) 18.00% 10.52% 13.53% 30.66% 2.71% 13.53%

18
Table 9. Role of funds’ friendliness toward management, conditional on sponsor type
The sample consists of mutual funds’ votes in shareholder proposals related to ES issues, in annual and special meetings over the 2004 – 2016 period. Regressions
are OLS, with standard errors clustered at the fund level. In each column, the dependent variable, Vote For, equals one if the mutual fund votes for the proposal in
the firm meeting, zero otherwise. Column 1 (Column 2) includes the subset of ES proposals sponsored by (not sponsored by) an asset management company.
Column 4 (Column 5) includes the subset of ES proposals for which ISS recommends for (against). Columns 3 and 6 include the full sample. All regressions include
controls previously used in Table 7, but are not tabulated. All variables are defined in Appendix I. Constant terms are not reported. T-statistics are shown in
parentheses, and ***, **, and * denote significance at the 1, 5, and 10% levels, respectively.
Dependent variable: Vote For
Asset mgmt co.
sponsor
Non Asset mgmt
co. sponsor All ES proposals ISS For ISS against All ES proposals
(1) (2) (3) (4) (5) (6)
Fund mgmt friendliness -0.388*** -0.259*** -0.259*** -0.698*** -0.011 -0.029***
[-13.661] [-13.420] [-13.759] [-15.504] [-1.274] [-2.608]
Asset mgmt co sponsor × -0.105***
Fund mgmt friendliness [-4.763]
ISS for × -0.672***
Fund mgmt friendliness [-14.504]
Asset mgmt co sponsor 0.010***
[4.408]
ISS for 0.260*** 0.256*** 0.254*** 0.277***
[21.574] [19.148] [20.661] [21.313]
Observations 81,908 112,937 194,845 81,251 113,594 194,845
R-squared 0.213 0.215 0.219 0.135 0.094 0.226
Other controls × × × × × ×
Firm FE × × × × × ×
Year FE × × × × × ×
Sponsor Type FE × × ×
Proposal Cateogry FE × × × × × ×
%(Dep.var=1) 18.00% 10.61% 13.72% 29.51% 2.42% 13.72%

19
Internet Appendix
Figure A1: Fund and ISS support rate over the sample period
The sample includes all firms with one or more ES shareholder proposals, over the 2004 – 2016 period. Each panel focuses on proposals by one sponsor type: asset
management companies, religious groups, and others (individuals, unions and NGOs). For each year, the solid line shows the percent of proposals on which ISS
recommends support for the proposal. The dashed line shows the average percent of mutual funds that vote in favor of each proposal. Bars show the number of ES
proposals by each sponsor type each year.
0
10
20
30
40
50
60
70
80
0%
20%
40%
60%
80%
100%
2004 2005 2006 2007 2008 2009 2010 2011 2012 2013 2014 2015 2016
Proposal with asset management companies
0
10
20
30
40
50
60
70
80
0%
20%
40%
60%
80%
100%
2004 2005 2006 2007 2008 2009 2010 2011 2012 2013 2014 2015 2016
Proposals with religious group sponsors
0
10
20
30
40
50
60
70
80
0%
20%
40%
60%
80%
100%
2004 2005 2006 2007 2008 2009 2010 2011 2012 2013 2014 2015 2016
Proposals with other sponsors (individuals, unions, NGOs)
ISS For Fund For

20
Table A1. ISS average support for ES proposals
This table shows each ES shareholder proposal category, within the ISS database, along with the number
of shareholder proposals in the category over the 2004 – 2016 period. Column 3 shows the percent of
proposals within the category that ISS supported.
ISS item
code # proposals
ISS support
rate Item name
S0205 9 0 Establish Other Governance Board Committee
S0352 1 0 Company Specific-Governance Related
S0411 29 0 MacBride Principles
S0416 1 0 Human Rights-Related [country] (INACTIVE)
S0425 13 0 China Principles (INACTIVE)
S0704 5 0 Tobacco - Related - Prepare Report
S0708 3 0 Toxic Emissions
S0711 1 0 Nuclear Safety (INACTIVE)
S0725 26 0 Weapons - Related
S0727 19 0 Review Foreign Military Sales
S0728 1 0 CERES Principles (INACTIVE)
S0732 1 0 Sever Links with Tobacco Industry
S0733 7 0 Reduce Tobacco Harm to Health
S0734 14 0 Review Tobacco Marketing
S0735 36 0 Health Care - Related
S0736 55 0 Genetically Modified Organisms (GMO)
S0745 1 0 Climate Change Action
S0815 2 0 Labor Issues - Discrimination and Miscellaneous
S0891 23 0 Animal Testing
S0892 19 0 Animal Slaughter Methods
S0911 40 0 Anti-Social Proposal
S0703 23 0.043 Tobacco - Related - Miscellaneous
S0709 23 0.043 Nuclear Power - Related
S0206 21 0.048 Establish Environmental/Social Issue Board Committee
S0510 37 0.108 Link Executive Pay to Social Criteria
S0890 43 0.116 Animal Welfare
S0729 16 0.125 Review Drug Pricing or Distribution
S0999 169 0.166 Social Proposal
S0740 20 0.200 Environmental - Related Miscellaneous (INACTIVE)
S0730 31 0.258 Report on Environmental Policies
S0415 9 0.333
Vendor Standards (For Reporting Purposes Only)
(INACTIVE)
S0814 9 0.333 Glass Ceiling (INACTIVE)
S0414 149 0.342 Improve Human Rights Standards or Policies
S0778 8 0.375 Wood Procurement
S0741 5 0.400 Operations in Protected Areas
S0710 12 0.417 Facility Safety
S0602 14 0.429 Fair Lending

21
S0779 31 0.452 Renewable Energy
S0417 17 0.471
Workplace Code of Conduct (For Reporting Purposes
Only) (INACTIVE)
S0423 14 0.500 Operations in High Risk Countries
S0737 2 0.500 Toxic Substances (INACTIVE)
S0780 6 0.500 Energy Efficiency
S0781 28 0.500 Recycling
S0742 102 0.559 Climate Change
S0427 23 0.565 Data Security, Privacy, and Internet Issues
S0738 21 0.571 Product Safety
S0731 76 0.632 Community- Environmental Impact
S0224 20 0.700
Require Environmental/Social Issue Qualifications for
Director Nominees
S0817 4 0.750 Gender Pay Gap
S0812 32 0.781 Report on EEO
S0811 98 0.786 Adopt Sexual Orientation Anti-bias Policy
S0743 125 0.824 GHG Emissions
S0777 149 0.852 Report on Sustainability
S0412 14 0.857 Human Rights Risk Assessment
S0744 16 1 Hydraulic Fracturing

22
Table A2. Top 5 Sponsors from each sponsor type
This table shows the most common sponsors of ES shareholder proposals over the 2004 – 2016 period,
within each of the three categories of sponsors: asset management companies, religious groups, and
other, where other includes NGOs, unions, and individuals.
Name
# ES proposals from
2004 to 2016
Asset management companies
New York City Pension Funds 150
Harrington Investments 48
Calvert Investments 48
Trillium Asset Management 45
Walden Asset Management 44
Religious groups
Mercy Investment Program 23
Province of St. Joseph of the Capuchin Order 23
Unitarian Universalist Association of Congregations 17
Mercy Investment Program 17
Sisters of St. Dominic of Caldwell 15
Other (NGO, Union, individuals)
People for the Ethical Treatment of Animals (PETA) 76
You Sow 55
The Humane Society of the United States 20
Trinity Health (a not-for-profit catholic health care system) 16
Jing Zhao 10
The National Center for Public Policy Research 10

23
Table A3. Descriptions of ES proposal by sponsor type
This table shows the five most common proposal types, within the sample of ES shareholder proposals over
the 2004 – 2016 period. The top of the table includes the full sample, and lower panels limit the sample to
ES proposals sponsored by each of the three categories of sponsors: asset management companies, religious
groups, and other, where other includes NGOs, unions, and individuals.
ISS category
code ISS category description
# ES proposals from 2004 to
2016
Full sample
S0999 Social Proposal 169
S0414 Improve Human Rights Standards or Policies 149
S0777 Report on Sustainability 149
S0743 GHG Emissions 125
S0742 Climate Change 102
S0811 Adopt Sexual Orientation Anti-bias Policy 98
Proposals sponsored by asset management companies
S0777 Report on Sustainability 106
S0743 GHG Emissions 72
S0811 Adopt Sexual Orientation Anti-bias Policy 71
S0414 Improve Human Rights Standards or Policies 63
S0999 Social Proposal 40
Proposals sponsored by religious groups
S0414 Improve Human Rights Standards or Policies 36
S0743 GHG Emissions 28
S0736 Genetically Modified Organisms (GMO) 23
S0725 Weapons - Related 21
S0999 Social Proposal 18
Proposals sponsored by others (individuals, unions, NGOs)
S0999 Social Proposal 56
S0890 Animal Welfare 37
S0742 Climate Change 25
S0891 Animal Testing 22
S0414 Improve Human Rights Standards or Policies 20

24
Table A4. Robustness tests comparing Abstain versus Against votes
This table presents the results of the analysis which compares the differences of results with Abstain versus
Against votes. The sample consists of mutual funds’ votes in shareholder proposals related to ES issues, in
annual and special meetings over the 2004 – 2016 period. Panel A shows the frequency of Abstain votes in
ES proposals over time. Panel B presents the results of the regression analysis using a subsample of mutual
fund votes with Abstain and Against only. In each column, the dependent variable equals 1 if the fund votes
abstain and it is set to zero if the fund votes against the proposal. Regressions are OLS, with standard errors
clustered at the fund level. All variables are defined in Appendix 1. Constant terms are not reported. T-
statistics are shown in parenthese, and ***, **, and * denote significance at the 1%, 5%, and 10% levels,
respectively.
Panel A. Abstain Votes over Time
Panel B. Fund Votes Regressions, among subsample of observations where fund abstains or votes against
Dependent Variable: Fund Abstains
(1) (2) (3) (4) (5) (6)
FPS 0.099 0.031 0.037
[1.102] [0.758] [0.771]
Fund mgmt friendliness 0.177*** 0.015 -0.015
[4.528] [1.519] [-1.038]
ISS for 0.060*** 0.025*** 0.035*** 0.061*** 0.024*** 0.031***
[12.916] [11.490] [11.067] [10.892] [8.839] [9.110]
Observations 258,167 257,653 258,163 168,117 167,785 168,112
R-squared 0.080 0.719 0.588 0.099 0.728 0.647
Other Controls × × × × × ×
Year FE × × × × × ×
Sponsor Type FE × × × × × ×
Firm FE × × × × × ×
Proposal Category FE × × × × × ×
Fund FE × ×
Fund Family FE × ×
0%
20%
40%
60%
80%
100%
2004 2005 2006 2007 2008 2009 2010 2011 2012 2013 2014 2015 2016
ISS For Fund For Fund abstain

25
Table A5. ISS support rate across proposals sponsored by different sponsor types
This table presents the results of the analysis which examines ISS support rate across proposals sponsored
by different type of shareholders. In each column, the dependent variable equals one if ISS supports the
proposal in the firm meeting, and it is zero otherwise. Asset mgmt sponsor is a dummy which equals 1 if
the proposal is sponsored by an asset management company; Religious group sponsor is a dummy which
equals 1 if the proposal is sponsored by a religious group. The baseline group is other sponsors (individuals,
unions, NGOs). The sample consists of mutual funds’ votes in shareholder proposals related to ES issues,
in annual and special meetings over the 2004 – 2016 period. Regressions are OLS, with standard errors
clustered at the fund level. All variables are defined in Appendix I. Constant terms are not reported. T-
statistics are shown in parenthese, and ***, **, and * denote significance at the 1%, 5%, and 10% levels,
respectively.
Dependent variable: ISS For
(1) (2)
Asset mgmt sponsor 0.354*** 0.188***
[9.021] [3.825]
Religious group sponsor 0.107* 0.070
[1.955] [1.194]
Cash -0.329** 0.712***
[-2.053] [3.058]
Sales growth 0.024 0.150
[0.280] [1.574]
M/B -0.003 0.001
[-0.880] [0.323]
ROA -0.455** -0.262
[-2.085] [-0.964]
Dividend yield -0.218 0.336
[-0.206] [0.267]
Log MV -0.046** 0.037
[-2.423] [0.683]
Past firm return 0.011 -0.025
[0.257] [-0.577]
Amihud illiquidity -3.000*** -3.653*
[-2.676] [-1.810]
Inst ownership -0.056 0.041
[-0.560] [0.291]
Observations 1,213 1,075
R-squared 0.152 0.661
Firm FE ×
Year FE ×
Proposal Category FE ×

26
Table A6. Role of funds’ friendliness toward management (with fund FE)
This table shows the robustness of Table 7 results to including fund fixed effects in the empirical
specification. The dependent variable equals one if the mutual fund vote for the proposal in the firm
meeting, zero otherwise. In column 1 (column 2), earnings management is defined as a dummy equal to
one if EPS over the past year was between 0 and 0.1 (NI over the past year was between 0 and $20 million),
zero otherwise. In columns 3 and 4, earnings management is defined over the past five years, as the percent
of years in which each of these measures, respectively, was within the defined band just above zero. All
other variables are defined in Appendix I. Constant terms are not reported. T-statistics are shown in
parentheses, and ***, **, and * denote significance at the 1%, 5%, and 10% levels.
Dependent variable: fund votes for proposal
Earning
Management:
EPS 1yr
Earning
Management:
NI 1yr
Earning
Management:
EPS 5yr
Earning
Management:
NI 5yr
(1) (2) (3) (4) (5)
Fund mgmt -0.066*** -0.040*** -0.037*** -0.040*** -0.038***
friendliness [-7.338] [-4.204] [-3.932] [-4.264] [-4.079]
Earnings mgmt × Fund -0.878*** -0.668*** 0.275 -0.372*
Mgmt. friendliness [-3.065] [-5.810] [0.714] [-1.847]
Earnings mgmt -0.059*** -0.045*** -0.029 -0.020
[-4.177] [-3.103] [-0.844] [-0.765]
ISS for 0.255*** 0.255*** 0.255*** 0.254*** 0.254***
[20.643] [19.402] [19.408] [19.382] [19.390]
Fund alpha -0.083 0.063 0.065 0.053 0.057
[-0.511] [0.366] [0.377] [0.310] [0.331]
Log TNA -0.009* -0.012** -0.013** -0.012** -0.012**
[-1.924] [-2.159] [-2.173] [-2.160] [-2.161]
Cash -0.015 0.034** 0.034** 0.033** 0.032**
[-1.140] [2.280] [2.315] [2.208] [2.201]
Sales growth -0.028*** -0.010 -0.009 -0.010 -0.010
[-4.820] [-1.642] [-1.524] [-1.636] [-1.613]
M/B 0.000 -0.000 -0.000 -0.000 -0.000
[0.059] [-1.241] [-1.418] [-1.173] [-1.223]
ROA 0.060*** 0.156*** 0.158*** 0.144*** 0.147***
[3.069] [6.240] [6.215] [5.867] [5.847]
Dividend yield -0.058 -0.101 -0.098 -0.105 -0.113
[-0.584] [-0.890] [-0.865] [-0.932] [-1.002]
Log MV 0.002 -0.003 -0.002 -0.002 -0.002
[0.468] [-0.707] [-0.541] [-0.569] [-0.602]
Past firm return -0.000 0.001 0.002 0.001 0.002
[-0.075] [0.167] [0.719] [0.362] [0.532]
Amihud illiquidity 0.400 0.712* 0.821** 0.682* 0.753**
[1.131] [1.886] [2.168] [1.809] [1.981]
Inst ownership -0.003 -0.018** -0.016* -0.018** -0.017**
[-0.396] [-2.143] [-1.886] [-2.127] [-2.026]
Observations 194,515 146,138 146,138 146,138 146,138
R-squared 0.471 0.457 0.457 0.457 0.457
Firm FE × × × × ×
Year FE × × × × ×
Fund FE × × × × ×
Sponsor Type FE × × × × ×
Proposal Category FE × × × × ×
%(Dep.var=1) 13.72% 12.55% 12.55% 12.55% 12.55%