esca study of the solid residues of supercritical extraction of populus tremuloïdes in methanol
TRANSCRIPT

ESCA Study of the Solid Residues of Supercritical Extraction of Populus
Tremulo'ides in Methanol
A. AHMED, A. ADNOT, and S. KALIAGUINE, Department of Chemical Engineering and Gmupe ak Recherche sur les Applications
& la Physico-Chimie des Surfaces (GRAB), Uniuersiti L a d , Qudbec, Canada
Synopsis
A systematic ESCA study of the solid residues of supercritical critical extraction of Populus trem&%w prepared in various conditions has been performed. Reference materials also ex- amined by ESCA included the initial wood, Whatman no. 1 paper, and two lignins prepared by Merent procedure^ Intereet has been focused on the C, and 0, spectra and on the determina- tion of surface O/C atomic ratio. A difference between bulk O/C values measured by chemical analysis and surface O/C ratioe obtained from ESCA data is considered diagnostic of a difference in chemical composition of the bulk and the surface. In the C, peaks of wodd and its tonstitutive polymers, the uwtal components peaks C,, C2, and C3 were obsewed. For the solid residues, however, a fourth peak designated as Co appears, the importance of which increases steadily when the temperature of extraction is raised from 250 to 350°C. The component C, was ascribed to polyarornatic constituaats..Its proportion is correlated with the fraction of the carbon in the residue comprised in the recondensed material and determined independently. The 0, peak shows also a complex structure with three components in the wood-derived reference materials and four in some of the solid residues These structure3 have not .been discussed previously in the literature and a tentative assignment for the component peaks is proposed.
INTRODUCTION
In an earlier article,' we have reported a detailed characterization of solid residues produced by semicontinuous extraction of P0puZ.u~ tremuloiis wood in supercritical methanol.
The present paper reports the results of an ESCA study of some of the solid samples analyzed in the previous work, in an effort to assess the usefulness of the ESCA technique in recording the chemical changes in wood samples during pyrolysis.
ESCA is a surface-sensitive technique, based on the measurement of kinetic energies of photoelectrons ejected from a given atomic energy level under the action of a monoenergetic X-ray beam. It provides quantitative information on the elemental composition as well as on the chemical environment of each atom (bonding and oxidation state).
ESCA has been extensively used in the investigation of surface structure, bonding, and reactivity of solid materials such as polymers,2-4 wood fiber^,^.^ pulp and paper,'-l0, coal, 11-14 etc.
Jo~rnal of Applied Polymer Science, Vol. 34, 359-375 (1987) 0 1987 John Wiley & Sons, Inc. CCC 0021-8995/87/010359-17$04.00

360 AHMED, ADNOT, AND KALIAGUINE
EXPERIMENTAL
The ESCA spectrometer utilized was an ESCALAB MK I1 spectrometer fitted on a Microlab system from Vacuum Generators. I t was equipped with a dual Mg-Al anode X-ray source, nonmonochromatized. Kinetic energies were measured using an hemispherical electrostatic analyzer with 150 mm radius, working in the constant pass energy (20 eV) mode. No flood gun was utilized in the experiments reported, and the vacuum was maintained in the range 10-8-10-6 Tom.
The samples were introduced as small chunks or fibers pressed onto an indium disk.
Spectra were recorded at room temperature (except for the dibenzanthra- cene and o-biphenol samples which were cooled down to -100°C during analysis), using the Mg anode at 300 W with typical accumulation times of 1000-1200 s for the carbon 1s peak and 500-1000 s for the oxygen 1s peak.
The sample designated hereafter as Populus t r e m h i i s is the wood material utilized in the supercritical extraction experiments (SCE).15 The sapwood of a 20-year tree was cut into cubes of 4 mm size, dried in air at 105OC for 20 h, and kept in a humidity-free container.
The Whatman no. 1 paper filter was carefully taken from the middle of a freshly opened box.
The Iotech lignin sample was kindly provided by Dr. J. Bentko from Iotech Co. It is considered to be 85% pure lignin produced by enzymatic carbohydrate hydrolysis of thermally exploded wood.
The thiolignin sample was obtained by thioglycolic acid extraction of Populus tremulois. Its preparation is described in Ref. 1, where it is designated as thiolignin 2. Its dry mass was 16.5% of initial wood and C, H, 0, and S mass percents are 56.5, 6.1, 29.0, and 8.5%, respectively.
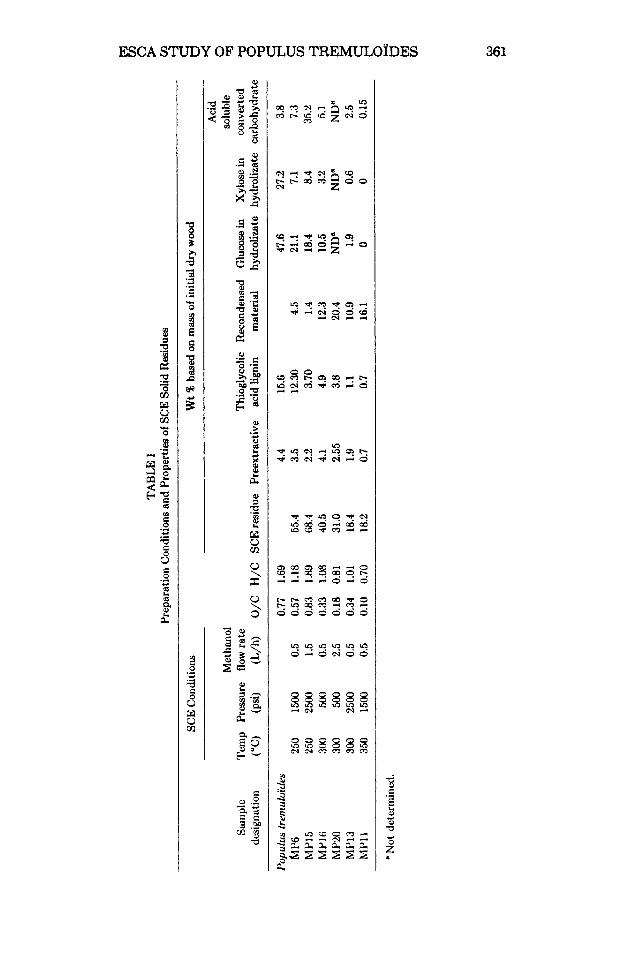
The samples of SCE solid residues are also described in detail in Ref. 1. Some of the most important parameters describing the preparation and properties of these samples are reported in Table I, along with the pawmeters for the properties of the Popullls tremubkks sample. The results in Table I indicate that the SCE solid residues under study are indeed of very different nature depending on the conditions of extraction. Sample MP6, for example, st i l l contains much of the original lignin whereas MP15, although extracted at the same temperature, shows a much higher delignification and a much higher fraction of hydrolizable material even though the glucose apd xylose recovered in the hydrohate are in comparable amounts. Sample M P l l prepared at 350°C is almost entirely constituted of recondensed material insoluble in 72% H,SO,. Samples Mp16,20, and 13 show intermediate properties.
RESULTS The kinetic energy of photoelectrons (Ek), as measured with respect to the
vacuum level, is expressed as
Ek = EX - (E, + 9 + 8,) (1)
where E x is the energy of the incident photon, E, is the binding energy of the electron on its original level, 9 is the work function of the spectrometer,
8
0
TA
BL
E I
k 3 8
Prep
arat
ion
Con
ditio
ns a
nd P
rope
rtie
s of
SCE
Sol
id R
esid
ues
SCE
Con
ditio
ns
Wt %
based o
n m
ass o
f in
itial
dry
woo
d
4
Aci
d M
etha
nol
solu
ble
Sam
ple
Ten
ip
Pres
sure
flo
w r
ate
Thi
ogly
colic
R
econ
dens
ed
Glu
cose
in
Xyl
ose
in
conv
erte
d de
signa
tion
("C
) (p
si)
(L/h
) O
/C
H/C
SC
E re
sidue
Pr
eext
ract
ive
acid
lign
in
mat
eria
l hy
drol
izat
e hy
drol
izat
e ca
rboh
ydra
te
Pop u
lus
trm
i ulo
iiles
0.
11
1.69
4.4
15
.6 41
.6 27
.2
3.8
hl P6
25
0 15
00
0.5
0.57
1.
18
55.4
3.
5 12
.30
4.5
21.1
1.
1 7.
3 M
P15
250
2500
1.5
0.
83
1.89
68
.4
2.2
3.10
1.4
18
.4 8.4
35
.2
MP1
6 30
0 500
0.5
0.33
1.
08
40.5
4.
1 4.9
12
.3
10.5
3.2
5.
1 M
P'LO
300
500
2.5
0.18
0.
81
31.0
2.
55
3.8
20.4
ND
" ND
" ND
" M
P13
300
2500
0.
5 0.
34
1.01
18
.4
1.9
1.1
10.9
1.9
0.6
2.5
MP
ll
350
1500
0.
5 0.
10
0.70
18
.2
0.7
0.1
16.1
0
0 0.
15
'Not
det
emiin
ed.
5 4 1 8: 8
362 AHMED, ADNOT, AND KALIAGUINE
and E, is the energy lost in counteracting the potential associated with the steady charging of the surface. $I and E, are essentially corrections. I$ depends on the spectrometer and is not liable to be modified between experiments. E, is high on low conductivity samples and can be made lower by the use of a flood gun.
Raw data are reported as uncorrected binding energies dehed as:
and the use of a known reference is neces58ly to obtain an absolute scale of binding energies.
The atomic ratio of two elements in the surface region analyzed by ESCA can be estimated from the ratio of their peak intensity. For example,
where the u ’s are the cross section for photoeledroas generation, the A’s are the mean free paths of photoelectrons which depend on their kinetic energy, the D’s are spectrometer 1 ‘om, and the 1 ’ s are the integrated intensity of ESCA peaks. Using &field‘s crm sections’6 for the 0, and C, peaks, the following relation can be derived from eq. (3):
’
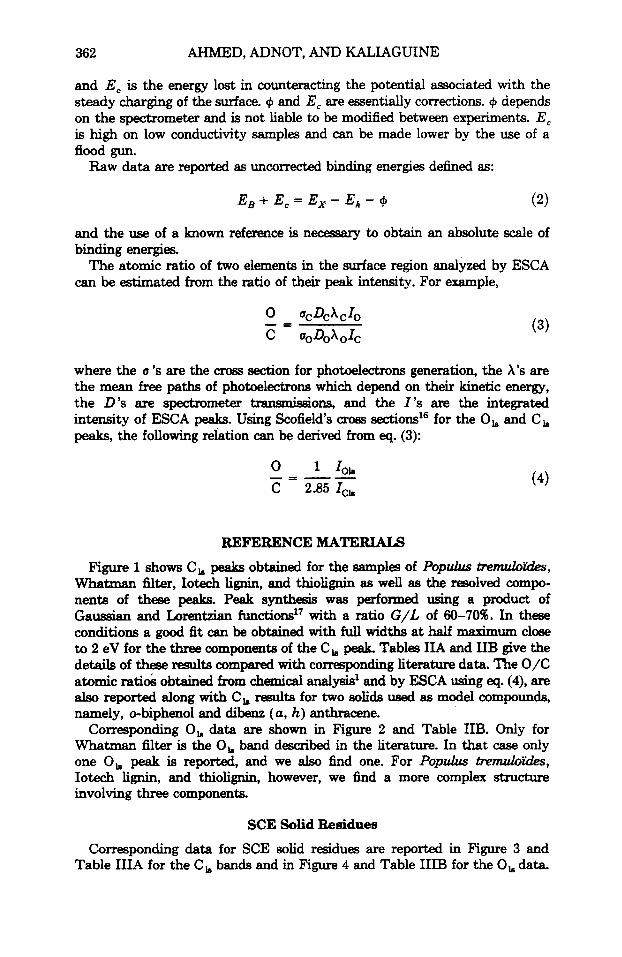
REFERENCEMATERIAIS Figure 1 shows C, peaks obtained for the samples of Populus t r e n u h i i ,
Whatman filter, Iotech lignin, and thiolignin as well as the resolved compo- nents of theae peaks. Peak synthesis was perfomed using a product of Gaussian and Lorentzian functions” with a ratio G/L of 60-70%. In these conditions a good fit can be obtained with full widths at half maximum close to 2 eV for the three components of the C, peak. Tables IIA and IIB give the details of these results compared with corresponding literature data. The O/C atomic ratiob obtained from chemical analysis1 and by ESCA using eq. (4), are also reported along with C , results for two solids UBed as model compounds, namely, 0-biphenol and dibenz (a, h) anthracene.
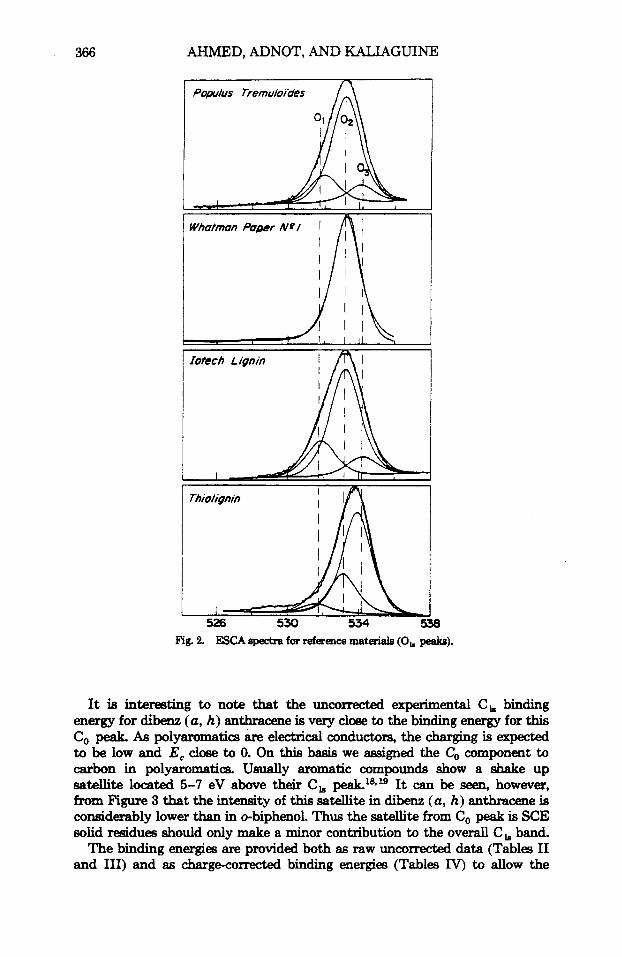
Corresponding 0, data are shown in Figure 2 and Table IIB. Only for WhatmRn filter is the 0, band described in the literature. In that case only one 0, peak is reported, and we also find one. For Populus tn?nuhiis, Iotech lignin, and thiolignin, however, we find a more complex structure involving three components.
SCE Solid Residues Corresponding data for SCE solid residues are reported in Figure 3 and
Table IIIA for the C, bands and in Figure 4 and Table IIIB for the Oh data.
ESCA STUDY OF POPULUS "REMULOIDES 363
The C, structure has to be fitted with four component peaks. The assign- ment of the three which correspond to the C,, C,, and C, components defined for wood materials wil l be discussed later on.
The 0, structure also contains a rich information with three to four different component peaks.
Referencing the Binding Energy Scale
Dorris and Grayg have suggested in the case of cellulose and bleached pulp and paper that the 0, peak of cellulose be used 85 a reference at 533.2 eV. This procedure is considered equivalent to the usual procedure of using the C ls peak of hydrocarbons at 285.0 eV. A s shown in Table EVA, we have followed
TA
BL
E I
IA
ESC
A A
naly
sis o
f R
efer
ence
Mat
eria
ls (C
, Pe
aks)
C,
ESC
A p
eaks
Unc
orre
cted
bin
ding
O
/C
Are
a (S)
ener
gy (e
V)
FWMH (e
V)
(che
mic
al,
O/C
Sa
mpl
e an
alys
is)
(ESC
A)
C,
C,
C,
C,
C2
c.3
C,
C,
C,
Ref
eren
ce
Popu
lus
trem
ulof
des
(une
xtra
cted
) Y
ello
w p
opla
r Pi
ne c
hips
(une
xtr.)
Wha
tman
no.
1
pape
r fil
ter
Wha
tman
filt
er
Wha
tman
filt
er
Wha
tman
filt
er
Wha
tman
unt
reat
ed
filte
r pap
er
Cel
lulo
se su
rfac
e
Iote
ch ti
gnin
Th
iotig
nin
Mill
ed w
ood
ligni
n Pr
ecip
itate
d lig
nin
Mill
ed w
ood
ligni
n D
ioxa
ne li
gnin
0- B
iphe
nol
Dib
enz (
a,
h)
an th
race
ne
0.77
0.2
4 72
22
6 0.
27
64
26
10
0.26
0.83
"
0.78
7
74
I9
0.62
18
66
26
0.46
0.
25
76 2
1 3
0.37
0.
38
48
48
4 0.
39
0.40
0.
34
40
60
0
0.36
b 0.3
1, 0.
36
49b4
8b 2
b
0.16
7'
0.15
7 96
4
100
287.
30
289.
10
291.
0 28
5.0
287.
0 28
9.5
288.
15 2
89.7
0 29
1.50
28
2.8
284.
2 -
286
281.
5 28
3.2
- 285
28
2.5
284.
6 - 2
86
285.
0 28
6.5
288.
3
207.
20 2
88.7
5 29
0.40
28
6.55
288
.05
290.
10
285.
0 28
6.8
-
285.
3 28
7.10
283.
75
1.95
2.
0 2.
0 T
his w
ork
2.1
2.3
2.2
5 6 "U
if= 2.0
1.
95
1.90
T
his w
ork
"4
9 9
2.2
2.1
2.1
Thi
swor
k k
2.1
2.1
2.1
Thi
swor
k h
6 2
6 2.3
2.8
-
5 9
1.90
1.
80
Thi
s work
1.50
T
his w
ork
'Cal
cula
ted
for c
ellu
lose
and
o-b
iphe
nol f
orm
ulas
bC
alcu
late
d fr
om th
e Fr
eude
nber
g tig
nin
form
ula
and
repo
rted
in R
ef. 9
.

ESCA STUDY OF POPULUS TREMULOIDES
TABLE IIB ESCA Analysis of Reference Materials (0, Peaks)
365
0, Peaks
Area 6) E B + E , (e\3 FWMH (eV) Sample 0, 0, O3 0, 4 O3 0, O2 O3 Reference
Pop& t r e & i s
Whatman no. 1
Whatman filter 100 530.7 - 9 Whatman filter 100 529.5 - 9 Whatman filter 100 530.9 - 9
5 Celidose surface 100 - - Iotech lignin 20 70 10 533.60 535.0 536.0 2.1 2.2 2.1 This work T h i O l i g n i n 4 24 72 532.50 534.10 534.90 2.05 2.0 2.0 Thiswork 0-Biphenol 14 86 532.25 533.80 2.0 1.95 This work
(unextracted) 17 74 9 533.90 535.15 536.05, 2.0 2.1 1.90 Thiswork
paper filter 100 536.0 195 This work
Dorris and Gray's suggestion for our Whatman paper sample, which would correspond to a value of E, of 2.8 eV. The values obtained for the binding energies of C,, C,, and C, components are in close agreement with those reported in the literature (see Table IIA).
Arbitrarily choosing the reference component designated as 0, in the 0, spectra of Poplrlus tremubiis, Iotech lignin, and thiolignin provides also close estimates of the three C, binding energies.
o-Biphenol as the following formula:
OH OH
Its ESCA spectrum shows two C, and two 0, components. If the dominant 0 Is peak corresponding to an OH on a benzene ring is considered equivalent to an OH in cellulose, then this peak would be referenced at 533.2 eV. In that case, however, the dominant C, peak, which is an aromatic carbon is assigned a rather low value at 284.7 eV. Readjusting the binding energy scale to the average C, value for the first four samples in Table IVA, namely, 285.45 eV, shifts back E, to 1.35 eV and the dominant 0, peak to 533.95 eV. This value is in close correspondance with the 0, component which leads us to assign the phenolic OH to the 0, peak. The presence of an 0, peak at 532.4 eV must then be ascribed to some unidentified surface impurity.
Table IVB shows the binding energies attributed to the various C , and 0 , in the spectra of SCE solid residues, by assigning an 0, component peak referenced at 533.2 eV.
In all cases a fourth C, component is found on the low binding energy side of the spectrum, shifted from the C, component by 1.4 f 0.5 eV. We desig- nated this as the C , component.
366 AHMED, ADNOT, AND KALIAGUINE
Popuhs TrerndoFdes
r
526 530 534 Fig. 2. ESCA spectra for reference materials (0, peaks).
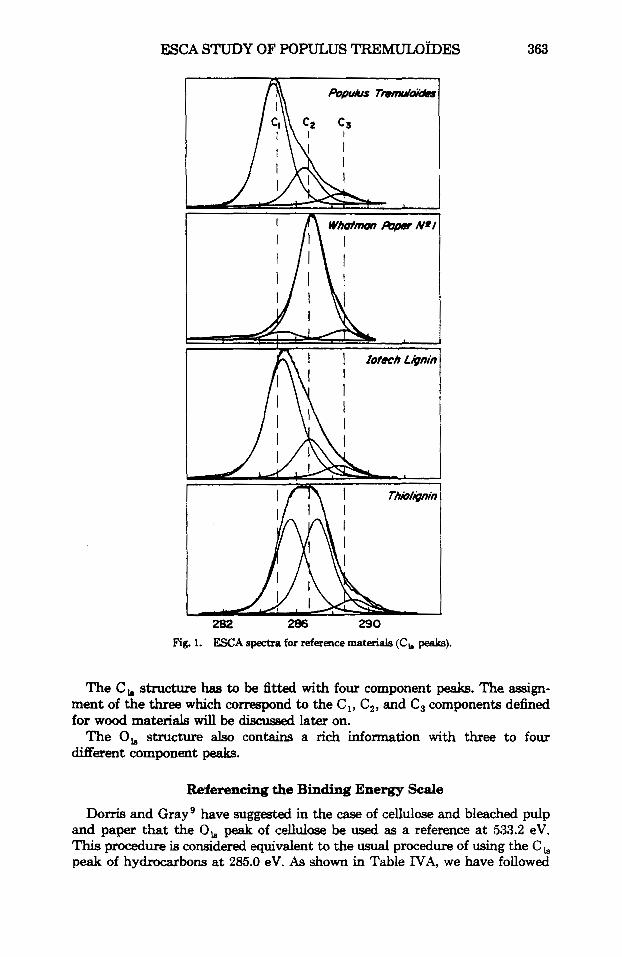
It is interesting to note that the m c o e experimental C, binding energy for dibenz (a, h) anthracene is very close to the binding energy for this C, peak. As polyaromatics are electrical conductors, the Charging is expeded to be low and E, clw to 0. On this basis we assigned the C, component to carbon in polymmatics. Usually aromatic compomds show a shake up satellite located 5-7 eV above their C1, peak.16*19 It can be seen, however, from Figure 3 that the intensity of this satellite in dibenz (a, h) anthracene is considerably lower than in 0-biphenol. Thus the satellite from C, peak is SCE solid residues should only make a minor contribution to the overall Ch band. The binding energies are provided both as raw uncorrected data (Tables I1
and 111) and as chargecorrected binding energies (Tables IV) to allow the

ESCA STUDY OF POPULUS TREMULOIDES
onthracene
I 280 284 288 292
367
Fig. 3. ESCA spectra for SCE solid residues (C, peaks).
reader to check the original referencing method proposed in this paper for this type of materials.
DISCUSSION
Carbon 1s Peaks
There is a general agreement in the l i t e r a t ~ e ~ - ' ~ on the assignment of components C,, C,, and C, in wood-derived materials. Following Siegbahn20 and co-workers, three carbon 1s lines must be distinguished: C, corresponds to carbon only linked to H or C, C, has one link to oxygen, whereas C, has two. In the solid phase C, is referenced at 285.0 eV, and C, and C, are usually close to 287 and 289.5 eV.
368 AHMED, ADNOT, AND KALIAGUINE
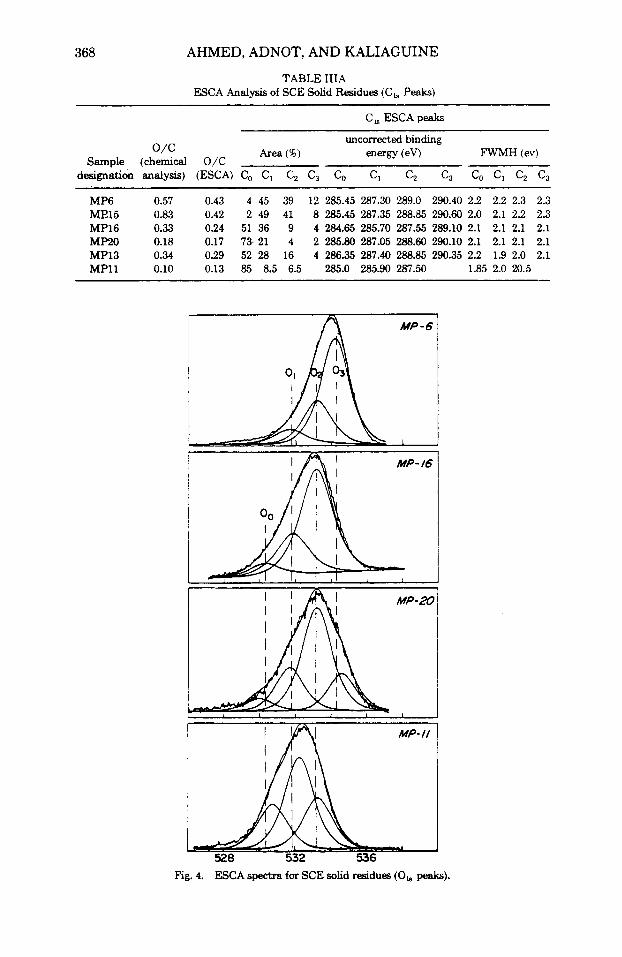
TABLE IIIA ESCA Analysis of SCE Solid Residue (C, Peaks)
uncorrected binding O/C Area (%) energy (eV) FWMH (ev)
Sample (chemical O/C designation analysis) (ESCA) Co C, C, C, Co C, C, C, Co C, C, C3
MP6 0.57 0.43 4 45 39 12 285.45 287.30 289.0 290.40 2.2 2.2 2.3 2.3 ME15 0.83 0.42 2 49 41 8 285.45 287.35 288.85 290.60 2.0 2.1 2.2 2.3 MP16 0.33 0.24 51 36 9 4 284.65 285.70 287.55 289.10 2.1 2.1 2.1 2.1 MP20 0.18 0.17 73. 21 4 2 285.80 287.05 288.60 290.10 2.1 2.1 2.1 2.1 MP13 0.34 0.29 52 28 16 4 286.35 287.40 288.85 290.35 2.2 1.9 2.0 2.1 MP11 0.10 0.13 85 8.5 6.5 285.0 285.90 287.50 1.85 2.0 20.5
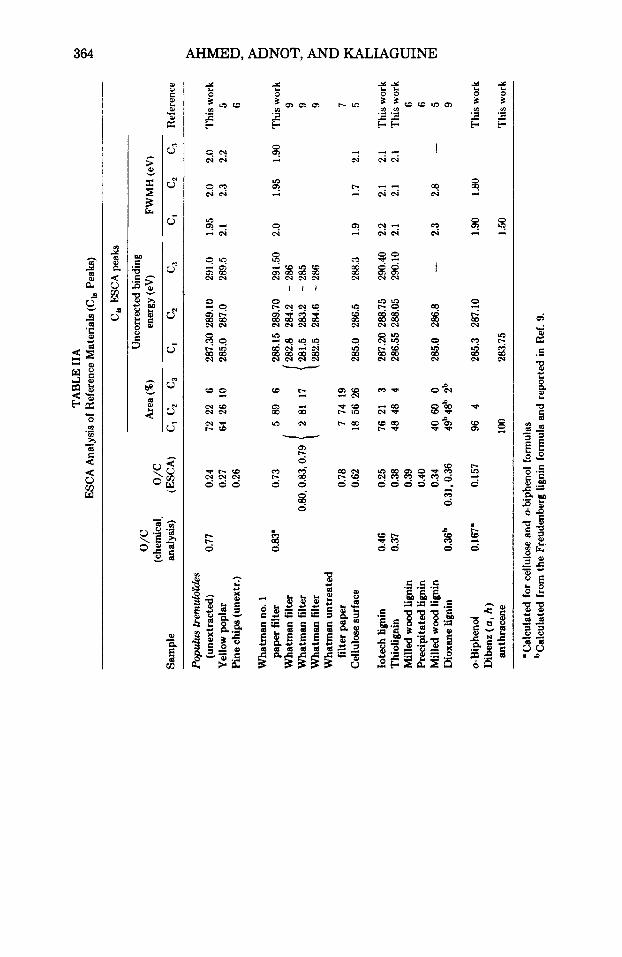
528 532 536 Fig. 4. ESCA spectra for SCE solid residues (0, peaks).

ESCA STUDY OF POPULUS TREMULOIDES
TABLE IIIB ESCA Analysis of SCE Solid Residues (0, Peaks)
369
Uncorrected binding Are3 (41) energy (eV) FwMH (eV) Sample
designation 0, 0, O2 0, Oo 0, 0, O3 0, O1 O2 O3
h4P6 6 25 69 53320 534.80 535.80 2 2 2.0 2.0 MP15 18 47 35 533.50 534.85 535.70 2.1 1.9 1 9 MP16 6 2 5 6 9 530.60 53225 533.60 2.1 2.3 2.3 MP20 5.5 21.5 56 17 531.20 533.0 534.55 536.00 1.90 2.1 2.0 2.0 MP13 8 3 4 5 8 ,532.40 53420 535.35 2.1 2.1 2.1 MPll 22 53 25 531.50 533.00 534.05 2.0 2.05 2.0
TABLE I V A Binding Energiea of CL and Oh Levels in Reference Materials
Binding energy (eV)
Sample Ec(eV) c, c2 c3 01 4 0 3
popurue Trenud&ia
Whatman no. 1
Iotech lignin 1.8 285.40 286235 288.60 531.80 5332 534.20 T h i O t i g n i n 0.90 285.65 287.15 289.20 531.60 533.2 534.0 0-Biphenol
(unextractd) 1.95 285.35 287.15 289.05 531.95 533.2 534.10
paper filter 223 285.35 286.90 288.70 - 5332 -
284.70 286.50 - 531.65 533.2 - 285.45 287.25 532.40 533.95
TABLE IVB Binding Energies of Cb and 0, Levels in SCE Solid Residues
Sample
MP6 MP15 MP16 MP20 MP13 MPll Dibenz (a, h)
anthracene
E C
(eV)
1.60 1.65 0.40 1.35 2:15 0.85
0
Binding energy (eV)
283.85 283.80 284.25 284.45 28420 284.15
283.75
Cl c2 c3 0 0
285.70 287.40 288.80 285.70 287.20 288.95 285.30 287.15 288.70 530.20 285.70 287.25 288.75 529.85 285.25 286.70 288.20 530.25 285.05 286.65 530.65
0, 0 2 0 3
531.60 533.2 534.20 531.85 533.2 534.05 531.85 533.2 531.65 533.2 534.65 532.05 533.2 532.15 533.2
The fact that the ESCA value of the O/C atomic ratio in PopuZus h.emulois is found much lower than the bulk value (see Table IIA) indicates a difference between the composition of the surface region sensed by ESCA and the one of the bulk.
Such a difference has been discussed by Mjoberg,' who considers that this indicates a preferential splitting in lignin-rich middle lamella21 during the
370 AHMED, ADNOT, AND KALIAGUINE
chipping operation. As our O/C value of 0.24 is clearly below the 0.31-0.40 values given in the literature for lignin, it is assumed that the wood fiber surface also contains some extractives most of which have O/C ratios below 0.2. Our C, data indicate accordingly a high C, proportion, in qualitative agreement with reported data for unextracted wood.5
The values calculated from the cellulose formula for O/C is 0.83 and for C,, C,, and C, atomic proportions 0, 0.83, and 0.17, respectively. Our Whatman paper data are thus in poorer agreement with these predictions than those reported by D o h and Gray.g
The Iotech lignin sample also shows a difference between its surface and bulk O/C values. The most interesting r d t , however, about this sample is its close resemblance to the wood sample. Not only are the O/C ESCA values very close but the distribution of C,, C2, and C, peaks are also very similar. This resemblance is also reflected in the 0,, O,, and 0, distribution (see Table IIB) and in the value of E, (Table IVA). Such results indicate quite clearly that in the Iotech lignin preparation the initial surface state of the middle lamella is preserved. One can indeed conjecture that the thermal explosion process would create passages for the enzymes to reach the polysaccharides in the fiber walls and for hydrolysis to be completed while the middle lamella is kept chemically unchanged.
The thiolignin sample shows almost equal bulk and surface O/C values in close agreement with literature data (Table IIA). Dorris and Grayg have calculated theoretical O/C, C,, C,, and C3 proportions from the Freudenberg empirical formula for spruce lignin. These values are reported in Table IIA. They are very close from our experimental data for thiolignin. This agreement is, however, surprising since thiolignin is a thioglycolic acid derivative of lignin. It contains therefore acid groups in rather high proportion which should contribute to C, and even shift this components towards higher binding energies.
Ortho biphenol yields an ESCA derived O/C ratio in good agreement with the calculated value. The proportions of C, and C,, however, do not corre- spond to the 12/2 theoretical distribution, the dominating C, peak being too intense.
The data in Table IILA show progressive changes in O/C and C,, C,, C,, and C, ratios with the severity of the pyrolysis treatment. As the temperature of extraction is increased from 250 to 350°C, O/C ESCA ratio is decreased, as well as its deviation from the bulk value. The C, component increases continuously whereas the general trend of C,, C,, and C, components is a continuous decrease.
As C, was assigned to polyaromatic carbon, its proportion should be correlated with the recondensed material. As in Ref. 1, we have proposed a method for the estimation of elemental analysis of recondensed material, we are in a position to calculate the ratio CRM/CSR, where Cm is the mass of carbon in the recondensed material contained in a given sample and C,, is the carbon content of the whole solid residue. Figure 5 shows not only that this ratio is correlated to the C, fraction of the C, peak, but that both values are almost equal for all samples (a value for CRM/CSR was not obtained for sample MP-13 as elemental analysis of recondensed material was not available for this sample').

ESCA STUDY OF POPULUS TREMULOIDES 371
I
Fig. 5. Relation between carbon in recondensed material and polyaromatic carbon from ESCA CL peaks.
The stoechiometric relation between C2, C,, and O/C ratio may be written as
n,C2 + n,C, = O / C (5)
where n2 and n3 are the average number of oxygen atoms per C, and C , carbon atom, respectively. Obviously, 0.5 5 n2 5 1 and 1 s n3 5 2.
Assuming n3 = 1 in P o p h t r e m d o i i s , Whatman filter, and Iotech lignin, eq. (5) yields reasonable values for n 2 , 0.82 f 0.08, 0.75 f 0.02, and 1.05 f 0.07, respectively. The theoretical value for n2 derived from the cel- lulose formula is 0.80.
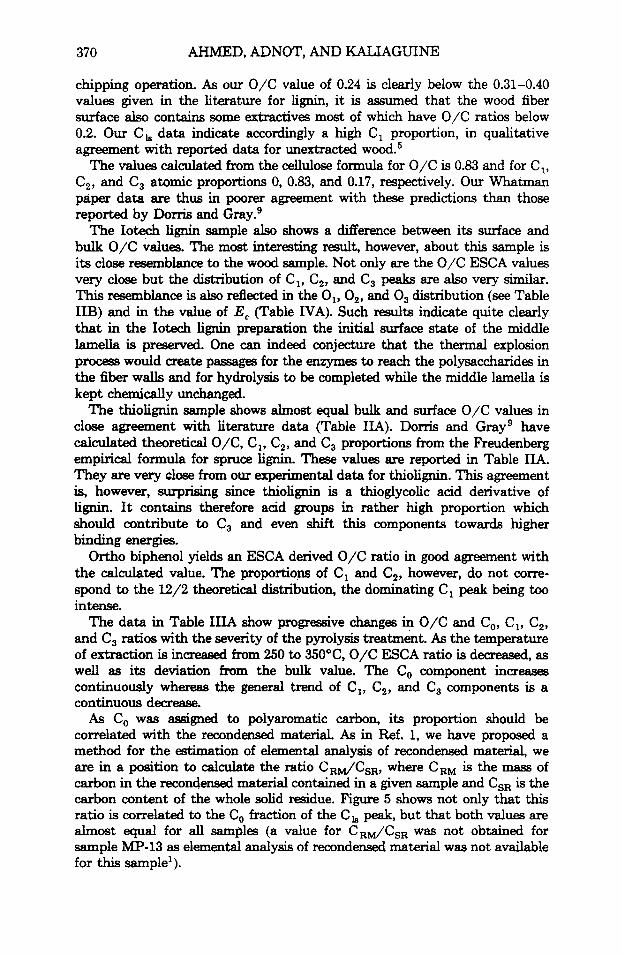
The calculated m e s on Figure 6 show that solutions for n2 and n3 in eq. (5) can be found only for samples Mp6 and Mp15. For all SCE residues produced at temperatures higher than 250°C, the O/C's calculated from eq. (5) are clearly lower than the O/C's from the ESCA intensity ratio.
This could only be explained by the presence in ihese samples of oxygen not bound to carhn. As no silicon 2p was detected in the ESCA spectra, we think that this cannot be assigned to oxygen in ashes. We would therefore have to assume the presence of very strongly adsorbed water. In sample MP11, for example, less than 2% of water would produce an O/C signal comparable to the one observed. We m y conjecture here that in the highly carbonized samples micropores may have developed in which water molecules may be
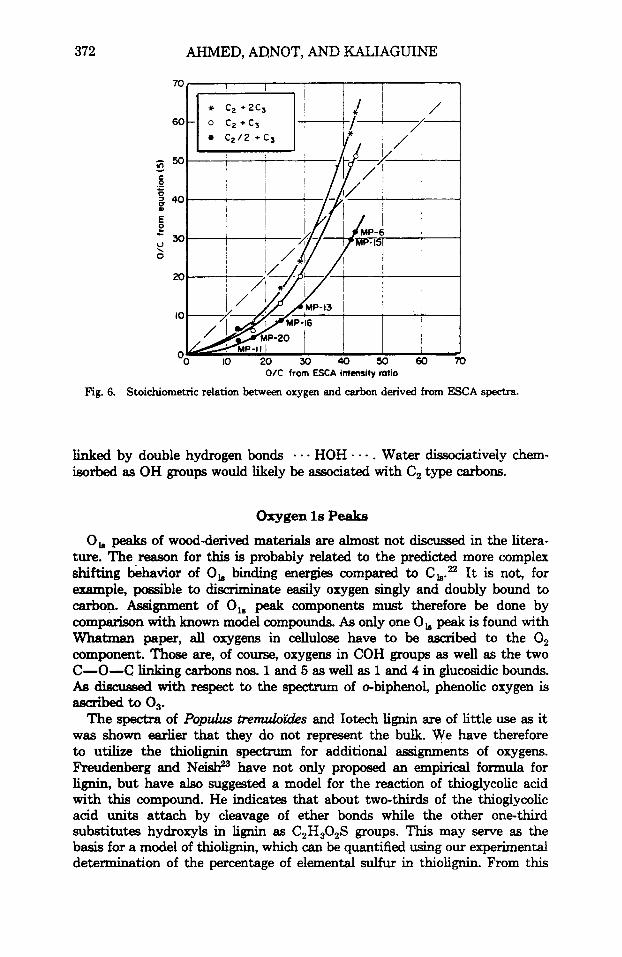
372 AHMED, AQNOT, AND KALIAGUINE
O K from ESCA intensity mtio
Fig. 6. Stoichiometric relation between oxygen and carbon derived from EsCA spectra.
linked by double hydrogen bonds isorbed as OH groups would likely be associated with C, type carbons.
- - HOH - . - . Water dissociatively chem-
Orygen 1s Peaks
0, peaks of wood-derived materials are almost not discussed in the litera- ture. The reason for this is probably related to the predicted more complex shifting behavior of 0, binding energies compared to C,.= It is not, for example, possible to discriminate easily oxygen singly and doubly bound to carbon. Assignment of 0, peak components must therefore be done by comparison with known model compounds. As only one 0, peak is found with Whatman paper, all oxygens in cellulose have to be ascribed to the 0, component. Those are, of course, oxygens in COH groups as well as the two C-0-C linking carbons nos. 1 and 5 as well as 1 and 4 in glucosidic bounds. Asdiscussed with respect to the spectrum of 0-biphenol, phenolic oxygen is
The spectra of Populus tremubiis and Iotech lignin are of little use as it was shown earlier that they do not represent the bulk. We have therefore to utilize the thiolignin spectrum for additional assignments of oxygens. Freudenberg and N W have not only proposed an empirical formula for lie, but have also suggested a model for the reaction of thioglycolic acid with this compound. He indicates that about two-thirds of the thioglycolic acid units attach by cleavage of ether bonds while the other one-third substitutes hydroxyls in li@ as C,H,O,S groups. This may serve as the basis for a model of thiolignin, which can be quantified using our experimental determination of the percentage of elemental sulfur in thiolignin. From this
ascribed to 03.

ESCA STUDY OF POPULUS TREMULOIDES 373
model we calculate the following repartition for atomic oxygen in thiolignin:
phenolic OH 7.60
aliphatic OH 13.30 carbonyl C=O including aldehydes and ketones 4.75
oxygens in lactone groups 0 II C-O- 0.95
aliphatic ether, C - e c 4.28
aliphatic aromatic ether excluding methoxyl
10.45
methoxy groups 21.86
oxygen in thioglycolic acid 0
31.34 II
4 4 H
(a) has already been ascribed to 0,. (b), (c), and (e) can be ascribed to 0, as well as the two oxygens in (d). If we consider that the component 0, increases steadily with the temperature of extraction of SCE residues (see Table IIIB), 0, has to be associated with oxygen in recondensed material and in particular in groupings like (g) and (h), which are liable to be formed by dehydration of two OH groups. We may therefore decide to ascribe (g) and (h) to the component 0 , .
At this point, all yet nonassigned oxygens have to be ascribed to 0, if we want to generate a distribution liable to represent the experimental distribu- tion of oxygens in the spectrum of thiolignin (given in Table IIB), where the 0, component is dominant.
Summing up, the following assignments
would yield the distribution of 0,, 02, and 0, as 5.5, 23.3, and 71.2, respec- tively, which fits very well the experimental distribution (4,24,72).
374 AHMED, ADNOT, AND KALIAGUINE
- However, this distribution is not free from criticism as, for example, the
oxygens in the
0 II C-OH
acid group. As arbitrary as it is, we propose this assignment as a basis for discussion,
hoping that future work will shed some light on the true nature of the 0, bands. As to the 0, component peak appearing in the 0, peaks of the carbonized
samples (Tables IIIB and I n ) , we believe it could be associated with the oxygen in strongly adsorbed water suggested by the analysis of the C, peaks of solid residues.
CONCLUSION
The progressive changes in the chemical nature of SCE solid residues associated with changes in the conditions of extraction are reflected in the ESCA spectra of these samples. The C, peak in particular is rich in informa- tion, allowing one, for example, to measure rapidly the proportion of carbon in polyaromatics. Some even richer results may be obtained in the future from the analysis of the 0, peaks as they show a very detailed structure which evolves in a continuous manner with the conversion to recondensed material. A preliminary assignment of the component peaks in this structure has been proposed, but it is felt that more experimental work is necessary before the full potential of this approach can be appreciated.
This work was supported by the Natural Sciences and Engineering Council of Canada and by the Fond FCAR of the Province of Quebec.
References 1. A. Ahmed, J. L Grandmaison, and S. Kaliaguine, J . Wood Chem. Technol., 6(2), 219
2. D. T. Clark and H. R. Thomas, J. Pdym. Sci., Polym. C h . Ed, 14, 1671,1701 (1976). 3. D. T. Clark, W. J. Feast, W. K. R. Musgrave, and J. Ritchie, J. Polym. Sci., PoZym. Chem.
4. D. T. Clark and k Harrison, J . Polym. Sci., Polym. Chem. Ed., 19, 1945 (1981). 5. D. N. S. Hon, J . Appl. Polym. Sci., 29, 2777 (1984). 6. P. J. Mjoberg, Cell. Chem. Technol., 16, 481 (1981). 7. S. Takeyama and D. G. Gray, Cell. Chem. Technol., 16, 133 (1982). 8. D. G. Gray, Cell. Chem. Technol., 12,735 (1978). 9. G. M. Dorris and D. G. Gray, Cell. Chem. T e c h l . , 12,9 (1978). 10. G. M. Dorris and D. G. Gray, Cell. Chem. T e c h l . , 12,721 (1978). 11. D. C. Frost, W. FL Lder, and R. L Tapping, Fuel, 53,206 (1974). 12. T. T. P. Cheung, J . Appl. Phys., 53(10), 6857 (1982). 13. D. L Perry and A. Grint, Fuel, 62 1024 (1983). 14. D. T. C k k and €2. Wilson, Fuel, 62, 1034 (1983).
(1986).
Ed., 13, 857 (1975).

ESCA STUDY OF POPULUS TREMULOIDES 375
15. M. Pokier, MSc. thesis, Universite Laval, Quebec, 1985. 16. J. H. Scofield, J. Electron Spectrosc., 8, 129 (1976). 17. J. R. Morey, A d . Chem., 40, 905 (1968). 18. T. Ohta, T. Fujikawa, and H. Kuroda, Bull. Chem. SOC. Jpn., 48(7), 2017 (1975). 19. D. T. Clark, D. B. Adams, A. D i k , J. Peeling, and H. R. Thomas, J . E l e c h n Spectrosc.,
20. U. Gelius, P. F. Heden, J. Hedman, B. J. Lindberg, R. Manne, R. Nordberg, C. Nordling,
21. E. S j h t r o m , Wood Chemistry, Academic, New York, 1981. 22. D. T. Clark B. J. Cromarty, and A. Dilks, J. Palym. Sci., Polym. Chem. Ed., 16, 3173
23. K. Freudenberg and A. C. Neish, Constifution and Biosynthesis of Lignin, Springer-Verlag,
8, 51 (1976).
and K. Siegbahn, Phys. Scripta, 2.70 (1970).
(1978).
New York, 1968.
Received September 24, 1985 Accepted November 18, 1986