esker habitat characteristics and traditional land use in ...esker habitat characteristics and...
TRANSCRIPT

Box 2572, Yellowknife, NT, X1A 2P9 Ph (867) 669-6235 Fax (867) 920-4346
e-mail: [email protected] Home Page: http://www.wkss.nt.ca
Re: Esker Habitat Characteristics and Traditional Land Use
in the Slave Geological Province
STUDY DIRECTOR RELEASE FORM The above publication is the result of a project conducted under the West Kitikmeot / Slave Study. I have reviewed the report and advise that it has fulfilled the requirements of the approved proposal and can be subjected to independent expert review and be considered for release to the public.
Study Director Date
INDEPENDENT EXPERT REVIEW FORM
I have reviewed this publication for scientific content and scientific practices and find the report is acceptable given the specific purposes of this project and subject to the field conditions encountered.
Reviewer Date
INDEPENDENT EXPERT REVIEW FORM I have reviewed this publication for scientific content and scientific practices and find the report is acceptable given the specific purposes of this project and subject to the field conditions encountered.
Reviewer Date
BOARD RELEASE FORM
The Study Board is satisfied that this final report has been reviewed for scientific content and approves it for release to the public.
Chair West Kitikmeot/Slave Society Date
ESKER HABITAT CHARACTERISTICS and TRADITIONAL USE STUDY
in the SLAVE GEOLOGICAL PROVINCE
FINAL REPORT to the
WEST KITIKMEOT / SLAVE STUDY
Submitted by:
Stephen Traynor Senior Land Specialist – Land Administration
Indian and Northern Affairs Canada Yellowknife, NT
August 2001
i
SUMMARY
In May of 1996 approval was granted and funding awarded by the West Kitikmeot Slave
Study Society (WKSS) for a project to initiate research and information dissemination on
eskers in the Slave Geological Province. This report is the final product of the WKSS
esker research project. Eskers are a prominent landform in the Arctic, and serve an
interesting role in the ecosystem. Eskers are a glacially deposited ridge of stratified
sands and gravels. Eskers rise above the low-lying tundra to create a dry, windswept
environment for plants, animals and humans.
In the tundra, eskers can be a major source of valuable aggregate for the construction of
roads, runways and other infrastructures. Wolf dens along with archaeological and
historical sites were studied for their spatial relationships to eskers and other landforms.
Though findings for the wolf den and archaeological sites component are discussed in
this report, separate reports were generated due to the volume of data that was
gathered (Desjarlais, 1998 and Fitzpatrick, 1999).
Esker information for this project was initially mapped using air photos and project
information. Eskers were mapped on standard 1:250 000 NTS map sheets. Field
truthing and data gathering was performed over three summers with 373 eskers
spanning eight NTS map sheets. Seventy-six granular samples were taken and
analyzed. In addition, vegetation cover and species composition was noted for the tops
and sides of the esker. Information on heritage sites within the study area was gathered
from a traditional knowledge study conducted by the Nunavut Planning Commission and
from the Archaeological Survey of Canada. Field work on heritage sites included
recording information and photographing the sites from the air or ground, as
opportunities permitted.
Esker orientation provides an indication of the direction of ice flow during deglaciation
and the importance of bedrock controls on this flow. Esker morphology appears to be
closely related to topographical controls and potential meltwater flow conditions during
deglaciation. The majority of eskers had high sand content with only approximately one
third being gravel. Vegetation cover is significantly lower on the windswept tops of
eskers, frequently composed of pebble pavement, than on the sides. Archaeological

ii
sites are typically located on esker systems in close proximity to water. Generally, sites
are located at the top of the esker, or as close to the top of the esker as possible with a
preference to be near a source of water.
All data that was gathered and analyzed, for all aspects of the study, was used to create
a Geographical Information System commonly known as GIS; this linking of photos, log-
plots, grain size charts and digital maps is stored on CD-ROM. Eskers serve not only as
sources of aggregate but also as transportation routes, significant habitat, and cultural
sites for humans and animals and must have their importance fully evaluated.
iii
ACKNOWLEDGMENTS
As with any research project, there are numerous people and organizations to thank. I
would firstly like to thank the West Kitikmeot Slave Study for funding the project and
allowing for the opportunity to work on eskers in the region. I would like to extend a
personal note of thanks to John McCullum for his diligence and patience. Anonymous
reviewers of the previous annual reports provided invaluable suggestions and
comments.
Land Administration and Environment and Conservation, DIAND provided additional
financial support particularly in funding students to assist in the project. The Nunavut
Planning Commission helped considerably in support and providing the heritage
information. My colleagues Dean Cluff and Steve Matthews (RWED-GNWT) assisted in
co-ordinating field logistics so that we could each receive maximum benefit. Lytton
Minerals, BHP, Kennecott and Echo Bay Mines provided field logistical support.
Several students have also worked hard on this project to help prepare this final report.
Justin Kraemer was the wizard who spent many extra hours programming the CD-Rom
to the efficient and data laden package included in the report. David Atkinson also spent
numerous hours researching the esker literature and compiling the information and
writing the final report.
I am indebted to that bundle of energy and enthusiasm named Patricia Fitzpatrick, who
spent two summers as a field assistant and conducted her own archaeological field
assessment. She also kept me on my toes with her numerous questions and
discussions. Chino breaks are not the same without her.
As a final note, I would like to thank April Desjarlais for all her help. She has been with
the project from the start and has provided much needed logistical support and
enthusiasm as well as conducting her own wolf den study. Her love of northern ecology,
fieldwork and just plain being out on the Tundra was very much welcome and carried the
day during some long days of digging test pits. When she asks for the binoculars, don’t
ask why, just do it and don’t call her “bugs”.
iv
TABLE OF CONTENTS
SUMMARY ........................................................................................................................I
ACKNOWLEDGMENTS ..............................................................................................III
LIST OF TABLES ..........................................................................................................VI
LIST OF FIGURES ........................................................................................................VI
1 OBJECTIVES ........................................................................................................... 1
2 DESCRIPTION......................................................................................................... 3 2.1 BACKGROUND...................................................................................................... 3
2.1.1 Esker Formation and Sedimentology.......................................................... 3 2.1.2 Eskers and the Arctic Ecosystem ................................................................ 5 2.1.3 Humans and Eskers..................................................................................... 7
2.2 STUDY AREA ........................................................................................................ 9 2.3 METHODOLOGY ................................................................................................. 11
2.3.1 Map Compilation ...................................................................................... 11 2.3.2 Esker Sampling and Field Truthing Geophysical Data............................ 12 2.3.3 Biophysical Data Collection ..................................................................... 12 2.3.4 Archaeological Data Collection and Field Truthing................................ 14 2.3.5 Post-Field Season Follow-up.................................................................... 15
3 OBSERVATIONS................................................................................................... 16
3.1 MAP SHEET 76E CONTWOYTO LAKE ................................................................. 16 3.1.1 Geophysical Data...................................................................................... 16 3.1.2 Biophysical Data....................................................................................... 17 3.1.3 Archaeological and Historical Data......................................................... 17
3.2 MAP SHEET 76F - NOSE LAKE........................................................................... 18 3.2.1 Geophysical Data...................................................................................... 18 3.2.2 Biophysical Data....................................................................................... 19 3.2.3 Archaeological and Historical Data......................................................... 20
3.3 MAP SHEET 76K - MARA RIVER........................................................................ 20 3.3.1 Geophysical Data...................................................................................... 20 3.3.2 Biophysical Data....................................................................................... 21 3.3.3 Archaeological and Historical Data......................................................... 22
3.4 MAP SHEET 76L - KATHAWACHAGA LAKE ....................................................... 22 3.4.1 Geophysical Data...................................................................................... 23 3.4.2 Biophysical Data....................................................................................... 24 3.4.3 Archaeological and Historical Data......................................................... 24
3.5 MAP SHEET 76M - HEPBURN ISLAND ................................................................ 25 3.5.1 Geophysical Data...................................................................................... 25 3.5.2 Biophysical Data....................................................................................... 26 3.5.3 Archaeological and Historical Data......................................................... 27
3.6 MAP SHEET 76N - ARCTIC SOUND .................................................................... 28
v
3.6.1 Geophysical Data...................................................................................... 28 3.6.2 Biophysical Data....................................................................................... 29 3.6.3 Archaeological and Historical Data......................................................... 29
3.7 MAP SHEET 86P KIKERK LAKE ......................................................................... 30 3.7.1 Geophysical Data...................................................................................... 30 3.7.2 Biophysical Data....................................................................................... 31 3.7.3 Archaeological and Historical Data......................................................... 31
3.8 MAP SHEET 86O COPPERMINE .......................................................................... 31 3.8.1 Geophysical Data...................................................................................... 31 3.8.2 Biophysical Data....................................................................................... 32 3.8.3 Archaeological and Historical Data......................................................... 32
4 RESULTS ................................................................................................................ 33 4.1 GEOPHYSICAL RESULTS..................................................................................... 33
4.1.1 Esker Morphology..................................................................................... 33 4.1.2 Esker Structure and Composition ............................................................. 36
4.2 BIOPHYSICAL RESULTS...................................................................................... 37 4.3 ARCHAEOLOGICAL AND HISTORICAL SITES RESULTS ........................................ 38
5 DISCUSSION / CONCLUSIONS.......................................................................... 40 5.1 GLACIAL HISTORY............................................................................................. 40 5.2 BIOPHYSICAL FEATURES.................................................................................... 40 5.3 ARCHAEOLOGICAL AND HISTORICAL SITES ....................................................... 41 5.4 IMPACTS FROM INDUSTRIAL ACTIVITY............................................................... 42 5.5 FUTURE RESEARCH............................................................................................ 43
6 LINKS WITH PARALLEL STUDIES................................................................. 43
7 TRAINING ACTIVITIES AND RESULTS......................................................... 45
8 REFERENCES........................................................................................................ 46
APPENDIX A: WKSS ESKER DATABASE CD-ROM............................................ 50
APPENDIX B: SELECTED PHOTOS......................................................................... 57
APPENDIX C: SCHEDULE OF EVENTS .................................................................. 62
APPENDIX D: MAP SHEET PACKAGES................................................................. 65
APPENDIX E: ESKER BIBLIOGRAPHY.................................................................. 66
vi
LIST OF TABLES
Table 1: Contwoyto Lake Esker Samples .......................................................................16
Table 2: Nose Lake Esker Samples................................................................................19
Table 3: Archeological and historical sites visited on NTS 76F – Nose Lake .................20
Table 4: Mara River Esker Samples ...............................................................................21
Table 5: Archaeological and historical sites visited on NTS 76K - Mara River ...............22
Table 6: Kathawachaga Lake Esker Samples. ...............................................................23
Table 7: Archeological and historical sites visited on NTS 76L – Kathawachaga Lake ..25
Table 8: Hepburn Island Esker Samples.........................................................................26
Table 9: Archaeological and historical sites visited on NTS 76M – Hepburn Island .......27
Table 10: Arctic Sound Esker Samples...........................................................................28
Table 11: Archeological and historical sites visited on NTS 76N – Arctic Sound............30
Table 12: Total sample percentages on a per-map sheet basis .....................................36
Table 13: Average percentage of plant cover on sides and top of eskers on a per-map
sheet basis ..............................................................................................................37
LIST OF FIGURES
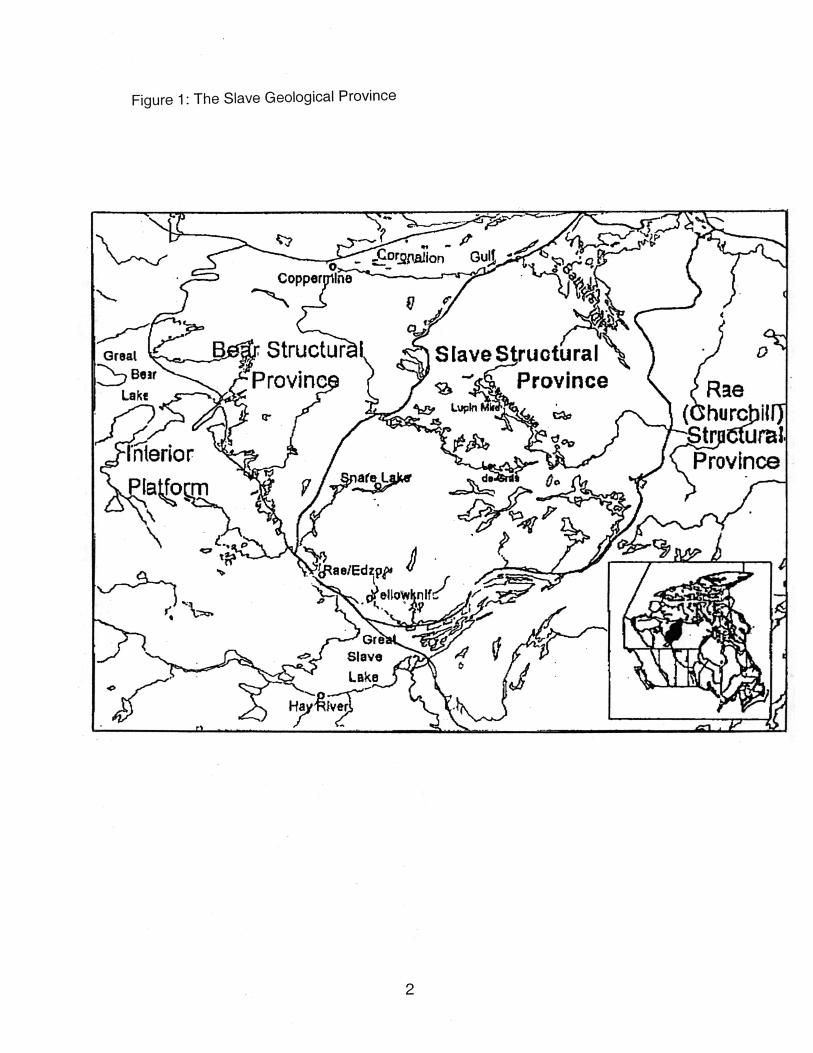
Figure 1: The Slave Geological Province..........................................................................2
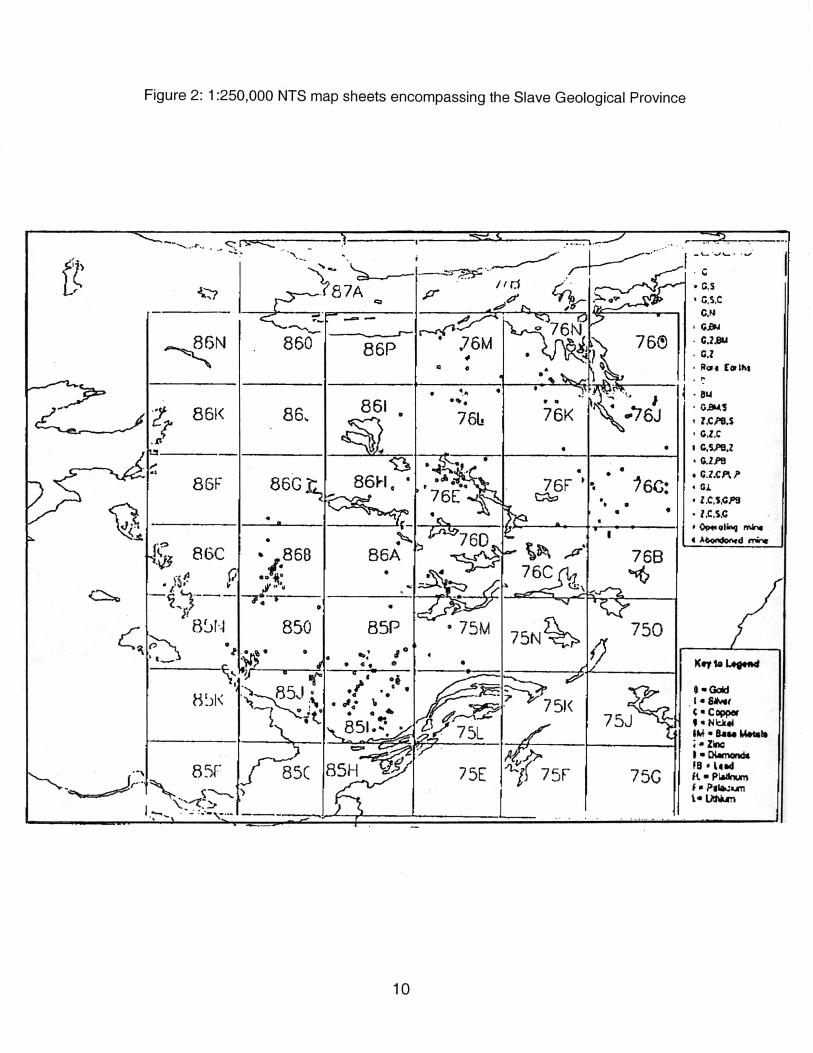
Figure 2: 1:250,000 NTS map sheets encompassing the Slave Geological Province ....10
Figure 3: A map of Esker Zones, as illustrated on Esker E4, Located on NTS Map 76M
(Hepburn Island) .....................................................................................................14
Figure 4: Simple ridge esker on NTS 76K – Mara River .................................................34
Figure 5: Schematic of esker fan accumulation (Gorrell and Shaw 1991) ......................35
Figure 6: Esker Fan Complex on NTS 76F – Nose Lake................................................35
1
1 OBJECTIVES
In May of 1996 approval was granted and funding awarded by the West Kitikmeot /
Slave Study Society (WKSS) for a project to initiate research and information
dissemination on eskers in the Slave Geological Province (Figure 1). This report is the
final product of the WKSS esker research project. The report brings together the
knowledge gained and information gathered during the summers of 1996, 1997, and
1998.
This project is designed to fill the gap in basic knowledge on eskers within the region.
Academic research of relevance to this study conducted in the fields of esker
geomorphology, habitat and traditional uses has also been reviewed. It is hoped that
future researchers will be able to utilize the information collected through this project to
not only produce maps, but also obtain a base understanding of the role that eskers play
both spatially and temporally within the arctic tundra ecosystem.
The overall objective for the project is:
“To provide timely baseline information on esker habitat characteristics and traditional uses in the Contwoyto Lake region in a format which will benefit all.”
Specific objectives of the project include:
• to inventory digital and paper map sets identifying eskers and any related habitat
information in the study area;
• to identify and collect information on esker habitat characteristics, in collaboration
with the Wolf/Esker study;
• to collect and map traditional knowledge on the traditional uses/activities
associated with eskers in the region; and • to use collected information to make a preliminary assessment of the relationship
between land use activities and esker habitat.
3
2 DESCRIPTION
2.1 BACKGROUND
Thousands of years before present, much of North America was covered by continental
glaciers. One ice sheet, known as the Laurentide Ice Sheet, extended from the Rocky
Mountains in the west, to the present day shores of Newfoundland and Labrador in the
east, north to the pole, and as far south as the northern United States. These immense
glacial ice sheets vastly changed the Canadian landscape.
As glaciers travel over land, they pick up sediment scoured from the surface. The
entrained sediment is transported both within and under the glacier. As the glaciers
melt, the entrained sediment is deposited forming a variety of landforms. Moraines,
drumlins, till plains, kames and eskers are just some of the features formed from the
sediment deposited by a glacier. Eskers are a prominent landform in the Arctic.
Eskers are interesting glacial features that have been studied from a variety of
perspectives. To understand how eskers impact the arctic environment, one must first
have an understanding of what an esker is and why it can be such an important
environmental factor. The following sections will discuss background information
regarding a variety of esker related topics. The information contained in this section was
gathered through an extensive literature search. The background information contained
in this section is an attempt to put esker research into perspective and give an overall
context from where the goals of this project arose. Appendix ‘E’ contains the collective
bibliography and a thorough literature review. A digital version of the literature review
can be found on the project’s CD-ROM.
2.1.1 ESKER FORMATION AND SEDIMENTOLOGY
It is generally accepted that eskers are a linear accumulation of stratified gravel and/or
sandy sediment that was deposited by a stream confined on both sides by glacier ice
(Banerjee and McDonald 1975). Literature describes esker formation in terms of glacial
hydrological theories, which have been derived from observations of modern day
glaciers and the small eskers that they produce (Lewis, 1949; Stokes, 1958).
4
The structure and behaviour of a glacial stream channel often becomes the focus for
questions regarding esker genesis. The position of this channel within the glacier is a
major portion of this debate. These stream channels have been known to form in the
following ways: under the glacier (subglacially); within the glacier (englacially); on top of
the glacier (supraglacially); or on the ice margin where meltwater is entering a glacial
lake (Banerjee and McDonald 1975). Where an esker exhibits very little post-
depositional sedimentary disturbance, it is generally accepted that the esker was formed
in a subglacial or ice-marginal environment. If the esker was formed englacially or
supraglacially its sedimentary structures would show severely deformed sequences due
to the letting down of the sediment as the ice retreated (Banerjee and McDonald 1975).
It is generally accepted by most researchers that large Pleistocene eskers were formed
subglacially or ice-marginally in deltaic, fan or re-entrant environments (Brennand 1994).
Around the world, the majority of eskers are found on the resilient crystalline bedrock
structures of continental shield regions, with only few being found on soft sedimentary
substrate. Clark et al (1994) have several plausible hypotheses why this trend occurs.
On shallow, resilient strata, subglacial meltwaters are unable to down cut and increased
meltwater expands the channel upward into the ice. As well, sediment carried within the
glacier is a coarser crystalline structure, consisting mostly of sand and gravel, and is
more easily deposited (Clark et al. 1994). When a meltwater channel forms on a
deformable bed, like most sedimentary sequences, a shallow, braided meltwater
channel is more likely to form. The material being carried in these meltwater channels is
also more likely to be of a finer nature, predominantly clays and silts.
Sediment supply and type are important factors in the formation of an esker. Meltwater
within the conduits become charged with debris from the surrounding glacial ice.
Sediment sizes range from clay to boulders. As sediment is entrained, transported and
deposited it becomes stratified, sorted by size, and rounded to varying degrees. These
sediments are often found in complex bedding forms. Areas with sedimentary bedrock
will often have finer sediments. These silts and clays remain entrained in the glacial
meltwater and are eventually deposited in a low energy proglacial environments like
lakes (Clark 1997). Regions such as the shield will have coarser sediment that will be
deposited more easily in a glacial conduit.
5
As with a river or stream, sand and gravel beds are deposited as energy is lost due to a
decreased flow rate. The factors that can affect the flow rate within an esker conduit are
channel geometry, sediment load and discharge. As water slows, heavier sediment can
no longer be carried by water flow, causing deposition. Often a glacier drainage network
is comprised of interconnected or linked cavities (Hooke 1989). This system of cavities
will open and close as the ice flows, creating variable flow rates. Seasonal changes in
flow rates are also a factor in the amount, and pressure, at which water flows within the
glacier.
Sedimentological investigations are crucial to the identification of eskers and the key to
understanding depositional process. Though their general morphology can be very
similar, eskers in different regions can have vast sedimentological differences. By
examining the sediments within the esker for size and degree of sorting, a number of
statistical measures can be applied. In addition, techniques such as examining gravel
fabrics show gravel orientation and allow paleocurrents to be determined (Saunderson
1976). While examining the internal structures of the esker, it becomes possible to
describe the process that formed this landform. In addition, by understanding what an
esker contains, it can become possible to determine an esker’s suitability for wildlife
dens or human aggregate use.
2.1.2 ESKERS AND THE ARCTIC ECOSYSTEM
The major ecosystem in the project area is that of arctic tundra. The word tundra comes
from the Finnish tunturi meaning a treeless plain (Smith 1992). Tundra is characterized
by low temperatures, a short growing season and little precipitation, since cold air holds
little moisture (Smith 1992). Eskers rise above the low-lying tundra to create a unique
environment from the surrounding land.
Permafrost is a major factor in creating the ecosystem that exists in most of the arctic
regions of the world. Permafrost is the perennially frozen subsurface and develops
where ground temperatures remain below freezing. Since permafrost inhibits vertical
drainage, water within the system tends to remain in the thin upper layer of soil that will
6
thaw in the short summer months. This lack of vertical drainage allows water to collect
near the surface, creating lakes, pools and bogs and permanently soggy ground. An
abundance of water and a lack of solid ground makes travel difficult in the summer
months for many animals, including humans.
Because of a shorter growing season and relatively stressful ecological conditions,
vegetation on the arctic tundra tends to be slow growing and low to the ground. Low
lying moist areas can be covered with cotton grass, sedge, or dwarf heath, sphagnum
moss complex (Smith 1992). On higher areas, such as those on eskers, the amount of
vegetation is highly reduced. Elevated areas are usually dryer and wind swept. Due to
the increased wind and dryness, eskers usually have had most fine soils blown away
leaving a stone covered pavement. Areas such as these support sparse vegetation and
plants are often confined to depressions where moisture can collect. Often only lichens
and mosses are able to live on these bare lands.
The microclimate of eskers can also affect insect abundance. Recent studies have
shown that inactive gravel pads used by the oil industry have fewer mosquitoes and
other insects because of the microclimate created by the bare dry gravel (Pollard et al.
1996). These gravel pads can have similar characteristics to a flat topped esker.
Species diversity is relatively low on the tundra (Smith 1992). Of the mammals,
herbivores are the most common, and include lemmings, arctic hare, caribou and musk
ox (Smith 1992). Larger herbivores like caribou and musk ox are extensive grazers, and
require larger areas to feed. Caribou are migratory animals spending their winters below
the tree line. During migration, it is believed that caribou rely heavily on visual and
olfactory markers and will actively seek a path of least energetic resistance when
traveling (Banfield and Jakimchuk 1980). Eskers are often used as migratory paths
because of their extensive length of uninterrupted, relatively clear windblown ridge tops.
Eskers create a path that avoids streams and bogs allowing the herds to travel long
distances with little physical resistance. Fewer insects as a result of higher winds and
dryer soils may also be a factor in the use of eskers by many mammals.
On the arctic tundra wolves are a major predator. There have been several recent
studies on the denning habitats of wolves and other arctic predators, such as the arctic
7
fox and grizzly bear. In association with this esker project for WKSS, a report titled Wolf
Den Habitat on Eskers in the Slave Geological Province was prepared by April
Desjarlais in 1998. Desjarlais’ observations will be discussed in later sections of this
report.
The environment in which wolves choose to den must support many critical components.
These components include: elevated areas, good drainage, well-drained soils, access to
water, and availability of a food source (Stephenson 1974). Esker habitats often provide
these optimum environmental conditions for wolf dens.
The arctic tundra extending north of the treeline is a unique and delicate ecosystem.
While the interaction between plant, animal and landscape is not a simple one, it can be
seen that eskers and other granular deposits serve an important purpose. Although
eskers are considered a very important ecosystem component for wildlife, we cannot
conclude that they are of primary importance as not enough research has been done to
support this claim (Desjarlais 1998).
2.1.3 HUMANS AND ESKERS
With increasing development in the western arctic, it is important to understand the uses
of eskers – both past and present. Such knowledge will allow for future planning and
management of this cultural and physical resource in a way that provides for sustainable
development of the region. Eskers currently serve many industrial purposes in the
development of the north. Eskers are a common multi-use landform on the tundra.
They have been used as a source of sand and gravel and as a prospecting tool.
Conversely, cultural and/or archaeological sites found on eskers illustrate the importance
of these raised sand and gravel deposits to the aboriginal peoples of the tundra.
Although eskers make up less than five percent of the surface area, there is a general
belief that these landforms are prime locations for archaeological sites. It is believed
that aboriginal people selectively choose areas of habitation based on their physical and
cultural requirements (Epp 1984). In the archaeological project undertaken in
conjunction with this esker project, it was found that more than 60% of archaeological
8
sites visited in the Slave Geological Province are located on eskers (Fitzpatrick 1999).
There are many reasons why such high proportions of sites have been located on
eskers. Because of their granular composition, eskers provide a well-elevated, well-
drained environment. Since the surrounding landscape typically consists of wet boggy
tundra, eskers often represent good alternatives and provide for improved travelling
conditions and better campsites. Because they are elevated, eskers also allow travelers
to see the surrounding tundra, including predators, prey, and navigational features.
Being elevated can allow for increased air circulation (Park 1997). Good air circulation
and wind helps in the displacement of annoying summer insects. This behaviour of
seeking higher ground to avoid insects has also been observed with caribou herds
(Downes, et al. 1986). Given that eskers are long sinuous ridges that rise above the
tundra, that they are well drained with very little vegetation, they provide ideal
transportation routes for traveling across the tundra.
Repeatedly, in three years of field investigation, results have indicated that
larger, more continuous eskers have the greatest potential to yield archaeological
sites, especially near medium and large lakes. Sites are [also] found on smaller,
less continuous sections of esker[s] and on other landform types, but not with the
same frequency (Bertulli 1998).
Eskers have been used for centuries as sites for habitation, but they also serve several
modern uses in the development of the north. In the arctic tundra, where it is difficult to
find suitable aggregate sources, eskers often provide excellent sources of industrial
sands and gravels. When construction occurs in the arctic, as with anywhere, aggregate
is a necessity. Sand and gravel is important in the construction of roads, buildings, and
foundations. Eskers have often been used as seasonal roads and runways.
Canada’s Arctic region is considered by many to be a storehouse of mineral wealth
waiting to be unlocked (Reynolds 1996). At the same time, the Arctic is recognized as
being a valued, yet fragile natural environment, and one that is slow to recover when
damaged. In our society, there is an ongoing struggle to find a balance between
economic development and environmental responsibility (Reynolds 1996). Though the
esker provides us with an industrial resource, we must attempt to see the importance of
9
the esker as a whole to the arctic ecosystem. Within an ecosystem, animals and other
species can be very dependent upon what seems to be a minor feature. Caribou and
migratory birds use eskers as landmarks and travel routes on their migratory journeys.
Humans have used them as campsites and hunting platforms. If it is to take place,
development must take into account all environmental and historical factors before
altering the natural environment.
2.2 STUDY AREA
The study area for the project is located in the barren land tundra of central Nunavut.
This study falls within the region known geologically as the Slave Geological Province of
the Canadian Shield. This region is characterised by bedrock, composed of igneous and
metamorphic rocks, primarily Precambrian schist, gneisses and granites. The region is
located north of the tree line limiting the vegetation to tundra species of grasses, shrubs,
lichens and mosses.
The first year of the project (1996) began around Contwoyto Lake (NTS 76E) and then
progressed northward focussing on large areas with a high concentration of land use
activities and potential for large-scale industrial activities. In the second year of the
study (1997), fieldwork concentrated on the eastern half of Nose Lake (NTS 76F),
Kathawachega Lake (NTS 76L) and the western half of Mara River (NTS 76K). The third
and final year of fieldwork (1998) focused on Arctic Sound (NTS 76N), Hepburn Island
(NTS 76M), Kikerk Lake (NTS 86P) and Coppermine (NTS 86O) map areas and
completed the eastern portion of the Mara River map sheet. Figure 2 shows the
locations of the map sheets.
Much of the glacial history of the area has been described by several Geological Survey
of Canada (GSC) scientists including Dyke and Prest (1987), Dyke and Dredge (1989),
Dredge et al (1996a, 1996b, 1998), Kerr (1995a, 1995b, 1996, 1997a, 1997b), St-Onge
(1995) and Ward et al, (1995, 1997). The area has been subjected to multiple
glaciations during the Quaternary period with the latest, the Late Wisconsinan, having
the most recent impact on the formation of the eskers. The area lies in the central part
11
of the Keewatin Sector of the Laurentide Ice Sheet, west of the MClintock Ice Divide,
which was prominent during the Late Wisconsinan maximum (18 000 - 13 000 BP)
(Ward, et al. 1995). The area deglaciated at about 8 500 BP with the formation of a
glacial lake developing in the current Contwoyto Lake basin. The glacial lake was
approximately 10 to 35 metres above the present lake and eventually drained to the
southwest (Ward, et al. 1995). The remaining surficial landscape is comprised mostly of
tills and ice contact materials (Edlund 1977).
2.3 METHODOLOGY
This project was scheduled over a three-year period (1996-1998). The first year
involved the initial compilation of information and the production of digital maps. The
second and third years focussed on filling in gaps from the first year and expanding the
study area to the north. Additional information on habitat characterisation was added to
the project in the second and third year. The methodology to achieving this project
involved both physical and field gathering of information and discussions with
communities. The methodology remained essentially the same over the three summers
of fieldwork with the only difference being the area studied.
2.3.1 MAP COMPILATION
Esker information for this project was initially mapped using air photos and project
information for DIAND by J.D. Mollard and Associates (1993). Eskers were mapped on
standard 1:250 000 NTS map sheets distributed by Natural Resources Canada
(NRCan). As the mapping was prepared using air photo interpretation only, fieldwork
from this project focussed on ground truthing esker information. Additional information
on eskers, such as NRCan GSC surficial geology maps or open file reports were utilized
where available. The surficial geology maps do not detail eskers specifically but rather
focus on the surficial material covering the area being mapped. A comparison of the
GSC surficial geology maps with digital maps produced during this project was also
completed. While the GSC has extensively mapped the area, the maps do not cover the
entire project area. Additional information relevant to this study was gathered from the
GSC maps of surrounding areas. All available information was collected and digitized to
12
produce a series of initial maps at a scale of 1:250 000. Digitizing was done using
Arc\Info format and transferred into Arc/View for easier map presentation and database
compilation.
2.3.2 ESKER SAMPLING AND FIELD TRUTHING GEOPHYSICAL DATA
Based on all the information collated onto draft digital maps at a scale of 1:250 000,
potential areas for intensive field truthing were identified and targeted for the field study.
Helicopter transects were planned so as to reconnaissance each individual esker
identified on the draft maps. Extensive planning and contingency planning was needed
as the field season was usually limited to two weeks based on the helicopter time
available.
While in the field, notes and photographs were taken for each esker and a data sheet
was prepared to give additional information on a random location for each esker. A
limited number of eskers were selected for test pits, leading to limited information on the
sediments at various locations.
On average, four hand-excavated pits were dug and logged each day. As each pit takes
a minimum 1.5 hours to complete, time and funding constraints did not allow for the
digging of a sample pit at each esker. The hand excavated test pits were dug, sampled,
and logged according to the procedures set out in the EBA ”Manual for sampling esker
deposits and laboratory testing procedures” prepared for DIAND by EBA Engineering
Consultants Ltd (1994). The test pits were generally dug to a depth of 1 to 2 metres,
and were generally based on the depth of the active layer. Samples were also collected
as outlined in the EBA manual. All samples were sealed and taken to a geotechnical
laboratory at the end of the field season for professional grain size analysis and moisture
content determination.
2.3.3 BIOPHYSICAL DATA COLLECTION
Vegetation Evaluation
13
Vegetation analysis was also carried out through the esker study. Each esker identified
in the field was evaluated for vegetation cover. A percentage of plant cover was
estimated for the sides and top surface of the esker. These percentages were estimated
from lateral transects emanating from the crest of the esker to the bottom of the esker. In
the latter portions of the study, the methodology for vegetation analysis changed slightly
to include a noting of the type of species identified along the transect. The most
dominant species on the tops and sides of the eskers were noted only for those eskers
selected for test pits.
Wolf Den Habitat The esker research project involved the analysis of esker use by wolves denning in the
Central Arctic. Data gathered for this study involved both fieldwork and discussions with
other researchers. The Wolf Den Habitat Study was initiated by compiling all available
data on wolf dens from Dean Cluff, RWED, GNWT. A wolf den database established by
RWED was evaluated and all wolf dens within the study area were documented and
placed into a priority list for field reconnaissance. During the summer field season, dens
found on eskers were photographed, documented and evaluated for vegetation cover
and wolf activity (Desjarlais 1998). Both wolf and archaeological studies used a location
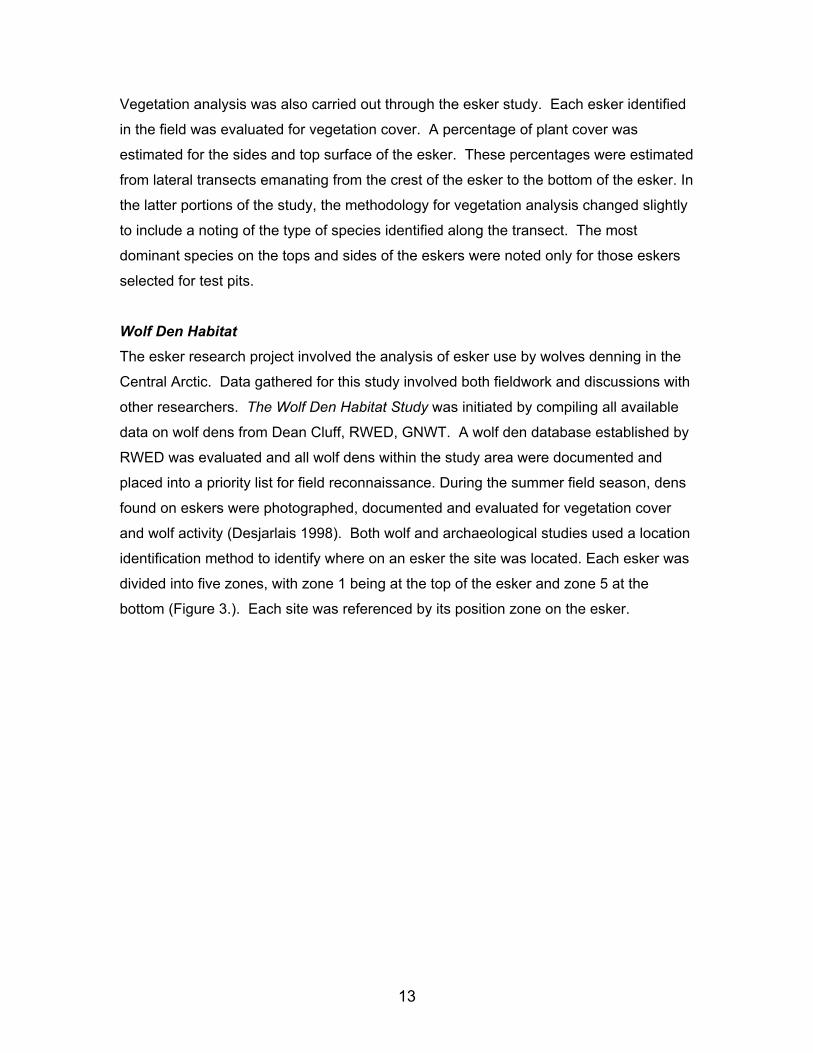
identification method to identify where on an esker the site was located. Each esker was
divided into five zones, with zone 1 being at the top of the esker and zone 5 at the
bottom (Figure 3.). Each site was referenced by its position zone on the esker.
14
�Figure 3: A map of Esker Zones, as illustrated on Esker E4, Located on NTS Map
76M (Hepburn Island)
2.3.4 ARCHAEOLOGICAL DATA COLLECTION AND FIELD TRUTHING Adjunct with the esker project, an archaeological component was designed to provide
baseline information about archaeological site locations within the existing framework of
the Project. The Nunavut Planning Commission (NPC) initially supplied all heritage
resource information from its Traditional Knowledge Study, compiled through community
information gathering projects. The community information was field truthed during the
field season to provide visual references in the form of photographs to NPC; resulting
data (notes and photos) were returned to NPC for amendments to its heritage resource
database. In addition to potential sites identified through the NPC Traditional Knowledge
Study, those registered with the Archaeological Survey of Canada within the Esker
Project study area were also reconnaissanced. Where a new heritage site was found,
several photos and notes on site orientation were taken and provided to both NPC and
the Prince of Wales Heritage Centre in Yellowknife. Information gathered was forwarded
to the Archaeological Survey of Canada for incorporation into its database.
Heritage sites provided by both sources were transferred to field maps. The targeted
areas for heritage resources included hunting/fishing locations, travel ways, and/or
Zone 1Zone 3 Zone 5
15
potential historical/archaeological sites. Criteria for evaluating site preference were
developed in conjunction with the Prince of Wales Northern Heritage Centre (Andrews,
Pers. Comm., 1998). Variables to be examined included elevation proximity to water,
surficial geology, site drainage and evidence of wildlife. Sites were primarily observed
from a helicopter, which hovered while notes and photos were taken. Sites that were
particularly large, or were located near an area where an esker test pit was dug were
observed from the ground.
2.3.5 POST-FIELD SEASON FOLLOW-UP Information gathered during the summer field programs was compiled into databases
and transferred to an ArcView GIS format in order to revise the initial draft digital field
maps. These maps were returned to the communities for verification and inclusion of
any additional information by NPC. All wolf den mapping information was sent along
with the esker data to Dean Cluff (GNWT-RWED) for use in the wolf study. Surface
disposition information was supplied digitally by Land Administration, DIAND. All data
regarding archaeological and historical sites was registered with the Prince of Wales
Northern Heritage Centre (PWNHC) in Yellowknife, NT.
Finally a digital database in an ArcView GIS format was compiled and completed. This
database includes all the technical and graphical information gathered during the three-
year study. Digital copies of pertinent photos, log plots, and grain size analysis sheets
were also linked within the database in an easy to use graphical user interface (GUI)
designed by Justin Kraemer.
16
3 ACTIVITIES
3.1 MAP SHEET 76E CONTWOYTO LAKE 3.1.1 GEOPHYSICAL DATA NTS map sheet 76E - Contwoyto Lake was field surveyed in the summer of 1996, the
first field season for the project. Fifty-eight individual eskers were identified on this map
sheet. The eskers located southwest of Contwoyto Lake are primarily segmented
sections of a larger linear esker deposit, possibly a series of beaded eskers. The eskers
tend to be oriented in a NW-SE direction for the majority of the map area. The eskers
located to the north of Contwoyto lake though are running a north-south direction and
converge to form a larger esker that can be seen on map sheet 76F - Nose Lake. These
north trending eskers give the appearance of a dendritic drainage pattern, and do not
show the same truncation as the eskers on the southwest side of the map sheet.
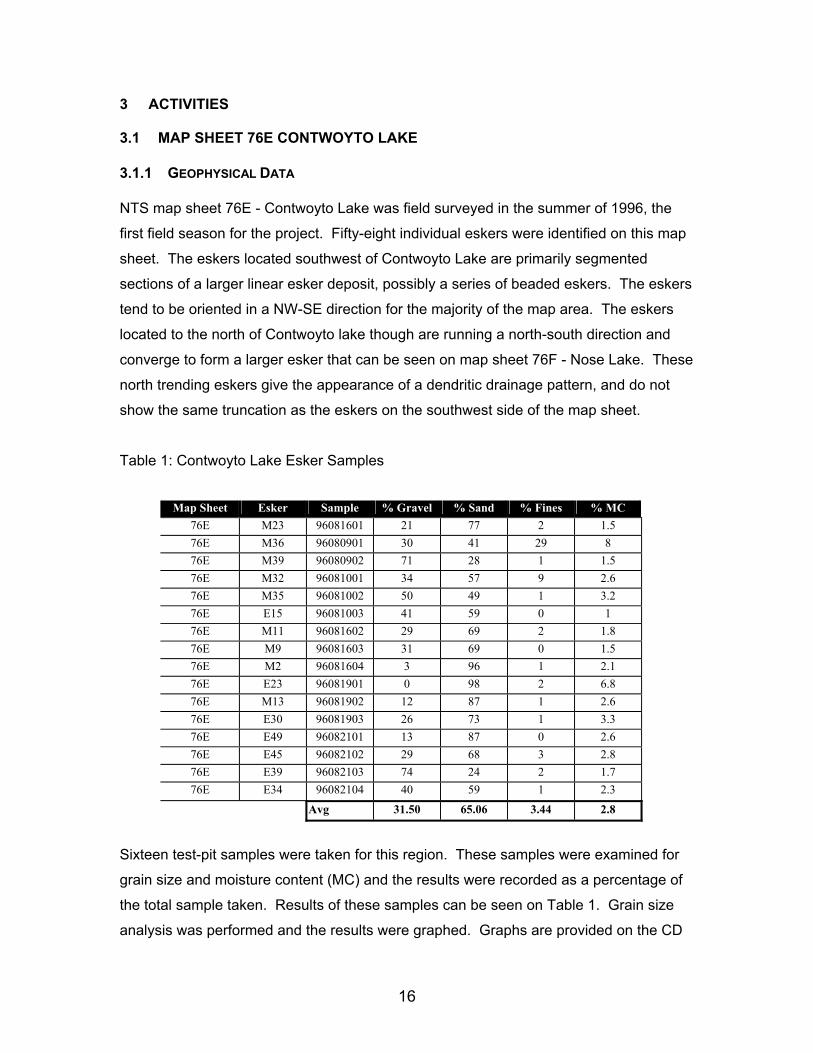
Table 1: Contwoyto Lake Esker Samples
Sixteen test-pit samples were taken for this region. These samples were examined for
grain size and moisture content (MC) and the results were recorded as a percentage of
the total sample taken. Results of these samples can be seen on Table 1. Grain size
analysis was performed and the results were graphed. Graphs are provided on the CD
Map Sheet Esker Sample % Gravel % Sand % Fines % MC
76E M23 96081601 21 77 2 1.5 76E M36 96080901 30 41 29 8 76E M39 96080902 71 28 1 1.5 76E M32 96081001 34 57 9 2.6 76E M35 96081002 50 49 1 3.2 76E E15 96081003 41 59 0 1 76E M11 96081602 29 69 2 1.8 76E M9 96081603 31 69 0 1.5 76E M2 96081604 3 96 1 2.1 76E E23 96081901 0 98 2 6.8 76E M13 96081902 12 87 1 2.6 76E E30 96081903 26 73 1 3.3 76E E49 96082101 13 87 0 2.6 76E E45 96082102 29 68 3 2.8 76E E39 96082103 74 24 2 1.7 76E E34 96082104 40 59 1 2.3
Avg 31.50 65.06 3.44 2.8
17
Rom accompanying this report. The amount of sorting for the samples ranged from
“well” to “poorly sorted”. Of the samples taken, on average there was approximately two
thirds more sand than gravel. In all the samples, there was a relatively low amount of
fines (silt and clay).
3.1.2 BIOPHYSICAL DATA
Biophysical data on vegetation cover and wildlife were taken for eskers located on NTS
map sheet 76E. Vegetation cover varied from esker to esker. Vegetation on the sides
of the eskers varied from 100% coverage to 20% coverage. The top ridges of the eskers
often had much less vegetation and ranged from zero to 80%. The majority of esker
ridges had very little vegetation on the upper surfaces. Seven wolf dens were noted to
be located on this map sheet based on the RWED database. Of those seven, four were
positively identified in the field. Due to difficulties in locating wolf dens by helicopter, the
remaining three may be present but were not observed.
The dens on this map were all located on the upper slopes of the eskers. One den,
E003, was located on the crest of Esker E34. All of these dens had a high proportion of
vegetation cover. The den’s percentage of cover ranged from 70% to 85%. The
vegetation located on and around the dens consisted primarily of grasses, sedges and
willows.
3.1.3 ARCHAEOLOGICAL AND HISTORICAL DATA Within the NTS map sheet 76E – Contwoyto Lake there are 36 heritage sites registered
with either the Nunavut Planning Commission or the Archaeological Survey of Canada.
Of these sites, three were visited during the esker project. Due to time constraints, only
photographs were taken of these sites. Their proximity to water and associated
landform type were not recorded. The photographs show standing water near two of the
sites. All three sites are located near the shore of Contwoyto Lake. Tent rings were
18
located on all three sites and one site featured an Inuksuk.
There are a number of sites located on the northwest corner of the map sheet. These
sites, though they were not visited, have been documented in the past to varying
degrees and recorded with either the Nunavut Planning Commission or the
Archaeological Survey of Canada.
3.2 MAP SHEET 76F - NOSE LAKE 3.2.1 GEOPHYSICAL DATA
NTS map sheet 76F - was field checked and surveyed over a period of two field
seasons, with the eastern portion of the map being checked in the latter portion of the
1996 field season. The western portion was surveyed and sampled in the 1997 field
season. The combination of both field seasons identified 52 eskers and/or esker
segments. As with NTS 76E, some portions of what appear to have been long
connected eskers have been truncated at some point. It is important to note that this
map sheet has fewer truncated eskers. The esker complexes of this map sheet are
primarily long and sinuous with very few breaks or truncations. Many of the eskers run
uninterrupted for several kilometres. The eskers in this region generally trend in a
northwest direction. In the northwest corner of the map sheet, a series of eskers join
together and continue onto map sheet 76E where again they connect to form larger
eskers. The eskers form a classic dendritic drainage pattern of smaller tributaries
flowing together to form larger ones.
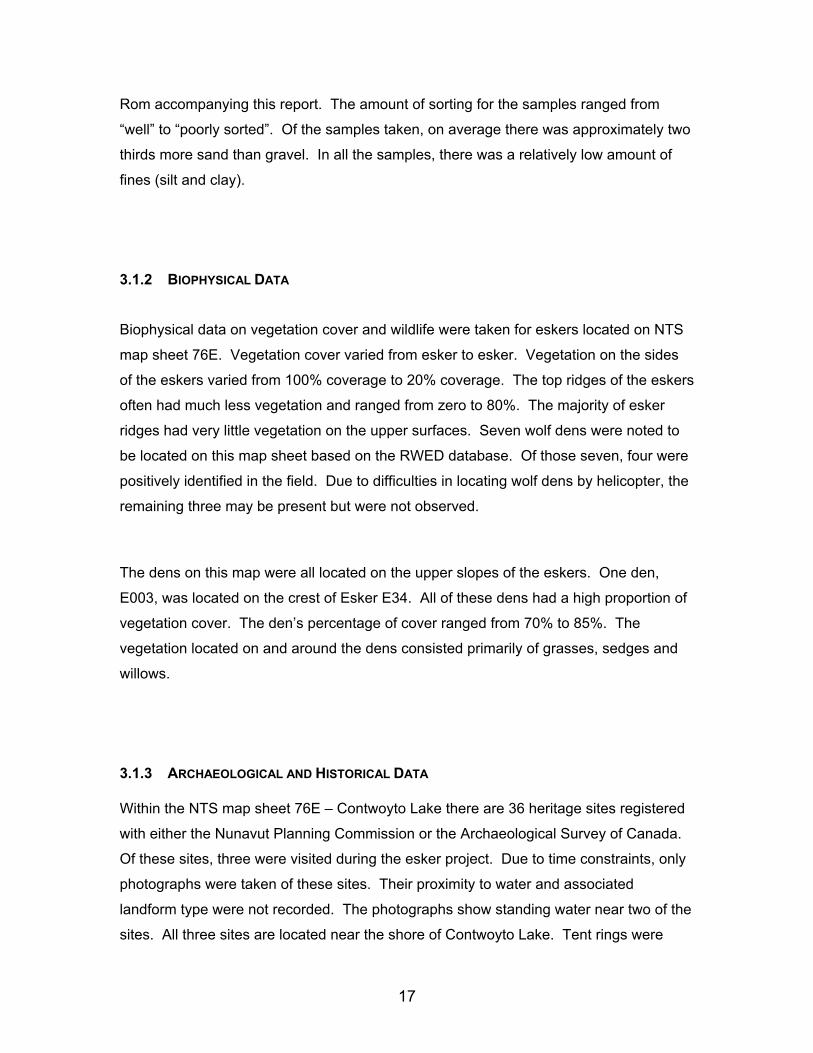
Thirteen sample pits were dug with samples taken with nine samples in 1996 and four
samples in 1997 field season. These samples were analyzed for grain size and
moisture content (MC). Displayed in Table 2 is a chart with the amount of sand and
gravel in each sample, along with the moisture content; all data is displayed as a
percentage of the total sample. The majority of the samples were poorly graded (well
sorted) with a few being well graded (poorly sorted).
19
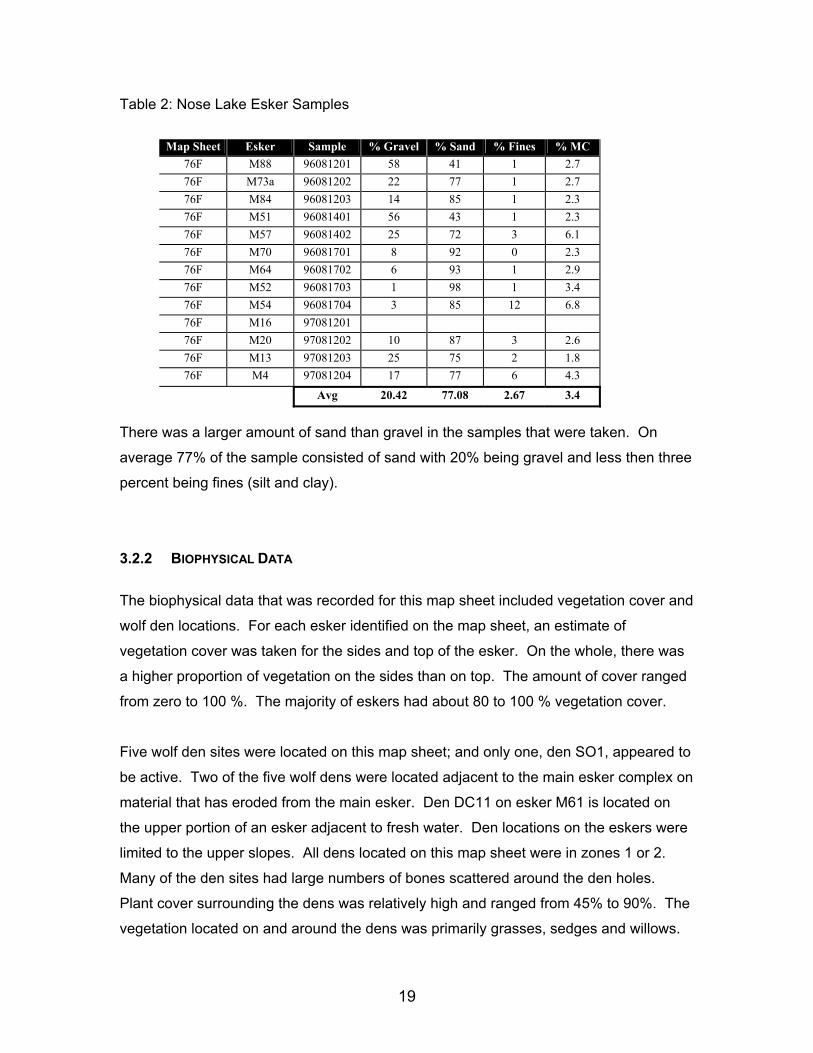
Table 2: Nose Lake Esker Samples
There was a larger amount of sand than gravel in the samples that were taken. On
average 77% of the sample consisted of sand with 20% being gravel and less then three
percent being fines (silt and clay).
3.2.2 BIOPHYSICAL DATA
The biophysical data that was recorded for this map sheet included vegetation cover and
wolf den locations. For each esker identified on the map sheet, an estimate of
vegetation cover was taken for the sides and top of the esker. On the whole, there was
a higher proportion of vegetation on the sides than on top. The amount of cover ranged
from zero to 100 %. The majority of eskers had about 80 to 100 % vegetation cover.
Five wolf den sites were located on this map sheet; and only one, den SO1, appeared to
be active. Two of the five wolf dens were located adjacent to the main esker complex on
material that has eroded from the main esker. Den DC11 on esker M61 is located on
the upper portion of an esker adjacent to fresh water. Den locations on the eskers were
limited to the upper slopes. All dens located on this map sheet were in zones 1 or 2.
Many of the den sites had large numbers of bones scattered around the den holes.
Plant cover surrounding the dens was relatively high and ranged from 45% to 90%. The
vegetation located on and around the dens was primarily grasses, sedges and willows.
Map Sheet Esker Sample % Gravel % Sand % Fines % MC
76F M88 96081201 58 41 1 2.7 76F M73a 96081202 22 77 1 2.7 76F M84 96081203 14 85 1 2.3 76F M51 96081401 56 43 1 2.3 76F M57 96081402 25 72 3 6.1 76F M70 96081701 8 92 0 2.3 76F M64 96081702 6 93 1 2.9 76F M52 96081703 1 98 1 3.4 76F M54 96081704 3 85 12 6.8 76F M16 97081201 76F M20 97081202 10 87 3 2.6 76F M13 97081203 25 75 2 1.8 76F M4 97081204 17 77 6 4.3
Avg 20.42 77.08 2.67 3.4
20
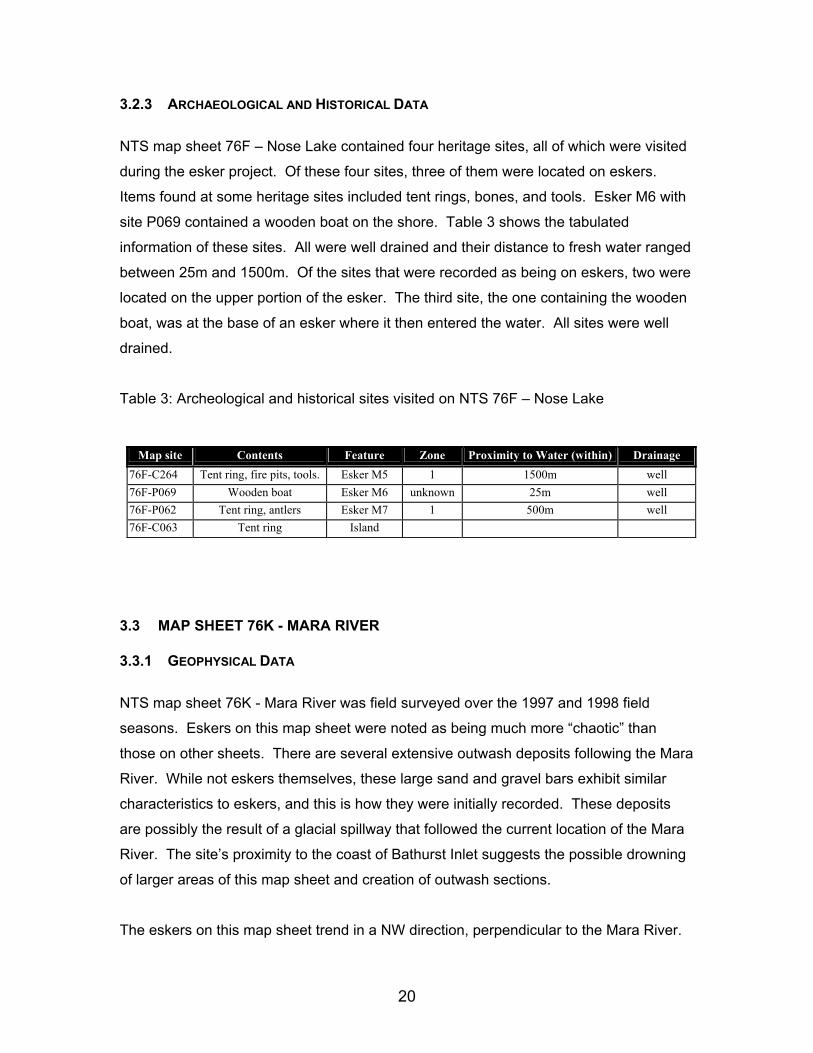
3.2.3 ARCHAEOLOGICAL AND HISTORICAL DATA
NTS map sheet 76F – Nose Lake contained four heritage sites, all of which were visited
during the esker project. Of these four sites, three of them were located on eskers.
Items found at some heritage sites included tent rings, bones, and tools. Esker M6 with
site P069 contained a wooden boat on the shore. Table 3 shows the tabulated
information of these sites. All were well drained and their distance to fresh water ranged
between 25m and 1500m. Of the sites that were recorded as being on eskers, two were
located on the upper portion of the esker. The third site, the one containing the wooden
boat, was at the base of an esker where it then entered the water. All sites were well
drained.
Table 3: Archeological and historical sites visited on NTS 76F – Nose Lake
3.3 MAP SHEET 76K - MARA RIVER 3.3.1 GEOPHYSICAL DATA
NTS map sheet 76K - Mara River was field surveyed over the 1997 and 1998 field
seasons. Eskers on this map sheet were noted as being much more “chaotic” than
those on other sheets. There are several extensive outwash deposits following the Mara
River. While not eskers themselves, these large sand and gravel bars exhibit similar
characteristics to eskers, and this is how they were initially recorded. These deposits
are possibly the result of a glacial spillway that followed the current location of the Mara
River. The site’s proximity to the coast of Bathurst Inlet suggests the possible drowning
of larger areas of this map sheet and creation of outwash sections.
The eskers on this map sheet trend in a NW direction, perpendicular to the Mara River.
Map site Contents Feature Zone Proximity to Water (within) Drainage
76F-C264 Tent ring, fire pits, tools. Esker M5 1 1500m well 76F-P069 Wooden boat Esker M6 unknown 25m well 76F-P062 Tent ring, antlers Esker M7 1 500m well 76F-C063 Tent ring Island
21
A few of the larger eskers in the western portion of the map are approximately twenty
kilometres in length and are fairly unbroken and straight. Twenty-four eskers were
identified on this map sheet and of these, four samples were taken for grain size. All
samples were located on the western portion of the map. The eastern portion of the
map contains significantly fewer eskers and is dominated by outwash plains along the
Mara River.
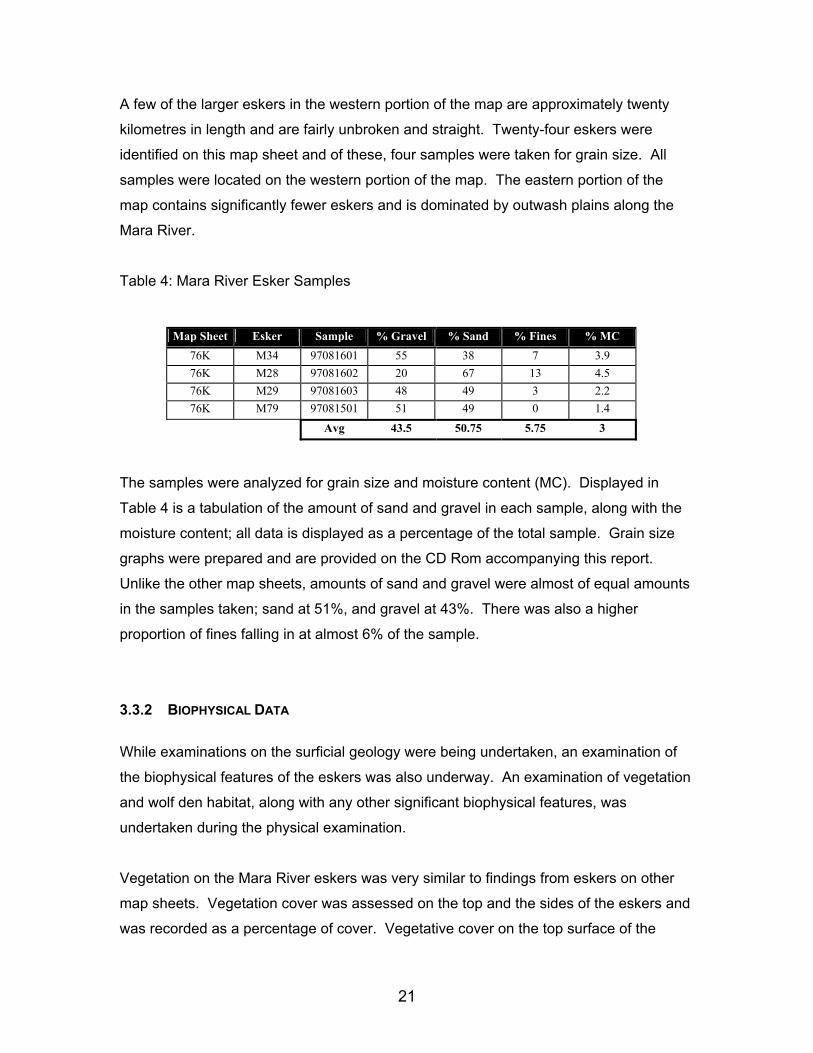
Table 4: Mara River Esker Samples
The samples were analyzed for grain size and moisture content (MC). Displayed in
Table 4 is a tabulation of the amount of sand and gravel in each sample, along with the
moisture content; all data is displayed as a percentage of the total sample. Grain size
graphs were prepared and are provided on the CD Rom accompanying this report.
Unlike the other map sheets, amounts of sand and gravel were almost of equal amounts
in the samples taken; sand at 51%, and gravel at 43%. There was also a higher
proportion of fines falling in at almost 6% of the sample.
3.3.2 BIOPHYSICAL DATA
While examinations on the surficial geology were being undertaken, an examination of
the biophysical features of the eskers was also underway. An examination of vegetation
and wolf den habitat, along with any other significant biophysical features, was
undertaken during the physical examination.
Vegetation on the Mara River eskers was very similar to findings from eskers on other
map sheets. Vegetation cover was assessed on the top and the sides of the eskers and
was recorded as a percentage of cover. Vegetative cover on the top surface of the
Map Sheet Esker Sample % Gravel % Sand % Fines % MC
76K M34 97081601 55 38 7 3.9 76K M28 97081602 20 67 13 4.5 76K M29 97081603 48 49 3 2.2 76K M79 97081501 51 49 0 1.4
Avg 43.5 50.75 5.75 3
22
eskers varied from no vegetation to 85 % cover. Vegetative cover was generally higher
on the sides of the eskers then the vegetation on the top surface; cover ranged from
15% to 100%. Eskers surveyed in the 1998 field season were assessed for both
vegetative cover and type. Esker M5 was the only esker in the Mara River map sheet to
have its vegetation type assessed. The surface of the esker was relatively bare (< 1%
cover) with small grasses being the only vegetation. On the sides of the esker, more
complex plant communities were present such as willow, cranberry, lichens and some
birch. The amount of vegetation increased as it progressed down the esker.
Only one wolf den was located on this map sheet. The den located on esker M28 was
inactive and was located in zone 2 of the esker, relatively close to its top. The
vegetation cover surrounding the den was 30% cover. This den was not located directly
on the main esker complex, but on adjacent granular material.
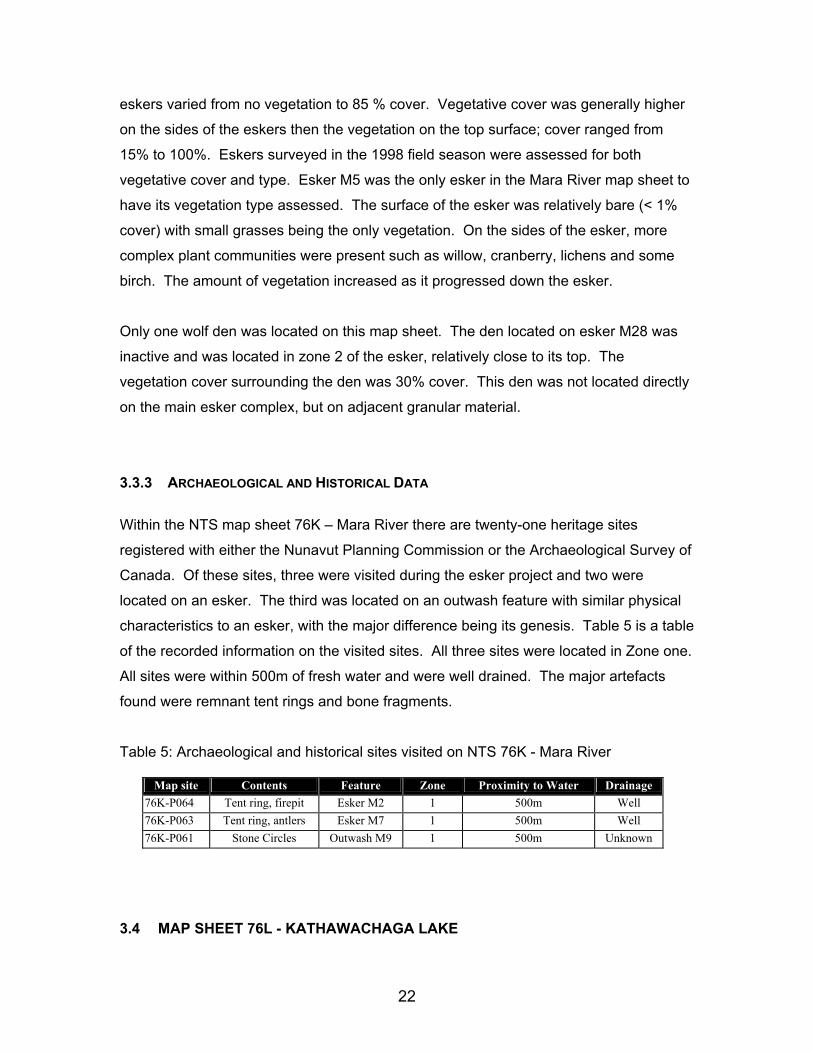
3.3.3 ARCHAEOLOGICAL AND HISTORICAL DATA Within the NTS map sheet 76K – Mara River there are twenty-one heritage sites
registered with either the Nunavut Planning Commission or the Archaeological Survey of
Canada. Of these sites, three were visited during the esker project and two were
located on an esker. The third was located on an outwash feature with similar physical
characteristics to an esker, with the major difference being its genesis. Table 5 is a table
of the recorded information on the visited sites. All three sites were located in Zone one.
All sites were within 500m of fresh water and were well drained. The major artefacts
found were remnant tent rings and bone fragments.
Table 5: Archaeological and historical sites visited on NTS 76K - Mara River
3.4 MAP SHEET 76L - KATHAWACHAGA LAKE
Map site Contents Feature Zone Proximity to Water Drainage 76K-P064 Tent ring, firepit Esker M2 1 500m Well 76K-P063 Tent ring, antlers Esker M7 1 500m Well 76K-P061 Stone Circles Outwash M9 1 500m Unknown
23
3.4.1 GEOPHYSICAL DATA
NTS Map sheet 76L - Kathawachaga Lake was field surveyed in the 1997 field season
with two samples being taken in the late portion of the 1996 season. This survey
identified seventy-six eskers for this region. The eskers are oriented in a NW-SE
direction. Many eskers on this map sheet are the terminus of eskers on map sheets
76E, F, and K. The eskers in the southeastern portion of the map sheet are broader
eskers and less segmented. Four esker complexes located in the center portion of the
map appear to run perpendicular to the other eskers on the map sheet. This orientation
change may be due to the change in meltwater flow direction towards the Bathurst Inlet.
The western portion of the map contains relatively small-beaded eskers that are around
500 meters to a kilometer long. Esker M39 appears to be an esker fan complex, but
further field examination would be needed to examine its bedforms.
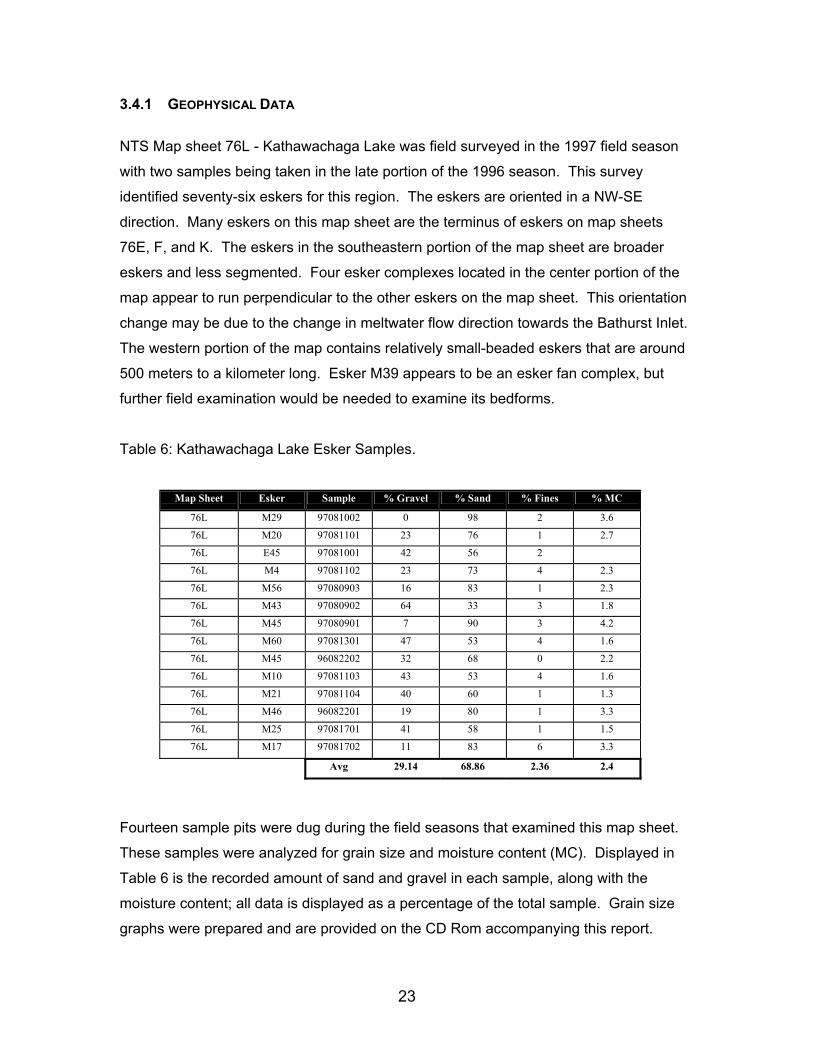
Table 6: Kathawachaga Lake Esker Samples.
Fourteen sample pits were dug during the field seasons that examined this map sheet.
These samples were analyzed for grain size and moisture content (MC). Displayed in
Table 6 is the recorded amount of sand and gravel in each sample, along with the
moisture content; all data is displayed as a percentage of the total sample. Grain size
graphs were prepared and are provided on the CD Rom accompanying this report.
Map Sheet Esker Sample % Gravel % Sand % Fines % MC
76L M29 97081002 0 98 2 3.6
76L M20 97081101 23 76 1 2.7
76L E45 97081001 42 56 2
76L M4 97081102 23 73 4 2.3
76L M56 97080903 16 83 1 2.3
76L M43 97080902 64 33 3 1.8
76L M45 97080901 7 90 3 4.2
76L M60 97081301 47 53 4 1.6
76L M45 96082202 32 68 0 2.2
76L M10 97081103 43 53 4 1.6
76L M21 97081104 40 60 1 1.3
76L M46 96082201 19 80 1 3.3
76L M25 97081701 41 58 1 1.5
76L M17 97081702 11 83 6 3.3
Avg 29.14 68.86 2.36 2.4
24
Sand was the major component of the samples taken averaging 69%. Gravel accounted
for 29% and the remaining two per cent consisted of silt and clay.
3.4.2 BIOPHYSICAL DATA
While examinations of the surficial geology were being undertaken, an examination of
the biophysical features was also underway, including an examination of vegetation and
wolf den habitat, along with any other significant biophysical features.
Vegetation was assessed on the tops and sides of the eskers as a cover percentage.
The amount of vegetation on the tops of the Kathawachaga Lake eskers ranged from
1% to 100% cover. The average amount of cover was approximately 50%. The
vegetation on the sides of the esker ranged from zero to 100% cover. Generally, more
vegetation was recorded on the sides of the eskers than on the top surface. The
average amount of vegetation cover on the sides of the eskers was approximately 70%
to 80%. Species identified included lichens, grasses and cranberry.
Two wolf dens were located and catalogued on this map sheet. Two dens were not
found, although the probable locations of these sites were recorded. Den DC5 was not
located on an esker but was located on similar granular material. This den location had
a high amount of surrounding vegetation, with approximately 90% cover.
3.4.3 ARCHAEOLOGICAL AND HISTORICAL DATA
NTS map sheet 76L – Kathawachaga Lake is located within the study area and
represents one of the richest map sheets in terms of identified heritage sites. Fifty-
seven heritage sites were registered with either the Nunavut Planning Commission or
the Archaeological Survey of Canada on this map sheet. Of these, sixteen sites were
visited during the esker project. Eleven of the sixteen sites are located on eskers, with
all but one site being located in Zone 1 of the esker. Site P066 on esker M1 was located
at the base of the esker, on a well-drained site 500m from a fresh water source. Six of
the esker sites were located within 500 m of fresh water. One was located at 750m from
25
a water source and three within a distance of 1000m. Site P058 was visited but was
located on an outwash feature with similar physical characteristics to local eskers.
contains information on the information collected at the visited sites.
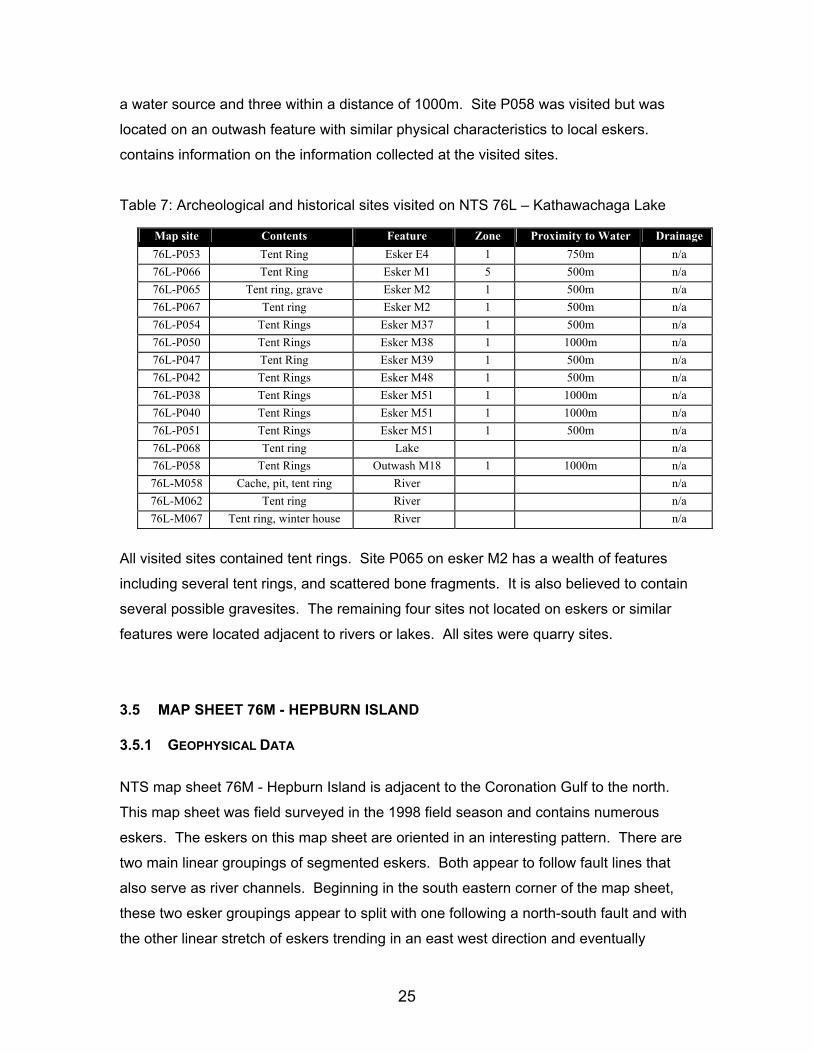
Table 7: Archeological and historical sites visited on NTS 76L – Kathawachaga Lake
All visited sites contained tent rings. Site P065 on esker M2 has a wealth of features
including several tent rings, and scattered bone fragments. It is also believed to contain
several possible gravesites. The remaining four sites not located on eskers or similar
features were located adjacent to rivers or lakes. All sites were quarry sites.
3.5 MAP SHEET 76M - HEPBURN ISLAND 3.5.1 GEOPHYSICAL DATA
NTS map sheet 76M - Hepburn Island is adjacent to the Coronation Gulf to the north.
This map sheet was field surveyed in the 1998 field season and contains numerous
eskers. The eskers on this map sheet are oriented in an interesting pattern. There are
two main linear groupings of segmented eskers. Both appear to follow fault lines that
also serve as river channels. Beginning in the south eastern corner of the map sheet,
these two esker groupings appear to split with one following a north-south fault and with
the other linear stretch of eskers trending in an east west direction and eventually
Map site Contents Feature Zone Proximity to Water Drainage 76L-P053 Tent Ring Esker E4 1 750m n/a 76L-P066 Tent Ring Esker M1 5 500m n/a 76L-P065 Tent ring, grave Esker M2 1 500m n/a 76L-P067 Tent ring Esker M2 1 500m n/a 76L-P054 Tent Rings Esker M37 1 500m n/a 76L-P050 Tent Rings Esker M38 1 1000m n/a 76L-P047 Tent Ring Esker M39 1 500m n/a 76L-P042 Tent Rings Esker M48 1 500m n/a 76L-P038 Tent Rings Esker M51 1 1000m n/a 76L-P040 Tent Rings Esker M51 1 1000m n/a 76L-P051 Tent Rings Esker M51 1 500m n/a 76L-P068 Tent ring Lake n/a 76L-P058 Tent Rings Outwash M18 1 1000m n/a 76L-M058 Cache, pit, tent ring River n/a 76L-M062 Tent ring River n/a 76L-M067 Tent ring, winter house River n/a
26
curving north. The eskers on this map sheet are segmented with few eskers running
unbroken for more than ten kilometres. Forty-eight individual eskers were identified on
the Hepburn Island map sheet.
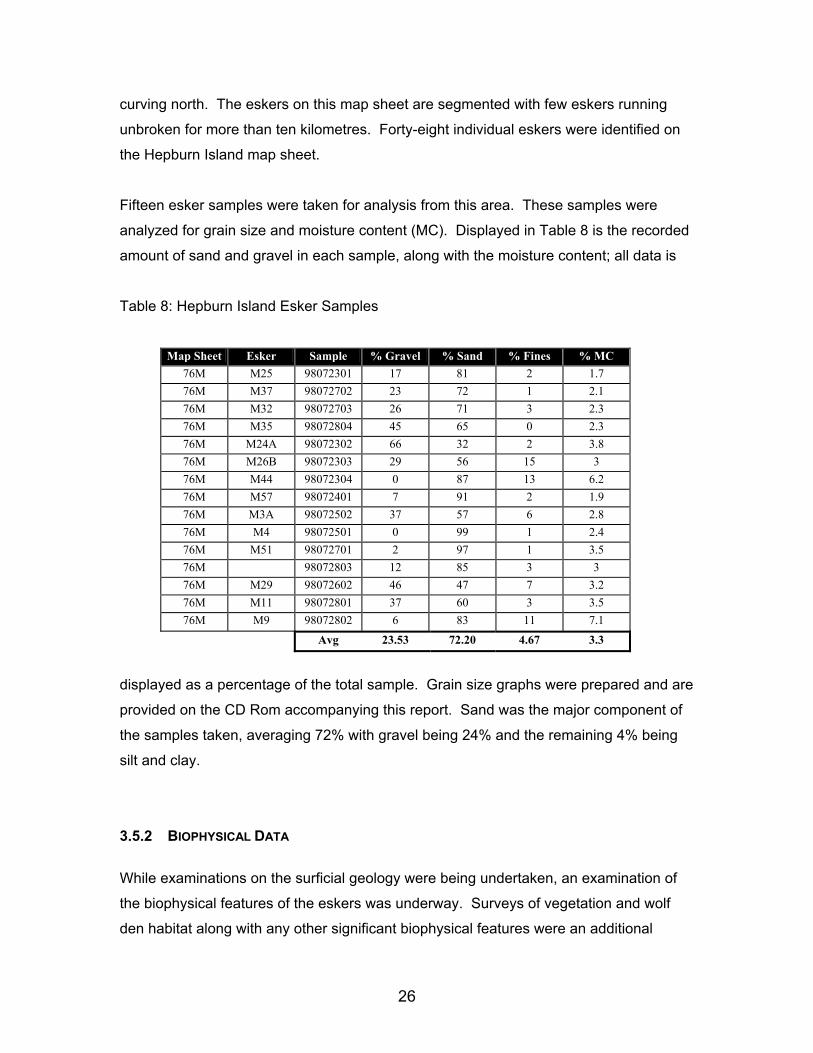
Fifteen esker samples were taken for analysis from this area. These samples were
analyzed for grain size and moisture content (MC). Displayed in Table 8 is the recorded
amount of sand and gravel in each sample, along with the moisture content; all data is
Table 8: Hepburn Island Esker Samples
displayed as a percentage of the total sample. Grain size graphs were prepared and are
provided on the CD Rom accompanying this report. Sand was the major component of
the samples taken, averaging 72% with gravel being 24% and the remaining 4% being
silt and clay.
3.5.2 BIOPHYSICAL DATA
While examinations on the surficial geology were being undertaken, an examination of
the biophysical features of the eskers was underway. Surveys of vegetation and wolf
den habitat along with any other significant biophysical features were an additional
Map Sheet Esker Sample % Gravel % Sand % Fines % MC
76M M25 98072301 17 81 2 1.7 76M M37 98072702 23 72 1 2.1 76M M32 98072703 26 71 3 2.3 76M M35 98072804 45 65 0 2.3 76M M24A 98072302 66 32 2 3.8 76M M26B 98072303 29 56 15 3 76M M44 98072304 0 87 13 6.2 76M M57 98072401 7 91 2 1.9 76M M3A 98072502 37 57 6 2.8 76M M4 98072501 0 99 1 2.4 76M M51 98072701 2 97 1 3.5 76M 98072803 12 85 3 3 76M M29 98072602 46 47 7 3.2 76M M11 98072801 37 60 3 3.5 76M M9 98072802 6 83 11 7.1
Avg 23.53 72.20 4.67 3.3
27
priority. During the 1998 field season, vegetation information was recorded as a percent
cover on the top and sides of the esker along with a survey of vegetation species in
these areas.
The ground cover on the top of the eskers ranged from 10% to 95% cover. The average
amount of vegetation cover for this esker map sheet was 39.3% cover. Vegetation on
the side slopes of the eskers ranged from one-percent ground cover to complete 100%
cover. The average amount of cover was 54.4 % for the esker slopes. Relatively few
species of plants were discovered growing on the eskers. The majority of species found
were lichen and mosses, grasses, birch and willow shrubs, and various berry bushes
including blue berries and cranberries.
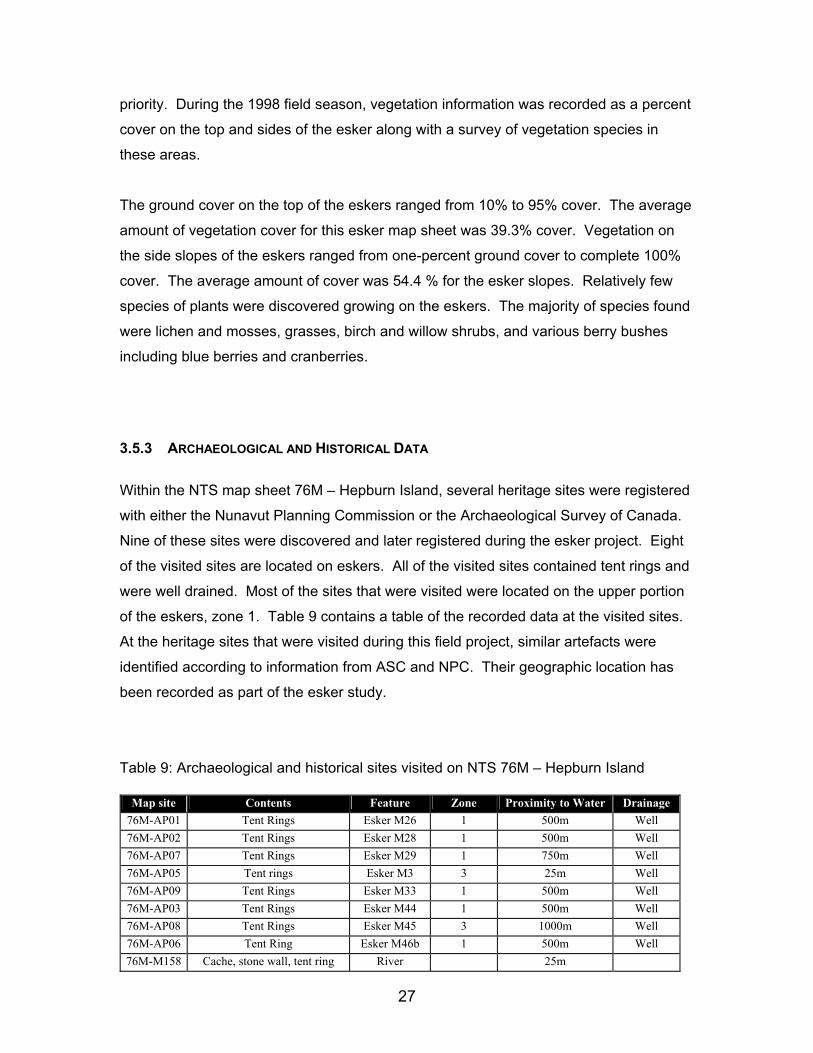
3.5.3 ARCHAEOLOGICAL AND HISTORICAL DATA
Within the NTS map sheet 76M – Hepburn Island, several heritage sites were registered
with either the Nunavut Planning Commission or the Archaeological Survey of Canada.
Nine of these sites were discovered and later registered during the esker project. Eight
of the visited sites are located on eskers. All of the visited sites contained tent rings and
were well drained. Most of the sites that were visited were located on the upper portion
of the eskers, zone 1. Table 9 contains a table of the recorded data at the visited sites.
At the heritage sites that were visited during this field project, similar artefacts were
identified according to information from ASC and NPC. Their geographic location has
been recorded as part of the esker study.
Table 9: Archaeological and historical sites visited on NTS 76M – Hepburn Island
Map site Contents Feature Zone Proximity to Water Drainage 76M-AP01 Tent Rings Esker M26 1 500m Well 76M-AP02 Tent Rings Esker M28 1 500m Well 76M-AP07 Tent Rings Esker M29 1 750m Well 76M-AP05 Tent rings Esker M3 3 25m Well 76M-AP09 Tent Rings Esker M33 1 500m Well 76M-AP03 Tent Rings Esker M44 1 500m Well 76M-AP08 Tent Rings Esker M45 3 1000m Well 76M-AP06 Tent Ring Esker M46b 1 500m Well 76M-M158 Cache, stone wall, tent ring River 25m
28
3.6 MAP SHEET 76N - ARCTIC SOUND 3.6.1 GEOPHYSICAL DATA
NTS map sheet 76N - Arctic Sound was field checked during the final summer field
season in 1998. This map sheet covers an area bordered on the north by the
Coronation Gulf and on the east by Bathurst Inlet. During this project, 78 landforms
were identified. These included eskers, outwash plains and beach formations. Of these
landforms, 47 were identified as eskers. The eskers on this map sheet trend in a north
south direction and are predominantly located in the western portion of the map sheet.
There is one lone esker located on the eastern portion of the Arctic Sound area. The
eskers are mostly short-segmented eskers not exceeding five kilometres in length.
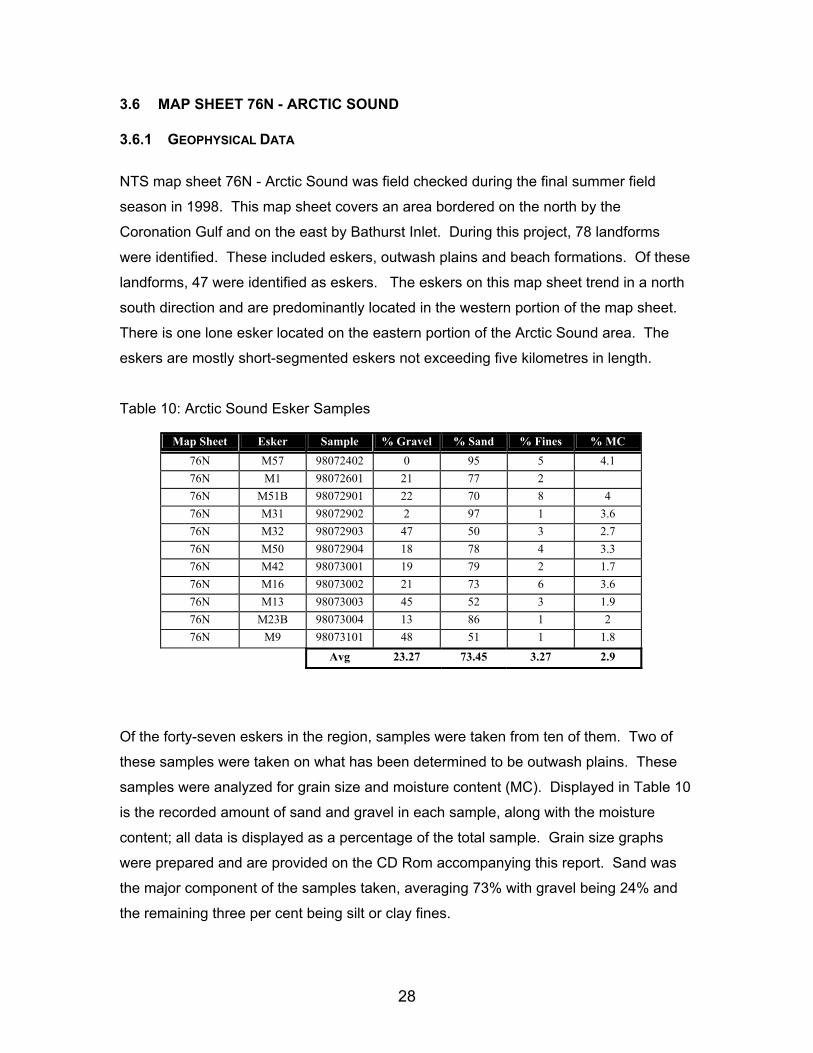
Table 10: Arctic Sound Esker Samples
Of the forty-seven eskers in the region, samples were taken from ten of them. Two of
these samples were taken on what has been determined to be outwash plains. These
samples were analyzed for grain size and moisture content (MC). Displayed in Table 10
is the recorded amount of sand and gravel in each sample, along with the moisture
content; all data is displayed as a percentage of the total sample. Grain size graphs
were prepared and are provided on the CD Rom accompanying this report. Sand was
the major component of the samples taken, averaging 73% with gravel being 24% and
the remaining three per cent being silt or clay fines.
Map Sheet Esker Sample % Gravel % Sand % Fines % MC 76N M57 98072402 0 95 5 4.1 76N M1 98072601 21 77 2 76N M51B 98072901 22 70 8 4 76N M31 98072902 2 97 1 3.6 76N M32 98072903 47 50 3 2.7 76N M50 98072904 18 78 4 3.3 76N M42 98073001 19 79 2 1.7 76N M16 98073002 21 73 6 3.6 76N M13 98073003 45 52 3 1.9 76N M23B 98073004 13 86 1 2 76N M9 98073101 48 51 1 1.8
Avg 23.27 73.45 3.27 2.9
29
3.6.2 BIOPHYSICAL DATA
While examinations of the surficial geology were being undertaken, an examination of
the biophysical features was performed. Surveys of vegetation and wolf den habitat
along with any other significant biophysical features were an additional priority. During
the 1998 field season, vegetation information was recorded as a percent cover on the
top and sides of the esker along with a survey of vegetation species in these areas.
The amount of vegetation cover on the top of the eskers ranged from zero to 90% cover.
The average amount of vegetation cover for this esker map sheet was 30.4% cover.
The vegetation cover for the sides of the eskers ranged from no vegetation to 95%
cover. The average amount of cover was 39.9%. Few species of plants were
discovered growing on the eskers. The major species that were found were; lichen and
mosses, grasses, birch and willow shrubs, and various berry bushes.
Two wolf den sites were located on this map sheet. Den AD01 on esker M57 was an
inactive den site with 75% ground cover. Den AD02 was not located on an esker but
instead on an outwash plain. At this site, the ground cover was 80%. At this den, one
white adult wolf was spotted moving towards denser vegetation and, possibly, a den site.
3.6.3 ARCHAEOLOGICAL AND HISTORICAL DATA
Within the NTS map sheet 76N – Arctic Sound there are 18 heritage sites registered with
either the Nunavut Planning Commission or the Archaeological Survey of Canada. Of
these sites, nine were visited during the esker project. Of these nine sites, two are
located on esker M53; these sites are the only visited sites located on eskers. The
remaining sites located on the coastline, along rivers or on the tundra, contained a
variety of artefacts.
Sites AP10 and C105, both located on esker M53, contained several tent rings and
some possible gravesites. Both sites contained a variety of modern debris including gun
and stovepipe fragments. Both sites were well drained and were located between 500
and 1000m of fresh water. Site AP04 was located mid-way on the slopes of the esker in
zone 3; this is the site containing the possible gravesites. Site C105 was located higher
30
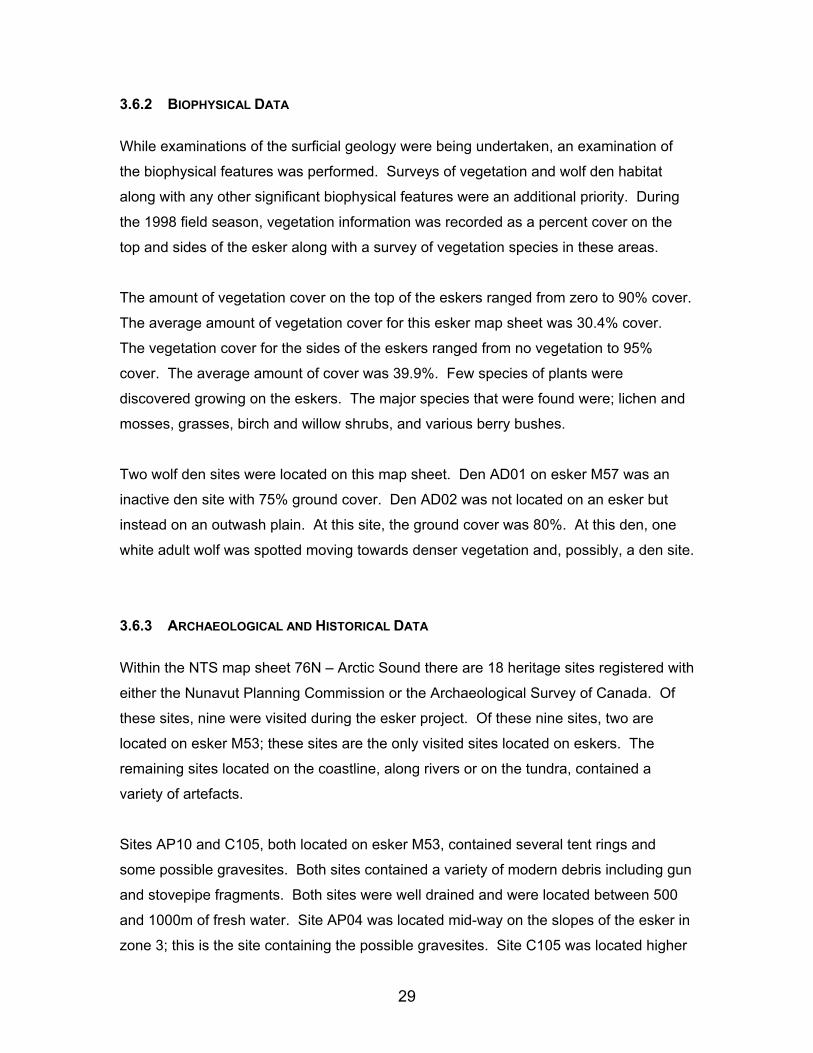
up the esker in Zone 1. Table 11 contains the recorded data for the visited sites.
Table 11: Archaeological and historical sites visited on NTS 76N – Arctic Sound
3.7 MAP SHEET 86P KIKERK LAKE 3.7.1 GEOPHYSICAL DATA
NTS map sheet 86P was field checked in the 1998 summer field season. Very few
eskers were found on this map sheet. Twenty-one features were recorded for the digital
database with only 10 of them being eskers. On the eastern portion, a series of ridge
features were recorded as eskers during the preliminary stages of the project. These
ridge formations are actually bedrock outcrops that run in a long ridge form, similar to the
shape of an esker. It is interesting to note the general lack of esker formations on this
map sheet. The eskers that were identified on this map trend in a north south direction.
There are no large esker complexes on this map sheet. The eskers tend to be individual
structures and are not grouped or connecting, as are on some other map sheets.
One sample pit was dug on this map sheet. It was located on the eastern portion of the
map sheet near the boundary between Proterozoic sedimentary rocks and Achaean
igneous formations. The sample was found to have higher levels of gravel (69%) than
other esker deposits in the study area. The sample consisted of 20% sand and 11%
fines (silt and clay). The percentages are given as a percentage of the total sample.
Moisture content was not recorded for this sample.
Map site Contents Feature Zone Proximity to Water Drainage
76N-AP04 Tent rings and burials Esker M53 3 1000m Well 76N-C105 Cache, tent ring Esker M53 1 500m Well 76N-AP10 Tent rings, Historic debris Coast 76N-M153 Tent ring Coast 76N-C080 Tent ring Delta 76N-AP11 Tent rings Land 500m 76N-M140 Blind, cache, inuksuk, tent ring Land 76N-C106 Cache, tent ring River
31
3.7.2 BIOPHYSICAL DATA
NTS map sheet 86P– Kikerk Lake was field checked in the 1998 summer field season.
While examinations on the surficial geology were being undertaken, an examination of
the biophysical features of the eskers was being done. Surveys of vegetation and wolf
den habitat along with any other significant biophysical features were an additional
priority. Due to time restraints and the limited number of eskers on this map sheet, only
a limited number of eskers were surveyed.
Eleven eskers were surveyed on this map sheet for vegetation cover. No record of
vegetation type was recorded. Of the eskers surveyed, the amount of ground cover on
esker slopes ranged from 35% to 95% cover; the average cover was 65.5%. The tops of
the eskers had very similar recordings with a range from 30% to 100% and an average
slightly higher then the sides at 65.9%.
Only one wolf den was identified on this map sheet and only it’s location was recorded.
3.7.3 ARCHAEOLOGICAL AND HISTORICAL DATA
Time constraints and the scope of the project did not allow for the investigation of any
archaeological or historical sites for this map sheet.
3.8 MAP SHEET 86O COPPERMINE
3.8.1 GEOPHYSICAL DATA
NTS 86O - Coppermine is the final map sheet surveyed in this project. Field surveyed in
the summer of 1998, this map sheet has some interesting surficial geology. The eastern
portion of the map sheet contains some very long outwash and deltaic features. There
is also a long series of segmented or beaded eskers running parallel to the outwash
feature. The landforms in this area trend in a north-south direction. In the north section
of the map sheet there is a large escarpment that slopes down towards Coronation Gulf.
At the base of this ridge, there is a series of eskers that run perpendicularly, east to
32
west. In total there are twenty-two esker formations on this map sheet, most of which
are segmented bodies of a larger esker complex. A more detailed description of the
eskers and surrounding terrain can be found on the GSC Open File 3076 (St-Onge
1995).
Of the twenty-two eskers on the map sheet, two esker samples were taken. One of
these samples, sample 98071002, was later determined to be from an outwash feature.
Sand was the major component of the esker sample, consisting of 55%. Gravel was
existed at 41% and the remaining four per cent was made up of silt and clay. The
moisture content of the sample was 2.6%.
3.8.2 BIOPHYSICAL DATA
While examinations on the surficial geology were being undertaken an examination of
the biophysical features was performed. Surveys of vegetation and wolf den habitat
along with any other significant biophysical features were an additional priority.
Twenty-six eskers were surveyed on this map sheet for vegetation cover. No record of
vegetation type was recorded. Of the eskers surveyed, the amount of ground cover on
the eskers slopes ranged from 10% to 100%. The average cover was 74.4%. The tops
of the eskers had very similar recordings with a range from 5% to 100% and an average
slightly lower then the sides at 66.5%.
Only one wolf den was identified on this map sheet and only it’s location was recorded.
3.8.3 ARCHAEOLOGICAL AND HISTORICAL DATA
Time constraints and the scope of the project did not allow for the investigation of any
archaeological and historical data for this map sheet.
33
4 RESULTS
4.1 GEOPHYSICAL RESULTS
Upon completion of the three summers of field truthing and data gathering, 373 eskers
spanning eight NTS map sheets have been identified. Seventy-six granular samples
have been taken and analyzed. Data has been gathered from GSC publications,
journals, and geophysical reports. This project has created a picture of the orientation,
structure and composition of the eskers in this portion of the Slave Geological Province.
Through understanding the Slave eskers, their importance to the arctic ecosystem can
be determined along with how they can be utilized and managed.
In terms of location and orientation of eskers, many of the findings in this report are
similar to the findings of several GSC publications. The GSC has done extensive
surficial geology research in many of the map areas surrounding this study area
(Dredge, et al. 1996a, 1996b, 1998; St-Onge 1995; Kerr, et al. 1995a, 1995b, 1996,
1997a, 1997b; Ward, et al. 1995, 1997; Kerr and Knight 1998). The GSC investigations
used esker orientation and other evidence such as glacial striations, gravel fabrics, and
other meltwater indicators to determine glacial history. Whenever possible, the GSC’s
maps and glacial interpretation were used in this report.
4.1.1 ESKER MORPHOLOGY
Many of the long esker complexes further to the south run for 50 to 100 kilometres
showing similar characteristics to a dendritic drainage pattern. Smaller portions of an
esker link together forming larger, wider eskers, like the tributaries of a river branching
together to form a larger river.
There are very few eskers in the Kikerk area. The bedrock of this region is very ridged
and fractured. The topography of the area is very erratic and hilly. This area is
informally known as the “hole in the donut” because of its lack of granular material
(Traynor 1999). The physical characteristics of this map sheet limited the number of
eskers that formed here.
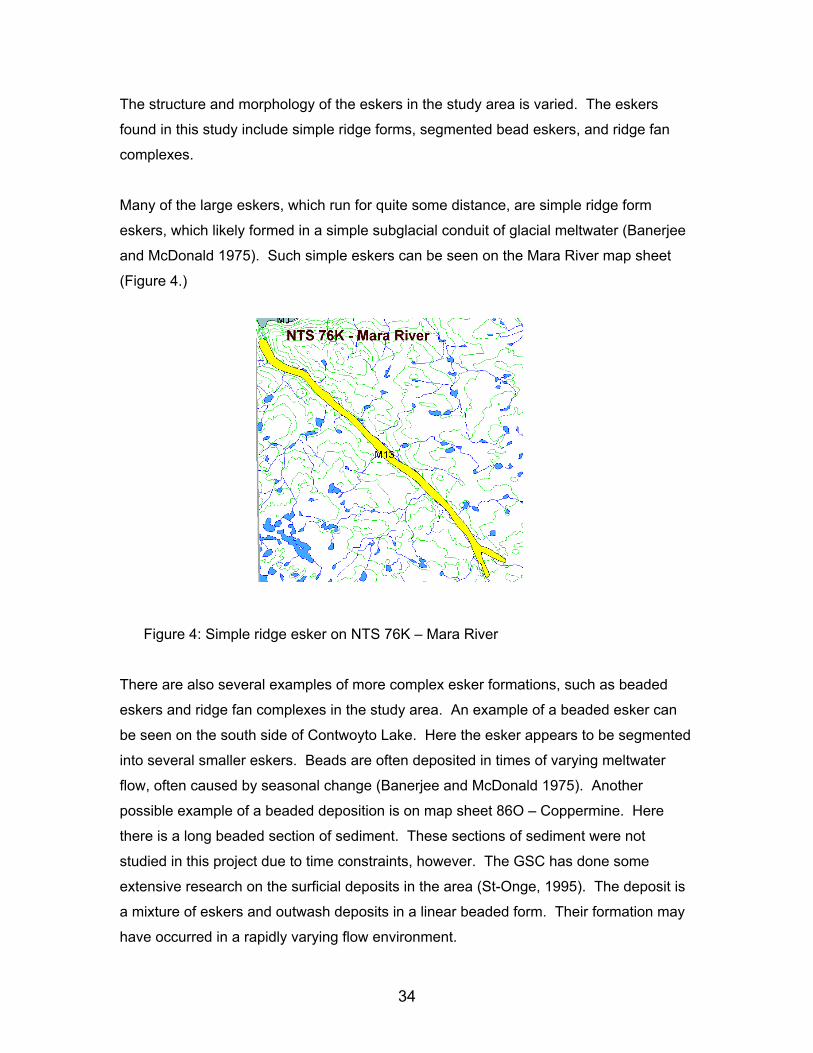
34
The structure and morphology of the eskers in the study area is varied. The eskers
found in this study include simple ridge forms, segmented bead eskers, and ridge fan
complexes.
Many of the large eskers, which run for quite some distance, are simple ridge form
eskers, which likely formed in a simple subglacial conduit of glacial meltwater (Banerjee
and McDonald 1975). Such simple eskers can be seen on the Mara River map sheet
(Figure 4.)
Figure 4: Simple ridge esker on NTS 76K – Mara River
There are also several examples of more complex esker formations, such as beaded
eskers and ridge fan complexes in the study area. An example of a beaded esker can
be seen on the south side of Contwoyto Lake. Here the esker appears to be segmented
into several smaller eskers. Beads are often deposited in times of varying meltwater
flow, often caused by seasonal change (Banerjee and McDonald 1975). Another
possible example of a beaded deposition is on map sheet 86O – Coppermine. Here
there is a long beaded section of sediment. These sections of sediment were not
studied in this project due to time constraints, however. The GSC has done some
extensive research on the surficial deposits in the area (St-Onge, 1995). The deposit is
a mixture of eskers and outwash deposits in a linear beaded form. Their formation may
have occurred in a rapidly varying flow environment.
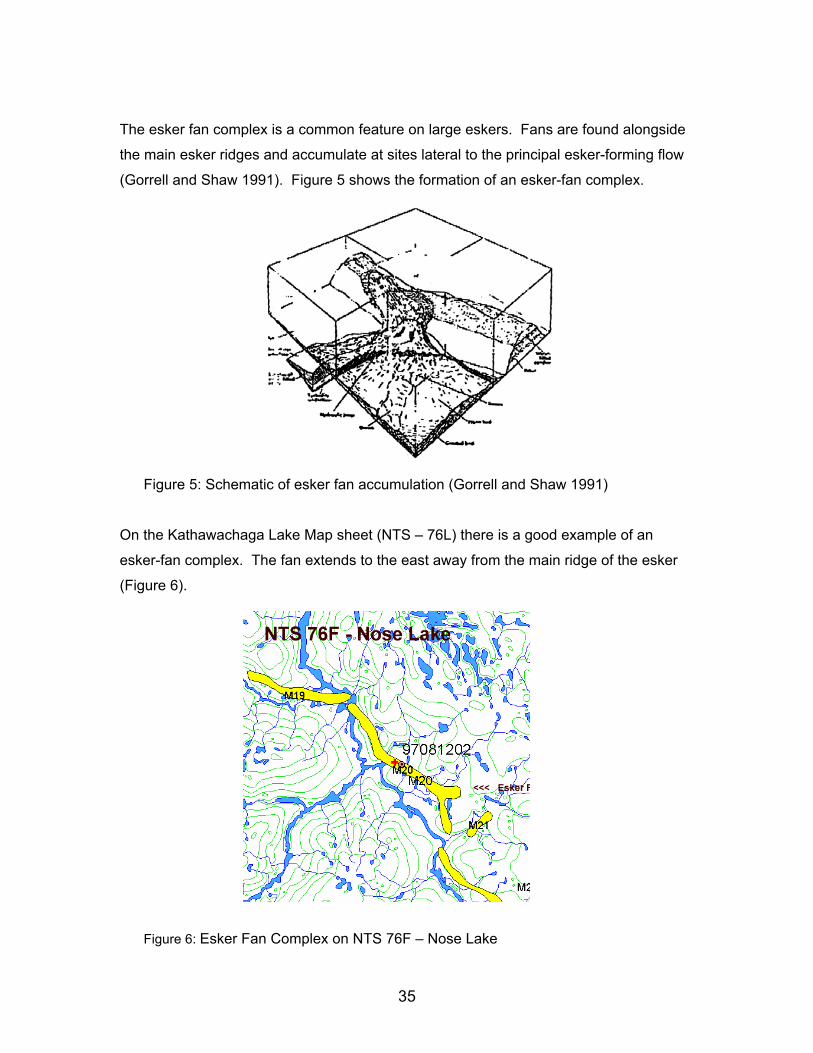
35
The esker fan complex is a common feature on large eskers. Fans are found alongside
the main esker ridges and accumulate at sites lateral to the principal esker-forming flow
(Gorrell and Shaw 1991). Figure 5 shows the formation of an esker-fan complex.
Figure 5: Schematic of esker fan accumulation (Gorrell and Shaw 1991)
On the Kathawachaga Lake Map sheet (NTS – 76L) there is a good example of an
esker-fan complex. The fan extends to the east away from the main ridge of the esker
(Figure 6).
Figure 6: Esker Fan Complex on NTS 76F – Nose Lake
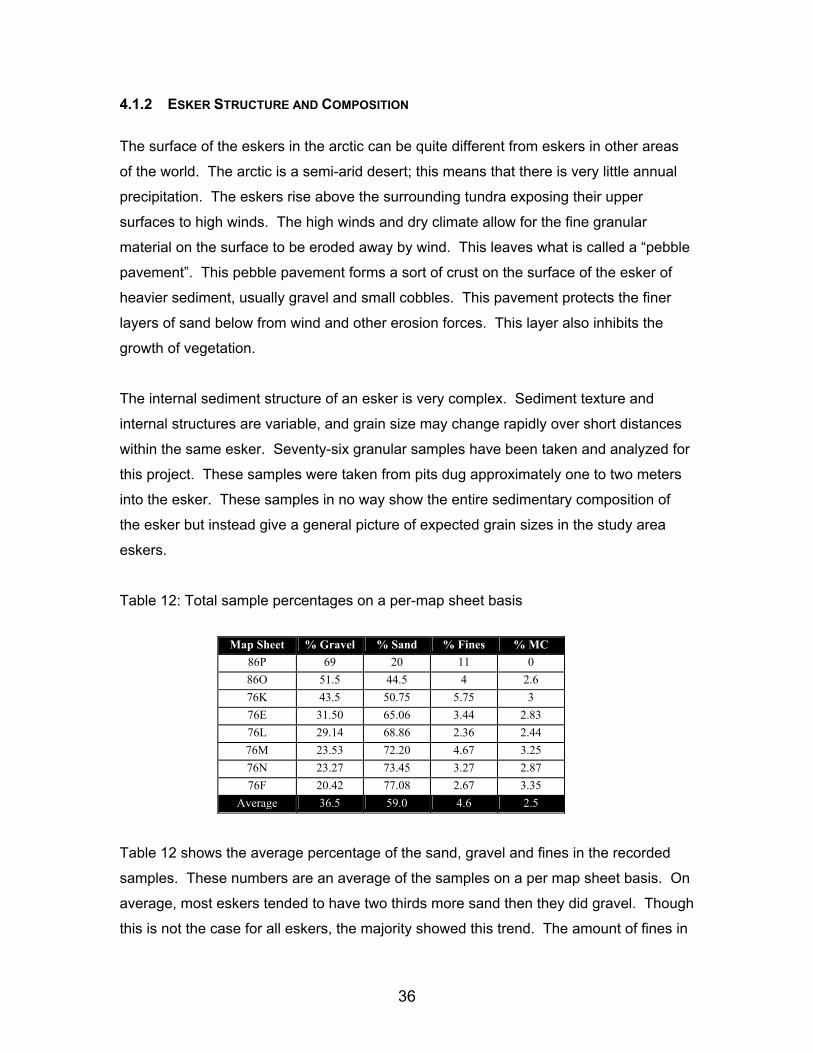
36
4.1.2 ESKER STRUCTURE AND COMPOSITION
The surface of the eskers in the arctic can be quite different from eskers in other areas
of the world. The arctic is a semi-arid desert; this means that there is very little annual
precipitation. The eskers rise above the surrounding tundra exposing their upper
surfaces to high winds. The high winds and dry climate allow for the fine granular
material on the surface to be eroded away by wind. This leaves what is called a “pebble
pavement”. This pebble pavement forms a sort of crust on the surface of the esker of
heavier sediment, usually gravel and small cobbles. This pavement protects the finer
layers of sand below from wind and other erosion forces. This layer also inhibits the
growth of vegetation.
The internal sediment structure of an esker is very complex. Sediment texture and
internal structures are variable, and grain size may change rapidly over short distances
within the same esker. Seventy-six granular samples have been taken and analyzed for
this project. These samples were taken from pits dug approximately one to two meters
into the esker. These samples in no way show the entire sedimentary composition of
the esker but instead give a general picture of expected grain sizes in the study area
eskers.
Table 12: Total sample percentages on a per-map sheet basis
Table 12 shows the average percentage of the sand, gravel and fines in the recorded
samples. These numbers are an average of the samples on a per map sheet basis. On
average, most eskers tended to have two thirds more sand then they did gravel. Though
this is not the case for all eskers, the majority showed this trend. The amount of fines in
Map Sheet % Gravel % Sand % Fines % MC 86P 69 20 11 0 86O 51.5 44.5 4 2.6 76K 43.5 50.75 5.75 3 76E 31.50 65.06 3.44 2.83 76L 29.14 68.86 2.36 2.44 76M 23.53 72.20 4.67 3.25 76N 23.27 73.45 3.27 2.87 76F 20.42 77.08 2.67 3.35
Average 36.5 59.0 4.6 2.5

37
the samples varied slightly per map sheet but there was not a great deal of variation.
The moisture content of the esker samples remained relatively constant at 2.5% by
volume. There is no correlation between soil moisture and the amount of fines in a
sample. The majority of fines in these eskers were silt, with very little clay, and there
was little ability for the retention of soil moisture. This, in combination with elevated
positions of eskers relative to the surrounding topography contributed to the fact that the
eskers were generally well drained.
The granular investigation undertaken in this esker project has created a database of
maps, samples, and photos that can allow for further research in the future. The data
that has been collected and analyzed is a beginning to further research and shows what
the esker has to offer as a granular resource.
4.2 BIOPHYSICAL RESULTS
Three hundred forty two eskers were surveyed for vegetation cover. Though the method
of vegetation surveying changed through the three summer field seasons, each esker
was surveyed for a percentage of plant cover on the sides and the top surface of the
esker. Table 13 contains the averages of the plant covers on a per map sheet basis.
These values are determined though averaging the percent values of each esker within
a given map sheet. The trend for these arctic eskers is for the top surface to have far
less vegetation then the sides of the esker.
Table 13: Average percentage of plant cover on sides and top of eskers on a per-map
sheet basis
Map Sheet SURVEG_SID SURVEG_TOP
86P 65.5 42.4 86O 74.4 65.9 76K 51.9 39.3 76E 72.9 31.7 76L 54.8 31.8 76M 54.4 30.4 76N 39.9 66.5 76F 69.8 36.6
Average 60.5 43.1
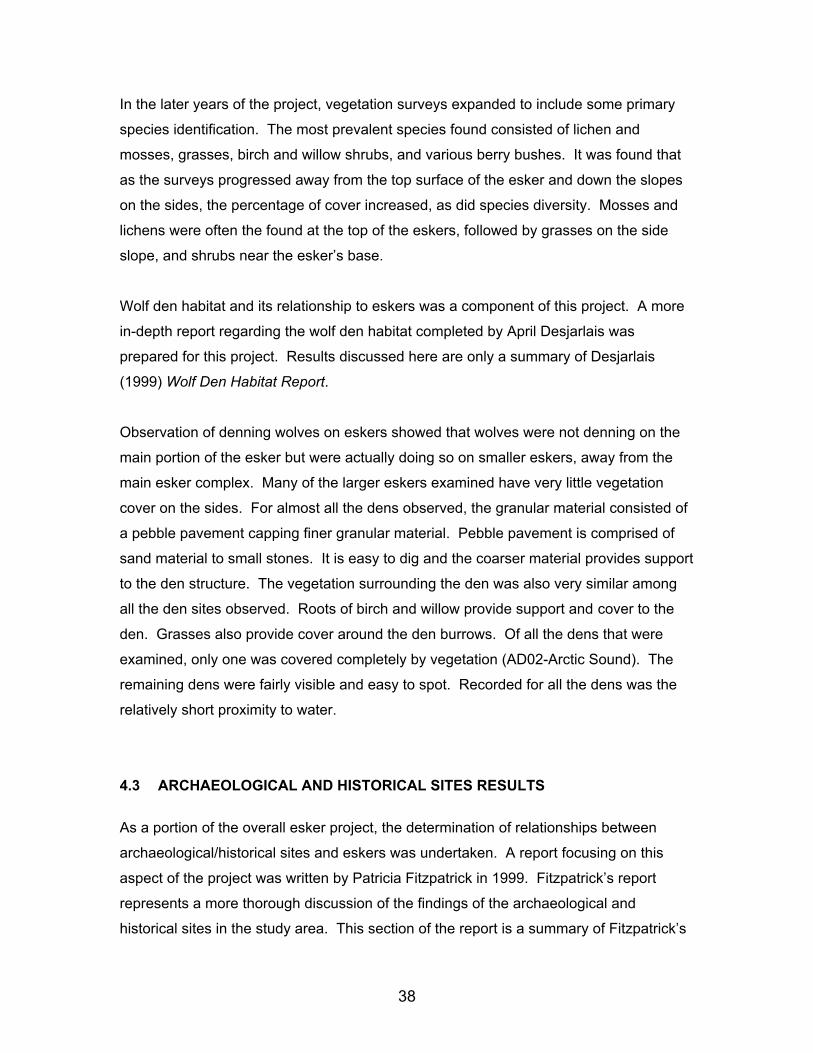
38
In the later years of the project, vegetation surveys expanded to include some primary
species identification. The most prevalent species found consisted of lichen and
mosses, grasses, birch and willow shrubs, and various berry bushes. It was found that
as the surveys progressed away from the top surface of the esker and down the slopes
on the sides, the percentage of cover increased, as did species diversity. Mosses and
lichens were often the found at the top of the eskers, followed by grasses on the side
slope, and shrubs near the esker’s base.
Wolf den habitat and its relationship to eskers was a component of this project. A more
in-depth report regarding the wolf den habitat completed by April Desjarlais was
prepared for this project. Results discussed here are only a summary of Desjarlais
(1999) Wolf Den Habitat Report.
Observation of denning wolves on eskers showed that wolves were not denning on the
main portion of the esker but were actually doing so on smaller eskers, away from the
main esker complex. Many of the larger eskers examined have very little vegetation
cover on the sides. For almost all the dens observed, the granular material consisted of
a pebble pavement capping finer granular material. Pebble pavement is comprised of
sand material to small stones. It is easy to dig and the coarser material provides support
to the den structure. The vegetation surrounding the den was also very similar among
all the den sites observed. Roots of birch and willow provide support and cover to the den. Grasses also provide cover around the den burrows. Of all the dens that were
examined, only one was covered completely by vegetation (AD02-Arctic Sound). The
remaining dens were fairly visible and easy to spot. Recorded for all the dens was the
relatively short proximity to water.
4.3 ARCHAEOLOGICAL AND HISTORICAL SITES RESULTS
As a portion of the overall esker project, the determination of relationships between
archaeological/historical sites and eskers was undertaken. A report focusing on this
aspect of the project was written by Patricia Fitzpatrick in 1999. Fitzpatrick’s report
represents a more thorough discussion of the findings of the archaeological and
historical sites in the study area. This section of the report is a summary of Fitzpatrick’s
39
(1999) results.
Of primary importance to sites located through this survey is the presence of fresh water.
Thirty-six of forty-four sites visited by the field crew, or over 80 %, are located within
1000 meters of large water bodies. Of secondary importance is the location of sites with
respect to physical features. Sixty four percent of the sites visited in the Slave
Geological Province are situated on eskers. Overall, thirty-one percent of the sites
documented in the region are located on eskers.
Based on the information provided in this study, archaeological sites are typically located
on esker systems in close proximity to water. Generally, sites are located at the top of
the esker, or as close to the top of the esker as possible with a preference to be near a
source of water. Other typical sites characteristics include a flat topography and good
drainage.
40
5 DISCUSSION / CONCLUSIONS
5.1 GLACIAL HISTORY
Although eskers are one of the keys to discovering the direction of meltwater flow, they
are not the sole clue into the direction of meltwater. Eskers can be seen as a window
into the past behaviour of the glaciers that created them. Through looking at the
orientation of the eskers, we can see many hints to the direction the ice and meltwater
flows. The eskers of the lower maps, 76E, 76F, 76K, and 76L, have an orientation and
trend in a northwest southeast direction, consistent with other ice flow indicators for the
region discussed, for instance, by Kerr et al., 1995. As the eskers cross onto the upper
NTS maps, primarily 76M and 76N the eskers trend to a north-south direction towards
the coast.
Glacial history in the northern part of the study area has not been thoroughly
investigated. One possible theory on the retreat of the glaciers is that during the final
stages of glaciation, meltwater originally flowed in a north and northwesterly direction as
ice retreated to the south. Later, the bedrock of the northeastern part of the study area
and the local faults began to affect the glacial meltwater. Esker orientation indicates that
Bathurst Inlet, located due east of the study area, may have locally controlled the
direction of meltwater and glacial ice flow during retreat of the glaciers. The bedrock of
the region is very rigid and resistant to erosion. Many of the rivers and lakes follow fault
lines in the bedrock. The meltwater associated with the eskers also likely took
advantage of these natural drainage routes, as glacial ice retreated. Many eskers,
primarily those on NTS map sheet 76K – Mara River and 86O – Coppermine appear to
follow a series of outwash features. These outwash features follow the broad river
valleys cut in the rock. As glacial meltwater followed these valley routes, it deposited its
sediment in the valleys as outwash and as an esker on the higher ground. Once these
valleys became free of glacial ice, they were likely fed by meltwater from glaciers to the
south. 5.2 BIOPHYSICAL FEATURES It was noted during the study that vegetation was far more prevalent on the sides of
41
eskers than on the top. The reasons for such a lack of vegetation on the top surfaces of
the eskers is likely due to the creation of the pebble pavements. Because eskers rise
above the surrounding tundra, their upper surfaces are often exposed to high winds.
High winds and a dry climate allow for the fine granular material on the surface of eskers
to become susceptible to erosion. This lack of fine soil and the creation of a surface
crust makes it extremely difficult for vegetation to establish a hold in this harsh
environment. As described in “An Evaluation of Wolf Den Habitat on Eskers in the Slave Geological
Province” (Desjarlais, 1998), wolf dens were frequently located on eskers or esker like
material. This tendency can be attributed to the fact that during the denning period, the
surrounding tundra is still frozen, making it difficult for wolves to dig a den. It would also
make sense that wolves are choosing eskers because of their steeper slopes, which is
essential for proper drainage and the prevention of flooding. Possible speculation as to
why wolves were not denning on the main esker, include that wolves may choose to
remain inconspicuous to caribou which are using the esker as a travel way. The wolves
can thus remain relatively unseen, thereby increasing their chances of capturing and
killing their prey.
Wolves may also be choosing the smaller patches of esker because of the increased
vegetation cover that they provide. Sufficient vegetative cover is an essential
component for denning wolves in that it prevents the pups from being preyed upon by
other wildlife such as other wolves, bears, foxes and raptors.
Although much more work is necessary before any clear and precise conclusions are
made with regards to wolf denning habitats, it is clear that eskers do serve an important
role for denning wolves.
5.3 ARCHAEOLOGICAL AND HISTORICAL SITES
The findings of the Archaeological Project suggest a relationship between the physical
environment and archaeological sites within the Slave Geological Province. As noted,
archaeological sites are typically located on esker systems with close proximity to water.
This location would maximize the ability of inhabitants to see the surrounding area;
42
people could see their prey, as well as any human or animal predators in the region.
Eskers also provide opportunities for increased air movement in the tundra environment
(Park 1997). This strategy of habitation location has also been observed in caribou
populations. Eskers also provide ideal pathways for movement throughout the tundra.
As such, sites observed during the study may have been transitional, meaning they
served as temporary camping sites between destinations (Andrews 1998). Good
drainage, as commonly occurs on sandy, elevated features such as eskers, provide
more hospitable locations for campsites.
5.4 IMPACTS FROM INDUSTRIAL ACTIVITY It is evident that in such an area as the Slave Geological Province, which is
characterized by thin surficial deposits, eskers remain the main source of industrial
aggregate for the region. Future roads, runways, ports or other construction activities
will look to eskers to supply a major portion of the materials required. When the time
comes to further investigate these options, it is hoped that methods to mitigate effects on
the surrounding environment be carefully examined. Though eskers provide us with an
industrial resource, we must attempt to see the importance of the esker as a whole to
the arctic ecosystem. The impact of such aggregate extraction and esker manipulation
could not only have impacts on the wolves and caribou but also the ecosystem as a
whole.
As vegetation is principally developed along the sides of eskers, in order to minimize
disturbance to vegetation, preference should be given to the removal of material on
commonly less vegetated top of the esker. In addition wolf dens are preferentially
located on the sides of eskers. However, heritage sites show a marked preference for
tops of eskers. Because of this, archaeological surveys should be done before
quarrying. Consideration should also be given to increasing the aerial extent of
extraction on the top of the esker to avoid utilizing the sides or the complete removal of
sections.
Further recommendations in terms of wolf habitat and archaeological and historical sites
in relation to eskers can be found in the reports generated in co-operation with this study
43
(Desjarlais 1999 and Fitzpatrick 1998). It is suggested that industry and regulators take
the research findings regarding the possible favourable conditions for finding wolf dens
and archaeological sites and incorporate them into their field study, siting, and
infrastructure development plans.
5.5 FUTURE RESEARCH This project in no way provides a comprehensive view of eskers or esker research. This
project should be seen as a beginning for further studies and research. The creation of
the interactive Geographic Information System (GIS) is a tool that can be used by other
researchers and decision makers. This study focused on a very large broad area. Such
a large study area affected the amount and depth of study that was feasible for each
esker. Future research may wish to narrow down the scope of the project and
thoroughly investigate a single esker complex looking at its individual role in the
ecosystem. Such an esker study would expand the knowledge of the arctic ecosystem
and its interaction with landforms.
Expanded surficial geology research and mapping would greatly contribute to the
knowledge surrounding the glacial history of this study area. Additional research should
also include permafrost information and, in particular, the potential for ground ice to
occur in eskers. Ground ice represents the single most important factor, which can limit
or hamper the extraction of granular material from eskers.
There are currently a number of wildlife research initiatives utilizing satellite collar
tracking taking place in the Slave Geological Province. Digital data should be
transposed onto the digital NTS sheets. Analysis could then be undertaken to review
animal movements and their orientation to eskers and possibly their use of eskers, as
little is known although anecdotal evidence suggests a strong correlation.
6 LINKS WITH PARALLEL STUDIES
The traditional knowledge component of this project is conducted by the Nunavut
Planning Commission (NPC). NPC has community representatives who consult with
people in their respective communities to gather information regarding heritage sites and waste sites in areas targeted by this project. The information was compiled onto
44
databases and plotted on maps for use in the field. The TK information was
photographed in the field and information was provided to NPC. The information was
gathered and presented to communities in a map format which has proven to be a sound
method of expressing and conveying TK information in Nunavut.
Dean Cluff, wildlife biologist with RWED GNWT conducted a concurrent WKSS wolf
study. As wolves den mainly on eskers, the sharing of logistics worked well. Dean
educated the project assistants in the art and science of spotting wolf dens. As a result,
wolf den locations are noted as part of esker characterization data throughout the
project.
The information was also helpful in assisting researchers in other areas of the project
including:
Habitat Evaluating esker habitat characteristics as they relate to denning site preferences
and travel ways
Availability of eskers for habitat based on overall percentage of land cover
Surficial Mapping providing Quaternary information which assists in better defining sediment
characteristics and geomorphic processes which can be expected throughout the
region.
Wildlife Studies Providing baseline information on the eskers.
Vegetation Can provide information on eskers as a basic land cover type
Archaeology Spacial distribution of eskers for targeting research and identifying historic travel
ways and traditional use areas
45
7 TRAINING ACTIVITIES AND RESULTS
No specific funding was provided by WKSS for training during this research project.
However, DIAND through the Environment and Conservation Division provided two field
assistants, April Desjarlais and Patricia Fitzpatrick, for the project as part of their training
under the Aboriginal Summer Student and University of Waterloo Co-op Programs,
respectively.
April Desjarlais was hired under the Aboriginal Summer Student Program which provides
Aboriginal students with work experience in the area of study. April was enrolled in the
University of Saskatchewan’s undergraduate Biology Program in Saskatoon,
Saskatchewan. She learned valuable field skills in preparing for and conducting a field
program in an isolated Arctic environment that can be transferred to any other future
field programs. A general knowledge of eskers including the identification of key
physical characteristics was also achieved.
Patricia Fitzpatrick was an Anthropology student from the University of Waterloo Co-
operative Program. Patricia collated the NPC Traditional Knowledge database with
industry archaeological studies and field-checked the information. She too learned
valuable field skills in preparing for and conducting a field program in an isolated Arctic
environment that can be transferred to future projects and field studies.
Justin Kraemer was a University of Waterloo Geography student specializing in GIS
applications. Justin spent many long areas creating the macro programming for the GIS
application associated with the project. Justin went on to finish a Masters Degree in
digital mapping.
David Atkinson was a University of Waterloo Geography student who assisted in the
final preparation and analysis for the final report. David is currently completing a
Masters degree on spatial information related to the eskers identified in this report.
46
8 REFERENCES
Andrews, T. (1998). Report of an Archaeological Survey of the Tundra Ecosystem Research Station Area, Daring Lake. Yellowknife, Prince of Wales Northern Heritage Centre: 49.s
Andrews, T. (1998). Personal Communication on the criteria for evaluating site
preference. Banerjee, I. and B. C. McDonald (1975). Nature of esker sedimentation.
Glaciofluvial and glaciolacustrine sedimentation. A. V. Jopling and B. C. McDonald. Tulsa, Society of Economic Paleontologists and Mineralogists, Special Publication No. 23: 132-154.
Banfield, A. W. F. and R. D. Jakimchuk (1980). Analysis of the Characteristics
and Behavior of Barren Ground Caribou in Canada, Polar GasProject: exerpt 70-77. Bertulli, M., Ed. (1998). Archaeological Field Work in the Northwest Territories,
Canada in 1997. Archaeology Report No. 19. Yellowknife, Prince of Wales Northern Heritage Centre.
Boulton, G. S. (1996). “Evolution of drainage patterns beneath ice sheets.” Eos,
Transactions, American Geophysical Union 77(46). Brennand, T. A. (1994). “Macroforms, large bedforms and rhythmic sedimentary
sequences in subglacial eskers, south-central Ontario: implications for esker genesis and meltwater regime.” Sedimentary Geology 91(1-4): 9-55.
Clark, P. U. (1997). Sediment deformation beneath the Laurentide ice sheet. Late
glacial and postglacial environmental changes; Quaternary, Carboniferous-Permian, and Proterozoic. P. I. Metzger. New York, Oxford University Press: 81-97.
Clark, P. U., J. S. Walder, et al. (1994). “Subglacial drainage, eskers, and
deforming beds beneath the Laurentide and Eurasian ice sheets.” Geological Society of America Bulletin 106(2): 304-314.
Desjarlais, A. (1998). An Evaluation of Wolf Den Habitat on Eskers in the Slave
Geological Province. Yellowknife, NT, Department of Indian Affairs and Northern Development: 21.
Downes, C. M., J. B. Theberge, and S.M. Smith (1986). “The influence of insects
on the distribution, microhabitat choice, and behavior of the Burwash caribou herd.” Canadian Journal of Zoology 64: 622-629.
Dredge, L. A., B.C. Ward, and D. E. Kerr (1996a). Surficial Geology, Point Lake
NTS 86H, District of Mackenzie, Northwest Territories. Ottawa Canada, Geological Survey of Canda, Map 1890A.
Dredge, L. A., B. C. Ward, and D.E. Kerr (1996b). Surficial geology, Aylmer Lake
NTS 76C North, District of Mackenzie, Northwest Territories. Ottawa, Geological Survey of Canada, Map 1867A.
47
Dredge, L. A., B. C. Ward, and D.E. Kerr (1998). Surficial Geology, Kikerk Lake
NTS 86P, District of Mackenzie, Northwest Territories. Ottawa, Geological Survey of Canada, Map 1909A.
Dyke, A.S., and L.A. Dredge (1989). Quaternary geology of the northwestern Canadian Shield. In Quaternary geology of Canada and Greenland, Geology of Canada, No. 1, edited by R.J. Fulton. Geological Survey of Canada. pp. 189-214. Dyke, A.S., and V.K. Prest (1987). Late Wisconsinan and Holocene history of the Laurentide Ice Sheet. Geographie physique Quaternaire, 41 (2): 237-263.
EBA Engineering Consultants Ltd. (1994). Manual for sampling esker deposits and laboratory testing procedures. Yellowknife, NWT, Indian and Northern Affairs Canada (sponsor).
Elund, S. A. (1977). Vegetation types of north-central District of Keewatin,
Geological Survey of Canada: Report of Activities Part A. Paper 76-1A: 385-386. Epp, H. T. (1984). “Ecological Edges and Archaeological Site Location in
Saskatchewan, Canada.” North American Archaeologist 5(4): 323-336. Fitzpatrick, P. (1999). Esker Habitat Characteristics and Traditional Use Study in
the Slave Geological Province 1998: A Study of the Relationship between Physical Features and Archaeological Sites in the Slave Geological Province. Yellowknife, Department of Indian Affairs and Northern Development.
Gorrell, G. and J. Shaw (1991). “Deposition in an esker, bead and fan complex,
Lanark, Ontario, Canada.” Sedimentary Geology 72(3-4): 285-314. Hooke, R. L. (1989). “Englacial and subglacial hydrology: a qualitative review.”
Arctic and Alpine Research 21(3): 221-233. Kerr, D. E. and R. D. Knight (1998). Surficial Geology, Rideout Island and Elu
Inlet, District of Mackenzie, Northwest Territories, NTS 76O N/2; 77ASW/4. Ottawa, Geological Survey of Canada.
Kerr, D. E., B. C. Ward and L.A. Dredge (1995a). Surficial Geology, Winter Lake
NTS86A, District of Mackenzie, Northwest Territories. Ottawa Canada, Geological Survey of Canada, Map 1871A.
Kerr, D.E., L.A. Dredge, B.C. Ward and J.S. Gebert (1995b). Quaternary geology
and implications for drift prospecting in the Napaktulik Lake, Point Lake, and Contwoyto Lake map areas, northwest Slave Province. Geological Survey of Canada, Current Research 1995E: 201-209.
Kerr, D. E., L. A. Dredge, et al. (1996). Surficial Geology, Coppermine, District of
Mackenzie, Northwest Territories (NTS 86 O E/2). Ottawa, Geological Survey of Canada.
Kerr, D. E., L. A. Dredge and B.C. Ward (1997a). Surficial Geology, Napaktulik
48
Lake, Distric of Mackenzie, Northwest Territories NTS 86I. Ottawa Canada, Geological Survey of Canda, Map 1889A.
Kerr, D. E., S. A. Wolfe, and L.A. Dredge (1997b). Surficial geology of the
Contwoyto Lake map area (north half), District of Mackenzie, Northwest Territories, Geological Survey of Cananda. Current Research 1997-C: 51-59.
Kraemer, J. T. (1999). "Completion of a GIS database of tundra eskers in the
Slave Geological Province: Report prepared for INAC and the University of Waterloo, Faculty of Environmental Studies", Yellowknife Canada, Department of Indian and Northern Development
Lewis, W.V., (1949). An esker in process of formation: Böverbreen, Jotunheimen, 1947. Journal of Glaciology, 1 (6): 314-319.
Mollard, D. G. and J. D. Mollard (1993). Compilation inventory of granular material resources information within the Izok Lake transportation corridor, J.D. Mollard and Associates Ltd, sponsored by Northern Affairs Program (Canada), Natural Resources and Economic Development Branch.
Park, R. (1997). Inuit and Eskimo Cultures, Lecture Series September to
December 1997, University of Waterloo. Pollard, R. H., W. B. Ballard, L.E. Noel, and M.A Cronin (1996). “Parasitic
insect abundance and microclimate of gravel pads and tundra within the Prudhoe Bay oil field, Alaska, in relation to use by Caribou (Rangifer tarandus granti).” The Canadian Field-Naturalist 110(4): 649-658.
Reynolds, L. (1996). All that glitters is not green: environmental responsibility and
Canada's arctic diamond rush. Issues in the North. J. Oakes and R. Riewe. Edmonton, Canadian Circumpolar Institute. Occasion Publication Number 40: 183-198.
Saunderson, H. C. (1976). “Paleocurrent analysis of large-scale cross-
stratification in the Brampton esker, Ontario.” Journal of Sedimentary Petrology 46(4): 761-769.
Smith, R. L. (1992). Elements of Ecology. New York, HarperCollins Publishers
Inc. Stephenson, R. O. (1974). Characteristics of wolf den sites. Juneau, Final
Report, Federal Aid to Wildlife Restoration Projects W-17-2-W-16-6, Job 14.6R. Alaska Department of Fish and Game.
St-Onge, D. A. (1995). Surficial Geology, Coppermine, District of Mackenzie,
Northwest Territories (NTS 86O) Eastern Half. Ottawa, Geological Survey of Canada.
Stokes, J.C., (1958). An esker-like ridge in process of formation, Flatisen, Norway. Journal of Glaciology, 3 (24): 286-288.
Traynor, S. (1999). Personal Interview with the Research Co-ordinator of the
49
Esker Project for the West Kitmeot-Slave Study. Ward, B. C., L. A. Dredge, and D.E. Kerr (1995). Surficial geology, Contwoyto
Lake, District of Mackenzie, Northwest Territories - NTS 76E South Half. Ottawa Canada, Geological Survey of Canada, Open File 3200.
Ward, B. C., L. A. Dredge and D.E. Kerr (1997). Surficial geology, Lac de Gras,
District of Mackenzie, Northwest Territories - NTS 76D. Ottawa Canada, Geological Survey of Canada.
50
APPENDIX A: WKSS ESKER DATABASE CD-ROM
This final report includes a specially produced CD-ROM. The CD is broken into three folders: Eskers, Final Report, and Bibliography. The Esker folder contains an ArcView project file (esker2.apr). This file has been modified to display the digital esker maps as well as visual and textual information on the eskers and the samples. The Final Report folder contains the final report in both MS Word 97 and Corel Word Perfect 8.0 formats. The third folder, Bibliography, contains a summary report on eskers and an extensive bibliography on eskers and related topics (See Appendix C) Questions or comments on the CD-ROM, or if one was not included in this package, please forward them to: Stephen Traynor Senior Lands Specialist DIAND – NWT Region Box 1500 Yellowknife, NT X1A 2R3 [email protected]

51
=========================== WKSS Esker Project Database =========================== Produced by DIAND NWT Region Compiled by Justin Kraemer ------------------------------- Version 2.0 Release Notes December 16, 1998 ------------------------------- If you are viewing this with Windows Notepad, make sure word wrap is turned on. Please note that throughout this document, the WKSS Esker Project is referred to as either "the project", "the product" or "the application", and these terms are used interchangeably. While every effort has been made to ensure that this product will function on the majority of computers, it is possible that you may encounter difficulties. Therefore, to ensure maximum probability of success in using this product, your system should meet the following specifications: -------------- Specifications -------------- ArcView 3.0a (required) Pentium 75 or better 32 MB RAM or more 1024x768 monitor resolution (recommended) 4x CD-ROM drive or better ---- Note ---- If you are using ArcView 3.0, you must have the ArcView 3.0a patch installed (which is free and can be downloaded from www.esri.com). We have not tested the CD-ROM on ArcView 3.0 without the patch. * * * Important: If you are using Arcview 3.0a (as opposed to 3.1), you will need to check your lib32 folder for the presence of a file called avdlog.dat. If it is not there, simply open the extensions folder on the CD-ROM, and copy avdlog.dat from the CD-ROM to your lib32 folder. For a typical ArcView 3.0a installation, the lib32 folder is found at: c:\esri\av_gis30\arcview\lib32 You must have avdlog.dat in the lib32 folder. Otherwise the project will not open properly. Users of ArcView 3.1 will probably already have this file, but if the project does not load in ArcView 3.1, this would still be the first thing to check. * * * While you may be able to run the project on a system with less than 32 MB of RAM, be aware that you may get memory errors.
52
If you encounter problems, please see the "Known Issues" section later in this document which describes some of the potential error messages you might see, and other limitations of the project. ------------- Instructions: ------------- To use the project, a basic understanding of ArcView is assumed. If you are unfamiliar with ArcView, see the ArcView manual. ---------------------------------- Brief Description of Functionality ---------------------------------- As in version 1.01, the main features of the project are the View Esker Details tool and the View Sample Data tool. New to version 2.0 are the View Wolf Den Photo tool, the View Statistics button and the Create a Map to Print button, as well as some enhancements to the existing tools. Most noticeably, however, is the NTS Index view that has been added. This view is displayed automatically after the project loads. From this view, the user can graphically select the area of interest by clicking on the square representing the appropriate NTS sheet. After doing so, the selected view will appear. Some additional minor improvements have been made as well, including the ability to add and later remove a latitude/longitude graticule of a user-defined interval for either the view or the map layout. Also added is a feature that allows the user to zoom to six pre-defined extents for each view, in order to get a closer look using a more suitable scale. Other features have been included, but they are mostly transparent and operate in the background to improve the ease-of-use of the project. --------------- -NTS Index View --------------- The NTS Index View is a special view that allows the user to select the area s/he wishes to examine. In this way, the user does not have to know the name or number of the map sheet in order to view it. By default when the project loads, the 'Choose a map to "Zoom" to' tool is selected, and the NTS 1:250,000 theme is active. If they are not, please select them before clicking on the Index View. ---------------------------------------------------------- -View Esker Details (Tool with magnifying glass with an E) ---------------------------------------------------------- This tool automatically becomes the active tool when you activate the Geological Landforms (formerly called eskers) theme. Using this tool you can click on a feature to obtain the relevant information collected about it. What you will see after clicking on an esker is a photo of the esker and the field data such as grain size, vegetation, topography, etc. Be aware that you must close both the photo window and the text window individually. Otherwise you may eventually find you have dozens of windows open at once. Some eskers do not have photos available, and you will be notified to that effect. Some eskers were not studied at all, so when you click on them, you will be informed of this as well. On map 76K (Mara River) some of the photos were not ready in time to be included on the CD-ROM. For these you will get a message to tell you so.
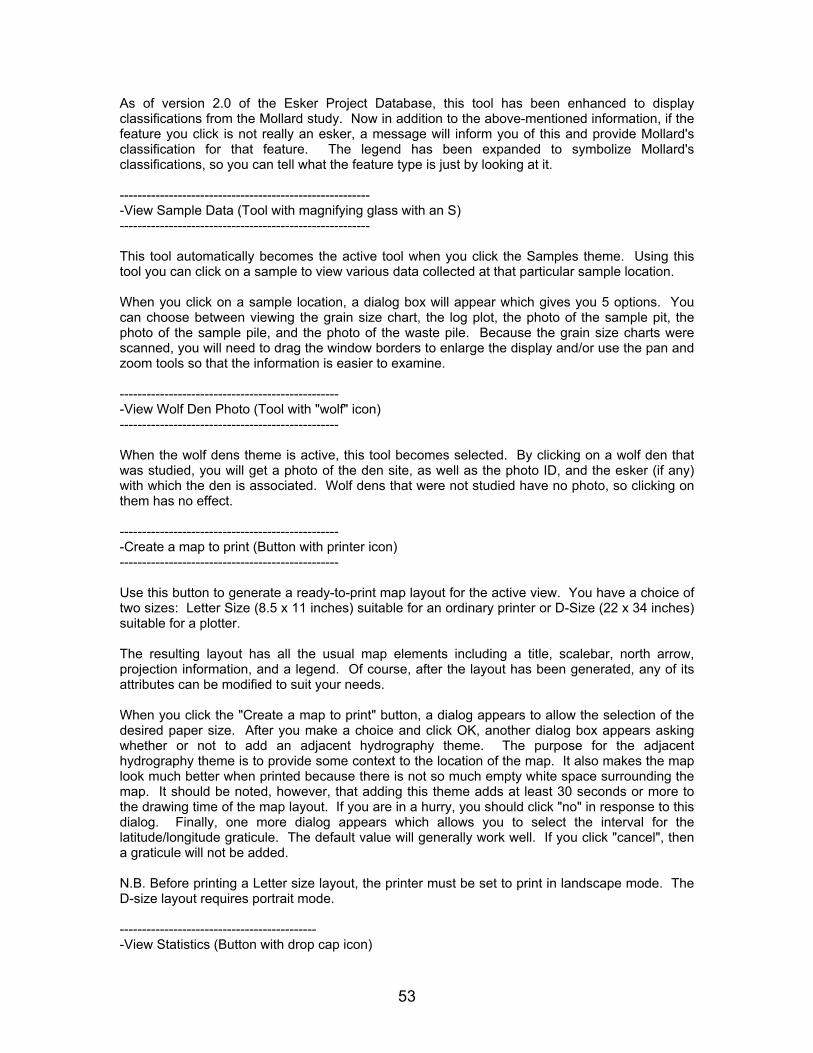
53
As of version 2.0 of the Esker Project Database, this tool has been enhanced to display classifications from the Mollard study. Now in addition to the above-mentioned information, if the feature you click is not really an esker, a message will inform you of this and provide Mollard's classification for that feature. The legend has been expanded to symbolize Mollard's classifications, so you can tell what the feature type is just by looking at it. -------------------------------------------------------- -View Sample Data (Tool with magnifying glass with an S) -------------------------------------------------------- This tool automatically becomes the active tool when you click the Samples theme. Using this tool you can click on a sample to view various data collected at that particular sample location. When you click on a sample location, a dialog box will appear which gives you 5 options. You can choose between viewing the grain size chart, the log plot, the photo of the sample pit, the photo of the sample pile, and the photo of the waste pile. Because the grain size charts were scanned, you will need to drag the window borders to enlarge the display and/or use the pan and zoom tools so that the information is easier to examine. ------------------------------------------------- -View Wolf Den Photo (Tool with "wolf" icon) ------------------------------------------------- When the wolf dens theme is active, this tool becomes selected. By clicking on a wolf den that was studied, you will get a photo of the den site, as well as the photo ID, and the esker (if any) with which the den is associated. Wolf dens that were not studied have no photo, so clicking on them has no effect. ------------------------------------------------- -Create a map to print (Button with printer icon) ------------------------------------------------- Use this button to generate a ready-to-print map layout for the active view. You have a choice of two sizes: Letter Size (8.5 x 11 inches) suitable for an ordinary printer or D-Size (22 x 34 inches) suitable for a plotter. The resulting layout has all the usual map elements including a title, scalebar, north arrow, projection information, and a legend. Of course, after the layout has been generated, any of its attributes can be modified to suit your needs. When you click the "Create a map to print" button, a dialog appears to allow the selection of the desired paper size. After you make a choice and click OK, another dialog box appears asking whether or not to add an adjacent hydrography theme. The purpose for the adjacent hydrography theme is to provide some context to the location of the map. It also makes the map look much better when printed because there is not so much empty white space surrounding the map. It should be noted, however, that adding this theme adds at least 30 seconds or more to the drawing time of the map layout. If you are in a hurry, you should click "no" in response to this dialog. Finally, one more dialog appears which allows you to select the interval for the latitude/longitude graticule. The default value will generally work well. If you click "cancel", then a graticule will not be added. N.B. Before printing a Letter size layout, the printer must be set to print in landscape mode. The D-size layout requires portrait mode. -------------------------------------------- -View Statistics (Button with drop cap icon)
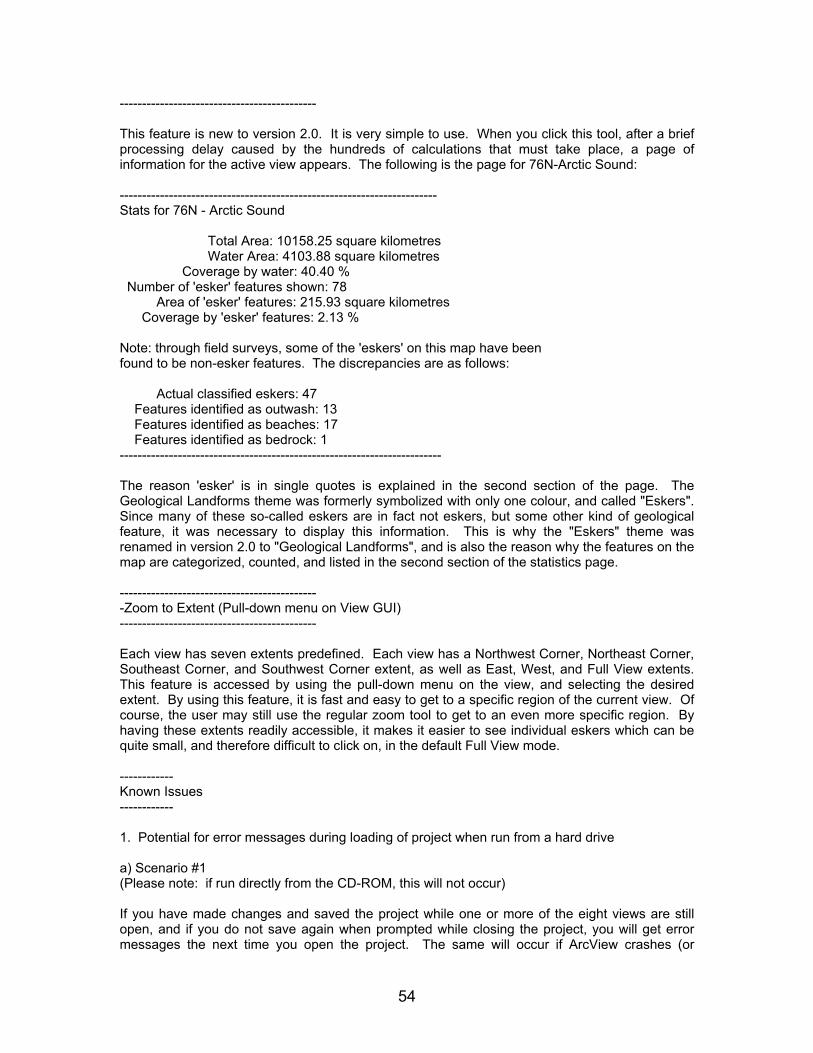
54
-------------------------------------------- This feature is new to version 2.0. It is very simple to use. When you click this tool, after a brief processing delay caused by the hundreds of calculations that must take place, a page of information for the active view appears. The following is the page for 76N-Arctic Sound: ----------------------------------------------------------------------- Stats for 76N - Arctic Sound Total Area: 10158.25 square kilometres Water Area: 4103.88 square kilometres Coverage by water: 40.40 % Number of 'esker' features shown: 78 Area of 'esker' features: 215.93 square kilometres Coverage by 'esker' features: 2.13 % Note: through field surveys, some of the 'eskers' on this map have been found to be non-esker features. The discrepancies are as follows: Actual classified eskers: 47 Features identified as outwash: 13 Features identified as beaches: 17 Features identified as bedrock: 1 ------------------------------------------------------------------------ The reason 'esker' is in single quotes is explained in the second section of the page. The Geological Landforms theme was formerly symbolized with only one colour, and called "Eskers". Since many of these so-called eskers are in fact not eskers, but some other kind of geological feature, it was necessary to display this information. This is why the "Eskers" theme was renamed in version 2.0 to "Geological Landforms", and is also the reason why the features on the map are categorized, counted, and listed in the second section of the statistics page. -------------------------------------------- -Zoom to Extent (Pull-down menu on View GUI) -------------------------------------------- Each view has seven extents predefined. Each view has a Northwest Corner, Northeast Corner, Southeast Corner, and Southwest Corner extent, as well as East, West, and Full View extents. This feature is accessed by using the pull-down menu on the view, and selecting the desired extent. By using this feature, it is fast and easy to get to a specific region of the current view. Of course, the user may still use the regular zoom tool to get to an even more specific region. By having these extents readily accessible, it makes it easier to see individual eskers which can be quite small, and therefore difficult to click on, in the default Full View mode. ------------ Known Issues ------------ 1. Potential for error messages during loading of project when run from a hard drive a) Scenario #1 (Please note: if run directly from the CD-ROM, this will not occur) If you have made changes and saved the project while one or more of the eight views are still open, and if you do not save again when prompted while closing the project, you will get error messages the next time you open the project. The same will occur if ArcView crashes (or

55
otherwise exits abnormally) after you have saved the project with one or more views open. In either case, if you are asked to abort the application when loading the project the next time, simply click "No" and acknowledge any subsequent pop-up error messages. To fix the problem, close the views that were open when you last saved (hint: check the "Window" menu), close the project, and save when you are prompted. This will reset the display definitions. You may then continue to use the project as normal. Technical Note: Normally, when a view is closed, the definitions for the Surface Dispositions theme and Samples theme are reset to "". Of course, if ArcView crashes, or if the views are not closed before saving, the reset can't occur. Since the definitions used for these themes are based on shape field queries, they are not valid when ArcView re-loads, and so ArcView complains. b) Scenario #2 (Please note: if run directly from the CD-ROM, this will not occur) If you have created one or more layouts featuring the surface dispositions theme and/or samples theme and saved the project, and if the program should crash sometime thereafter, the layouts will not have been removed from the project as they would be during a normal shutdown. This will cause a similar problem to that in Scenario #1, but it is more easily fixed. After acknowledging any and all error messages on startup, and when the project has finished loading, you will need to go to the main project window (entitled esker2.apr), click on the Layouts icon, and delete the layouts that appear in the list. To delete layouts, simply select them and press the Delete or Del key on your keyboard. Given that you had viewed one or more Map Layouts prior to the crash, the odds are good that you also have views that were not closed before ArcView crashed. In this case it may, in some rare instances, be necessary to go through the steps described in Scenario #1 also. Normally, however, if you save the project on exiting, this problem would fix itself before the next time the project is loaded. In General: When running this project from your hard drive, if you make a change you wish to save and save it before selecting Exit, Close Project, or Close All, you should always let ArcView save the project again when it prompts you (which it will do when you elect to exit, close, or close all). In this way the problems mentioned above should fix themselves. Since all layouts created will be deleted in order to avoid the definitions problem, if you want to keep any layouts you have created, you must take an extra step. The project comes with the ODB extension installed, which allows you to save any view, layout, etc. to a separate .odb file. You can retrieve items from the .odb file in subsequent ArcView sessions. To save to an ODB file, you must make the document you want to save the active document. Then select Edit|Save Active Document from the pull-down menus, and save the ODB file in the location of your choice. You can put the saved document into another project by loading the ODB extension in the new project, and selecting Edit|Restore Document. 2. Weird fonts appear on the layouts. If when you view a map layout the text is in a strange font, it means you will need to find that font on your system and disable it. The reason this occurs is that ArcView sometimes takes the first font it finds on your system. Often this font is a non-alphabetic symbol font of some kind, which means text on the layouts is unreadable. To fix this problem, you'll need to find the offending font on your system, and delete or otherwise disable it. 3. ArcView crashes while loading the project with a message such as "Class RButton has instances"

56
If, when loading the project, you get a message something to the effect of "Class RButton has instances", or something similar which crashes ArcView, it may be because you have ESRI's Dialog Designer Extension enabled as one of your default extensions. To fix this problem, re-load ArcView (from a shortcut or the start menu--*not* by clicking a .apr file). Then with the blank project window active, from the File menu choose "Extensions...", and unclick the Dialog Designer Extension. Then click "make default". You should then be able to load the project. 4. Map Layout Generation For the D-size layout, the map does not cover the entire page. There will be an extra 30 cm (approximately) on the right hand side, which will need to be trimmed. The reason for this extra width is because the map projection creates an aspect ratio that does not match a 22 by 34 inch sheet very well. An E-size layout on an E-size sheet would fit better, but the overall map would be too large and unwieldy. Letter size layouts are drawn at a scale of 1:750,000, and thus the labels are very small and difficult to read. This format is not recommended for field purposes. 5. Assertion error in bitmap.c If you get either of these messages, it usually happens when you try to pan or zoom before the map has finished drawing. For best results, always let the view finish drawing before panning or zooming. It isn't always a problem if you don't wait, but it's never predictable. This is a flaw in ArcView itself. 6. Assertion error in fsrc.c This error is the result of a display definitions problem. See #1. 7. Not all eskers have data. Not all eskers could be studied, so each map has some eskers with no information. 8. Avdlog.dat file missing. See the notes at the start of this file. ---------------------- Still having problems? ---------------------- If after examining the Known Issues section your problem is still unresolved, please send email to [email protected] with a detailed description of the problem including what the error message was, what you were doing when it happened, how much RAM is in your system, and any other information you deem relevant. Please put the words "Esker Database Error Report" in the subject line of the message. Thank you.

57
APPENDIX B: SELECTED PHOTOS
Appendix B contains a collection of selected photos taken throughout the field
seasons. The photos were selected to demonstrate the variety of eskers studied,
their characteristics, and the animal and human uses of the eskers. A digital
photographic database of all photos is contained within the Esker CD-ROM and
can be accessed thought the GIS or separately.
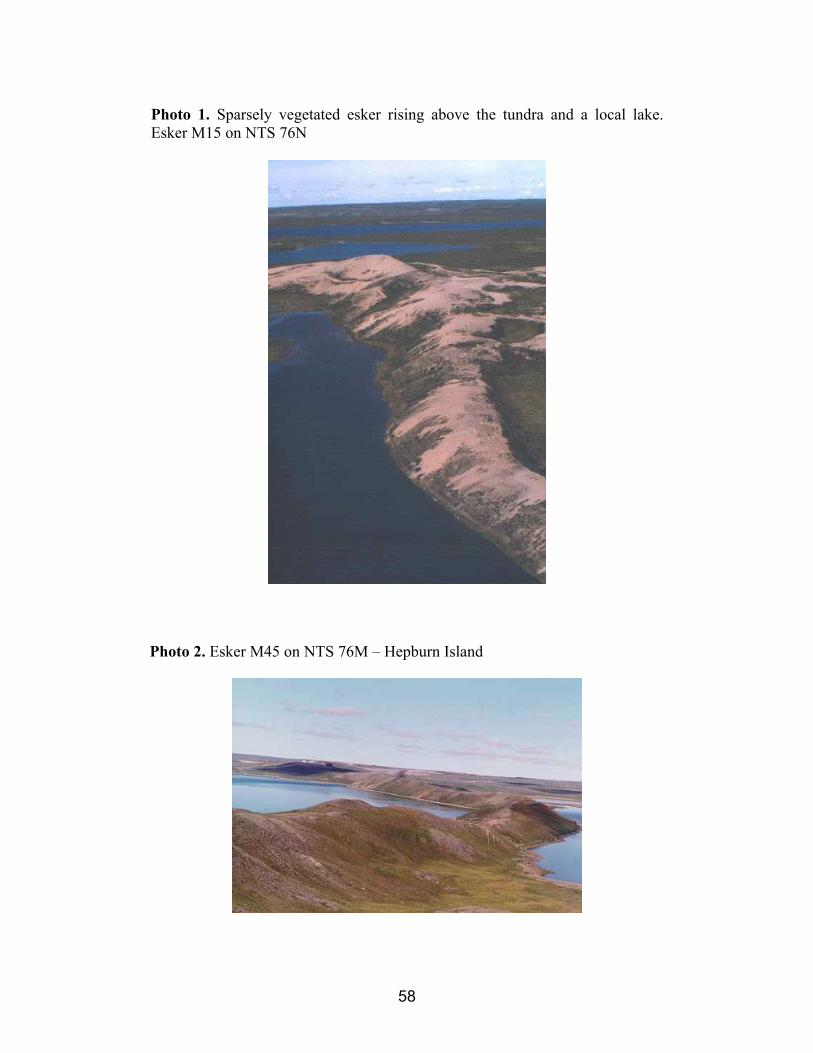
58
�� Photo 1. Sparsely vegetated esker rising above the tundra and a local lake.Esker M15 on NTS 76N
Photo 2. Esker M45 on NTS 76M – Hepburn Island

59
��Photo 3: Typical borehole with fieldbook resting on the waste pile. The waste pileis photographed to identify and large stones.
Photo 4: Sample taken from a borehole. The sample is coned and quartered before being sealed for transport.
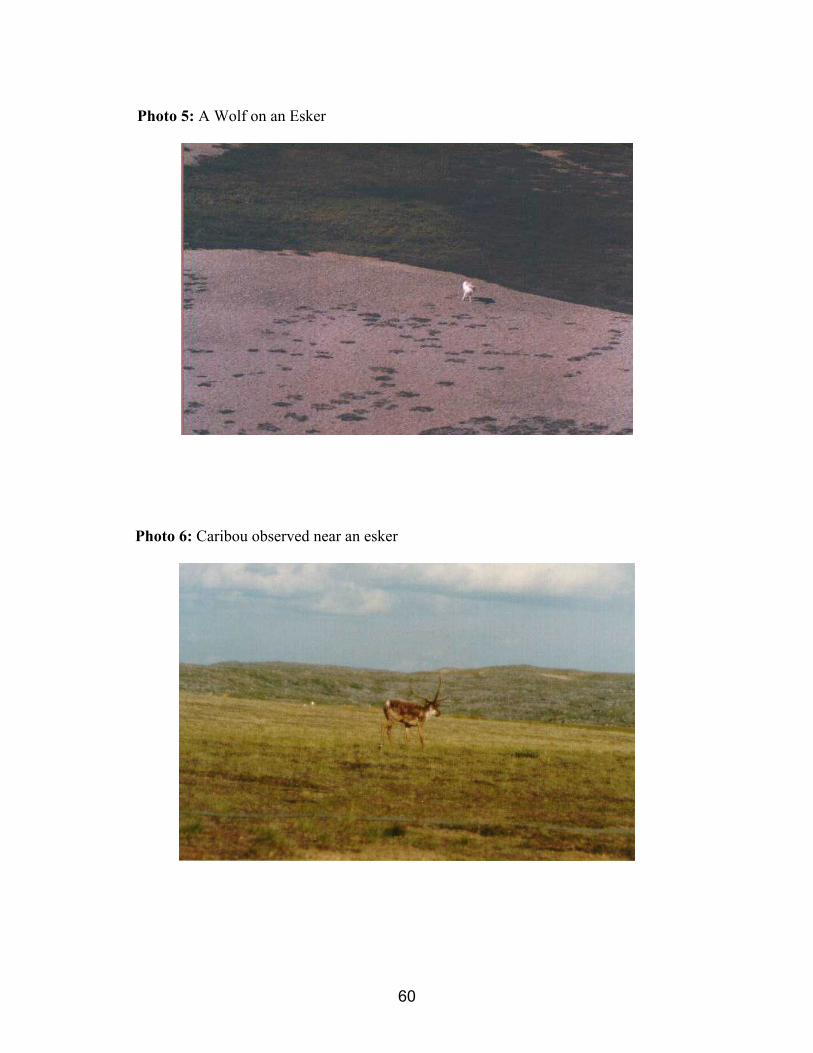
60
��Photo 5: A Wolf on an Esker
Photo 6: Caribou observed near an esker
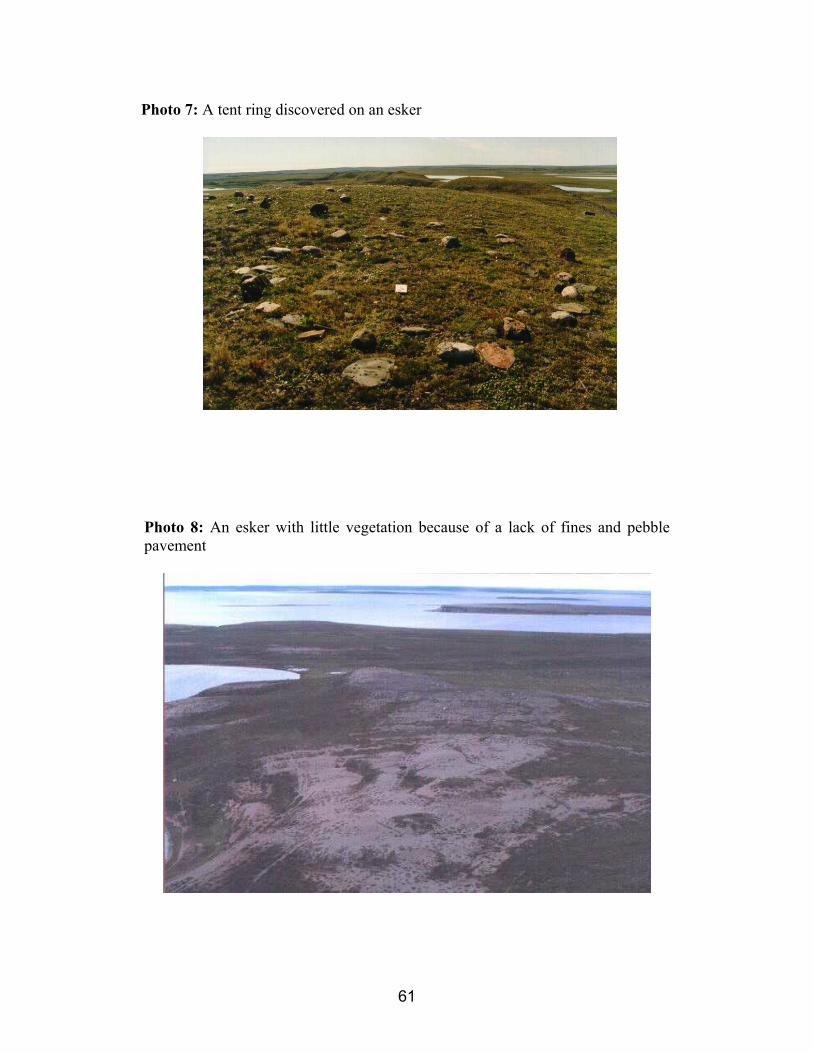
61
�
�
Photo 7: A tent ring discovered on an esker
Photo 8: An esker with little vegetation because of a lack of fines and pebblepavement
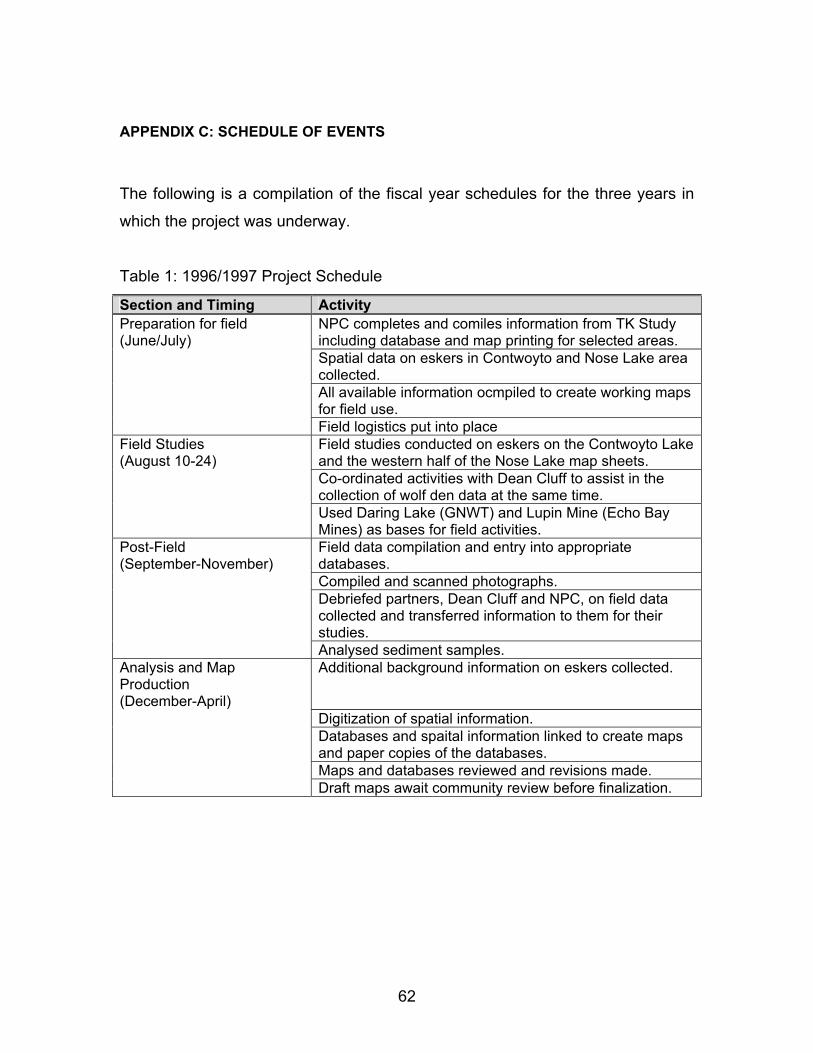
62
APPENDIX C: SCHEDULE OF EVENTS
The following is a compilation of the fiscal year schedules for the three years in
which the project was underway.
Table 1: 1996/1997 Project Schedule
Section and Timing Activity Preparation for field (June/July)
NPC completes and comiles information from TK Study including database and map printing for selected areas.
Spatial data on eskers in Contwoyto and Nose Lake area collected.
All available information ocmpiled to create working maps for field use.
Field logistics put into place Field Studies (August 10-24)
Field studies conducted on eskers on the Contwoyto Lake and the western half of the Nose Lake map sheets.
Co-ordinated activities with Dean Cluff to assist in the collection of wolf den data at the same time.
Used Daring Lake (GNWT) and Lupin Mine (Echo Bay Mines) as bases for field activities.
Post-Field (September-November)
Field data compilation and entry into appropriate databases.
Compiled and scanned photographs. Debriefed partners, Dean Cluff and NPC, on field data
collected and transferred information to them for their studies.
Analysed sediment samples. Analysis and Map Production (December-April)
Additional background information on eskers collected.
Digitization of spatial information. Databases and spaital information linked to create maps
and paper copies of the databases. Maps and databases reviewed and revisions made. Draft maps await community review before finalization.
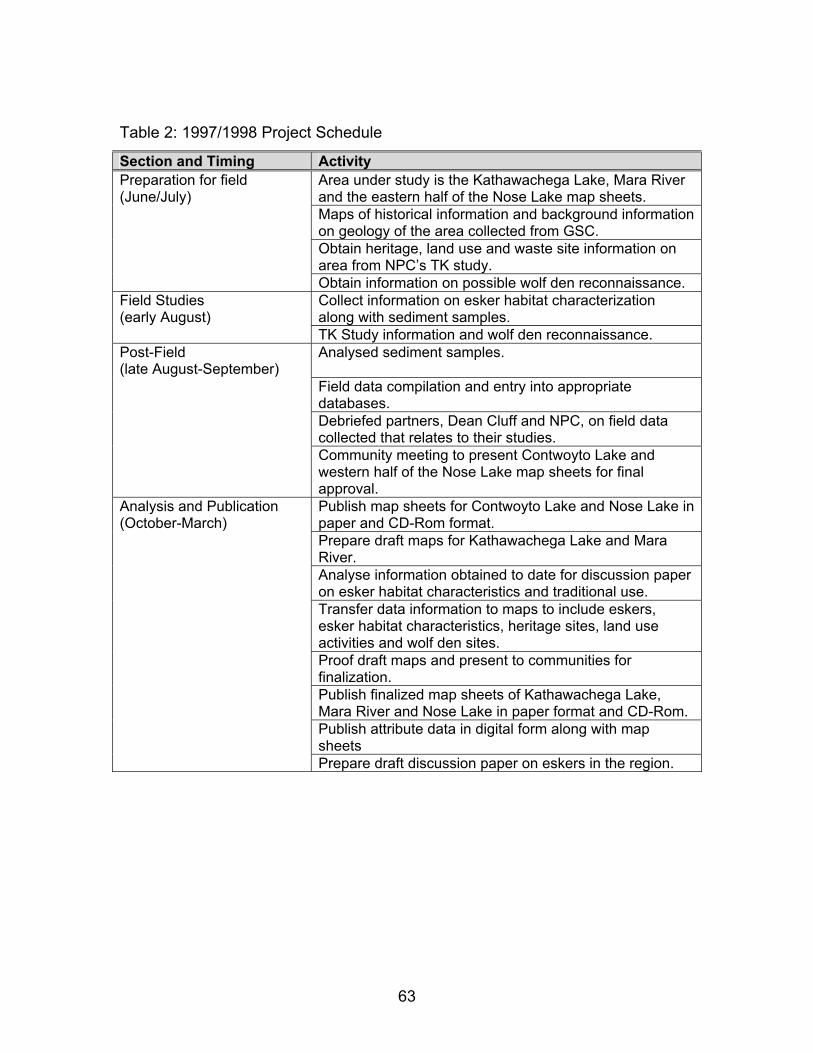
63
Table 2: 1997/1998 Project Schedule
Section and Timing Activity Preparation for field (June/July)
Area under study is the Kathawachega Lake, Mara River and the eastern half of the Nose Lake map sheets.
Maps of historical information and background information on geology of the area collected from GSC.
Obtain heritage, land use and waste site information on area from NPC’s TK study.
Obtain information on possible wolf den reconnaissance. Field Studies (early August)
Collect information on esker habitat characterization along with sediment samples.
TK Study information and wolf den reconnaissance. Post-Field (late August-September)
Analysed sediment samples.
Field data compilation and entry into appropriate databases.
Debriefed partners, Dean Cluff and NPC, on field data collected that relates to their studies.
Community meeting to present Contwoyto Lake and western half of the Nose Lake map sheets for final approval.
Analysis and Publication (October-March)
Publish map sheets for Contwoyto Lake and Nose Lake in paper and CD-Rom format.
Prepare draft maps for Kathawachega Lake and Mara River.
Analyse information obtained to date for discussion paper on esker habitat characteristics and traditional use.
Transfer data information to maps to include eskers, esker habitat characteristics, heritage sites, land use activities and wolf den sites.
Proof draft maps and present to communities for finalization.
Publish finalized map sheets of Kathawachega Lake, Mara River and Nose Lake in paper format and CD-Rom.
Publish attribute data in digital form along with map sheets
Prepare draft discussion paper on eskers in the region.
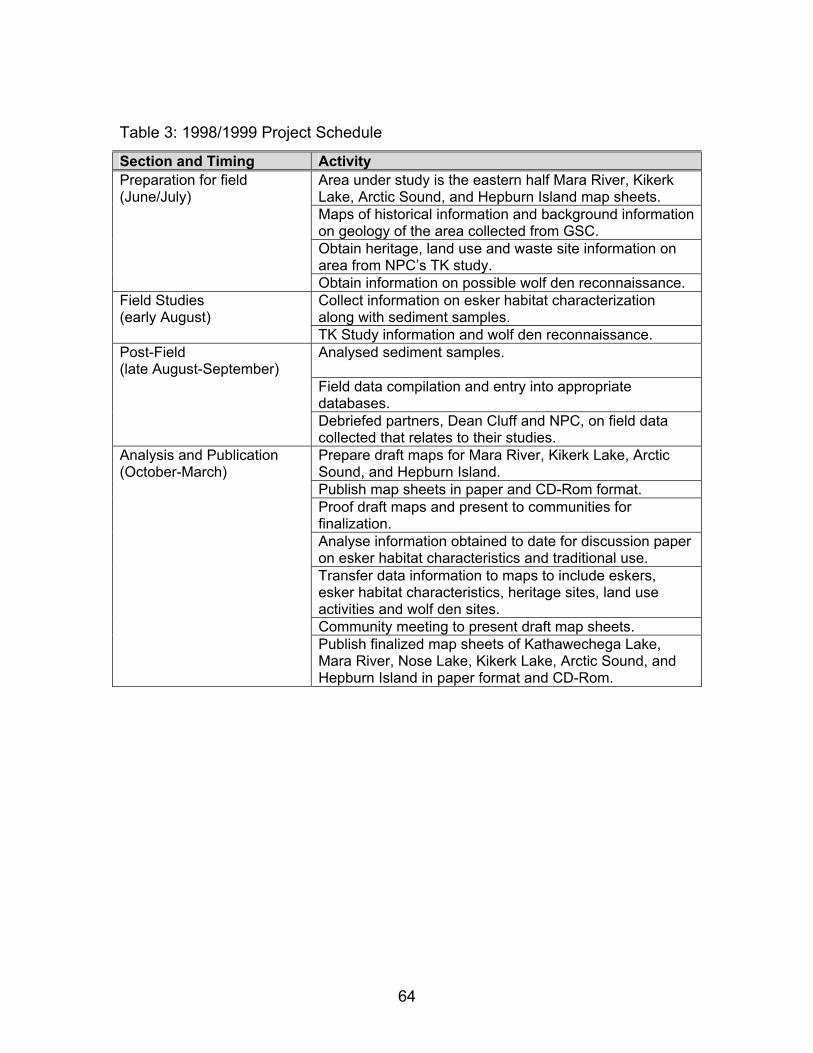
64
Table 3: 1998/1999 Project Schedule
Section and Timing Activity Preparation for field (June/July)
Area under study is the eastern half Mara River, Kikerk Lake, Arctic Sound, and Hepburn Island map sheets.
Maps of historical information and background information on geology of the area collected from GSC.
Obtain heritage, land use and waste site information on area from NPC’s TK study.
Obtain information on possible wolf den reconnaissance. Field Studies (early August)
Collect information on esker habitat characterization along with sediment samples.
TK Study information and wolf den reconnaissance. Post-Field (late August-September)
Analysed sediment samples.
Field data compilation and entry into appropriate databases.
Debriefed partners, Dean Cluff and NPC, on field data collected that relates to their studies.
Analysis and Publication (October-March)
Prepare draft maps for Mara River, Kikerk Lake, Arctic Sound, and Hepburn Island.
Publish map sheets in paper and CD-Rom format. Proof draft maps and present to communities for
finalization. Analyse information obtained to date for discussion paper
on esker habitat characteristics and traditional use. Transfer data information to maps to include eskers,
esker habitat characteristics, heritage sites, land use activities and wolf den sites.
Community meeting to present draft map sheets. Publish finalized map sheets of Kathawechega Lake,
Mara River, Nose Lake, Kikerk Lake, Arctic Sound, and Hepburn Island in paper format and CD-Rom.

65
APPENDIX D: MAP SHEET PACKAGES
Provided under separate cover and on enclosed CD-Rom. See Appendix A for a
description of how to use the ArcView maps provided on the CD-Rom.
66
APPENDIX E: ESKER BIBLIOGRAPHY
A bibliographic report on esker research was prepared by Bonnie Gallinger
(M.Sc.) For INAC - Land Administration. The author takes this opportunity to
acknowledge Ms. Gallinger for the tremendous effort put into compiling the
Bibliographic citations and especially for the concise summary of the diverse
research on eskers which continually fascinates and surprises scientists in it’s
diversity and complexity.
Paper format of the bibliography is provided under separate cover. Several
digital forms of the bibliography are provided on the enclosed CD-Rom under the
folder “Bibliography”. The entire database of citations is contained in an
EndNote® file labeled “Eskerbib.enl”. This report is found in three separate
formats namely, Eskbib.wpd (WordPerfect®), Eskbib.doc (MSWord 6.0/7.0®),
and Eskbib.txt (ASCI generic word processor). Finally individual topics are
provided in two formats, *.doc (MSWord®) and *.wpd (WordPerfect®).