espm 150/290 lecture 6: forensic genetic analysis 24 february, 2011 guest lecturer: todd osmundson,...
Post on 21-Dec-2015
214 views
TRANSCRIPT
ESPM 150/290Lecture 6: Forensic Genetic
Analysis24 February, 2011
Guest Lecturer: Todd Osmundson, Ph.D.
Postdoctoral Researcher, Garbelotto Lab

The case of Colin Pitchfork» Narborough, Leicestershire, England, 1983 and
1987: 2 brutal rapes/murders of 15-year-old girls unsolved. Cases so closely matched that police strongly believe a single suspect committed both.
» 1984, Leicester University: Professor Alec Jeffreys develops techniques for DNA fingerprinting
» A 17-year-old suspect first denied involvement, but under extensive questioning admitted to the second but not the first murder
» Genetic comparison of crime scene and suspect’s blood samples showed he was not responsible for either murder. Thus, Richard John Buckland was the first person exonerated of a crime by DNA evidence.
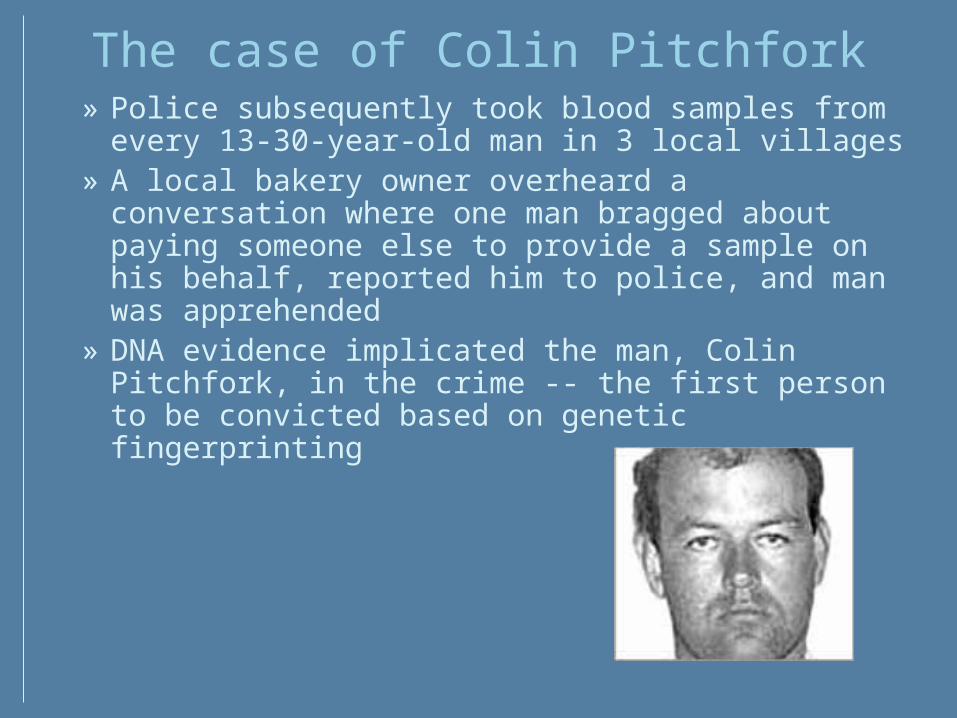
The case of Colin Pitchfork» Police subsequently took blood samples from
every 13-30-year-old man in 3 local villages » A local bakery owner overheard a
conversation where one man bragged about paying someone else to provide a sample on his behalf, reported him to police, and man was apprehended
» DNA evidence implicated the man, Colin Pitchfork, in the crime -- the first person to be convicted based on genetic fingerprinting
How can we assess the relatedness of individuals?
Molecular genetic approaches to assessing relatedness
» What is phenotype?» Physical appearance or other physically
observable manifiestation (biochemical, physiological, behavioral, ecological) of the genotype
» Product of genotype-environment interaction» The unit upon which natural selection acts; can
lead to phenotypic convergence» Genotype: The genetic composition (i.e., DNA
sequence) of an organism. The unit of inheritance.» What can we gain from observing the genotype
directly?» Direct observation of genetic relatedness» Characters may be more objective to assess (not
always true, however)
Sources: (clockwise from upper left: http://www.healthinmotion.net/HIM/HTM/LS.html; http://www.alzheimers.org/rmedia/IMAGES/LOW/Dna_low.jpg; http://radiographics.rsna.org
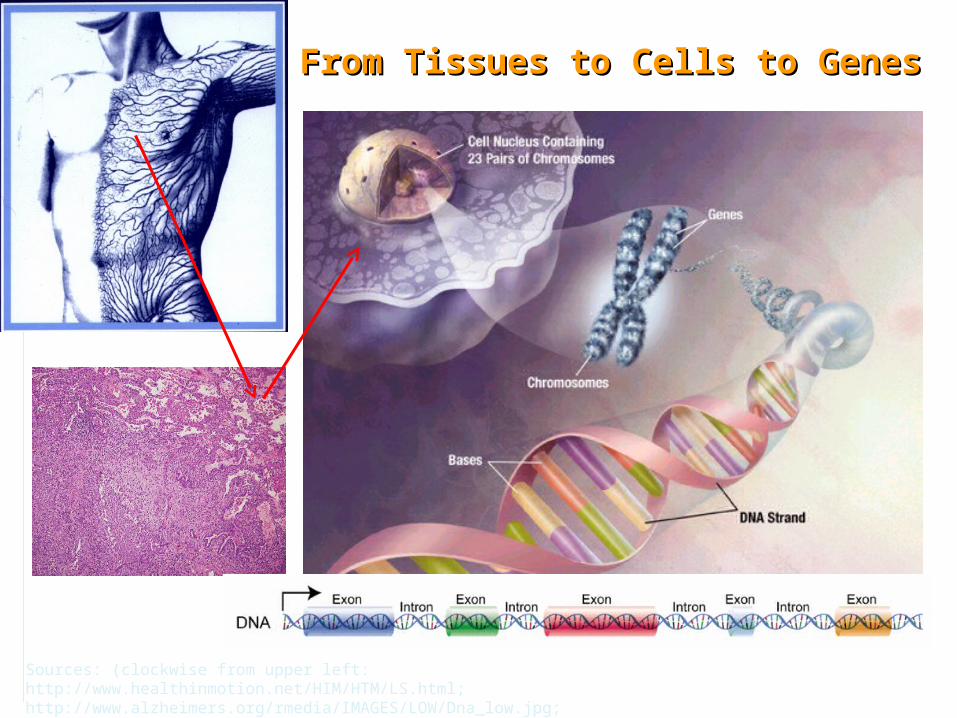
From Tissues to Cells to GenesFrom Tissues to Cells to Genes

DNA Structure• DNA is the genetic information-carrying molecule in a cell
• 4 building blocks (bases): Adenine, Cytosine, Guanine, and Thymine
A and T bind together
G and C bind together
• 2 strands arranged in a double helix
• The sequence of a piece of DNA is the order of its bases, depicted as a string of letters (e.g., TGCATTACTACGTG)
• Because of the predictable pattern of complementary binding (A +T, G + C), if we determine the sequence of one strand, we automatically know the sequence of the other strand
A Generalized DNA Workflow
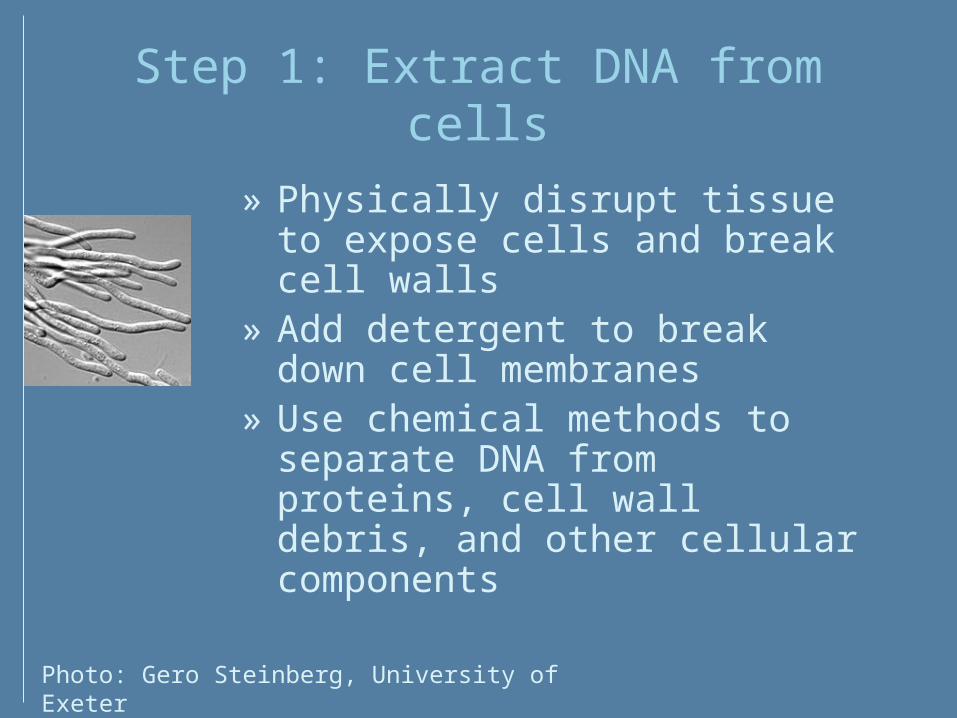
Step 1: Extract DNA from cells
» Physically disrupt tissue to expose cells and break cell walls
» Add detergent to break down cell membranes
» Use chemical methods to separate DNA from proteins, cell wall debris, and other cellular components
Photo: Gero Steinberg, University of Exeter
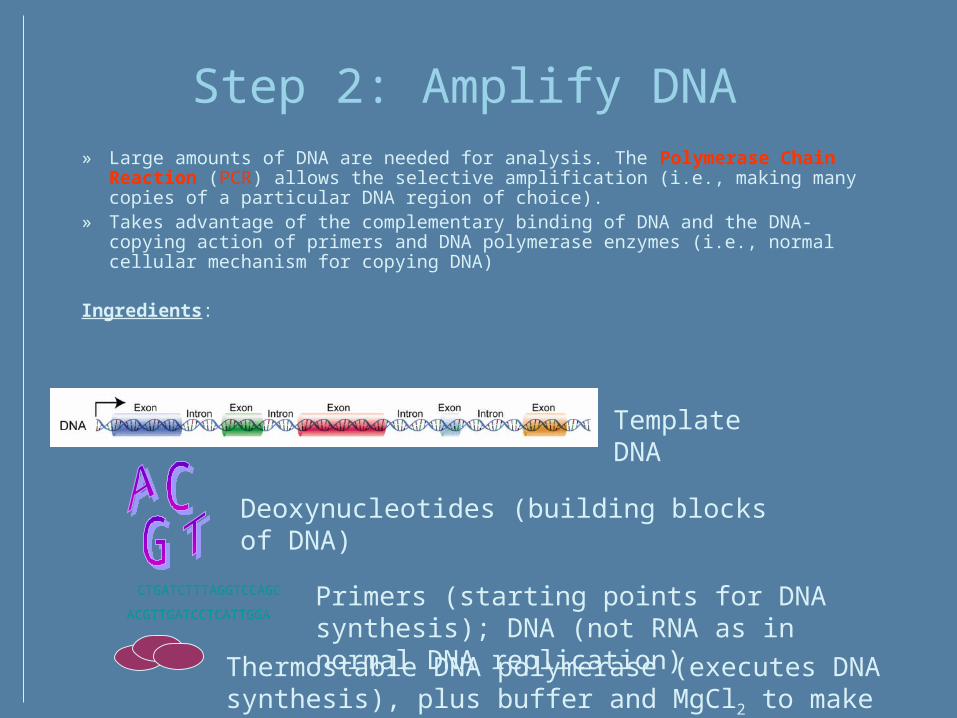
Step 2: Amplify DNA » Large amounts of DNA are needed for analysis. The Polymerase Chain
Reaction (PCR) allows the selective amplification (i.e., making many copies of a particular DNA region of choice).
» Takes advantage of the complementary binding of DNA and the DNA-copying action of primers and DNA polymerase enzymes (i.e., normal cellular mechanism for copying DNA)
Ingredients:
Deoxynucleotides (building blocks of DNA)
ACGTTGATCCTCATTGGA
CTGATCTTTAGGTCCAGC Primers (starting points for DNA synthesis); DNA (not RNA as in normal DNA replication)
Thermostable DNA polymerase (executes DNA synthesis), plus buffer and MgCl2 to make it work
Template DNA
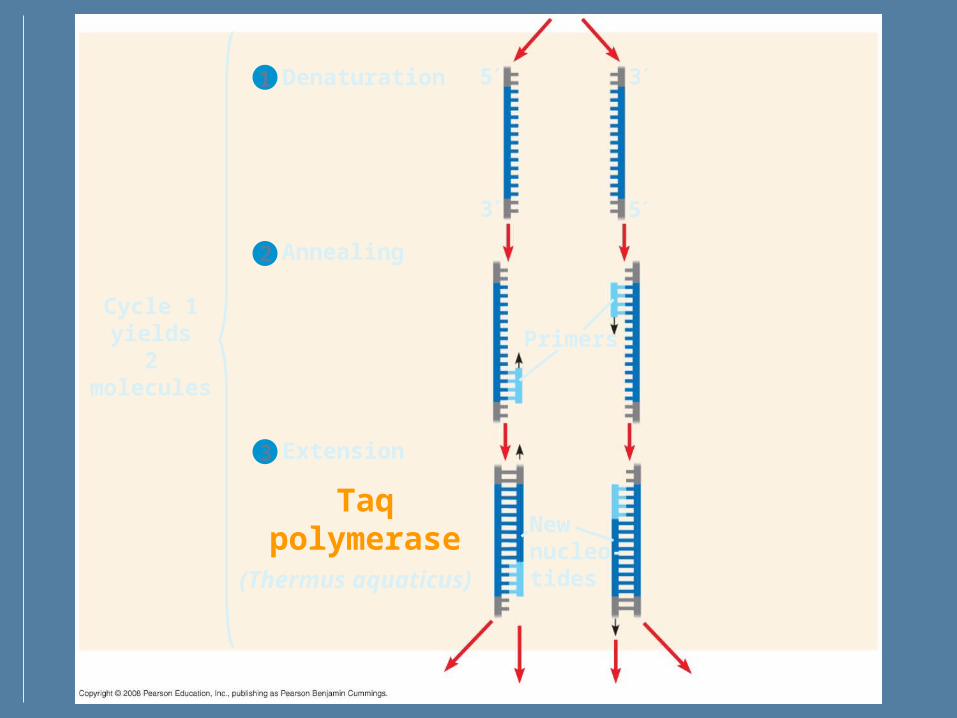
Cycle 1yields
2molecules
Denaturation
Annealing
Extension
Primers
Newnucleo-tides
3 5
3
2
5 31
Taqpolymerase
(Thermus aquaticus)

Cycle 2yields
4molecules
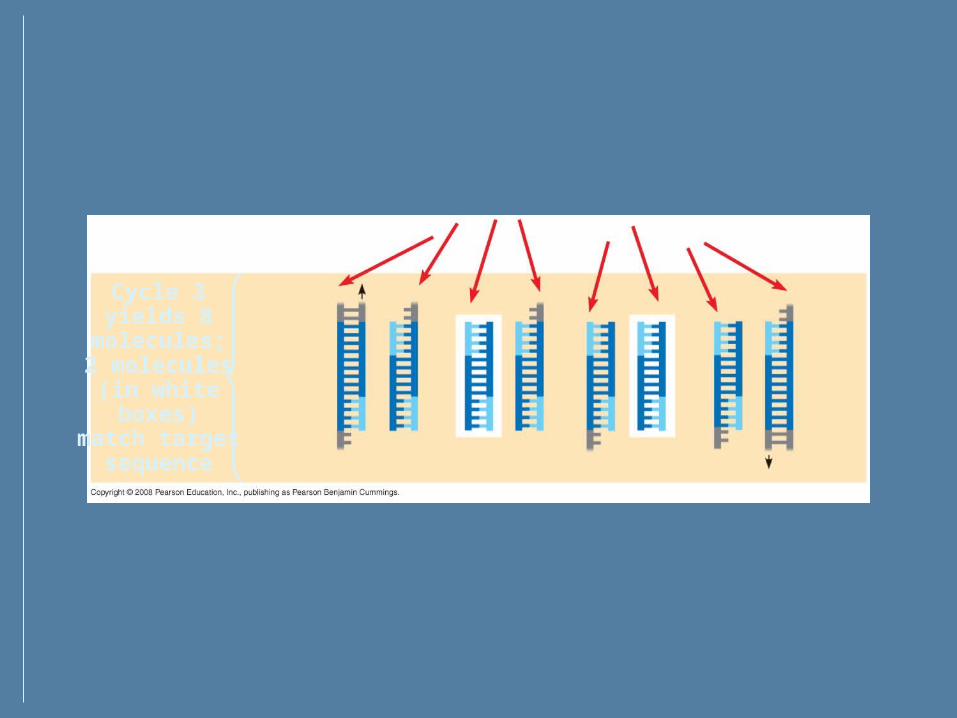
Cycle 3yields 8
molecules;2 molecules
(in whiteboxes)
match targetsequence

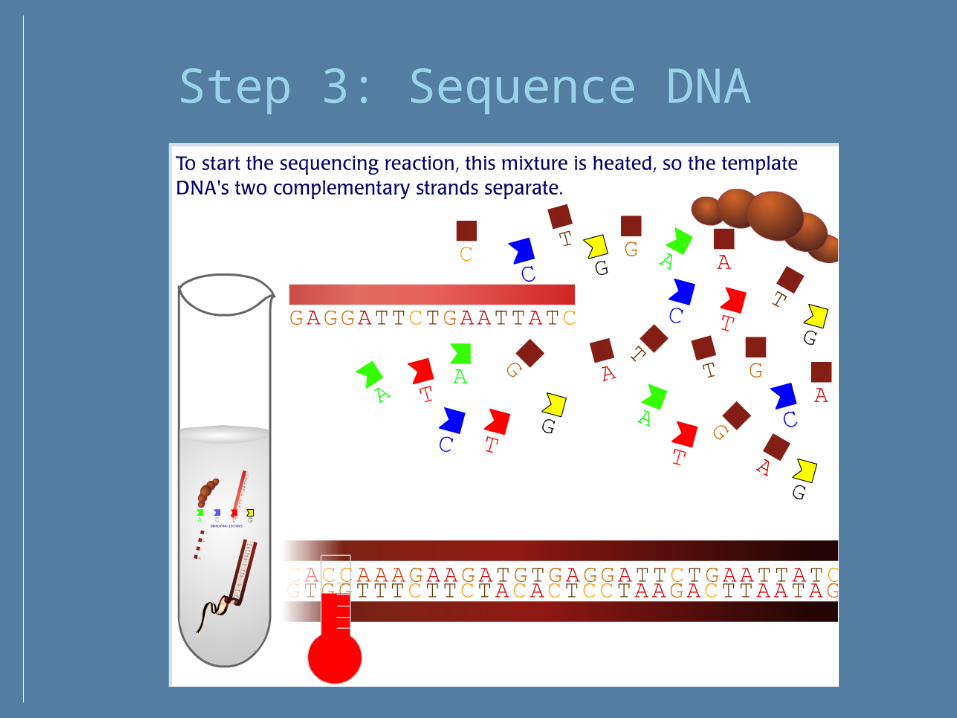
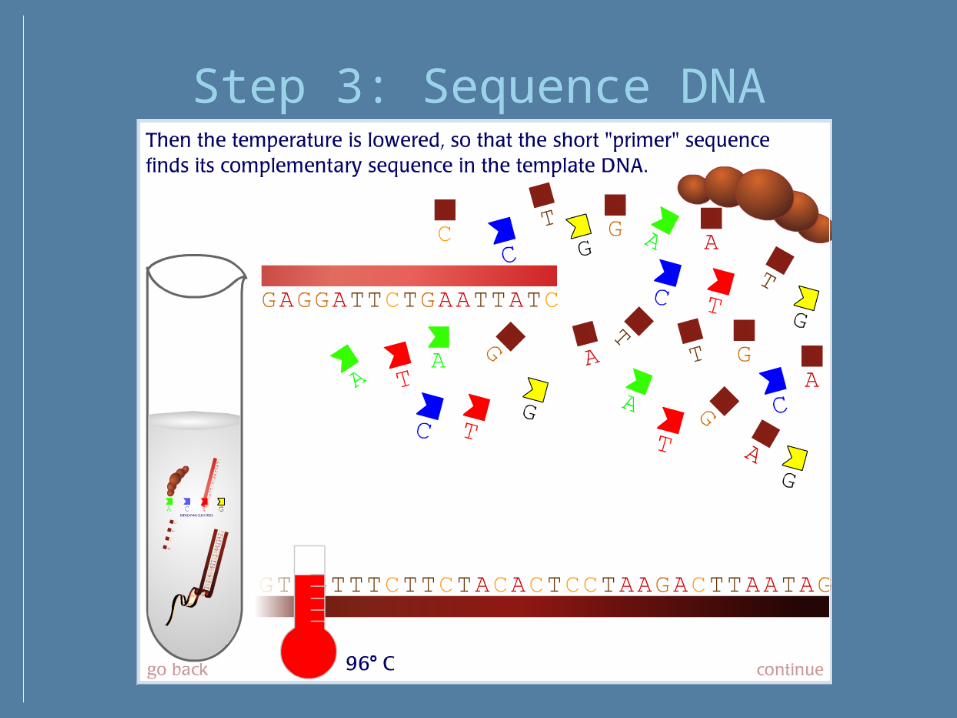
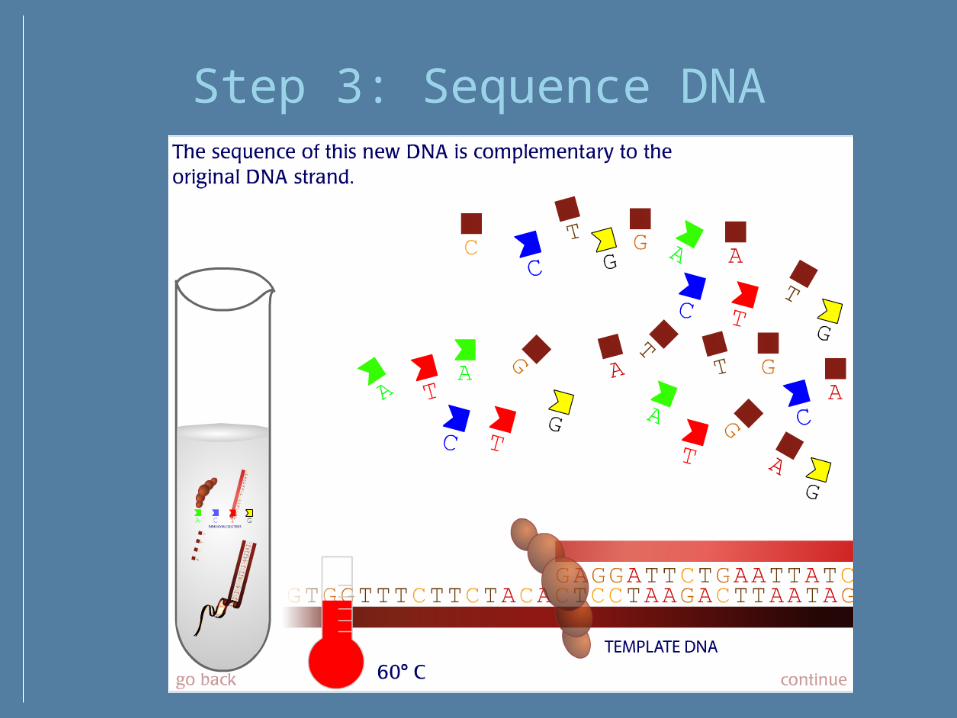
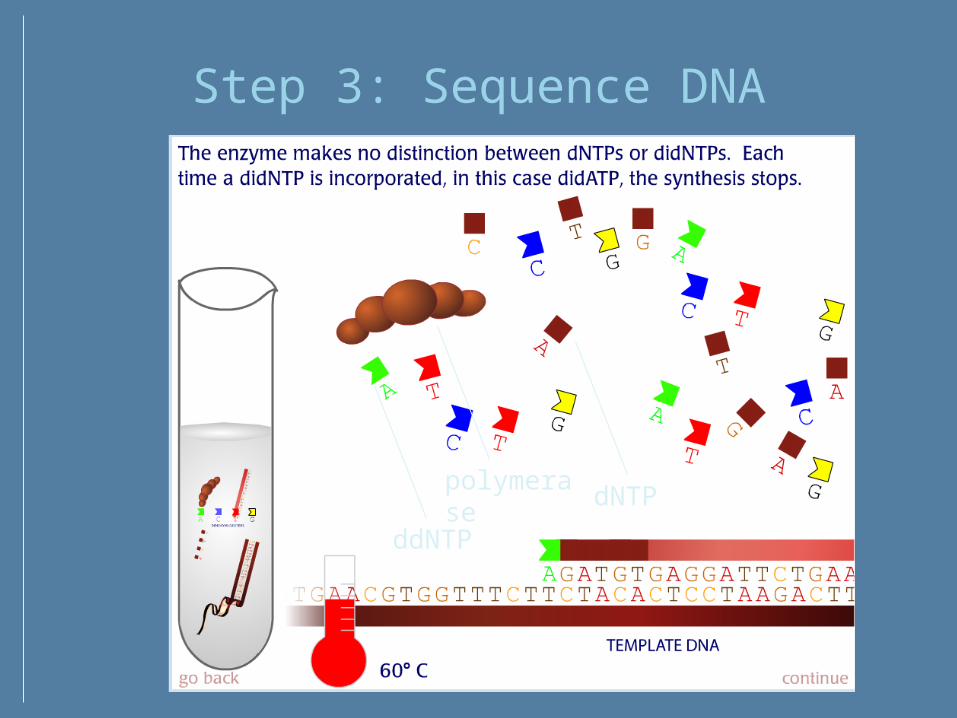
Step 3: Sequence DNA » Most current applications use Sanger sequencing, which involves a modified
PCR reaction that includes chain-terminating, fluorescently-labeled versions of the bases (each type of base has a different color fluorescence signal)
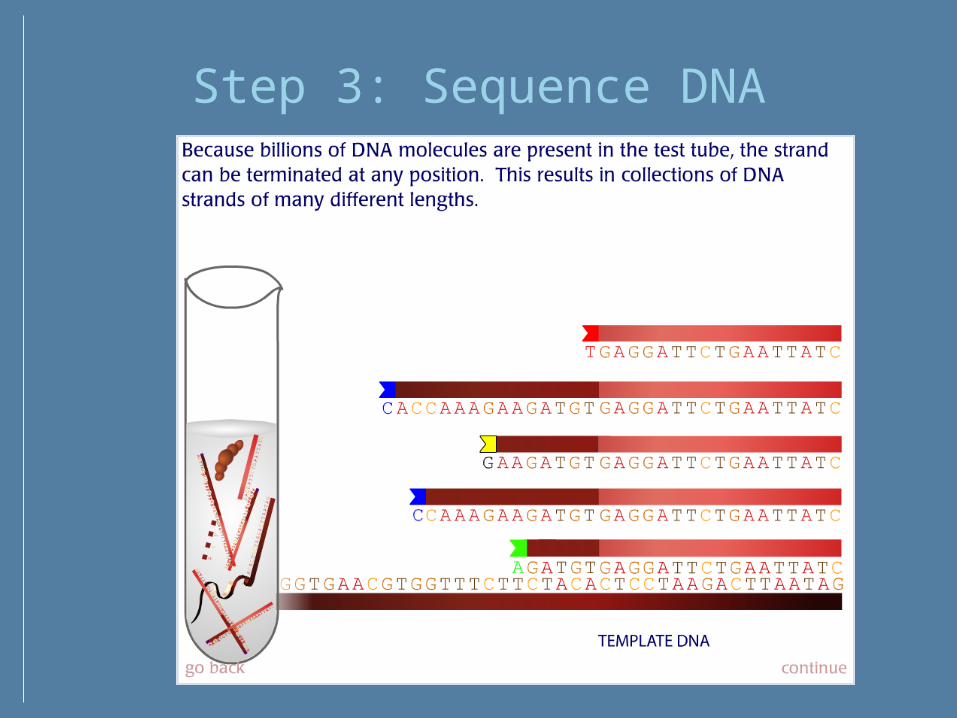
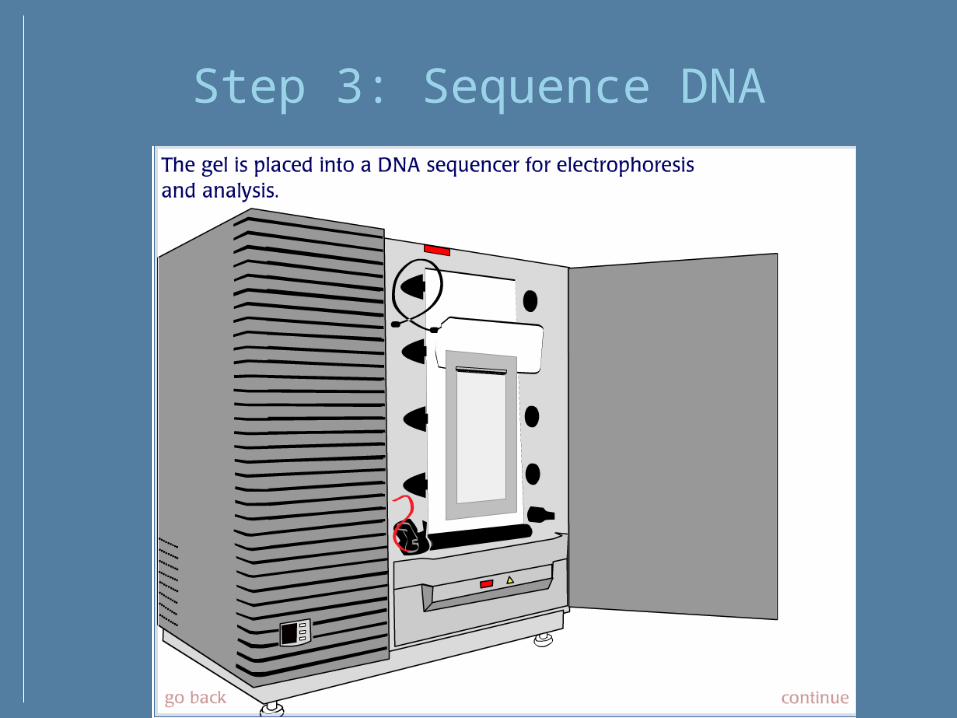
» Different points of incorporation of chain-terminating bases yields many DNA copies of varying lengths. An automated sequencing machine reads both the length and the fluorescence signal for each fragment, and puts this information together to produce a chromatogram. The machine also assembles the information into a sequence text file.
Step 3: Sequence DNA
Step 3: Sequence DNA
Step 3: Sequence DNA
Step 3: Sequence DNA
dNTP
ddNTP
polymerase
Step 3: Sequence DNA
Step 3: Sequence DNA

Step 3: Sequence DNA
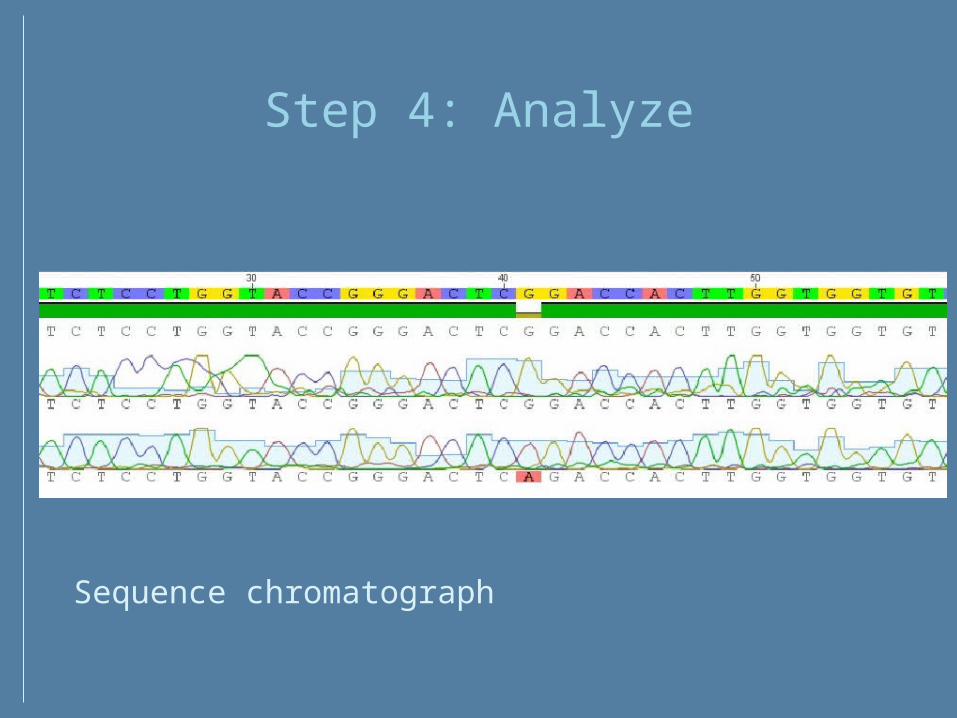
Step 4: Analyze
Sequence chromatograph
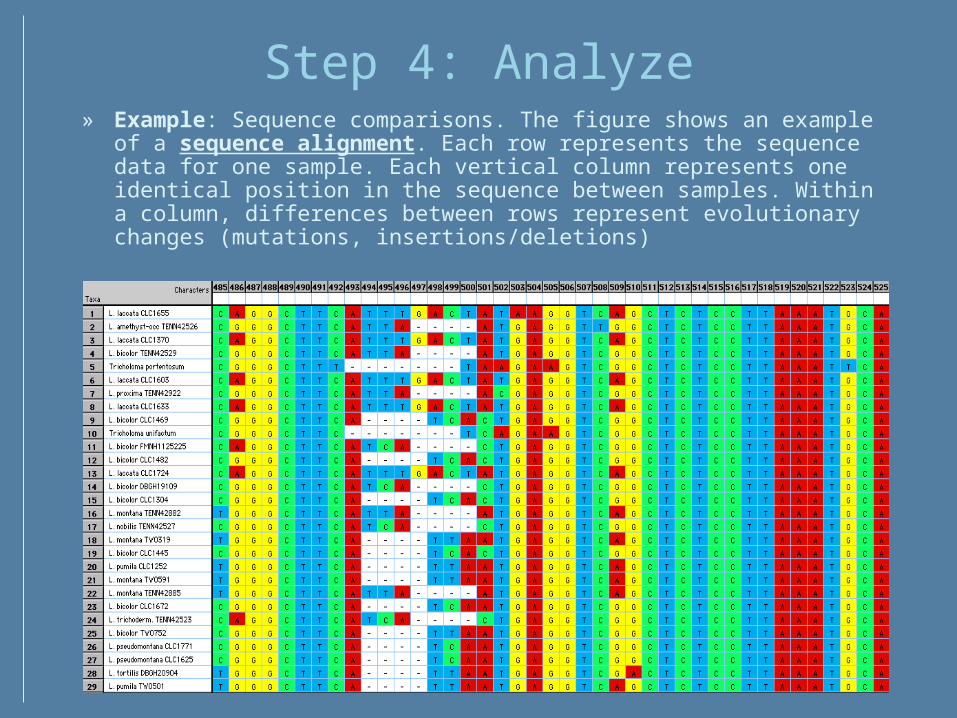
Step 4: Analyze» Example: Sequence comparisons. The figure shows an
example of a sequence alignment. Each row represents the sequence data for one sample. Each vertical column represents one identical position in the sequence between samples. Within a column, differences between rows represent evolutionary changes (mutations, insertions/deletions)

Step 4: Analyze» Example: querying the GenBank database to determine the
identity or putative function of an unknown DNA sequence by comparing it to the sequence of known genes.

Step 4: Analyze» Example: phylogenetic tree building. Group organisms by
analyzing changes between DNA sequences using a selected criterion (e.g., optimizing the arrangement of relationships so that it contains the least number of total changes, or so that it is the most probable given a model of how sequences are believed to change over time).
Figure: Greg Mueller, The Field Museum
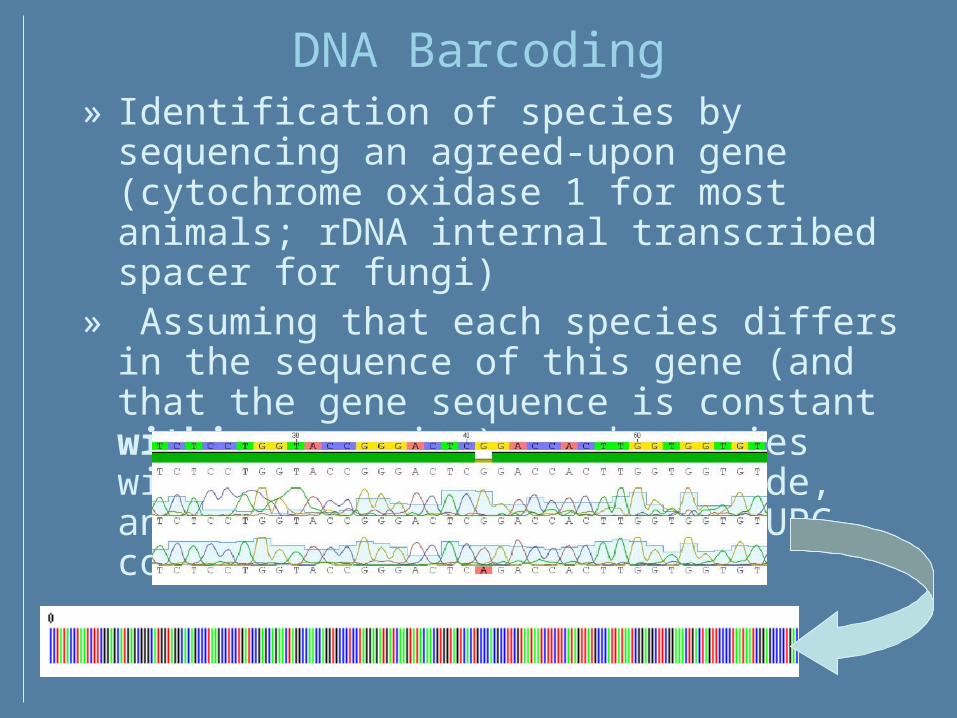
DNA Barcoding» Identification of species by sequencing an
agreed-upon gene (cytochrome oxidase 1 for most animals; rDNA internal transcribed spacer for fungi)
» Assuming that each species differs in the sequence of this gene (and that the gene sequence is constant within a species), each species will have a unique genetic code, analogous to the supermarket UPC code.
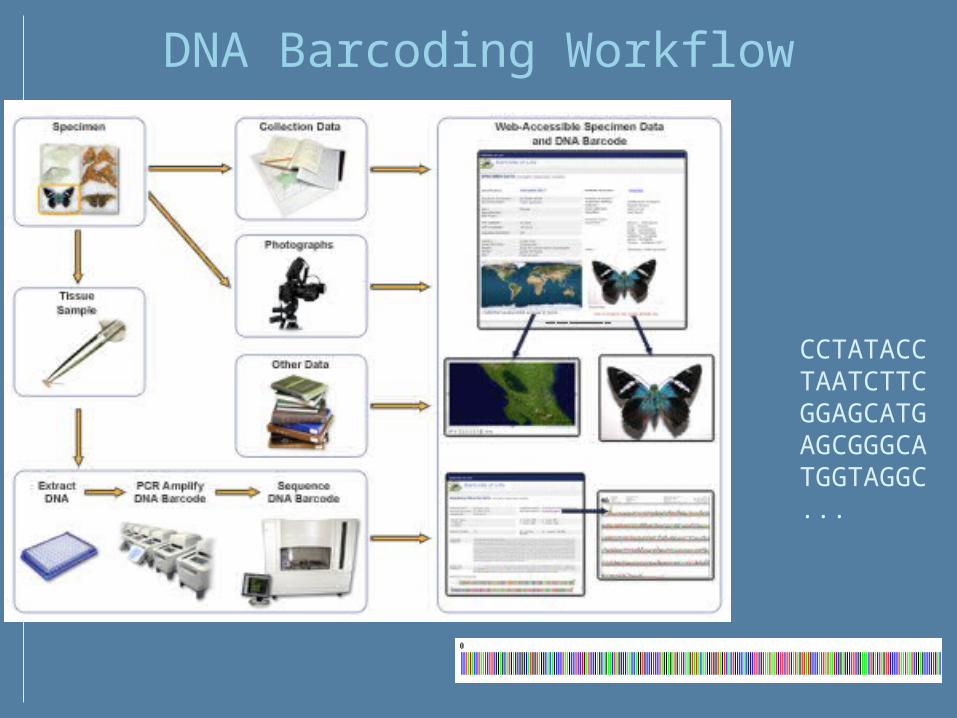
DNA Barcoding Workflow
CCTATACCTAATCTTCGGAGCATGAGCGGGCATGGTAGGC...
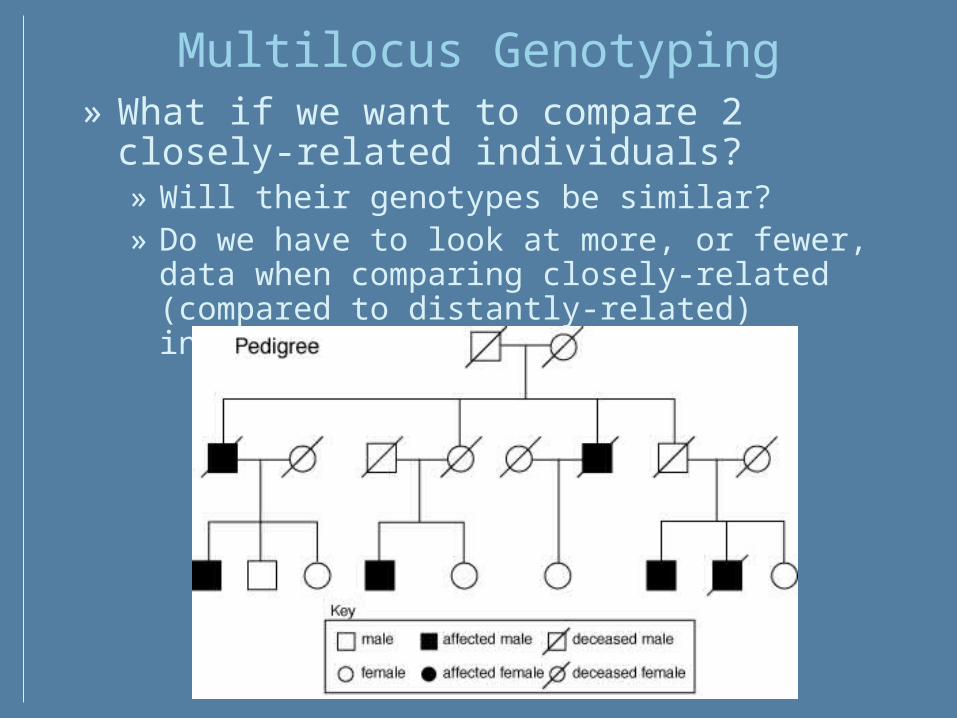
Multilocus Genotyping» What if we want to compare 2 closely-
related individuals?» Will their genotypes be similar?» Do we have to look at more, or fewer, data
when comparing closely-related (compared to distantly-related) individuals?

Molecular Markers» Inherited genotypic
Powersource
Gel
AnodeCathode
– +
+–
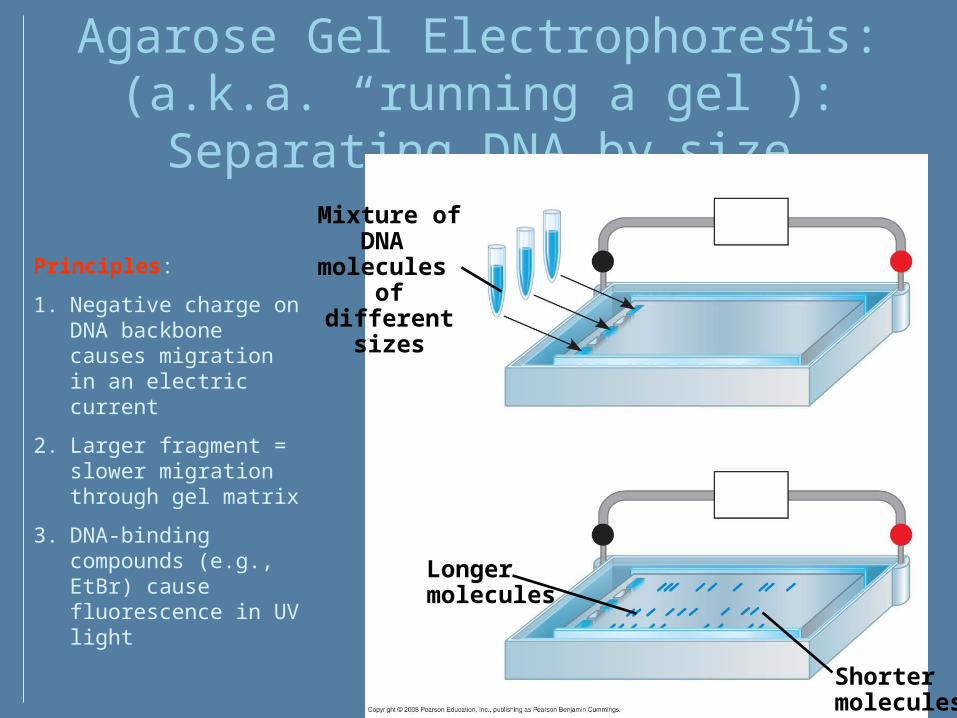
Agarose Gel Electrophoresis: (a.k.a. “running a gel”): Separating DNA by
size
Powersource
Principles:
1. Negative charge on DNA backbone causes migration in an electric current
2. Larger fragment = slower migration through gel matrix
3. DNA-binding compounds (e.g., EtBr) cause fluorescence in UV light
Shortermolecules
Mixture ofDNA
molecules of
differentsizes
Longermolecules
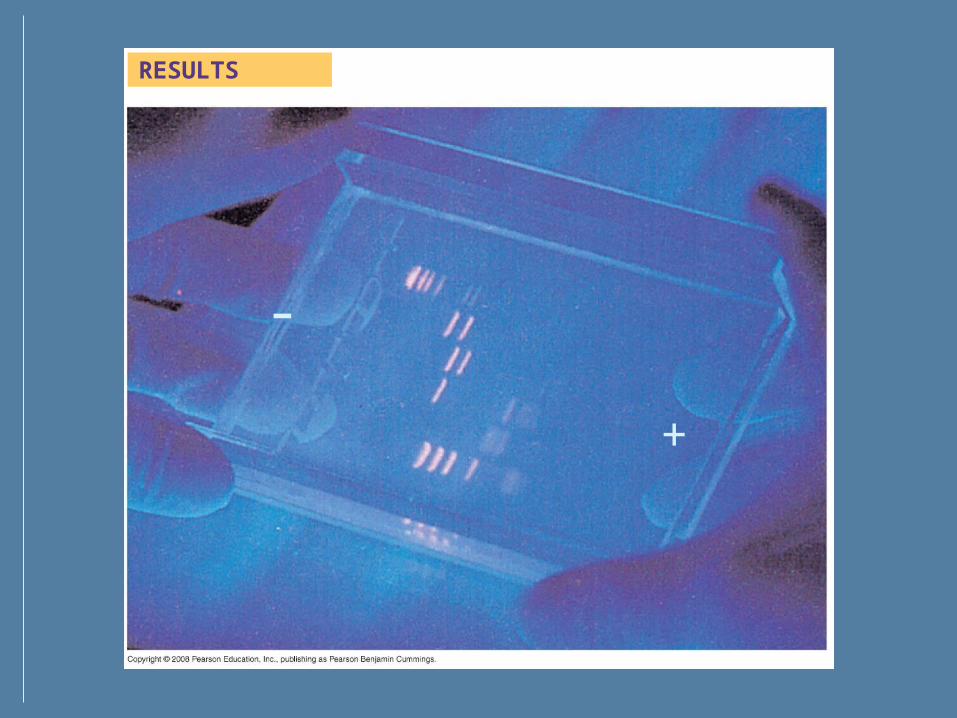
RESULTS
+
-
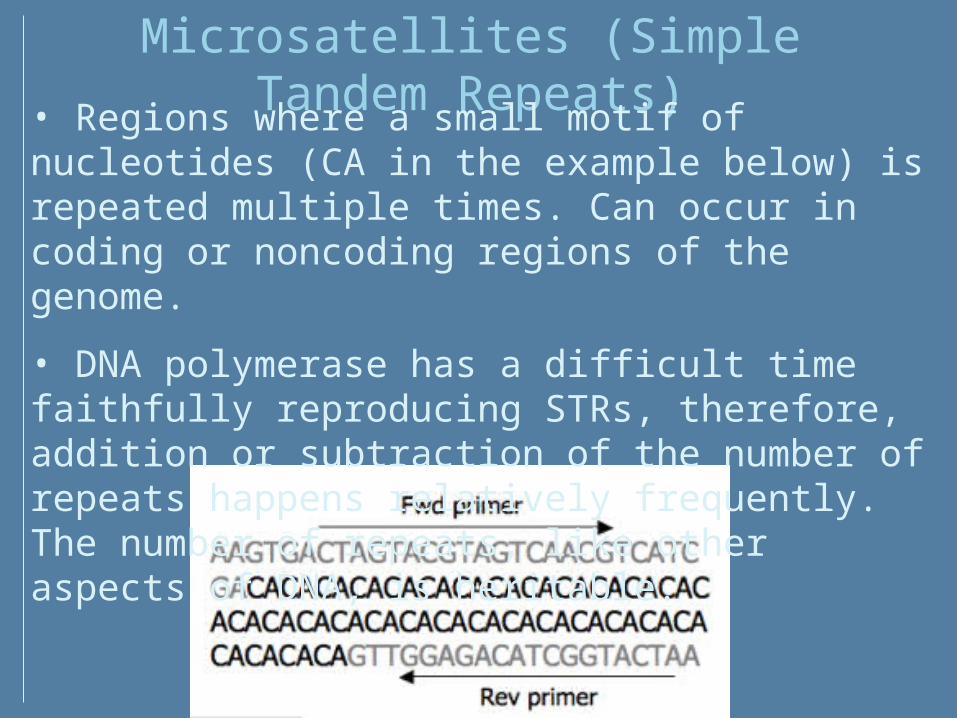
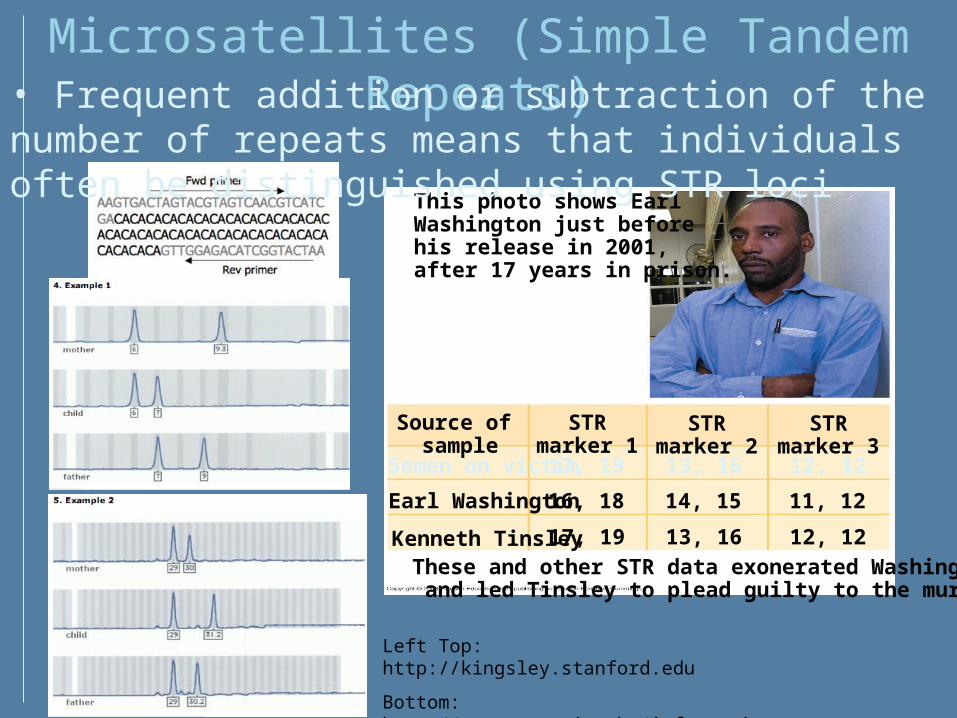
Microsatellites (Simple Tandem Repeats)• Regions where a small motif of nucleotides
(CA in the example below) is repeated multiple times. Can occur in coding or noncoding regions of the genome.
• DNA polymerase has a difficult time faithfully reproducing STRs, therefore, addition or subtraction of the number of repeats happens relatively frequently. The number of repeats, like other aspects of DNA, is heritable.
Microsatellites (Simple Tandem Repeats)
Left Top: http://kingsley.stanford.edu
Bottom: http://www.paternity.be/information_EN.html
This photo shows EarlWashington just before his release in 2001,after 17 years in prison.
These and other STR data exonerated Washington and led Tinsley to plead guilty to the murder.
Semen on victim
Earl Washington
Source of sample
Kenneth Tinsley
STRmarker 1
STRmarker 2
STRmarker 3
17, 19
16, 18
17, 19
13, 16 12, 12
14, 15 11, 12
13, 16 12, 12
• Frequent addition or subtraction of the number of repeats means that individuals often be distinguished using STR loci
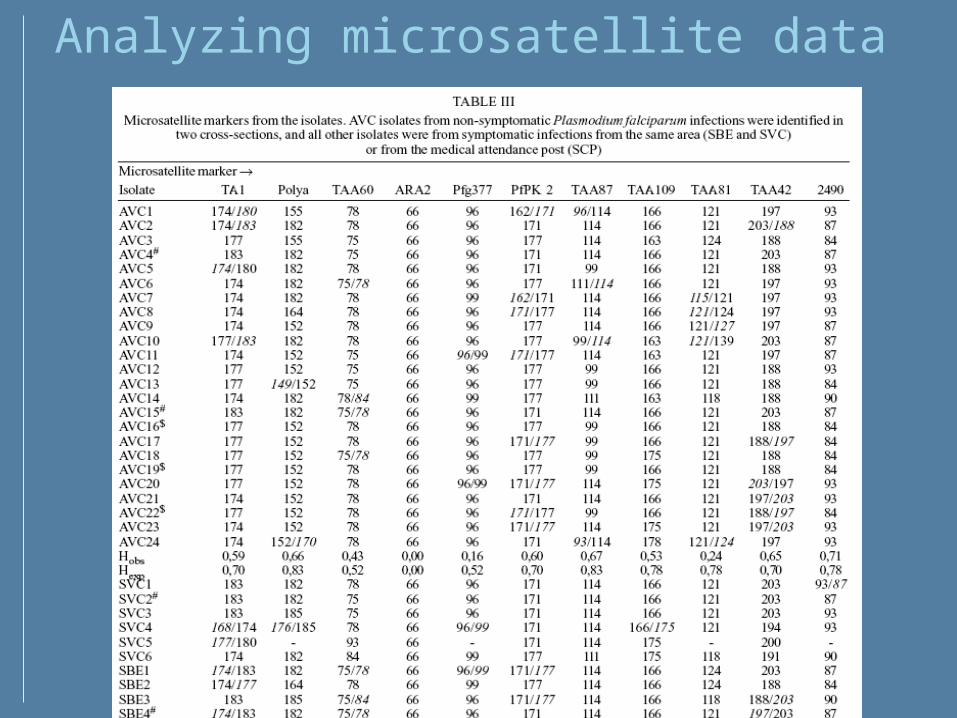
Analyzing microsatellite data

Analyzing microsatellite data
1. Raw data(dalla Martha et
al., 2007)
2. Data converted to genetic distances(dalla Martha et al., 2007)
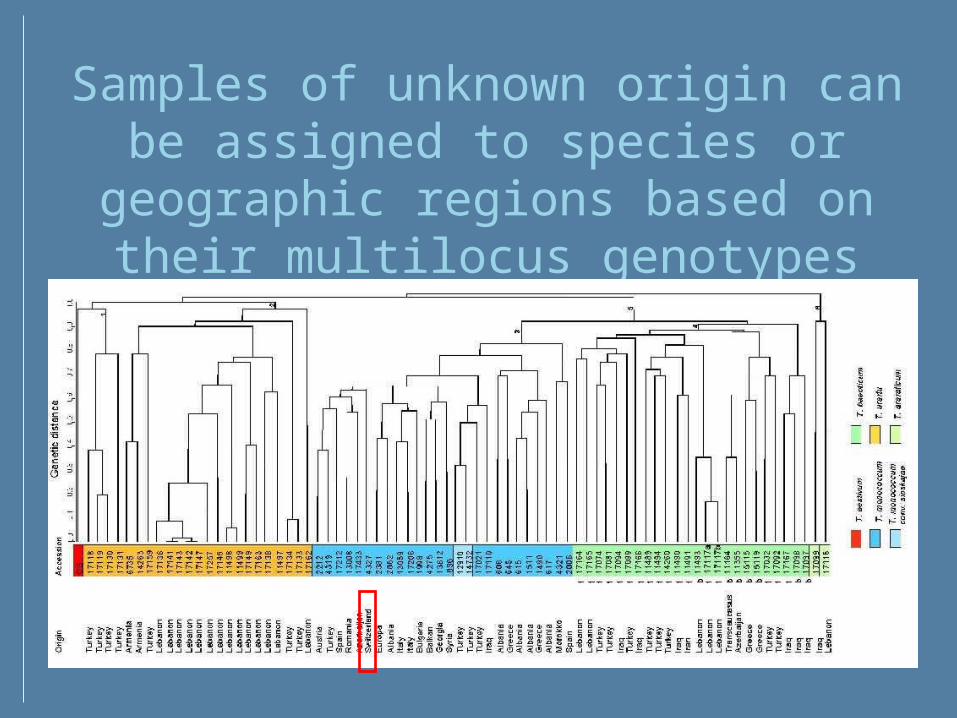
Samples of unknown origin can be assigned to species or geographic regions based on their multilocus
genotypes