espon qol quality of life measurements and methodology
TRANSCRIPT

ESPON QoL – Quality of Life Measurements and Methodology
Annex 11 to the Final Report
Case study: WALES
Applied Research
Final Report
30th October 2020

Final Report
This applied research activity is conducted within the framework of the ESPON 2020 Cooperation
Programme.
The ESPON EGTC is the Single Beneficiary of the ESPON 2020 Cooperation Programme. The Single
Operation within the programme is implemented by the ESPON EGTC and co-financed by the
European Regional Development Fund, the EU Member States and the Partner States, Iceland,
Liechtenstein, Norway and Switzerland.
This delivery does not necessarily reflect the opinion of the members of the ESPON 2020 Monitoring
Committee.
Project team
Carlo Sessa, Giorgia Galvini, Institute of Studies for the Integration of Systems – ISINNOVA (Italy)
Oriol Bioscal, Harold del Castillo, MCRIT (Spain)
Herta Tödtling-Schönhofer, Alina Schönhofer, Metis (Austria)
Daniel Rauhut, Teemu Makkonen, University of Eastern Finland – UEF (Finland)
Maarten Kroesen, TUDelft (Netherlands)
Author of the case study
Haris Martinos, Metis Expert
Project Support Team
Sabine Stölb
LE GOUVERNEMENT DU GRAND-DUCHÉ DE LUXEMBOURG
Ministère de l’Énergie et de l’Aménagement du territoire
Département de l’aménagement du territoire
Janja Pečar
REPUBLIKA SLOVENIJA
URAD RS ZA MAKROEKONOMSKE ANALIZE IN RAZVOJ
Anna Lea Gestsdóttir
Byggðastofnun
Icelandic Regional Development Institute
ESPON EGTC:
Project Expert: Sandra Di Biaggio
Financial Expert: Caroline Clause
Information on ESPON and its projects can be found on www.espon.eu.
The web site provides the possibility to download and examine the most recent documents produced
by finalised and ongoing ESPON projects.
© ESPON, 2020
Printing, reproduction or quotation is authorised provided the source is acknowledged and a copy is
forwarded to the ESPON EGTC in Luxembourg.
Contact: [email protected]

Annex 11 to the Final Report
Case Study 08:
Wales
ESPON QoL – Quality of Life Measurements and Methodology
30th October 2020
Disclaimer: This document is an Annex to the final report. The information contained herein is subject to change and does not commit the ESPON EGTC and the countries participating in the ESPON 2020 Cooperation Programme. The final version of the report will be published as soon as approved.

ESPON / QoL – Quality of Life Measurements and Methodology / Draft Final Report ii
Table of contents
1 Description of the region ................................................................................................... 3
1.1 Characteristics of the region .............................................................................................. 3
1.2 Rationale for selecting the case study .............................................................................. 5 2 Policy context .................................................................................................................... 6
2.1 Outline of the QoL concept ................................................................................................ 6
2.2 Evolution of the QoL approach .......................................................................................... 7
2.3 Governance levels and the use of QoL in a policy context ............................................... 7
2.4 Success factors and obstacles ........................................................................................ 15
2.5 Achievements and further plans ...................................................................................... 16 3 Measuring Quality of Life ................................................................................................. 18
3.1 Indicators and measurement ........................................................................................... 18
3.2 Data sources for QoL ...................................................................................................... 22 4 Analysing and testing the methodology used in the case study as compared to the TQoL
approach .......................................................................................................................... 24
4.1 Comparing the QoL approach in the case study with the TQoL framework ................... 24
4.2 Coding the indicators ....................................................................................................... 24
4.3 Other relevant features of the approach ......................................................................... 27 4.3.1 QoL in a territorial context ..................................................................................... 27 4.3.2 Objective and subjective indicators ....................................................................... 27 4.3.3 Involvement of citizens – Citizen-centric approach to Quality of Life ................... 28
4.4 Application of the methodology in the case study context .............................................. 29 5 Synthesis and conclusions .............................................................................................. 34
6 Recommendations .......................................................................................................... 37
6.1 How the QoL concept and indicators could be further developed in the region ............. 37
6.2 How the QoL concept of this ESPON project can be improved and enriched ................ 37 7 Sources ........................................................................................................................... 38
7.1 Literature and websites ................................................................................................... 38

ESPON / QoL – Quality of Life Measurements and Methodology / Draft Final Report iii
List of Figures
Figure 1 The TQoL framework .................................................................................................. 1
Figure 2 Wales and its sub-regions (local authority areas, LAU) .............................................. 4
Figure 3 Main QoL institutions and linkages ........................................................................... 12
Figure 4 Allocation of indicators to the well-being goals ......................................................... 21
Figure 5 Allocation of indicators to the SDGs .......................................................................... 22
Figure 6 Territorial Quality of Life framework .......................................................................... 24
Figure 7 Dashboard for Wales: scales for domains and sub-domains – recent version (2016-
2019) ........................................................................................................................................ 30
Figure 8 Dashboard for Wales: scales for domains and sub-domains - past version (2010-2012)
................................................................................................................................................. 30
Figure 9 Dashboard for Wales: Map of Wales Territorial Quality of Life Index 2016 – 2019 .. 31
Figure 10 Dashboard for Wales: Map of Wales Territorial Quality of Life Index 2010 – 2012 31
Figure 11 Dashboard for Wales: Map of Wales Development 2010 – 2019 Territorial Quality of
Life Index ................................................................................................................................. 31
Figure 12 Dashboard for Wales: composite indices – recent version (2016-2019) ................ 32
Figure 13 Dashboard for Wales: composite indices – past version (2010-2012) ................... 32
Figure 14 Dashboard for Wales: Maps of Wales TQoL Index 2016 – 2019 Life Maintenance
Pillar ......................................................................................................................................... 33
Figure 15 Dashboard for Wales: Maps of Wales TQoL Index 2010 – 2012 Life Maintenance
Pillar ......................................................................................................................................... 33
Figure 16 Dashboard for Wales: Map of Wales Development 2010 – 2019 TQoL Index Life
Maintenance Pillar ................................................................................................................... 33

ESPON / QoL – Quality of Life Measurements and Methodology / Draft Final Report iv
List of Tables
Table 1 Coding of the indicator system in the TQoL framework ............................................... 2
Table 2 Statistical definition of Wales and its sub-regions ........................................................ 5
Table 3 Wales indicators and their characteristics .................................................................. 19
Table 4 Overview of data used for measuring QoL in Wales .................................................. 22
Table 5 Coding system of the Wales indicators ...................................................................... 26

ESPON / QoL – Quality of Life Measurements and Methodology / Draft Final Report v
Abbreviations
FG Commissioner Future Generations Commissioner for Wales
GVA Gross Value Added
NRW Natural Resources Wales
PB Public Bodies
PBS Public Services Board
QoL Quality of Life
RBA Results Based Accountability
SDG Sustainable Development Goals
TQoL Territorial Quality of Life
WFG Act Well-being of Future Generations (Wales) Act 2015

ESPON / QoL – Quality of Life Measurements and Methodology / Draft Final Report vi

ESPON / QoL – Quality of Life Measurements and Methodology / Draft Final Report 1
Introduction
This is one of the 10 case studies of the ESPON study “Quality of Life Measurements and
Methodology”. The purpose and results of the study, including the definition and application of
a territorial quality of life measurement methodology, the synthesis of all case study findings,
targeted policy recommendations, ideas for fostering cooperation between ESPON,
EUROSTAT, OECD and the UN and recommendations for further research, are illustrated in
the Final Report, to which this case study report is annexed.
The purpose of the case studies is twofold:
A) to collect good practices that can be adopted in other European regions, and
B) to make use of the methodology developed and allow for adjustments through testing
in case studies.
Each case study provides examples of application of the concept of quality of life (QoL) in a
specific region. This complements the conceptual model and the research done at European
level. The reasons why this region has been chosen forms part of Section 1.
For objective A) the case study report explores the policy context, in which QoL is used and
measured in the region (Section 2). It is important to understand for which purpose the concept
has been established, in which policy fields it is being used, how different levels of government
are involved and which success factors and obstacles can be identified. Section 3 explains the
indicators, measurement methods and data that are used for measuring QoL.
Objective B) is covered in Section 4. The study defines and tests a methodology to measure
QoL at territorial (sub-national) level and offers guidance to policy makers at different levels –
local, regional, national, European – on how to integrate QoL in policy processes and in
territorial development strategies. We have applied to the case studies the methodology
developed in the main report. This includes the Territorial Quality of Life (TQoL) measurement
system and the system for coding indicators.
The TQoL framework defines the system and its main elements (pillars, spheres, sub-
domains) to measure QoL facets with reference to territorial entities identified. This is shown in
the TQoL framework in figure 1 below.
Figure 1 The TQoL framework
Pe
rso
nal
e
nab
lers
Soci
o-e
con
om
icen
able
rs
Good Life Enablers
:Enablers of good
Shelter, Education,
Health
Eco
logi
cale
nab
lers
Transport
Health-care
Education
Housing &
basic utilities
Consumption
Public spaces
Work
Cultural assets
Digital connectivity
Green infrastructure
Protected areas
Life Flourishing
Self-actualisationPers
on
al
Flo
uri
shin
g Self-esteem
Interpersonal Trust
(social belonging)
Institutional Trust
(good governance)Co
mm
un
ity
Flo
uri
shin
g
Life Maintenance
Personal Health
indicators
Pers
on
al H
ealt
h
& S
afet
yEc
on
om
ic&
So
ciet
alH
ealt
hEc
olo
gica
lHea
lth
Personal Safety
indicators:
Inclusive Economy
indicators
Climate Change
indicators
Healthy Society
indicators
Healthy Environment
indicators
Eco
logi
cal
Flo
uri
shin
g
PERSONAL SPHERE
SOCIO-ECONOMIC SPHERE
ECOLOGICAL SPHERE
:Enablers of good
Mobility, Connectivity,
Work and Consumption
choices, Social and
Cultural life
:Enablers of good
life in green
environments
Ecosystems
services and
biodiversity
wealth
QoL ENABLERS PILLAR QoL OUTCOMES PILLAR

ESPON / QoL – Quality of Life Measurements and Methodology / Draft Final Report 2
The system for coding indicators to represent and monitor adequately the different QoL
domains, defined in the TQoL framework, is illustrated in Table 1 below.
Table 1 Coding of the indicator system in the TQoL framework
Both, the TQoL framework and the coding system are applied in all case studies (Sections 4.1
and 4.2).
The methodology developed in this report includes further elements - a dashboard, the latent
clustering approach and the citizen-centric approach - that are applied in the case studies, if
sufficient data or information have been available. These elements are as follows:
• The indicators coded for local or sub-regional territorial units are presented in a
dashboard (in an Excel-based tool). In the dashboard different points in time or objective
and subjective indicators can be included and compared at territorial unit level. The
specific indicators used to monitor the QoL domains are different in each case, as they
take into account specific local circumstances that influence the selection of indicators
(e.g. availability of data, local priorities and practices).
• In the case studies that cover a large number of territorial units the Latent Class
clustering model helps to analyse underlying patterns and spatial differences of
territorial QoL. However, the number of case studies falling in this category is small.
• A descriptive element of the TQoL approach identified in this applied-research project is
the “citizen-centric” approach, where citizens are engaged in co-design,
implementation and fact-checking activities (“factfulness” tests), to make the
measurement of territorial QoL more responsive to the needs and aspirations of citizens
to improve their everyday life. This can be promoted, recommended, and applied within
the different case study contexts highlighting in particular any existing local practice of
citizen engagement that could be adopted as a concrete example of the approach.
These methodological elements are considered in the case studies which were carried out to
investigate and compare noteworthy experiences of territorial QoL measurements against the
TQoL framework that has been developed with the aim of drawing lessons for further adjusting
and fine tuning the methodology, which will eventually allow for its practical and widespread
use for measuring QoL across territories in Europe.
Dimension Domain Sub-domain Definition
Good Life
EnablersPersonal enablers Housing & basic utilities
Health
Education
Socioeconomic enablers Transport
ICT connectivity
Work opportunities
Consumption opportunities
Public spaces
Cultural Assets
Ecological enablers Green infrastructure
Protected areas
Life Maintenance Personal Health and Safety Personal health indicators
Personal safety indicators
Economic and Societal HealthInclusive economy
indicators
Healthy Society indicators
Ecological HealthHealthy Environment
indicators
Climate change indicators
Life Flourishing Personal Flourishing Self-esteem
Self-actualization
Community FlourishingInterpersonal Trust (Social
Belonging)
Institutional Trust (good
governance)
Ecological FlourishingEcosystems services and
biodiversity wealth

ESPON / QoL – Quality of Life Measurements and Methodology / Draft Final Report 3
1 Description of the region
1.1 Characteristics of the region
Wales is a constituent part of the United Kingdom of Great Britain1 and Northern Ireland. Its
total population, according to the most recent official estimate (mid-2018)2 is 3,138,600
inhabitants. In 2011 it was 3,063,456, according to the 2011 census results. Since the 1980s,
net migration has generally been positive and has contributed more to population growth than
the natural change.
All major cities – Cardiff (362,750 population), Swansea (245,480) and Newport (151,500) –are
located in South Wales, while large parts of the country, especially Mid-Wales are sparsely
populated.
Wales was shaken by the decline of its industrial mainstay, coal mining, and has been in a long-
term process of industrial transition. Since 2016 the steelworks at Port Talbot in South Wales,
employing some 4,000 people, has been under the threat of closing down. The country has
been developing a diversified economy, particularly in the cities of Cardiff and Swansea, while
the countryside, once reliant on small farming, has become reliant on retirees from England
and tourism became an economic staple.
Overall, the modern Welsh economy is dominated by the service sector. However, Wales has
higher shares of employment in agriculture and forestry, manufacturing, and government than
the rest of the UK and it provides concomitantly fewer jobs in financial and business services.
There is active foreign investment in Welsh manufacturing, particularly in its high-technology
industries, but Wales’s GDP per capita and employment rates are far below average for the
United Kingdom.
As the capital city of Wales, Cardiff is the main engine of growth in the Welsh economy and the
significant service centre and economic driver for the wider south Wales economy. The city and
the adjoining Vale of Glamorgan contribute a disproportionately high share of economic output
in Wales. Cardiff is a centre for white-collar professions. The city relies principally on the retail,
finance, media and tourism sectors and has been undergoing major regeneration since the late
20th century, particularly in Cardiff city centre and Cardiff Bay.
Since the late 1990s, Wales has enjoyed a high degree of devolution from central government.
It has its own government (the Welsh Government) and democratically elected Parliament (the
National Assembly for Wales), which can pass laws for Wales in areas, such as health,
education, economic development, transport, agriculture, housing, planning and the
environment. Hence, Wales has full autonomy in the field of QoL with its own legislation (the
Well-being of Future Generations (Wales) Act 2015), institutional arrangements and
procedures (territorially based assessment, planning, measurement and reporting).
The exact definition of Wales and its subregions is, as follows: the NUTS 1 region Wales
includes two NUTS 2 units, 12 NUTS 3 units and 22 LAUs.
1 Great Britain comprises England, Scotland and Wales
2 Released on 26.06.2019 by the ONS
https://www.ons.gov.uk/peoplepopulationandcommunity/populationandmigration/populationestimates

ESPON / QoL – Quality of Life Measurements and Methodology / Draft Final Report 4
The case study covers the whole of Wales at NUTS 1 level, since:
• all the QoL provisions apply uniformly throughout Wales;
• the NUTS 1 level covers both ‘less’ and ‘most’ developed regions according to EU
Cohesion Policy typology:
o UKL1: West Wales and the Valleys (‘Less Developed Region’)
o UKL2: East Wales (‘Most Developed Region’)
• the main sources of information for the case study are the same for any level NUTS
classification.
In the ESPON typology, all the NUTS 3 regions3 are classified as “Region with industrial
branches losing importance”, The regions are mainly either predominantly urban or rural, and
they are coastal regions.
Figure 2 and Table 2 present the area covered by the case study and the statistical definition
of Wales and its subregions.
Figure 2 Wales and its sub-regions (local authority areas, LAU)
Note: 80 – Merthyr Tydfil, 81- Blaenau Gwent
Source: https://www.ons.gov.uk/methodology/geography/ukgeographies/eurostat#wales
3 Except for UKL 12, 13, 14, 18, 22, which are not classified as regions of industrial transition

ESPON / QoL – Quality of Life Measurements and Methodology / Draft Final Report 5
Table 2 Statistical definition of Wales and its sub-regions
Source: https://www.ons.gov.uk/methodology/geography/ukgeographies/eurostat#wales
https://ec.europa.eu/eurostat/web/nuts/local-administrative-units
1.2 Rationale for selecting the case study
The main reasons for selecting Wales for this case study are: the fact that there is a well-
developed and all-encompassing QoL system which is already operational; and, the diversity
of the region.
The Well-being of Future Generations (Wales) Act 2015 (‘the WFG Act’) has established
well-being goals and institutional arrangements applying at regional and local level, including:
• the office of Future Generations Commissioner for Wales (‘FG Commissioner’); and
• a Public Services Board (PBS) for each local authority area in Wales whose members
represent all key public services.
It has also established a planning and implementation system, including Assessments of Local
Well-being and Local Well-being Plans, as well as an extensive monitoring system that has
been operational since 2016, involving 46 specially defined well-being indicators and progress
reporting.
Wales at NUTS 1 level is a highly diverse region, comprising different types of area under EU
Cohesion Policy and ESPON typologies. As such, it provides a very valuable opportunity for
learning from the whole process of developing and operating policy approaches and tools at
sub-Member State level.
UKL11 Isle of Anglesey W06000001 Isle of Anglesey
UKL12 Gwynedd W06000002 Gwynedd
W06000003 Conwy
W06000004 Denbighshire
W06000008 Ceredigion
W06000009 Pembrokeshire
W06000010 Carmarthenshire
W06000024 Merthyr Tydfil
W06000016 Rhondda Cynon Taf
W06000018 Caerphilly
W06000019 Blaenau Gwent
W06000020 Torfaen
W06000012 Neath Port Talbot
W06000013 Bridgend
UKL18 Swansea W06000011 Swansea
W06000021 Monmouthshire
W06000022 Newport
W06000014 Vale of Glamorgan
W06000015 Cardiff
W06000005 Flintshire
W06000006 Wrexham
UKL24 Powys W06000023 Powys
West Wales
and the
Valleys
UKL16 Gwent Valleys
UKL17Bridgend and Neath
Port Talbot
UKL13Conwy and
Denbighshire
UKL14 South West Wales
UKL15 Central Valleys
Monmouthshire
and Newport
UKL22Cardiff and Vale of
Glamorgan
UKL23Flintshire and
Wrexham
NUTS 3 (12 units) LAU (22 units)NUTS 2 (2 units)
UKL Wales
UKL1
East WalesUKL2
NUTS 1 (1 unit)
UKL21

ESPON / QoL – Quality of Life Measurements and Methodology / Draft Final Report 6
2 Policy context
2.1 Outline of the QoL concept
The QoL concept, which has been legally defined and is being implemented in Wales, has been
succinctly presented in the preamble of the WFG Act on 29 April 2015, as follows:
“An Act of the National Assembly for Wales to make provision requiring public bodies to do
things in pursuit of the economic, social, environmental and cultural well-being of Wales in a
way that accords with the sustainable development principle; to require public bodies to report
on such action; to establish a Commissioner for Future Generations to advise and assist public
bodies in doing things in accordance with this Act; to establish public services boards in local
authority areas; to make provision requiring those boards to plan and take action in pursuit of
economic, social, environmental and cultural well-being in their area; and for connected
purposes”.
This Act is a detailed 52-page legal document which established goals, institutional
arrangements, as well as planning, monitoring and reporting procedures and tools.
Hence, the QoL concept in Wales comprises the following elements:
• a legal framework: the WFG Act;
• a set of common goals (‘the well-being goals’), each with its own statutory descriptor,
namely:
o a prosperous Wales
o a resilient Wales
o a healthier Wales
o a more equal Wales
o a Wales of cohesive communities
o a Wales of vibrant culture and thriving Welsh language
o a globally responsible Wales.
• newly created institutional arrangements specifically for QoL purposes:
o the post (and the Office) of Future Generations Commissioner for Wales (FG
Commissioner);
o a Public Services Board for each local authority area in Wales.
• a Well-being Duty: a ‘collective duty’ on the Public Services Boards (PSBs) and
‘individual duty’ on Public Bodies (PBs) – see sub-section 2.3.
• Provisions regarding specific activities and processes by the above core institutional
players (FG Commissioner, PSBs, PBs) in pursuance of the well-being goals and
generally sustainable development.
• Provisions regarding specific activities and processes of other institutional players
relating to QoL, including the Welsh Assembly, Welsh Government, local authorities
(elected local government) and the Auditor General for Wales.

ESPON / QoL – Quality of Life Measurements and Methodology / Draft Final Report 7
2.2 Evolution of the QoL approach
In 2011, the Welsh Government dedicated legal and policy resources to developing new
legislation that would enable public services to tackle health and societal problems and mobilise
civil society to serve and sustain future generations. Just as the United Nations initiated a global
conversation on ‘The World We Want’, the Welsh Government initiated a national conversation
about ‘the Wales We Want’, in 2014 to stimulate discussion across Wales on long term
sustainable development goals for Wales to work towards. This approach enabled citizens to
participate in defining a new sustainable development framework for Wales. The Welsh
conversation involved over 7,000 people through, for example, engagement with individuals
and community groups, the recruitment of ‘future champions’ to act as advocates of
communities and organisations, and the organisation of stakeholder workshops, involving
public service organisations. The outcome of this process influenced the legislation, which, after
scrutiny and review by the Welsh Assembly, became the WFG Act in 2015.
An evolutionary approach continued during the implementation of the WFG Act with a strong
emphasis on collaboration between all relevant institutional players and community
involvement, in putting in place the remaining components. Two key aspects, where the QoL
approach is still evolving, are:
• The development of milestones for Wales, which have been delayed and their eventual
adoption could mark a big shift in measurement and accountability;
• Taking forward the better alignment of all public bodies with the expectations of the WFG
Act.
Recent public consultations on the development of the milestones also provided feedback on
the indicators, showing that there was no call to change the indicator set significantly, but a
number of essential refinements were identified:
• amend the indicators around the quality of work, taking into account the recommendations
of the Fair Work Commission;
• investigate a new National Survey for Wales question on ‘active global citizens’ to replace
the indicator on SDG partnerships (No 46) that cannot currently be measured;
• extend the pay difference indicator to other population groups (e.g. ethnicity and part-
time).
The recent (May 2020) major report of the FG Commissioner, Future Generations Report 2020,
has put forward a series of recommendations to take this evolutionary process further,
addressed to the different QoL actors under each well-being goal and priority area – see also
under accountability and reporting in section 2.3.
2.3 Governance levels and the use of QoL in a policy context
The overall policy context in which the QoL approach is embedded is framed by an all-
encompassing long-term strategy of the Welsh Assembly and Government for the improvement
of public services, covering economic, social, environmental and cultural aspects.
The WFG Act places legal duties on the public sector to set their own well-being objectives that
seek to improve well-being and maximise their contribution towards the seven nationally agreed
well-being goals. It does not apply to the private sector.
The role of the core institutional players is outlined below.

ESPON / QoL – Quality of Life Measurements and Methodology / Draft Final Report 8
Future Generations Commissioner for Wales
The WFG Act created the position of the Future Generations Commissioner for Wales (FG
Commissioner) whose role is to promote the sustainable development principle, to act as a
guardian for the interests of future generations in Wales, and to support the public bodies to
work towards achieving the well-being goals; also, to monitor and assess the extent to which
well-being objectives set by public bodies are being met.
The first FG commissioner, Sophie Howe, was appointed by the Welsh Government in March
2016 for a seven-year term.
The FG Commissioner has a range of actions at her disposal and has used them extensively,
notably:
• Assistance and advice to PBs and PSBs.
• Research including into the well-being goals and the sustainable development principle
and how public bodies apply it.
• Dissemination of good practice.
The FG Commissioner has already pursued such activities extensively, for instance, producing
a series of outputs (‘Art of the Possible’) showcasing good practice and providing public
bodies with a plethora of examples and options as to how they can meet the expectations of
the legislation by providing practical steps that they can take. These resources are referred to
as ‘Journeys’ to the national well-being goals.
Another series is called ‘Frameworks’ and sets out prompts and questions to ensure public
bodies consider all elements of the WFG Act (goals, objectives and ways of working) and help
them carry out sustainable development. These can also be used by other organisations,
community groups and members of the public to ask public bodies to demonstrate their
consideration of the legislation.
The FG Commissioner has also produced a large number of formal and informal reports and
other communications that contain observations and advice on how public bodies can meet
their duties, make better decisions or change their approach in specific policy areas, such as
transport, education and decarbonisation.
The FG Commissioner has used a wide range of other activities and tools including: Live
Labs, a Leadership Academy, newsletters and formal progress and annual reports.
In terms of policy areas covered, the FG Commissioner has generally covered public services.
Certain policy areas have received particular attention4, such as:
• Land use planning and placemaking5
• Transport
• Housing
• Decarbonisation
• Skills for the future
• Adverse childhood experiences
• Health and wellness system
4 Future Generations Report 2020
5 Evaluating Well-being, The Planner, March 2020

ESPON / QoL – Quality of Life Measurements and Methodology / Draft Final Report 9
Certain key aspects of public services, have also been specifically addressed particularly,
procurement and, to a lesser extent, budgets.
The WFG Act has granted additional powers to the FG Commissioner, which have not been
used so far, to:
• Carry out reviews into how public bodies are taking account of the long-term impact of
their decisions; and
• Make recommendations to a public body about the steps it has taken or proposes to
take to meet its well-being objectives. (Public bodies must take all reasonable steps to
follow the recommendations made by the Commissioner).
Instead, the FG Commissioner and the public bodies have settled for a compromise, which
involves the PBs conducting their own self-assessments while the FG Commissioner provides
a ‘personalised feedback’ to each body. The PBs use a ‘self-reflection tool’ provided by the FG
Commissioner in a form that encourages public bodies to think critically about the objectives
they set, the progress they are making and their overall approach to the Act as an organisation.
The tool was distributed to the 44 public bodies in November 2018 and, by July 2019, the FG
Commissioner had received completed submissions from all 44 organisations. The FG
Commissioner’s feedback to each PB has been detailed and critical. In October 2019, the FG
Commissioner published a synthesis of her overall findings, ‘Progress towards the Well-being
of Future Generations Act’, which summarises the main findings across all PBs and the state
of play by type of PB.
Public Services Boards
In line with the provisions of the WFG Act, a PSB has been set up for each of the 22 local
authority areas in Wales. Following voluntary mergers between some neighbouring PSBs, there
are now 19 PSBs in full operation.
The statutory members of each board are:
• the local authority;
• the Local Health Board within which a local authority falls;
• the Welsh fire and rescue authority;
• the Natural Resources Body for Wales.
Other public bodies (see below) and community organisations can be invited to sit on PSBs
and are treated as ‘partners’. The PBSs have limited own personnel and other resources; they
are mostly supported by the respective local authority(ies)6 but operate autonomously in terms
of decision making, communications (e.g. own website), etc.
The WFG Act has imposed a well-being duty on the PBSs, namely, to improve the economic,
social, environmental and cultural well-being of their area by contributing to the achievement of
the well-being goals. Key steps are:
• Assessments of local well-being: A PBS must prepare and publish an assessment of
the state of economic, social, environmental and cultural well-being in its area.
• Local well-being plans: A public services board must prepare and publish a Local Well-
being Plan setting out its local objectives and the steps it proposes to take to meet them.
Work on the assessments started soon after the establishment of the PSBs, and all of the PSBs
published their Assessment of Local Well-being in 2017.
6 They are subject to the ‘Overview and Scrutiny Committee’ of the relevant local authority.

ESPON / QoL – Quality of Life Measurements and Methodology / Draft Final Report 10
Local Well-being Plans for 2018-2023 have been published by all PSBs. The whole process
followed guidance issued by the FG Commissioner, including on the involvement of local
communities which was very extensive and formal advice to each PSB in response to their draft
assessment on the definition of their local objectives and actions. The Local Well-being Plans
set objectives and address policy areas within the range of the well-being goals. The plans are
sent formally to Ministers, FG Commissioner and Auditor General.
Annual progress reports on the implementation of the Well-being Plans started to be
published in 2019 by all the PSBs. There is also provision for the reviewing of local objectives
and updating of the Local Well-being Plans by the PSBs. The PSBs are required to produce a
new plan at the beginning of every new local authority term (within a year of local elections).
Public Bodies
The WFG Act specifies precisely all the public bodies that should adhere to the provisions of
the Act. They include both the Welsh Government (‘Ministers’) and the 22 local authorities
(elected local government level). The remainder are:
• Local Health Boards
• National Health Service Trusts (Public Health Wales NHS Trust and Velindre NHS Trust).
• National Park Authorities
• Fire and Rescue Authorities
• Natural Resources Wales
• The Higher Education Funding Council for Wales
• The Arts Council of Wales
• Sports Council of Wales
• National Library of Wales
• National Museum of Wales
The Act imposes a well-being duty on all public bodies to carry out sustainable development7,
including:
• setting and publishing objectives (“well-being objectives”) that are designed to maximise
its contribution to achieving each of the well-being goals, and
• taking all reasonable steps in exercising its functions to meet those objectives.
The form in which these activities are performed includes the following key steps:
• Well-being Statement: Public bodies publish a statement when setting their well-being
objectives explaining how each objective will help them achieve the well-being goals. In
doing so they must make sure that they involve people interested in achieving the goals
and that those people reflect the diversity of their area.
• Annual Reporting: Each public body publishes an annual report showing the progress it
has made in meeting its objectives. This is the normal corporate annual report of the
organisation and does not follow any common specification as a result of the WFG Act.
The policy focus of each PB’s Well-being Statement is usually its own policy area, e.g. health,
but there are examples of PBs adopting a broader approach, for instance, cultural bodies
having objectives to improve health. Partly due to this specificity, the objectives set by the public
7 Defined as the process of improving the economic, social, environmental and cultural well-being of
Wales by taking action, in accordance with the sustainable development principle, aimed at achieving the well-being goals.

ESPON / QoL – Quality of Life Measurements and Methodology / Draft Final Report 11
bodies by April 2017 amounted collectively to 345 well-being objectives being set up across
Wales!
The overall assessment of the FG Commissioner8 is that so far “no one public body has
‘cracked’ the WFG Act across all of its legal requirements and aspirations” and that “progress
is being made towards meeting well-being objectives in some areas, but there is variation in
how public bodies are applying the Act”. The FG Commissioner has been critical of some PBs,
especially in the health sector, where she has bluntly stated that “Welsh Government processes
and targets are a challenge and barrier” and that “Health bodies should consider setting broader
well-being objectives and ensure that the steps they are taking to meet their objectives are
clear”. On the positive side, the FG Commissioner has found that “National Park Authorities
have embraced the Well-being of Future Generations Act and, with some development in
corporate centres, could become an exemplar sector for the rest of the public bodies covered
by the Act”.
Governance
The governance of QoL in Wales is essentially pursued at two territorial levels:
• At regional level, Wales-wide (NUTS 1 statistical level) through the Welsh Assembly
and Government, PBs with a Wales-wide remit (e.g. NRW) and the FG Commissioner;
and
• At local level (LAU statistical level) through the 22 local authorities and the 19 PSBs.
Some PBs operate at an intermediate level, especially the seven Local Health Boards and other
PBs (e.g. National Park Authorities and Fire and Rescue Authorities) are at local level but not
coterminous with LAU units.
The main roles, responsibilities and linkages are illustrated in the following diagram:
8 FG Commissioner: Progress towards the WFG Act, Overall Findings, October 2019

ESPON / QoL – Quality of Life Measurements and Methodology / Draft Final Report 12
Figure 3 Main QoL institutions and linkages
Source: Author’s elaboration
The main points can be summarised, as follows:
• The Welsh Assembly is responsible for establishing the well-being goals and setting up
the whole scheme, as well as for oversight of its implementation;
• The Welsh Government (‘Ministers’) have a dual role: setting indicators and milestones
and reporting progress against them; and (in reserve) issuing formal guidance to (other)
PBs, as well as acting as a PB themselves (setting specific objectives for achieving the
well-being goals);
• The PSBs conduct local well-being assessments and both PBs and PSBs set specific/local
objectives, and take steps for achieving the objectives and ultimately the well-being goals.
• The FG Commissioner acts as the guardian of the whole scheme, advising and assisting
all the participants, and taking action through formal guidance and reviews.
There is a complex set of linkages between the main actors regarding all stages of the QoL
process, some of which are already established while others are still taking shape. The most
important and clearly defined ones are:
• Between well-being goals (set out in the legislation) and specific/local objectives (set by
PBs and PSBs);
AuditorGeneral
FGCommissioner
PSBs
QoL-specific institution
Advice / assistance
Formal guidance or examination
Measurement / indicators
Major reports / policy input
Welsh Assembly
Welsh Government
OtherPublic Bodies
People, Economy, Environment, Culture
Local Authorities
Public Services Boards

ESPON / QoL – Quality of Life Measurements and Methodology / Draft Final Report 13
• Between specific/local objectives and steps taken by PBs and by PSBs and their partner
organisations towards these objectives and annual reporting of achievements;
• Between the FG Commissioner (and Ministers) and PBs and PSBs in the form of
advice/assistance and formal guidance;
• Between the National Assembly (via Ministers) and external assessment by the FG
Commissioner and the Auditor General, to ensure that public bodies are accountable for
implementing the Act.9
Accountability and Reporting
Public bodies and PSBs are accountable for implementing the WFG Act. The role of the FG
Commissioner and Auditor General for Wales is to ensure that the PBs and PSBs, properly and
adequately, do so.
Much of this is based on self-assessment and self-reporting by public bodies10 and has
attracted criticism of non-adaptation to the spirit and requirements of the WFG Act and over-
reliance on qualitative assessment:
“Performance management and reporting is still following a traditional approach. It is too heavily
focused on what has been done (‘the what’ / outputs), rather than how it was done (‘the how’)
and its impact (‘the so what?’ / outcomes). Some of this is being driven by performance
measures set by Government which should be systematically reviewed to ensure they are
aligned with the WFG Act. … Public bodies should be using more meaningful quantitative data
and increasing their use of qualitative data to demonstrate how they are progressing towards
meeting their objectives”.
However, it is important to note that:
• The national indicators are designed to represent the outcomes “for Wales and its people”
and to help demonstrate progress towards the seven well-being goals. They are not
intended to be performance indicators for an individual organisation11. Indeed, PBs
have long-standing performance indicators of their own (e.g. in the health sector) which,
generally, are not in line with the WFG Act.
• As well as setting ‘national indicators’, the WFG Act also requires Welsh Ministers to set
‘national milestones’ to assist in measuring whether progress is being made at Wales
level towards the achievement of the well-being goals. In 2019, the Government published
a written statement around proposals for developing a set of national milestones.
Following consultation, this led to an initial agreement on milestones for 14 indicators (one
per indicator) and further work is now progressing. However, this exercise is behind
schedule and proving controversial as it involves a tangible way for judging whether
9 In theory these assessments are partly based on measurement (indicators) by StatsWales (see following quotation) but in practice there is no evidence to that effect (e.g. in the case of the FG Commissioner’s Future Generations Report 2020). “Given that the purpose of the Act was to promote collaboration and a joined-up approach to public services to support our progress towards the goals, then it was critical that the National Indicator set provided a collective set of outcomes that we wanted to see in Wales and that were not the responsibility of any single public body.” Jones G. et al (2018) p. 8.
10 The Welsh Ministers report annually the progress they have made towards meeting their well-being
objectives, and a copy of the report is placed before the Welsh Assembly (section 12 of the WFG Act).
11 This has been attributed to ensuring that there was no confusion between the setting up of the
indicators framework and a parallel exercise on the performance system for monitoring local government performance in Wales. (Jones G. et al (2018) p. 8)

ESPON / QoL – Quality of Life Measurements and Methodology / Draft Final Report 14
satisfactory progress is being made, rather than merely checking the ‘direction of travel’
against indicators. This will clearly shift (or add) accountability at Government level.
The Wales-level reporting involves several reports by key institutional players. The most
important of which and their intended audience / destination are outlined below.
The Welsh Government must publish an ‘annual well-being report’ on the progress made
towards the achievement of the wellbeing goals by reference to the national indicators and
milestones. ‘Well-being of Wales: 2017’ was the first such report and was followed by full
updated reports in 2018 and 2019, based on the 46 Wales indicators. Furthermore, the Welsh
Government must, within 12 months of a general election, publish a ‘future trends report” that
contains predictions of likely future trends in the economic, social, environmental and cultural
well-being of Wales, and any related analytical data and information that the Welsh Ministers
consider appropriate. These reports are produced by StatsWales, the Welsh Government’s
statistical service, under the responsibility of the Chief Statistician for Wales “independently of
political influence”.
The FG Commissioner publishes several types of formal reports:
• Annual Report (activity report, financial etc)
• Progress reports under various titles:
o Well-being in Wales: the journey so far, May 2018
o Progress towards the Well-being of Future Generations Act, October 2019 (including
overall findings of review of objectives set by PBs).
• ‘Future Generations Report’ once per parliamentary cycle.
The Future Generations Report is a major statutory report that the FG Commissioner has to
produce once every five years (four years in this first period). It must provide advice on
improvements public bodies should make in order to set and meet well-being objectives which
are the commitments they must make to improve the economy, society, environment and
culture of their area most efficiently under that law. The FG Commissioner must send the report
to the Welsh Government and must lay a copy of it before the Welsh Assembly.
The first such report was published in May 2020 and had not yet been discussed by the time
this case study was completed. The report is very long and detailed (over 800 pages) and
includes information and a critical assessment on the progress to date and recommendations
on what should happen in the future by well-being goal and for each priority area (as already
summarised above), but does not present any measurements based on indicators framework.
The Auditor General for Wales has an additional duty12 under the WFG Act, over and above
his normal audits of public bodies, and in May 2020 he submitted his first formal report to the
National Assembly under the Act, ‘So, what’s different? Findings from the Auditor General’s
Sustainable Development Principle Examinations’. The Auditor General had already published
his commentary in an early preparatory report, ‘Reflecting on Year One: How Have Public
Bodies Responded to the WFG Act’. He has also tested a separate methodology for reporting
on individual PBs (‘Auditor Guidance for undertaking examinations during 2018-19’) and has
conducted and published preliminary individual examinations of all 44 PBs.
To sum up:
12 The Auditor General for Wales is statutorily required to examine public bodies to assess the extent to
which they have acted in accordance with the sustainable development principle when setting their wellbeing objectives; and taking steps to meet them.

ESPON / QoL – Quality of Life Measurements and Methodology / Draft Final Report 15
• the Chief Statistician for Wales (Welsh Government), the FG Commissioner and the
Auditor General for Wales publish annual and ad hoc progress (and other) reports that
contribute to the overall QoL process or specific aspects of it;
• the FG Commissioner and the Auditor General for Wales submit major statutory reports
to the Welsh Assembly once per parliamentary cycle to feed political debate about the
overall direction of QoL in Wales
Linkages and collaboration
The relevant linkages were put in place soon after the WFG Act came into force. The necessary
advice and assistance to PBs/PSBs started being issued by the FG Commissioner as early as
2016. The national indicators were adopted in March 2016 and the first Well-being of Wales
report for 2016-2017 was published in September 2017. Some of the linkages are still evolving,
notably between the PBs and the FG Commissioner, which in the 2018/19 period centred on
self-assessments by the former and feedback by the latter.
Collaboration between the levels is reasonably well established. In the case of PBs and PSBs
this is explicitly defined in the Act. Overall, the whole QoL scheme has been welcomed and is
actively being implemented by all types of actors. The main actors that have not yet fully
responded are some PBs, mainly in the health sector as indicated earlier on. Established
institutional players, like the Auditor General have been making a special effort to adapt their
methods of working to fit the spirit of the WFG Act.
Nevertheless, there are also some overlaps in responsibilities or at least not sufficient clarity.
This is amply illustrated in reporting/assessing progress where the FG Commissioner and two
well established players (The Chief Statistician for Wales and the Auditor General for Wales)
have already issued several substantial reports since the WFG Act came into effect. This
overlap has been acknowledged by the FG Commissioner and the Auditor General, who
established a formal Memorandum of Understanding in November 2017.
2.4 Success factors and obstacles
QoL in Wales is well developed, all-encompassing, has progressed fast from inception to
launch to the implementation phase, and is already more-or-less fully implemented.
Its main strengths and success factors can be summarised on the following lines.
First, the legal basis (dedicated and detailed legislation, the WFG Act) and the
comprehensive nature of the adopted approach have laid strong foundations and represent
the main source for success.
Second, there are strong drivers of the whole process, namely the QoL-specific institutional
arrangements; especially, the active role of the FG Commissioner who acts with a high degree
of independence and is backed up with by highly motivated staff. Most of the 19 PSBs have
also become important drivers of the process both through the engagement of local
communities and through their cross-cutting activities across all public services.
Third, a high degree of acceptance and multi-actor commitment, flowing from factors such
as:
• Long-term political commitment and consensus in Wales regarding sustainable
development and QoL aspirations;
• Engagement of established institutional players, such as the Chief Statistician for Wales
and the Auditor General for Wales from the very start of the QoL process and similarly of
some of the public bodies, e.g. Natural Resources Wales and the National Park
Authorities;

ESPON / QoL – Quality of Life Measurements and Methodology / Draft Final Report 16
• Openness to other sectors through the principle of ‘involvement’ which is embedded in the
Act, especially taken up by voluntary organisations and groups.
Fourth, a good balance between, on the one hand, the fast and decisive translation of the
QoL concept into action and the setting up and running of an extensive monitoring system and,
on the other hand, a degree of gradualism and mutual learning process, facilitated by the FG
Commissioner.
There are still some weaknesses and bottlenecks. The most relevant to this section of the
case study, relating to the QoL concept and the way it has been implemented thus far, can be
distilled, as follows:
• While the links of the Wales indicators to well-being goals (and the SDGs) are clear and
explicit, there are very weak or altogether missing links between the Wales indicators
and the well-being objectives set by the PSBs and PBs.
• The plethora of well-being objectives set by the PBs makes certain aspects of the whole
process, including support and assessment, difficult or even unmanageable. Similarly, the
articulation between local objectives set by the PSBs and the PB-specific objectives is an
issue.13
• Not requiring the use of the Wales indicators for performance measurement by public
bodies has left a gap. Delays in agreeing and introducing milestones (as a Wales-wide
rather than organisation-specific measurement) a key manifestation of this shortcoming
and remains a bottleneck in the full realisation of the concept.
There have also been two major obstacles, beyond the concept of the QoL scheme itself14:
• Under-resourcing: The Welsh Government has not sufficiently resourced the
implementation of the WFG Act in terms of leadership development, support for
transformational change and delivering the infrastructure required by the Act; both within
their own organisation and the organisations they sponsor.
• Slow PB adaptation: there is variation in how public bodies are applying the Act and
evidence that some of them have been making insufficient efforts so far largely due to a
combination of competing priorities in a climate of funding constraints (‘austerity’) and
traditional corporate attitudes. In the case of local authorities, a large part of this appears
to be due to capacity and expertise.
2.5 Achievements and further plans
The QoL scheme has been applied to many policy areas across public services in Wales. A
major effort has been going into adapting policy making and administrative processes but
still a lot remains to be done, as evidenced by the criticism levelled by the FG Commissioner in
her recent Future Generations Report 2020 and the very long lists of recommendations
addressed to government Ministers and public bodies included in that report.
The Office of the FG Commissioner, most of the PSBs and several public bodies, e.g. Natural
Resources Wales, are institutions that appear to be fully aligned with the QoL concept.
Overall, the biggest change has been in observation, monitoring and assessment, with a
13 “I cannot see clearly how the connection to other public bodies who are critical to meeting the well-
being objectives set by Local Authorities are being adequately made”. The FG Commissioner’s comment in Progress towards the WFG Act, Overall Findings, October 2019
14 Finding 2 of Progress towards the WFG Act, Overall Findings, October 2019

ESPON / QoL – Quality of Life Measurements and Methodology / Draft Final Report 17
whole host of reports and data published annually by the FG Commissioner, the Chief
Statistician for Wales and the Auditor General for wales.
The intentions for the future are difficult to establish firmly in the current juncture. On the one
hand, there is clearly an intention to deal with specific gaps of the scheme (e.g. setting
milestones) and more fundamental weaknesses (traditional attitudes and mindsets in public
bodies) which have been highlighted repeatedly by the FG Commissioner. However, one other
hand, some of the prevailing obstacles (under-resourcing and austerity) are unlikely to go away
in the short-to-medium term, and may present even greater constraints due to the COVID-19
crisis. On the other hand, some of the prevailing obstacles (under-resourcing and austerity)
could be more difficult to address in the aftermath of the COVID-19 crisis. However, both the
short-term and the longer-term implications of the COVID-19 crisis on QoL in Wales are still too
soon to assess. Although lockdown began to ease in June, as many of the emergency
restrictions were are still in force in Wales in mid-July 202015 and additional measures were
reimposed in most areas of Wales by mid-September 16.
Nevertheless, the debate about the future direction of the post-COVID-19 recovery has already
started. In a recent statement, the FG Commissioner said: “The pandemic has brought
incredible challenges, but how we recover gives us a once-in-a-generation opportunity”. She
called for “visionary ideas and transformative investment” in the recovery plan which “needs to
address health, the economy and the ongoing climate and nature crises for the sake of Wales’
long-term future. We need a new definition of prosperity, based on well-being, and a fairer,
greener way of living.”
The Commissioner called for a focus on quality of life over GDP, as the country begins the
rebuilding process while restrictions remain in place to stem the spread of COVID-19. Among
her recommendations is a multi-million pound stimulus package to support the decarbonisation
of Wales’ housing stock – putting money into new low-carbon affordable housing and launching
a national retrofitting programme to improve energy efficiency in existing homes – arguing that
the benefits to people’s health, the environment, the jobs created and Wales’ housing stock,
would outweigh the estimated costs.
The Commissioner17 also favoured investment to improve digital connectivity, as thousands
remain working from home, taking pressure off transport networks and reducing carbon
emissions; supported the Welsh Government’s commitment to fund transport improvements for
pedestrians and cyclists; and argued that resources should also be shifted so Wales’ natural
habitats can be restored, with green corridors linking the country and more investment in the
new national forest being planted.
15 Restrictions in place include: certain businesses are not allowed to open; people should not gather indoors with anyone who is not a member of their household; social and physical distancing rules apply about keeping people apart when they go out; people must not gather in public places other than with members of one other household or extended household. (https://gov.wales/coronavirus-regulations-guidance accessed on 15.07.2020)
16 https://gov.wales/local-lockdown (accessed on 06.10.2020)
17 The Commissioner has continued contributing to the debate in Wales on the post-COVID-19 recovery,
e.g. https://www.futuregenerations.wales/news/support-a-shorter-working-week-to-save-jobs-says-future-generations-commissioner-and-wales-tuc/ and https://www.futuregenerations.wales/news/future-generations-commissioner-calls-for-a-universal-basic-income-pilot-for-creatives/ (accessed on 06.10.2020)

ESPON / QoL – Quality of Life Measurements and Methodology / Draft Final Report 18
3 Measuring Quality of Life
3.1 Indicators and measurement
The WFG Act put in place a requirement on the Welsh Government “to establish national
indicators and milestones to help assess progress towards achieving the seven well-being
goals, and report on them annually.” Work on developing the required set indicators
commenced shortly after the Act came into force building on the preparatory work described
earlier (‘The Wales We Want’), culminating in a national consultation was launched in October
2015 on ‘How do you measure a nation’s progress?’. This sought views on a set of 40 national
well-being indicators for Wales and included a full technical description of how each of the
indicators is to be measured.
This exercise attracted a good range of response – half of them from voluntary organisations,
professional bodies and interest groups – and resulted in the framework of the 46 indicators
currently in use.18 The indicators were formally laid in front of the Welsh Assembly in a written
statement in March 2016. The full set of 46 Wales indicators is presented in Table 3, below,
including their main characteristics.
Some 33% of the indicators are considered to be subjective or with subjective elements. In
terms of territorial scale, some of the indicators are available only at Wales (NUTS 1) level but
a large majority, nearly 85% of the total, are also available disaggregated, typically, at local
authority (LAU) level. The periodicity of the data tends to be annual or quarterly (for nearly
two-thirds of the indicators), as against multi-annual or ad hoc. With very few exceptions each
indicator is of relevance to two or more sectors (see Table 3, below).
18 IAOS p 11

ESPON / QoL – Quality of Life Measurements and Methodology / Draft Final Report 19
Table 3 Wales indicators and their characteristics
Collection
base
Collection
focus
1Percentage of live single births with a birth weight of
under 2,500g.
National Community
Child Health Database Annual L H S OBJ PR
2Healthy life expectancy at birth including the gap
between the least and most deprived.
ONS and Public Health
Wales Ad hoc L H S OBJ PR
3Percentage of adults who have fewer than two healthy
lifestyle behaviours.
National Survey for
Wales Annual L H S C sub PR
4 Levels of nitrogen dioxide (NO2) pollution in the air.
Air Quality Data,
DEFRA* Annual L E H OBJ pr
5Percentage of children who have fewer than two
healthy lifestyle behaviours.
Health Behaviours in
School Aged Children
Survey
Every 4
yearsW H S sub PR
6 Measurement of development of young children.
Foundation Phase
Profile - on-entry
assessmentsAnnual L EC S C OBJ PR
7Percentage of pupils who have achieved the "Level 2
threshold" including English or Welsh first language
and Mathematics.
Welsh Examinations
Database Annual L EC S C OBJ PR
8Percentage of adults with qualifications at the
different levels of the National Qualifications
Framework.
Annual Population
Survey Annual L EC S OBJ PR
9Gross Value Added (GVA) per hour worked (relative to
UK average)
ONS regional Economic
Analysis: Sub regional
productivity indicators
Annual L EC OBJ PR
10 Gross Disposable Household Income per head.
ONS Gross Disposable
Household Income per
HeadAnnual L EC H S OBJ PR
11 Percentage of businesses which are innovation-active.
UK Innovation Survey
(BIS) Annual L EC EN OBJ pr
12Capacity (in MW) of renewable energy equipment
installed.
Energy Generation in
Wales, Welsh
GovernmentNot Known L EC EN S OBJ pr
13 Concentration of carbon and organic matter in soil.
Countryside Survey,
Glastir Monitoring and
Evaluation Programme
(GMEP)
Every 5
yearsW EC EN OBJ pr
14 The Ecological Footprint of Wales.
Stockholm Environment
Institute Not Known L EC EN OBJ pr
15Amount of waste generated that is not recycled, per
person.
Waste Data Flow
Industrial & Com'l
waste SurveyQuarterly L EC EN S OBJ pr
16Percentage of people in employment who are on
permanent contracts and who earn more than 2/3 of
the UK median wage.
Labour Force Survey,
ONS*
New analysisQuarterly W EC H S OBJ PR
17 Gender pay difference.
Annual Survey of Hours
and Earnings Annual L EC S OBJ PR
18Percentage of people living in households in income
poverty relative to the UK median, measured for
children, working age and those of pension age.
Households below
average income
dataset, DWP*Annual L EC H S C OBJ PR
19Percentage of people living in households in material
deprivation.
National Survey for
Wales Annual L EC H S C OBJ PR
20Percentage of people moderately or very satisfied with
their jobs.
National Survey for
WalesEvery 2
yearsL EC H S SUB PR-I
21 Percentage of people in employment.
Annual Population
Survey Quarterly L EC H S sub PR
22Percentage of people in education, employment or
training, measured for different age groups.
Welsh Government
measures of
participation in EETAnnual W EC H S OBJ PR
23Percentage who feel able to influence decisions
affecting their local area.
National Survey for
WalesEvery 2-3
yearsL S SUB PR-I
Type
No Indicator Source of data Frequency SectorTerritorial
level

ESPON / QoL – Quality of Life Measurements and Methodology / Draft Final Report 20
24Percentage of people satisfied with their ability to get
to/ access the facilities and services they need.
National Survey for
WalesEvery 2
yearsL H S SUB PR-I
25Percentage of people feeling safe at home, walking in
the local area, and when travelling.
National Survey for
WalesEvery 2-3
yearsL H S SUB PR-I
26Percentage of people satisfied with local area as a
place to live.
National Survey for
WalesEvery 2
years L EN H S C SUB PR-I
27Percentage of people agreeing that: they belong to the
area; people from different background get on well
together; and people treat each other with respect.
National Survey for
WalesEvery 2-3
yearsL H S C SUB PR-I
28 Percentage of people who Volunteer.
National Survey for
Wales Annual L S C sub PR-I
29 Mean mental well-being score for people.
National Survey for
Wales
Understanding Society
Every 2
years L H S sub PR-I
30 Percentage of people who are lonely.
National Survey for
WalesEvery 2-3
yearsL H S SUB PR-I
31 Percentage of dwellings which are free from hazards.
Welsh Housing
Conditions Survey 2017-
18
Not known L EN H S OBJ pr
32Number of properties at medium or high risk of
flooding from rivers and the sea.
Natural Resource
Wales, Flood risk mapsEvery 2-3
yearsL EN H S OBJ pr
33Percentage of dwellings with adequate energy
performance.
Welsh Housing
Conditions Survey 2017-
18
Not known ? EC EN H OBJ pr
34Number of households successfully prevented from
becoming homeless per 10,000 households.
Statutory Homeless
Data collection from
local authorities
Quarterly L EC H S OBJ PR
35Percentage of people attending or participating in arts,
culture or heritage activities at least 3 times a year.
National Survey for
Wales Annual L H S C sub PR-I
36Percentage of people who speak Welsh daily and can
speak more than just a few words of Welsh.
National Survey for
Wales and Welsh
Language Use Surveys
Annual L S C sub PR-I
37 Percentage of people who can speak Welsh.
Census of Population
Annual L S C sub PR-I
38Percentage of people participating in sporting
activities three or more times a week.
Adult: National Survey
for Wales
Children: Sport Wales
School Sport Survey
Annual L H S C sub PR-I
39Percentage of museums and archives holding
archival/heritage collections meeting UK accreditation
standards.
Museums Archives and
Library Division, Welsh
Government
Not Known L C OBJ pr
40Percentage of designated historic environment assets
that in stable or improved conditions.
CADW*
Not Known L EN C OBJ pr
41 Emissions of greenhouse gases within Wales.
National Atmospheric
Emissions Inventory
(by source)
Annual W EC EN H OBJ pr
42Emissions of greenhouse gases attributed to the
consumption of global goods and services in Wales.
Stockholm Environment
Institute Not Known W EC EN H obj pr
43 Area of healthy ecosystems in Wales.
Briefing Note, NRW*
Not Known L EC EN H S C obj pr
44 Status of biological diversity in Wales.
Currently under
development W EC EN S C OBJ pr
45Percentage of surface water bodies and groundwater
bodies achieving good or high overall status.
Natural Resource
Wales/ Water Watch
Wales
Annual W EN H S C OBJ pr
46The social return on investment (SROI) of Welsh
partnerships within Wales and outside of the UK that
are working towards the UN SDG.
Welsh Government
information Not Known W EC EN H S C obj pr
Territorial level: W, Wales (NUTS1); L, Local (mostly LAU)
Sector: EC, Economic; EN, Environment; H, Health; S, Social; C, Cultural
Collection base: OBJ, objective; obj, objective unconfirmed; SUB, subjective; sub, with subjective elements
Collection focus: PR-I people-related measured at individual level; PR, people-related; pr, place-related
* Acronym denoting (UK or Welsh) government ministries or agencies
Source: 5 left hand columns based on https://gov.wales/well-being-wales-national-indicator-technical-descriptions-and-data-links;
3 right-hand columns based on own analysis
ESPON / QoL – Quality of Life Measurements and Methodology / Draft Final Report 21
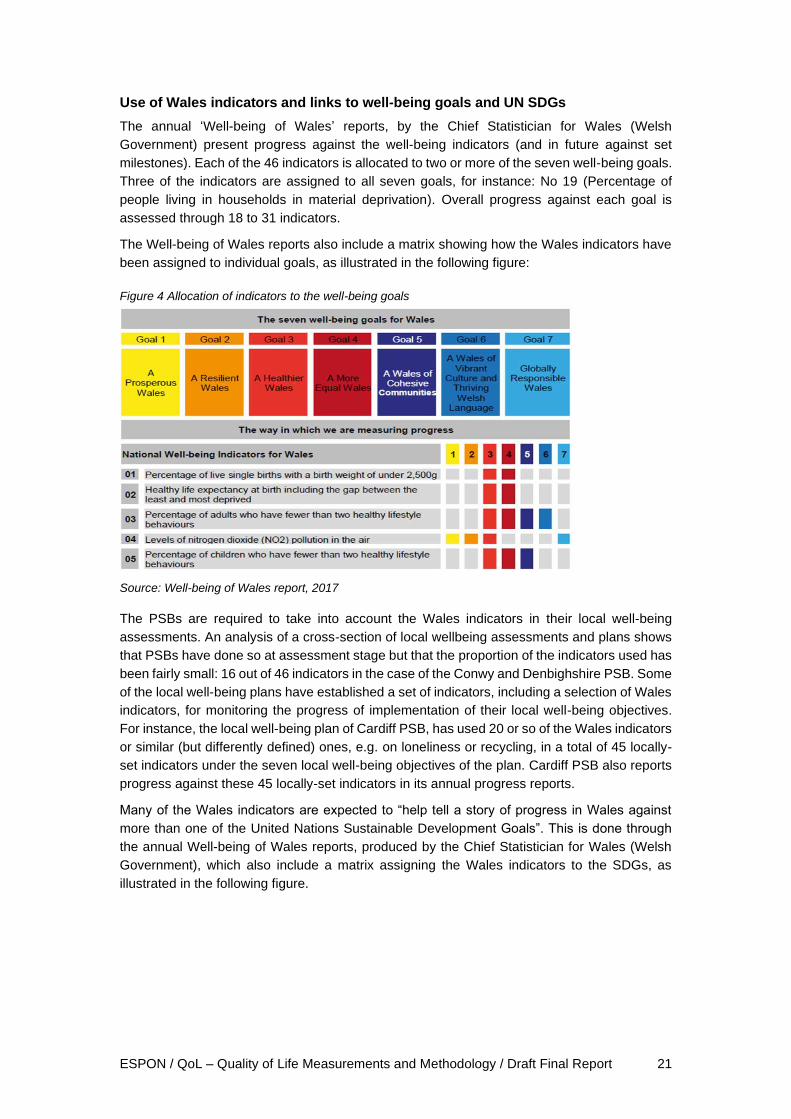
Use of Wales indicators and links to well-being goals and UN SDGs
The annual ‘Well-being of Wales’ reports, by the Chief Statistician for Wales (Welsh
Government) present progress against the well-being indicators (and in future against set
milestones). Each of the 46 indicators is allocated to two or more of the seven well-being goals.
Three of the indicators are assigned to all seven goals, for instance: No 19 (Percentage of
people living in households in material deprivation). Overall progress against each goal is
assessed through 18 to 31 indicators.
The Well-being of Wales reports also include a matrix showing how the Wales indicators have
been assigned to individual goals, as illustrated in the following figure:
Figure 4 Allocation of indicators to the well-being goals
Source: Well-being of Wales report, 2017
The PSBs are required to take into account the Wales indicators in their local well-being
assessments. An analysis of a cross-section of local wellbeing assessments and plans shows
that PSBs have done so at assessment stage but that the proportion of the indicators used has
been fairly small: 16 out of 46 indicators in the case of the Conwy and Denbighshire PSB. Some
of the local well-being plans have established a set of indicators, including a selection of Wales
indicators, for monitoring the progress of implementation of their local well-being objectives.
For instance, the local well-being plan of Cardiff PSB, has used 20 or so of the Wales indicators
or similar (but differently defined) ones, e.g. on loneliness or recycling, in a total of 45 locally-
set indicators under the seven local well-being objectives of the plan. Cardiff PSB also reports
progress against these 45 locally-set indicators in its annual progress reports.
Many of the Wales indicators are expected to “help tell a story of progress in Wales against
more than one of the United Nations Sustainable Development Goals”. This is done through
the annual Well-being of Wales reports, produced by the Chief Statistician for Wales (Welsh
Government), which also include a matrix assigning the Wales indicators to the SDGs, as
illustrated in the following figure.

ESPON / QoL – Quality of Life Measurements and Methodology / Draft Final Report 22
Figure 5 Allocation of indicators to the SDGs
Source: Well-being of Wales report, 2017
3.2 Data sources for QoL
The sources of data used for each of the indicators are listed in Table 3, above. Most of the
indicators (32) are based on sources that have been published as Official Statistics. Twelve
indicators are based on other sources, such as administrative data held by government
departments, and two indicators currently have no data. Practically all of them are available
online19, together with links data sources and technical information.
Several indicators rely on regular surveys, mainly the National Survey for Wales, which covers
the bulk of the subjective indicators; for instance, No. 23 (Percentage of people who feel able
to influence decisions affecting their local area), No 28 (Percentage of people who volunteer)
and No 30 (Percentage of people who are lonely).
Indeed, the National Survey for Wales, is a valuable source of pertinent data:
“If we were to truly consider an outcome-based approach to measuring well-being we felt it was
critical to develop new data sources to capture individual perceptions of personal well-being.
The National Survey for Wales, an annual household survey of over 11,000 people, was already
in place to provide an understanding of a range of topics including the performance of public
services and personal well-being. The Survey therefore provided an ideal mechanism to
develop new questions to support the more subjective indicators. As a result, the Survey is the
source for 14 of the Indicators, ranging from questions around satisfaction with the local area,
involvement in decision making, to the aforementioned topic of whether people feel safe”.20
The following table illustrates the use of different types of data:
Table 4 Overview of data used for measuring QoL in Wales
Description of selected indicators
Data used Geographical unit
Time series from-to, periodicity
Data source
No 04:
Levels of nitrogen
dioxide (NO2)
pollution in the air
Average level of NO2
(pollutant in ambient
air)
1. Wales
2. Local
Authority &
Annually
since 2007
Calculations
based on 3
different
sources
19 https://gov.wales/well-being-wales-national-indicators
20 Jones G. et al (2018) p. 9

ESPON / QoL – Quality of Life Measurements and Methodology / Draft Final Report 23
Description of selected indicators
Data used Geographical unit
Time series from-to, periodicity
Data source
Local Health
Board
No 06:
Measurement of
development of
young children
Assessment records
of school children in
different areas of
learning
Wales Annually
since 2018
On-entry
school
assessment,
Welsh Govt
No 15:
Amount of waste
generated that is
not recycled, per
person Indicator
Amount of residual
waste
1. Wales
2. Local
Authority
Annually
since 2012
Waste data
flow system
& surveys
No 30:
Percentage of
people who are
lonely
De Jong Gierveld
loneliness scale
Wales Annually
since 2016
Survey
Source: Author’s elaboration

ESPON / QoL – Quality of Life Measurements and Methodology / Draft Final Report 24
4 Analysing and testing the methodology used in the case study as compared to the TQoL approach
4.1 Comparing the QoL approach in the case study with the TQoL framework
The Territorial QoL Framework developed in the main report, comprises three QoL spheres,
two pillars, three dimensions, nine QoL domains and 22 sub-domains. This framework provides
the basis for mapping out the approach followed in Wales, as illustrated in Figure 6, below. The
46 indicators used in Wales cover all spheres, dimensions and pillars, and all but one of the
domains. Thus, at first glance, the conceptual TQoL map appears fully covered. When looking
into more detail, especially at sub-domain level, we note that the QoL Enabler Pillar is much
less well covered. This is due to the fact that the indicators reflect very much outcome levels,
but to a much lesser extent enabling factors, like accessibility, affordability and availability.
Figure 6 Territorial Quality of Life framework
Source: Author’s elaboration based on the framework presented in the main report
4.2 Coding the indicators
For coding the indicators against the TQoL framework, we tried to assign all 46 Wales indicators
to the domains and sub-domains of the framework. This is shown in Table 5 below. Each
indicator has been allocated to the domain/sub-domain that offered the best fit on the basis of
the descriptive information available. From this exercise the following observations have been
made:
First, the majority correspond to the Life Maintenance dimension in the Outcomes Pillar and all
three domains of this dimension are very well covered. All three domains of the Life Flourishing
dimension in the same Pillar are also covered.
Second, the Good Life Enablers dimension (Enablers Pillar) is only partially covered. Currently,
there are no Wales indicators that correspond to the Ecological enablers domain. In the
Personal enablers domain, the sub-domains Health-care and Education are not covered, and
the same applies to four sub-domains in the Socio-economic enablers domain including Digital
connectivity. These gaps are noteworthy, especially as the quality of public health services (“the
Pe
rso
nal
e
nab
lers
Soci
o-e
con
om
icen
able
rs
Good Life Enablers
:Enablers of good
Shelter, Education,
Health
Eco
logi
cale
nab
lers
Transport
Health-care
Education
Housing &
basic utilities
Consumption
Public spaces
Work
Cultural assets
Digital connectivity
Green infrastructure
Protected areas
Life Flourishing
Self-actualisationPers
on
al
Flo
uri
shin
g Self-esteem
Interpersonal Trust
(social belonging)
Institutional Trust
(good governance)Co
mm
un
ity
Flo
uri
shin
g
Life Maintenance
Personal Health
indicators
Pers
on
al H
ealt
h
& S
afet
yEc
on
om
ic&
So
ciet
alH
ealt
hEc
olo
gica
lHea
lth
Personal Safety
indicators:
Inclusive Economy
indicators
Climate Change
indicators
Healthy Society
indicators
Healthy Environment
indicators
Eco
logi
cal
Flo
uri
shin
g
PERSONAL SPHERE
SOCIO-ECONOMIC SPHERE
ECOLOGICAL SPHERE
:Enablers of good
Mobility, Connectivity,
Work and Consumption
choices, Social and
Cultural life
:Enablers of good
life in green
environments
Ecosystems
services and
biodiversity
wealth
QoL ENABLERS PILLAR QoL OUTCOMES PILLAR

ESPON / QoL – Quality of Life Measurements and Methodology / Draft Final Report 25
NHS”) in Wales has been a major area of concern and public debate and, similarly, ICT
connectivity (especially broadband in rural areas, such as a large part of the territory of Wales)
is a high-profile issue in Wales as well as in the rest of the UK and many other countries.
These omissions highlight that the ‘quality of place’ aspect of QoL has been accorded a lesser
importance in the framework of QoL in Wales. Life Maintenance predominates and the Life
Flourishing aspect of QoL is also fully represented. As such, the TQoL approach is mostly
people-oriented rather than place-oriented.
When looking at a finer granulation of which indicators are used at sub-domains level, there
are some more observations:
• In some sub-domains a large number of indicators is used where we can assume that the
indicators are highly correlated (e.g. housing with electricity and hazards, healthy society
with several indicators on poverty).
• There are a few cases where we do not have a one-to-one correspondence, but we can
choose a close approximation, which still leaves a scattered picture (e.g. housing, healthy
environment).
It is also worth noting that two types of Wales indicators cover domains which are lacking in the
TQoL scheme illustrated in Figure 6 and have not been assigned in the mapping exercise:
• Two indicators concerning the ‘economy’: Gross Value Added (GVA) and innovative
businesses;
• One cross-cutting indicator reflecting a supra-regional/local dimension: No 46 (The social
return on investment of Welsh partnerships within Wales and outside of the UK that are
working towards the UN SDGs). As already mentioned, this indicator is due to be replaced.
It should be stressed, regarding the ‘economy’ indicators, that the FG Commissioner has
emphasised that “One of the unique features of the Well-being of Future Generations Act is our
definition of prosperity. It does not measure well-being in traditional ways such as how much
money we earn, how much we contribute towards the economy or the value of our goods and
services. It makes no reference to our Gross Domestic Product (GDP) or Gross Value Added
(GVA)”21. This may not be wholly shared across all players involved in QoL in Wales, as GVA
is actually used as an indicator, albeit in comparative formulation vis-à-vis the UK average.
The following table shows the allocation of the Welsh indicators, which were presented in
section 3 (Table 3), to the TQoL measurement system.
21 Future Generations Report 2020, p 166

ESPON / QoL – Quality of Life Measurements and Methodology / Draft Final Report 26
Table 5 Coding system of the Wales indicators
Dimension Domain Sub-domain no Indicator
Good Life Personal Housing & basic utilities (b11) 12a Electrical Generation
Enablers enablers 12b Heat Generation
26 % of people satisfied with local area as a place to live.
31 % of dwellings which are free from hazards.
32a Number of properties (homes and businesses) at medium or high risk of flooding - river
32b Number of properties ... - surface
32c Number of properties...tidal
33 % of dwellings with adequate energy performance.
Healthcare (b12) NA
Education (b13) NA
Socio- Transport (b21) NA
economic Digital connectivity (b22) NA
enablers Work opportunities (b23) NA
Consumption opportunities (b24) 24 % of people satisfied with ability to access the facilities and services they need.
Public spaces (b25) NA
Cultural assets (b26) 39 % of museums and archives holding archival/heritage collections
40 #
Ecological Green infrastructure (b31) NA
enablers Protected areas (b32) NA
Life Personal
Health and
Personal Health (m11) 1 % of live single births with a birth weight of under 2,500g
Maintenance 2a Healthy life expectancy at birth (male)
2b Healthy life expectancy at birth(female)
3 % of adults who have fewer than two healthy lifestyle behaviours (% of all adults +16)
5 % of children who have fewer than two healthy lifestyle behaviours
6 Measurement of development of young children
38 % of people participating in sporting activities >2 times a week (% of all adults +16)
29 Mean mental well-being score for people
Personal Safety (m12) 25 % of people feeling safe at home, in the local area, and when travelling (% of all adults +16)
Economic and
Societal
Inclusive Economy (m21) 7 Examination achievements (capped 9 score)
Health 8 % of adults with qualification to National Qualifications Framework level 4 or above
10 Gross Disposable Household Income per head
16
% of people in employment with permanent contracts and earn more than 2/3 of the UK
median wage.
17
Gender pay difference (female earnings compared to male earnings; median; hourly rate;
gross payment; full-time workers)
Healthy Society (m22) 21 % of people in employment (% of all adults in working age)
22 % of people in education, employment or training, measured for different age groups.
18 % of people living in households in income poverty relative to the UK median
19 % of people living in households in material deprivation (% of all adults +16)
34 Number of households successfully prevented from becoming homeless
Ecological
Health
Healthy Environment (m31) 14 The Ecological Footprint of Wales
Health 15 Amount of waste generated that is not recycled, per person (annual)
45 % of surface water bodies and groundwater bodies achieving good or high overall status.
13 Concentration of carbon and organic matter in soil
Climate Change (m32) 4 Levels of nitrogen dioxide (NO2) pollution in the air
41 Emissions of greenhouse gases within Wales.
42 Emissions of greenhouse gases (related to consumption of global goods and services)
Life Flourishing Personal
Flourishing
Self-esteem (f11)
27
% of people agreeing that they belong to the area; that people from different background get
on well together; and that people treat each other with respect (% of all adults +16)
Self-actualization (f12) 20 % of people moderately or very satisfied with their jobs (% of all adults +16)
35
% of people attending or participating in arts, culture or heritage activities at least 3 times a
year (% of all adults +16)
Community
Flourishing
Interpersonal Trust (societal
belonging) (f21) 36
% of people who speak Welsh daily and can speak more than just a few words of Welsh (% of
all adults +16)
37 % of people who can speak Welsh (% of all adults +16)
30 % of people who are lonely (% of all adults +16)
Institutional Trust (good
governance) (f22)28 % of people who Volunteer (% of all adults +16)
23 % who feel able to influence decisions affecting their local area (% of all adults +16)
Ecological Ecosystems services and
Biodiversity wealth (f31)43 Area of healthy ecosystems in Wales.
Flourishing 44 Status of biological diversity in Wales.

ESPON / QoL – Quality of Life Measurements and Methodology / Draft Final Report 27
4.3 Other relevant features of the approach
4.3.1 QoL in a territorial context
The territoriality of the QoL approach followed in Wales resides primarily in the local Public
Services Boards and their activities associated with the Assessments of Local Well-being and
the Local Well-being Plans for which they are responsible (see section 3). The analysis of a
sample of these documents shows that they address, in their local objectives and indicators,
both the ‘quality of place’ dimension and the ‘territorial QoL’, as defined in the main report.
For instance, the Cardiff PSB includes in its objectives ‘Cardiff is a great place to grow up’ and
also ‘Safe, Confident and Empowered Communities’. Similarly, among the indicators defined
in the plan22 there are indicators relating to all three dimensions of the TQoL scheme as defined
in the main report and summarised above.
The territoriality of the Local Well-being Plans is underpinned by the fact that the objectives of
Public Bodies (PBs) are integrated into those of the PSB in which the PB is a member. It is also
complemented by some related exercises undertaken by certain PBs outside the scope of the
PSBs, notably by those of Natural Resources Wales which produces ‘area statements’ with a
natural environment focus. By contrast, the mapping of the indicators above reveals that the
‘quality of place’ dimension is less pronounced in the Wales indicators.
4.3.2 Objective and subjective indicators
The overall approach regarding QoL in Wales can be discerned from the characteristics of the
scheme put in place through the development, adoption and implementation so far of the WFG
Act. The approach followed in Wales has been to encompass and balance both the objective
and subjective dimensions of well-being. This was clear in the development of the indicators’
framework, which sought a balanced approach:
“There was significant interest in the development of the indicators around the balance of
subjective and objective measures. Some of the concepts that support individual well-being
simply cannot be measured by objective administrative data or survey responses. If we really
want to understand whether people consider themselves to be ‘safe’ or living in ‘cohesive
communities’ then it is important to understand people’s perceptions and subjective opinions.
We also wanted to ensure we were not reliant on measurement issues related to administrative
data that meant they would not truly capture outcomes”.23
The outcome of the process of defining the indicators confirms that a fairly balanced approach
has been established between ‘objective’ and ‘subjective’ indicators, with one-third of the
indicators considered to be subjective or with subjective elements. Examples of objective
indicators include:
• Levels of nitrogen dioxide (NO2) pollution in the air (No 4);
• Percentage of adults with qualifications at the different levels of the National Qualifications
Framework (No 8);
• Gross Disposable Household Income per head (No 10).
Examples of subjective indicators are:
• Percentage of people moderately or very satisfied with their jobs (No 20);
• Percentage who feel able to influence decisions affecting their local area (No 23);
22 A mixture of selected Wales indicators and other locally defined ones
23 Jones G. et al (2018) p. 9

ESPON / QoL – Quality of Life Measurements and Methodology / Draft Final Report 28
• Percentage of people feeling safe at home, walking in the local area, and when travelling
(No 25).
Use of ‘subjective’ indicators is also made at local level, in Local Well-being Plans, as in the
case of the Plan of Cardiff PSB which is using the Life satisfaction, Anxiety, Happiness,
Worthwhile, and Job satisfaction indicators.
4.3.3 Involvement of citizens – Citizen-centric approach to Quality of Life
There are several elements of a citizen-centric approach to QoL but it is difficult to characterise
the overall approach in Wales as purely ‘citizen-centric’. It lacks data collection by citizens and
the use of big data, and there is no formal co-designing of the assessment of QoL based on an
explicit mapping and planning scheme, as outlined in the main report.
However, the approach as implemented, at both regional and local levels, has greatly
emphasised the ‘involvement’ of people, as one of the five ways of working towards achieving
the well-being goals of the WFG Act. Indeed, at local level the PSBs have conducted various
forms of consultations (‘conversation with our communities’, ‘public engagement boards’24, etc)
during all stages of the assessment, planning and monitoring process.
At regional level, widespread public consultation before the Act and subsequently at different
stages could also be interpreted as an aspiration towards or, even, a partial fulfilment of a
citizen-centric approach. As already mentioned above, under the principle of ‘involvement’
envisaged by the Act, an extensive consultation was conducted on ‘How do you measure a
nation’s progress?’ seeking views and contributions on a draft set of 40 national well-being
indicators for Wales and resulting in the framework of the 46 indicators currently in use25 (listed
in Table 3).
QoL measurement in Wales relies to a considerable extent on people-related indicators, which
represent almost two-thirds of the total in the indicators’ framework. An analysis of the
indicators’ framework reveals that almost two-thirds of all Wales indicators (29 out of 46 or 63%)
are people-related – see Table 3.
Regarding gaps towards a citizen-centric approach and scope for ameliorating them, this
analysis points to the following:
First, there are no gaps in the case of 13 out of the 29 people-related indicators, which have
been identified as ‘subjective’ indicators in Table 3 and the collection of data is at the individual
level, i.e. it involves the individuals’ own assessment or reporting.
Second, there are gaps in the case of the remaining 16 indicators that have been identified as
people-related but do not involve data collection at the individual level, as for example in the
case of indicators No 3 (adults with fewer than two healthy lifestyle behaviours) and No 18
concerning households living in income poverty. In these instances, it can be generally
assumed that these gaps can be addressed by substituting or supplementing with indicators
involving individuals’ own assessment or reporting. Perhaps the main exception would be
indicators relating to children.
Third, the main gaps are in the case of indicators that are not people-related, and are mostly
place-related such as those measuring soil or atmospheric quality. Seventeen out of the 46
indicators fall in this category – see Table 3. However, some of them could be ameliorated
through substitution with people-related indicators. For example, an individual entrepreneurship
24 E.g. the Cwm Taf PSB
25 IAOS p 11

ESPON / QoL – Quality of Life Measurements and Methodology / Draft Final Report 29
indicator could be used instead of No 11 (Percentage of businesses which are innovation-
active) and Nos 31, 32 and 3326 could be converted into people rather than property related
measurements.
This strong affinity towards a citizen-centric approach has also built on other related
experiences, such as the ‘population accountability’ and other features of the Results Based
Accountability (RBA) which has been used extensively in Wales27.
Misperceptions vs fact-based evidence
Although the approach adopted in Wales does not apply a specific factfulness methodology,
like the one suggested in the main report and tested in some of the case studies, it does
emphatically follow an evidence-based approach. For instance, the WFG Act requires, once
every parliamentary cycle, a major ‘Future Generations Report’ based on the annual ‘Well-
being of Wales’ reports on progress against the set indicators and a ‘Future Trends Report’.
The process of local well-being assessments and plans explicitly draws on a systematic and
very extensive ‘evidence base’ which is open to participants on an on-going basis. This includes
consideration of “which are the most important dimensions of QoL” and factual information
about past evolution and future forecasts. The formal advice provided by the FG Commissioner
to each PSB during this process includes a large number of specific suggestions and
information sources to ensure a sound factual basis in defining local objectives and translating
them into a local well-being plan. It can, therefore, be concluded that the approach implemented
in Wales already approximates or, at least, is endeavouring to reach the attributes of the
factfulness approach advocated in the main report.
4.4 Application of the methodology in the case study context
The Welsh case study has a very comprehensive set of data, which allows ample scope for
testing the dashboard approach developed in the main report.
First of all, all the indicators presented in Table 3 were compiled from official sources. We
allocated the indicators to the nesting system (see section 4.2). For each of the sub-domains
we chose between two and four indicators for the dashboard. This selection was based on an
assessment of which indicators cover the sub-domain in the best way, trying to avoid too many
overlaps between the indicators. Also, we had to select only from those indicators which are
available at LAU level.
As the data are from slightly different time periods, we took the most recent data, defined as
the period 2016-2019. The dashboard for this period shows the sub-domains reflecting the QoL
in a sub-region as compared to other sub-regions, including its ranking – see Figure 7.
For Wales we are in the favourable position to have comparable data for a previous point in
time. Again, we chose a time period which is reasonably covered by indicators’ data (2010-
2012). Thus, we provide a second dashboard for this period in Figure 8, below. This allows –
for each of the sub-regions – a comparison between its relative position in the recent period
(2016-2019) to a past period (2010-2012).
The following figures represent an example of the application of the dashboard. With data for
the LAU Cardiff the dashboard shows its relative position in the QoL domains and sub-domains
26 No 31, Percentage of dwellings which are free from hazards; No 32, Number of properties (homes
and businesses) at medium or high risk of flooding from rivers and the sea; No 33, Percentage of dwellings with adequate energy performance.
27 Adamson D. & Burgess K. (2012), Natural Resources Wales (2015), Jordan R.(2010)

ESPON / QoL – Quality of Life Measurements and Methodology / Draft Final Report 30
in relation to the other territorial units in Wales. The dashboard is available for all 22 sub-regions
(LAU). Each sub-domain is shown as a bar chart for the normalised average of the chosen
indictors. Figures 7 and 8 provide the recent and the past version.
Figure 7 Dashboard for Wales: scales for domains and sub-domains – recent version (2016-2019)
Figure 8 Dashboard for Wales: scales for domains and sub-domains - past version (2010-2012)
Figures 9 and 10, below, map out all sub-regions of Wales for the same two periods, 2016-
2019 and 2010-2012 respectively. The recent version (2016-2019) shows a generally expected
patter of lower values in the TQoL index for the traditional industrial areas of South Wales and
Wrexham in the North-East. However, a comparison with the index values for 2010-2012,
reveals several changes, for instance, placing The Vale of Glamorgan and Denbighshire in top
bracket (dark green) in 2016-2019 raised significantly from the values in 2010-2012.
Conversely, the TQoL index values fell for some sub-regions, e.g. Pembrokeshire.
Figure 11 shows the changes in the ranking of all the sub-regions in the same period. An
example of the highest gains (dark green) is the Isle of Anglesey in the North-West and, at the
opposite end (dark red), an example of the highest drop in ranking is Monmouthshire in the
South-East.

ESPON / QoL – Quality of Life Measurements and Methodology / Draft Final Report 31
Figure 9 Dashboard for Wales: Map of Wales Territorial Quality of Life Index 2016 – 2019
Figure 10 Dashboard for Wales: Map of Wales Territorial Quality of Life Index 2010 – 2012
Figure 11 Dashboard for Wales: Map of Wales Development 2010 – 2019 Territorial Quality of Life Index

ESPON / QoL – Quality of Life Measurements and Methodology / Draft Final Report 32
The second outcome of the dashboard is to offer a quick overview on the ranking of all sub-
domains: green is for a high ranking, while the exclamation marks in yellow show intermediate
rankings and the red crosses show low ranks. Figures 12 and 13 show the position of Cardiff
in the recent and past version, respectively.
Figure 12 Dashboard for Wales: composite indices – recent version (2016-2019)
Figure 13 Dashboard for Wales: composite indices – past version (2010-2012)
Finally, the dashboard allows us to go into greater depth. For instance, in Figures 14 and 15,
below, we have mapped out the TQoL index values for the Life Maintenance Pillar for the same
recent and past versions (2016-2019 and 2010-2012, respectively). These show similarities to
the picture painted in the general TQoL index (e.g. lower values for the traditional industrial
areas of South Wales), but also some differences such as in the values accorded to the rural
areas of East Wales (see Figures 9 and 14). The comparative position of several sub-regions
has also changed differently under the Life Maintenance Pillar (see Figure 16). For example,
Carmarthenshire’s ranking dropped under this Pillar although it had gained significantly under
the general TQoL index (Figure 11).
Territorial Quality of Life of Cardiff 8 out of 22 regions
Good Life Enablers 2 Life Maintenance 11 Life Flourishing 10
Personal Enablers 17 Personal Health and Safety 10 Personal Flourishing 8
Housing & basic util ities 17 Personal Health 8 Self-esteem 9
Healthcare - Personal Safety 10 Self-actualization 5
Education -
Socioeconomic Enablers 1 Economic and Societal Health 2 Community Flourishing 15
Transport - Inclusive Economy 5 Interpersonal Trust (societal belonging) 19
Digital connectivity - Healthy Society 3 Institutional Trust (good governance) 6
Work opportunities -
Consumption opprotunities 1
Public spaces -
Cultural assets -
Ecological Enablers - Ecological Health 20 Ecological Flourishing -
Green infrastructure - Healthy Environment 6 Ecosystems services and Biodiversity wealth -
Protected areas - Climate Change 22
Territorial Quality of Life of Cardiff 13 out of 22 regions
Good Life Enablers 12 Life Maintenance 14 Life Flourishing 15
Personal Enablers 12 Personal Health and Safety 9 Personal Flourishing -
Housing & basic util ities 12 Personal Health 9 Self-esteem -
Healthcare - Personal Safety - Self-actualization -
Education -
Socioeconomic Enablers - Economic and Societal Health 13 Community Flourishing 15
Transport - Inclusive Economy 2 Interpersonal Trust (societal belonging) 15
Digital connectivity - Healthy Society 17 Institutional Trust (good governance) -
Work opportunities -
Consumption opprotunities -
Public spaces -
Cultural assets -
Ecological Enablers - Ecological Health 22 Ecological Flourishing -
Green infrastructure - Healthy Environment 6 Ecosystems services and Biodiversity wealth -
Protected areas - Climate Change 22

ESPON / QoL – Quality of Life Measurements and Methodology / Draft Final Report 33
Figure 14 Dashboard for Wales: Maps of Wales TQoL Index 2016 – 2019 Life Maintenance Pillar
Figure 15 Dashboard for Wales: Maps of Wales TQoL Index 2010 – 2012 Life Maintenance Pillar
Figure 16 Dashboard for Wales: Map of Wales Development 2010 – 2019 TQoL Index Life Maintenance Pillar

ESPON / QoL – Quality of Life Measurements and Methodology / Draft Final Report 34
5 Synthesis and conclusions
The previous sections have provided answers to the main issues addressed in line with the
purpose of the case study. These can be distilled as in the following points.
First, the policy context in which the concept of QoL is used is broad covering the full range of
public services and many sectors, including: land use planning and placemaking, transport,
housing, decarbonisation, skills for the future, adverse childhood experiences, and health and
wellness. In all these areas the concept of QoL is used in setting specific objectives, and
defining and pursuing actions for achieving them and contributing to the seven overarching
well-being goals for Wales, which in turn are measured through the 46 indicators for Wales.
Second, the speedy introduction of the concept through comprehensive legislation, QoL-
specific institutional arrangements and the setting up and operationalisation of a measurement
and reporting system are considerable achievements. However, a number of shortcomings
have also been highlighted, including missing direct links between the Wales indicators and
specific objectives set by PBs and PSBs.
Third, there is a high degree of acceptance of the concept as a policy instrument and multi-
actor commitment and major strengths have been identified, such as the forceful championing
role of the FG Commissioner for Wales. However, the implementation of the concept is still
encountering some systemic obstacles, e.g. public bodies’ resistance to adaptation by some
public bodies combined with under-resourcing, as has been for some time the case with PBs
in the health sector.
A number of consultation interviews with the main stakeholders28 have helped clarify some
more specific issues.
As explained in sub-section 4.3.1, the territoriality of the QoL approach followed in Wales
resides primarily in the local Public Services Boards and their activities associated with the
Assessments of Local Well-being and the Local Well-being Plans for which they are responsible
Through these vehicle they address, in their local objectives and indicators, both the ‘quality of
place’ dimension and the ‘territorial QoL’, as defined in the main report.
QoL as pursued since the introduction of the WFG Act in 2015 relates to economic, social
environmental and cultural well-being. It takes socio-economic, demographic and territorial
factors fully into account, but territorial patterns and disparities are not presented as a distinct
area of concern. The concept and measurement of economic growth seems to be an area of
disagreement as pointed out in sub-section 4.2.
The QoL concept and its measurement are used to identify shortcomings, e.g. in the PSBs’
local well-being assessments and plans. The objectives ensuing from this knowledge lead to
actions whose progress is monitored via indicators set for each objective. It should,
however, be clarified that these QoL assessments and corresponding actions are not oriented
28 Face-to-face interviews with each of the consultees on 12 February 2020 in Cardiff:
Glyn Jones, Chief Statistician for Wales
Andrew Charles, Head of Futures Department, Welsh Government
Marie Brousseau-Navarro, Director Policy, Legislation and Innovation, Office of the Future Generations Commissioner for Wales
Cathryn Holzinger, Office of the Auditor General for Wales

ESPON / QoL – Quality of Life Measurements and Methodology / Draft Final Report 35
towards attracting investments from outside to particular locations using their QoL attributes as
pull factor.
The extent of digital innovation in the design and implementation of QoL measurement is
fairly limited. There is a significant involvement of public and private sector organisations and
local communities in what should be measured and how and, indeed, the whole scheme can
be considered to be to some extent citizen-centric. However, so far there has been no exploiting
of new big-data sources or engagement of citizens in the co-production of data.
Overall, the QoL concept and its application in Wales contains several elements that can be
considered good practice with potential transferability. They have been outlined in the previous
sections and can be briefly summarised, as follows:
• All-encompassing QoL concept underpinned by:
o a distinct own legal basis;
o institutional innovation;
o multi-level governance provisions;
o a fully developed measurement system;
• Broad policy spectrum covered by QoL concept and the measurement system;
• High proportion of subjective and people-related indicators, measured at individual level;
• Participatory approach with a degree of adaptability combined with a strong advocacy of
QoL (notably through the championing role of the FG Commissioner).
The feedback from the testing of the dashboard in the case of Wales has been particularly
fruitful. Applying the TQoL measurement system allowed first a quick analysis as to which of
the proposed domains and sub-domains are covered. Although the framework seems to be
very comprehensive, certain gaps have been noted, mainly relating to the Good Life Enablers
dimension.
When using the nesting system for allocating the indictors to the domains and sub-domains,
we established that there is very good coverage of the Life Maintenance and Life Flourishing
dimensions, using also a number of subjective indicators. However, some sub-domains (mainly
regarding ‘inclusive economy indicators’) are covered by several indicators that measure very
similar aspects.
Using the dashboard provides a very quick overview of the situation in each sub-region as
compared to the other sub-regions, at small territorial unit (LAU) level. As data are also (largely)
available for a previous point in time, it has been possible to fill a second dashboard allowing a
comparison between the relative position of a region in two different time periods.
To conclude, the concept and the measurement of QoL in Wales are well developed, all-
encompassing and advanced in implementation,
The scheme is particularly rich in legal and institutional provisions. These have been put into
effect fast since 2015 and are almost fully operational. However, their complexity also results
in overlaps and inconsistencies in the application of the concept.
In terms of measuring QoL, the scheme recognises and follows the tenets of the approach
advocated in the main report, i.e. that “Quality of Life cannot be gauged and explained by a
single composite index, but should be measured and explained by using a set of qualitatively
distinct indicators and methodologies that help to detect underlying patterns”.
Although the concept itself and its implementation are relatively robust, there are some gaps
and some key aspects need attention, especially:

ESPON / QoL – Quality of Life Measurements and Methodology / Draft Final Report 36
• Using of same indicators or at least a core sub-set at both Wales and local (PSB) level
would be highly desirable for internal consistency and measurability;
• Using systematically the established indicators framework in the FG Commissioner’s
reports.
Further improvements could include:
• Adding indicators (especially on health-care and digital connectivity) would ensure better
coverage of the Good Life Enablers dimension on the lines of the TQoL scheme proposed
in the main report;
• Moving further towards citizen-centric approach by substituting or supplementing some
indicators with people-relevant ones;
• Using, even experimentally, big data a source.
In the context of the COVID-19 crisis and post-crisis recovery, there could be further significant
shifts in QoL priorities and measurement in Wales. The Good Life Enabler dimension is
particularly relevant, as access to healthcare, digital connectivity, public spaces and green
infrastructures is essential. This dimension is relatively weak in the QoL scheme in Wales and
it could receive more attention. As indicated in section 2.5, there are also other broader and
potentially more ambitious improvements that could flow longer term from the vision advocated
by the FG Commissioner for “a new definition of prosperity, based on well-being, and a fairer,
greener way of living.”

ESPON / QoL – Quality of Life Measurements and Methodology / Draft Final Report 37
6 Recommendations
6.1 How the QoL concept and indicators could be further developed in the region
There are two main areas of potential improvement of the QoL scheme in Wales: the
measurement system and certain institutional and policy aspects.
The measurement system would be considerably enhanced by actions, such as the following:
• Introduction of territorial analyses and examination of disparities within Wales; also,
consistent use of indicators by PSBs, based on a large sub-set of the 46 Wales indicators
and drawn from those available at LAU level.
• Use of the relevant Wales indicators by the public bodies in defining their QoL objectives
and actions, and in reporting progress; also, systematic use of the full set of the indicators
by the FG Commissioner in assessing/reporting progress towards the well-being goals.
• A further shift towards a citizen-centric approach by substituting and complementing the
existing indicators with people-related indicators measured at individual level.
• Boosting the indicators relating to the Good Life Enabler dimension of the TQoL scheme,
especially regarding healthcare and digital connectivity. Strengthening of this dimension
is important in the context of the COVID-19 crisis as access to healthcare, digital
connectivity, public spaces and green infrastructures is essential.
The institutional and policy aspects of the QoL scheme would benefit from:
• Better coordination and a resolution of the overlaps between the roles of the FG
Commissioner, Chief Statistician for Wales and Auditor General for Wales.
• Building on the good policy coverage that has already been achieved and develop further
the in-depth focus on cross-cutting aspects, such as planning, budgeting and
procurement.
• A broadening of the WFG Act and its provisions to cover, to an appropriate extent, the
private and voluntary sectors.
In the longer term, there could be broader and potentially more ambitious improvements in the
QoL concept and overall scheme in Wales, stemming from a reorientation in the post-COVID-
19-crisis recovery, in favour of “a new definition of prosperity, based on well-being, and a fairer,
greener way of living” as advocated by the FG Commissioner for Wales.
6.2 How the QoL concept of this ESPON project can be improved and enriched
The main area of QoL, in which this ESPON project which could benefit from the approach
adopted in Wales, concerns the comprehensive nature of the Welsh approach and its elements
that represent good practice, such as:
• its distinct legal basis;
• the broad policy spectrum covered by QoL concept and the measurement system;
• the extensive indicators framework and the matrix-based linking of indicators to goals,
which allows qualitative elements to be taken and judgement in interpreting all relevant
measurements;
• the high degree of institutional innovation, especially the independent championing role of
the FG Commissioner, and the cross-cutting and partnership-based local public services
boards (PSBs).

ESPON / QoL – Quality of Life Measurements and Methodology / Draft Final Report 38
7 Sources
7.1 Literature and websites
Adamson D. & Burgess K. (2012), Monitoring & Evaluation: A Guide, CREW Regeneration
Wales, available at http://www.regenwales.org/resource_18_Monitoring-and-Evaluation--A-
Guide
Auditor General for Wales (2018), Reflecting on Year One: How Have Public Bodies
Responded to the Well-being of Future Generations (Wales) Act 2015? available at
https://www.audit.wales/publication/reflecting-year-one
Auditor General for Wales (2020), Well-being of Future Generations Increasing Participation in
Areas with Under-developed Reach of the Arts – Arts Council of Wales, available at
https://www.wao.gov.uk/node/5827
Auditor General for Wales (2020), Implementing the Well-being of Future Generations Act –
Velindre University NHS Trust, available at https://www.audit.wales/node/5835
Audit Wales (2020), So, what’s different? Findings from the Auditor General’s Sustainable
Development Principle Examinations available at
https://www.audit.wales/system/files/publications/Well-being-of-Future-Generations-report-
eng.pdf
Auditor General for Wales (2020), So, what’s different? Findings from the Auditor General’s
Sustainable Development Principle Examinations, available at
https://www.audit.wales/publication/findings-auditor-generals-sustainable-development-
principle-examinations
Cardiff Public Services Board (2017), Well-Being Assessment, available at
https://www.cardiffpartnership.co.uk/well-being-assessment/
Cardiff Public Services Board (2018), Cardiff Well-Being Plan 2018-2023, available at
www.cardiffpartnership.co.uk/well-being-plan/
Cardiff Public Services Board (2019), Cardiff Well-Being Plan 2018-2023, Annual Report
2018/19, available at https://www.futuregenerations.wales/wp-content/uploads/2019/09/2019-
08-08-Cardiff-PSB-Well-being-Plan-ANNUAL-REPORT-english.pdf
Conwy and Denbighshire Public Services Board (2017), Well-Being Assessment, available at
https://conwyanddenbighshirelsb.org.uk/home/english-wellbeing-assessment/
Conwy and Denbighshire Public Services Board (2018), Well-being Plan (2018 – 2023),
available at https://conwyanddenbighshirelsb.org.uk/wp-content/uploads/2018/04/Conwy-
Denbighshire-PSB-Well-being-Plan.pdf
Conwy and Denbighshire Public Services Board (2019), A Year in Review 2018 / 2019,
available at https://www.futuregenerations.wales/wp-content/uploads/2019/09/Conwy-
Denbighshire-PSB-18-19-annual-report-English.pdf
Cwm Taf Public Services Board (2017), Cwm Taf Well-Being Assessment, available at
http://www.ourcwmtaf.wales/cwm-taf-well-being
Cwm Taf Public Services Board (2018), Cwm Taf Well-Being Plan 2018-2023, available at
http://www.ourcwmtaf.wales/SharedFiles/Download.aspx?pageid=286&mid=613&fileid=210
Cwm Taf Public Services Board (2019), Annual Report 2018-19, available at
https://www.futuregenerations.wales/wp-content/uploads/2019/09/Cwm-Taf-Annual-Report-
2019-ENG-FINAL.pdf

ESPON / QoL – Quality of Life Measurements and Methodology / Draft Final Report 39
Egge A. (2020), Evaluating Well-being, The Planner p.35, March 2020
Future Generations Commissioner for Wales (2017), Well-being in Wales: Planning today for a
better tomorrow, Learning from Well-being Assessments 2017, available at
https://www.futuregenerations.wales/resources_posts/well-being-in-wales-planning-today-for-
a-better-tomorrow/
Future Generations Commissioner for Wales (2018), Well-being in Wales: the journey so far,
available at https://www.futuregenerations.wales/resources_posts/well-being-in-wales-the-
journey-so-far/
Future Generations Commissioner for Wales (2018), Annual Report 2017-2018 - What Wales
does today, the world will do tomorrow, available at https://www.futuregenerations.wales/wp-
content/uploads/2018/11/FG-AR-18-Interactive.pdf
Future Generations Commissioner for Wales (2018), Transport Fit for Future Generations
Report, available at https://www.futuregenerations.wales/resources_posts/transport-fit-for-
future-generations-report/
Future Generations Commissioner for Wales (2018), Taking account of the Well-being of Future
Generations Act in the budget process, available at
https://www.futuregenerations.wales/resources_posts/advice-to-welsh-government-on-taking-
account-of-the-well-being-of-future-generations-act-in-the-budget-process/
Future Generations Commissioner for Wales (2019), 10 Point Plan to Fund Wales’ Climate
Emergency, available at https://www.futuregenerations.wales/wp-content/uploads/2019/06/10-
Point-Plan-to-Fund-Wales-Climate-Emergency-Detailed-Report.pdf
Future Generations Commissioner for Wales (2019), Wales and the Sustainable Development
Goals, available at https://www.futuregenerations.wales/wp-content/uploads/2019/07/Wales-_-
SDGs-_-VNR-_-Supplementary-Report-for-Wales-_-Version-10.1-Final-w-cover-ENG.pdf
Future Generations Commissioner for Wales (2019), Annual Report 2018-2019 - Acting today,
for a better tomorrow, available at https://www.futuregenerations.wales/wp-
content/uploads/2019/08/2019-08-15-Final-FG-AR-19-Interactive-Links.pdf
Future Generations Commissioner for Wales (2019), What’s Changing? available at
https://www.futuregenerations.wales/wp-content/uploads/2019/09/ENG-Whats-changing.pdf
Future Generations Commissioner for Wales (2019), Progress towards the Well-being of Future
Generations Act, Overall Findings, available at
https://www.futuregenerations.wales/resources_posts/progress-towards-the-well-being-of-
future-generations-act-overall-findings/
Future Generations Commissioner for Wales (2020), Future Generations Report 2020,
available at https://www.futuregenerations.wales/resources_posts/the-future-generations-
report-2020/
Jones C. (2019), Fit for the Future Education in Wales, White Paper for Discussion, Office of
the Future Generations Commissioner for Wales, available at
https://www.futuregenerations.wales/wp-content/uploads/2019/10/2019-10-16-Fit-for-the-
Future-Education-in-Wales-1-1.pdf
Jones G., Leake S., Charles A. (2018), How Welsh statisticians are helping to measure the
progress of a nation, IAOS Conference 2018

ESPON / QoL – Quality of Life Measurements and Methodology / Draft Final Report 40
Jordan R. (2010), Results Based Accountability Toolkit, Cardiff Chronic Condition Management
Demonstrators, available at https://democracy.swansea.gov.uk/documents/s14057/09A%20-
%20RBA%20Toolkit.pdf
Natural Resources Wales (2015), Communities & Regeneration Enabling Plan 2015–2020:
Results Based Accountability Plan, available at
https://naturalresources.wales/media/4861/communities-regeneration-enabling-plan-rba-
plan.pdf
Well-being of Future Generations (Wales) Act (2015), available at
https://www.legislation.gov.uk/anaw/2015/2/contents/enacted
Welsh Government (2018), Future Trends Report 2017, available at https://gov.wales/future-
trends-2017
Welsh Government (2016), How to measure a nation’s progress? National indicators for Wales,
available at https://gov.wales/sites/default/files/consultations/2018-02/160322-wg-response-
en.pdf
Welsh Government (2017), Prosperity for All: economic action plan, available at
https://gov.wales/prosperity-all-economic-action-plan
Welsh Government (2017), Well-being of Wales report 2016-2017, available at
https://gov.wales/well-being-wales-2017
Welsh Government (2018), Well-being of Wales report 2017-2018, available at
https://gov.wales/well-being-wales-2018
Welsh Government (2019), Well-being of Wales report 2018-2019, available at
https://gov.wales/well-being-wales-2019
Welsh Government (2019), Quality report for contextual information in Well-being of Wales
2018-19, available at https://gov.wales/sites/default/files/statistics-and-research/2019-09/well-
being-wales-2019-quality-report-contextual-information_0.pdf

ESPON / QoL – Quality of Life Measurements and Methodology / Draft Final Report 41
ESPON 2020 – More information
ESPON EGTC 4 rue Erasme, L-1468 Luxembourg - Grand Duchy of Luxembourg Phone: +352 20 600 280 Email: [email protected] www.espon.eu, Twitter, LinkedIn, YouTube
The ESPON EGTC is the Single Beneficiary of the ESPON 2020 Cooperation Programme. The Single Operation within the programme is implemented by the ESPON EGTC and co-financed by the European Regional Development Fund, the EU Member States and the Partner States, Iceland, Liechtenstein, Norway and Switzerland.