esporão's 2013 sustainability report
DESCRIPTION
ÂTRANSCRIPT

REPORT
2013


2013 REPORT
INDEX
INDEX
4
8
12
28
38
48
52
58
70
76
80
I.
II.
III.
IV.
V.
VI.
VII.
VIII.
IX.
X.
XI.
STATEMENT BY THE CHAIRMAN OF THE BOARD, Dr. José Roquette
STAKEHOLDERS – INTERESTED PARTIES
THE ESPORÃO GROUPOur reason to existOur ClientsOur products and servicesThe Governance StructureThe Companies
RESULTS OF THE PERIODEconomic resultsFinancial ResultsDistribution of ResultsAchieved Acknowledgements
PEOPLEWorking PracticesRights and GuaranteesHealth and Safety at WorkEvaluation and trainingBenefits and wages
OUR SUPPLIERS
CONSUMED RESOURCESFinancial support from the StateEnergyWater
WASTE, EMISSIONS AND OTHER IMPACTSWastewaterGreenhouse gas emissionsWaste generatedHabitats and biodiversityClimate changeMitigating the impacts of our products and servicesEnvironmental mitigation investments
COMMITMENTS AND OBLIGATIONSGeneral StatementsControlling the life cycle of our productsCommunication and ethical promotion
STATEMENTS TO THE REPORTStructure and scope of the reportApplication of the precautionary principle
ANNEXESResults of the customer satisfaction surveyCharitiesGRI IndexConsolidated Balance SheetConsolidated Income Statement per natureStatement of Changes in EquityConsolidated statement of cash flowsNotes to the Consolidated Financial Statements

01STATEMENT BY THE CHAIRMAN OF THE BOARD, Dr. José Roquette
2013 REPORT 01. STATEMENT BY THE CHAIRMAN OF THE BOARD, Dr. José Roquette
40 YEARS OF ESPORÃOhttp://goo.gl/CKgYab
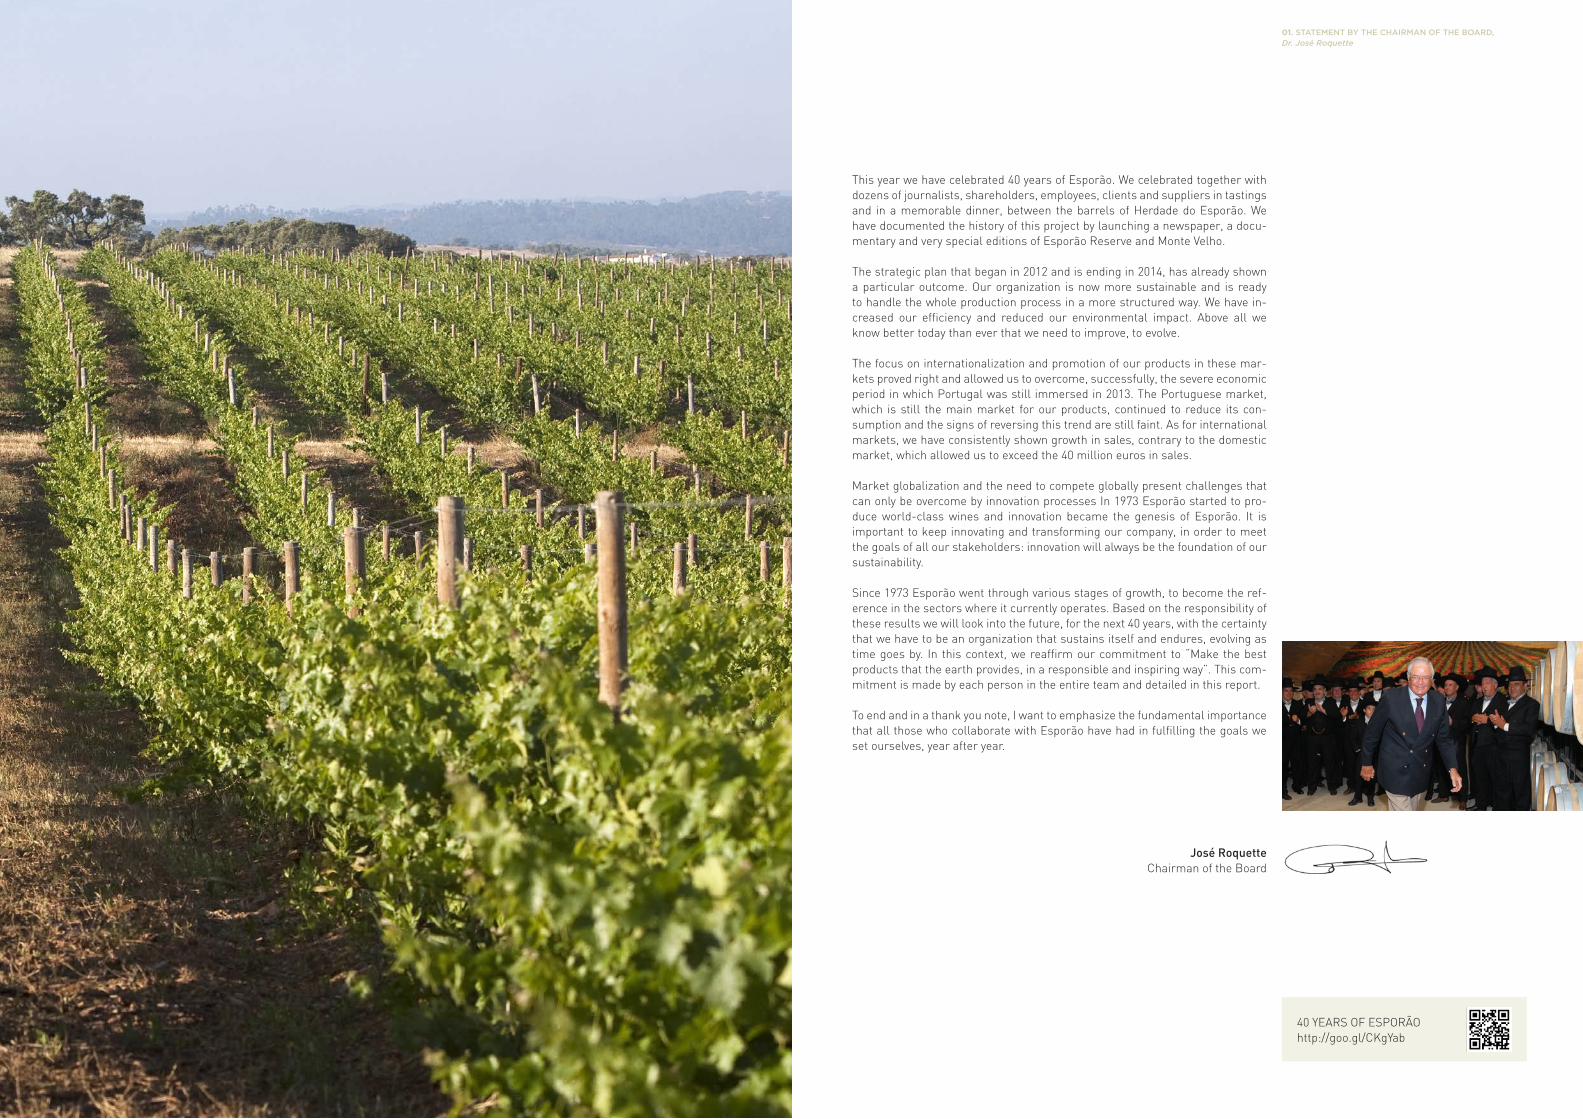
This year we have celebrated 40 years of Esporão. We celebrated together with dozens of journalists, shareholders, employees, clients and suppliers in tastings and in a memorable dinner, between the barrels of Herdade do Esporão. We have documented the history of this project by launching a newspaper, a docu-mentary and very special editions of Esporão Reserve and Monte Velho.
The strategic plan that began in 2012 and is ending in 2014, has already shown a particular outcome. Our organization is now more sustainable and is ready to handle the whole production process in a more structured way. We have in-creased our efficiency and reduced our environmental impact. Above all we know better today than ever that we need to improve, to evolve.
The focus on internationalization and promotion of our products in these mar-kets proved right and allowed us to overcome, successfully, the severe economic period in which Portugal was still immersed in 2013. The Portuguese market, which is still the main market for our products, continued to reduce its con-sumption and the signs of reversing this trend are still faint. As for international markets, we have consistently shown growth in sales, contrary to the domestic market, which allowed us to exceed the 40 million euros in sales.
Market globalization and the need to compete globally present challenges that can only be overcome by innovation processes In 1973 Esporão started to pro-duce world-class wines and innovation became the genesis of Esporão. It is important to keep innovating and transforming our company, in order to meet the goals of all our stakeholders: innovation will always be the foundation of our sustainability.
Since 1973 Esporão went through various stages of growth, to become the ref-erence in the sectors where it currently operates. Based on the responsibility of these results we will look into the future, for the next 40 years, with the certainty that we have to be an organization that sustains itself and endures, evolving as time goes by. In this context, we reaffirm our commitment to “Make the best products that the earth provides, in a responsible and inspiring way”. This com-mitment is made by each person in the entire team and detailed in this report.
To end and in a thank you note, I want to emphasize the fundamental importance that all those who collaborate with Esporão have had in fulfilling the goals we set ourselves, year after year.
José RoquetteChairman of the Board

02STAKEHOLDERS – INTERESTED PARTIES

2013 REPORT 12 | 11 02. STAKEHOLDERS – INTERESTED PARTIES
We carried out some adjustments in Esporão Stakeholder groups over the last year’s report, which are presented below:
SHAREHOLDER: Committed to creating prosperity, to our employees, to the communities where we operate, to the environment and, especially, to our customers.
FINANCIAL INSTITUTIONS: Boosters of our project they are an interested party on the results, given the financial commitments they took on.
LOCAL COMMUNITIES: As part of the local communities in which we operate, we are intimately connect-ed and interested in establishing deep ties with our neighbours, local authori-ties and civil society, integrating ourselves in it and integrating it in our activity, working with local businesses, bringing visitors to the region and creating value in the regions where we operate.
EMPLOYEES: They are the heart of the company. Their commitment to the mission, vision and values is essential, as well as their personal fulfillment in addition to profes-sional achievement. Their contribution is the real driving force for sustainability.
CLIENTS AND CONSUMERS: They are those who buy or influence the purchase of our products in different markets and the basis of our entire project.
SUPPLIERS: Supply is essential for the development of our productive activity. We seek to build a healthy, close and mutual relationship, based on ethics, integrity and trust.
AGENCIES AND ENVIRONMENTAL AND CULTURAL ASSOCIATIONS: Strongly committed to protecting the environment and promoting our cultural identity and heritage, they are a source of knowledge and sharing that will help us to connect to our origins.
MEDIA AND SPECIALIZED CRITICS: We acknowledged the critics through visits and contacts with journalists and 19 published press releases.
TAXPAYERS AND STATE: We follow the laws of the countries where we operate and sell our products, including timely and correct payment of taxes. We are supported by the Por-tuguese Government and the European Community, which includes financial support to increase our activity and economic, social and ecological outcomes in different communities.

03THE ESPORÃO GROUP

2013 REPORT
Our direct client, typically one per market.
It is considered a partner.
Long lasting, reliable and stable relationships.
Logistical properties of products are essencial.
They bet on the brands and work their market accordingly.
Brand advertising is important to these clients.
Ranges from large-scale distribution chain to the restaurant or specialty store.
Visual aspect of the product is essential.
The notoriety of the product and its brand are also important, especially for the product turnover.
Promotion activities are important to these clients.
Main client and end consumer of our products.
Has expectations that must be met by consuming the product.
Image, type of wine or olive oil and overall perceived quality are important.
Also important are the origin of products and their sustainability.
IMPORTERS
DISTRIBUTORS
CONSUMERS
03. THE ESPORÃO GROUP16 | 15
“To create the best products nature provides, in a responsible and inspiring way”
ESPORÃO WORLDWIDEhttp://goo.gl/aFCgyl
1 The rubric “Other markets” refers to sales in 41 different countries. Compared to the previous report, we introduced the sales of our company Qualimpor having the values of 2011 and 2012 been
adjusted accordingly.
OUR REASON TO EXISTEsporão was born in Alentejo. It was born from the unconditional willingness to create the best wines. This motivation is at the core of everything we do and is now extended to other products and regions.
In each territory nature inspires us and helps us to do the best. Therefore we respect and protect it, ensuring continuity in an increasingly uncertain future.
We believe that Esporão should work in behalf of society and not otherwise. We therefore seek a responsible way to develop our activity. Such responsibility is not just abstract or collective: it is individual, of everyone who holds Esporão as part of his and her life.
We promote nonconformity and change, try to do better and not necessari-ly more. We learned that progress depends on restlessness and creativity on reaching out for the best solutions, on the knowledge that we develop and apply, on believing and putting our soul into what we do.
In this journey, which began in 1973, keeping us true to our values greatly helped us to build a company where we are proud to work and where the solid result of that work earned the trust of those who, in the end, matter most: people who buy our products.
We know that teamwork, ideas and diversity enrich us, improve the outcome and provide for the future. So we thank all those who have contributed and are contributing to this project, employees, partners, friends, families, as we look to the future aspiring to be a part of the change that the world so desperately needs, a permanent commitment to our customers and quality of our products.
Our ClientsWe are part of a value chain in which we consider our clients as the main end consumers of our products.
In terms of geographic markets and in the reporting period, we sold our prod-ucts in 53 countries. The distribution of sales in major markets is presented in the table below.
Image 1 – Evolution of sales of wine and olive oil (in 9Lbox)
1,400,000
1,200,000
1,000,000
800,000
600,000
400,000
200,000
02011 2012 2013
1,294,723 1,332,909 1,279,515
QUANTITY (9Lbox) VALUE (Euros)
MARKET 2011 2012 2013 2011 2012 2013
Portugal 807,072 836,422 709,292 18,545,701 17,275,702 16,151,244
Brazil 84,307 106,976 124,033 7,479,010 10,238,919 10,382,718
Angola 121,595 76,309 108,094 3,674,941 2,455,888 3,531,323
USA 56,401 60,301 72,554 1,833,431 1,999,422 1,857,821
Switzerland 17,262 21,387 21,788 657,531 823,142 817,884
Canada 17,095 16,395 18,103 517,222 497,654 536,635
Germany 13,084 12,496 13,217 379,657 409,488 380,092
Belgium 23,848 27,521 20,670 651,913 728,763 525,402
China 1,481 7,793 14,180 83,029 397,109 561,321
Travel Retail 5,153 4,780 11,661 247,141 231,625 372,221
England 10,012 10,744 10,487 342,372 309,229 236,519
Holand 9,906 7,163 6,224 224,365 210,681 202,871
Australia 4,263 796 1,372 151,358 19,699 55,978
Finland 33 2,474 1,104 2,115 187,604 64,129
France 24,427 32,678 38,096 737,205 983,672 1,155,733
Poland 31,751 38,822 27,572 586,159 760,770 487,487
Swaziland 9,149 10,387 23,427 242,307 252,881 525,302
Luxembourg 17,426 16,239 11,264 566,289 484,176 380,351
Mozambique 5,349 8,436 9,452 151,158 239,652 273,716
Dutty-Free 3,662 797 8,131 167,283 46,308 229,089
Cape Verde 12,756 11,095 6,115 344,962 315,478 157,074
Denmark 2,515 1,229 3,401 118,508 64,596 118,772
Macau 3,779 3,937 2,880 226,339 258,661 170,899
Other markets 12,395 17,733 16,400 424,590 674,727 576,868
TOTAL 1,294,723 1,332,909 1,279,515 38,354,585 39,865,845 39,751,449
Table 1 –Sales of wine and olive oil in 9Lbox and in Euros.

2013 REPORT
62%
9%
4%
2011
7%
2012
62%
8%
6%
5%
2013
55%
10%
8%
6%
03. THE ESPORÃO GROUP18 | 17
ESPORÃO EVALUATION
IMPORTANCE TO THE BUSINESS
Image 3 – Evaluation of Esporão by surveyed clients
Image 4 – Evaluation of parameters according to their importance to the business
DBrands, acting on the Angolan market and whose sales are not presented con-solidated in the table above, started its sales activity in February 2013, reaching a total of 46.680 9L cases.
We have not received any complaints from our customers on their privacy or on their data.
We conducted a survey on import clients to evaluate their satisfaction and ob-tained seven responses in a universe of 19 clients contacted by phone.
Image 2 – Sales of wine and olive oil in 9L cases, by market
ANGOLA BRAZIL PORTUGALUSA
EVALUATION CRITERIA
CUSTOMER SERVICE
ORDER MANAGEMENT
AVAILABLE RANGE OF PRODUCTS
TECHNICAL AND LOGISTICS DATA SHEETS
DELIVERY DEADLINES
PROMOTIONAL MATERIALS
COMPLAINTS
CERTIFICATION
BAD GOOD VERY GOOD
0% 10% 20% 30% 40% 50% 60% 70% 80% 90% 100%
75%25%
57%43%
43%57%
14%29%
57%
57%43%
40%60%
17%83%
14%86%
0% 10% 20% 30% 40% 50% 60% 70% 80% 90% 100%
40%60%
75%25%
20%
CRITICAL VERY CRITICAL
80%
14%86%
67%33%
17%83%
29%71%
14%86%
EVALUATION CRITERIA
CUSTOMER SERVICE
ORDER MANAGEMENT
AVAILABLE RANGE OF PRODUCTS
TECHNICAL AND LOGISTICS DATA SHEETS
DELIVERY DEADLINES
PROMOTIONAL MATERIALS
COMPLAINTS
CERTIFICATION

2013 REPORT 20 | 19
Herdade do Esporão,Alentejo
WINES AND OLIVE OILS FROM HERDADE DO ESPORÃOhttp://goo.gl/F3yaz5
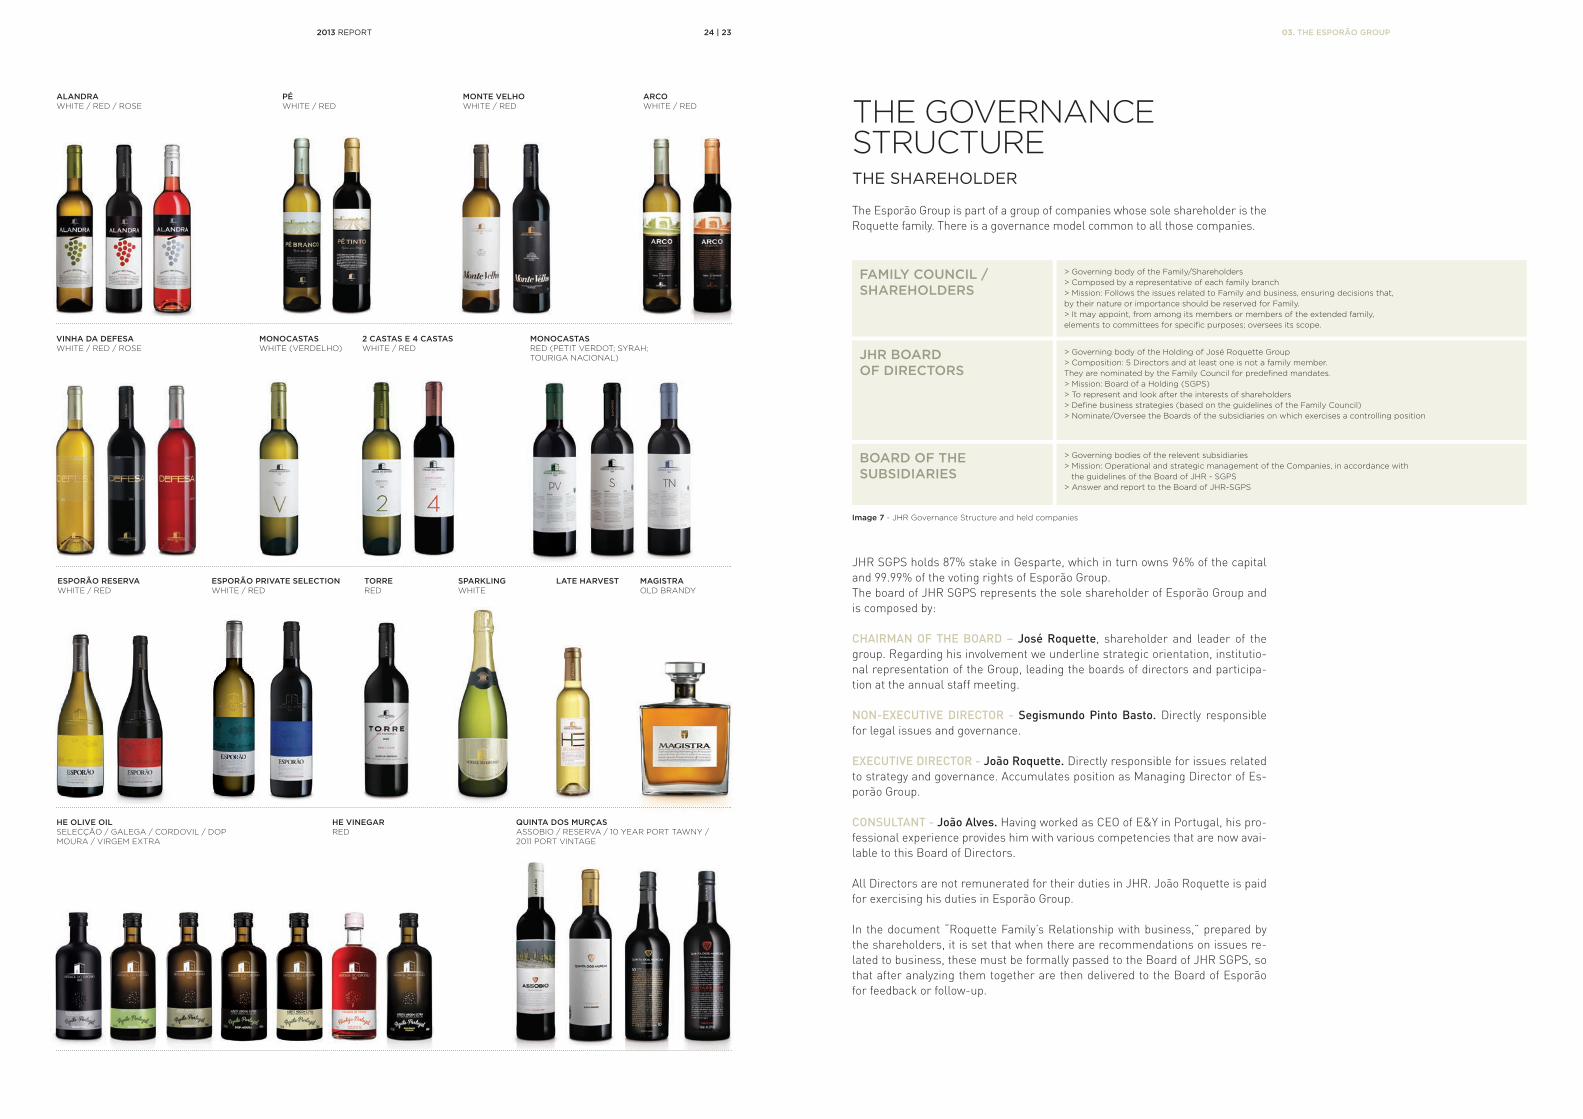
OUR PRODUCTSOur main activity is production, marketing and export of high quality wines and olive oils, produced from grapes and olives coming from our vineyards and olive groves, as well as from third parties with whom we keep contracts for supply and monitoring of the various stages of agricultural development. This business model allows the application of modern methods and techniques and complete control over the production process, with integrated intervention at all stages of the productive, agricultural, industrial and commercial process.
Herdade do Esporão, in Reguengos de Monsaraz, Alentejo, reaches to our clients through the following products and services:
ALANDRA: Entry-level wine with a fresh and fruity profile, obtained from different batches of wine that guarantee a permanent and consistent quality.
MONTE VELHO: Alentejo classic wine and a faithful mirror of the region from which it originates. Over the years, it became a major reference of Alentejo in Portugal and in the world, based on its profile and constant quality levels. This year, we reviewed its value proposition, resulting in the change of packaging in May and in the availability of supporting elements of marketing (communication, promotional concepts, activities, materials, etc.).
VINHA DA DEFESA: It shows the character of the grapes of Vinha da Defesa and of other selected plots of the estate. The combination of grape varieties and the different vinifica-tion processes aim at a contemporary style and an elegant and intense profile, common to these three wines.
ESPORÃO RESERVE: These wines reveal a more classic profile and are made from grapes with Alen-tejo Designation of Controlled Origin (DOC), selected from the vineyards of Her-dade do Esporão. They show the consistency and the rich and typical character of the best wines of Alentejo.
ESPORÃO PRIVATE SELECTION: Wines with structure, strong personality and complexity, are the result of the se-lection of the best grapes of our terroir and of the creativity of our winemakers. They are unique wines made in small quantities.
MONO-VARIETALS: Produced only in specific years, when the varieties turn out exceptional. The gra-pes are carefully selected and hand harvested from individual plots in Herdade do Esporão.
SPECIAL WINES: Sparkling, late harvest and fortified wines that defy nature laws established for the Alentejo region.
Table 3 – Production in 2013
TOTAL ALENTEJO DOURO
AGRICULTURAL PRODUCTION (KG) 14,017,713 13,747,400 274,313
Our own grapes (Kg) 3,594,339 3,444,410 153,929
Purchased grapes (Kg) 6,358,564 6,254,340 104,224
Our own olives (Kg) 79,575 63,415 16,160
Purchased olives (Kg) 3,985,235 3,985,235 0
CELLAR / WINERY 11,674,876 11,559,905 114,971
Produced Wine (L) 6,993,121 6,880,000 113,121
Purchased Wine (L) 4,094,063 4,094,063 0
Produced Olive Oil (L) 558,085 556,235 1,850
Purchased Olive Oil (L) 29,607 29,607 0
BOTTLING 10,593,748 10,575,770 155,053
Wine (L) 9,867,237 9,851,109 153,203
OliveOil (L) 726,511 724,661 1,850
03. THE ESPORÃO GROUP

2013 REPORT 22 | 21
Serpa, Moura �Alentejo
Lourinhã
Quinta dos Murças,Douro
WINES FROM QUINTA DOS MURÇAShttp://goo.gl/FRXRYC
WINE TOURISM: As part of the Worldwide Wine Route, we have received thousands of visitors since 1997 to whom we provide educational and recreational vineyard tours, on foot, by bicycle or van, training and wine tastings, cellar and wine-cellar tours and breathtaking dining experiences in the restaurant of Herdade do Esporão.
The wines produced at Quinta dos Murças in the Douro region, the oldest de-marcated wine region in the world (est. 1756) show our clients the best of what this noble region represents:
ASSOBIO: Douro DOC wines produced at Quinta dos Murças. They present the features of the region from where they come. Versatile and gastronomic wines.
QUINTA DOS MURÇAS RESERVE: Douro DOC Reserve wine, born in our old vines on schist soils, respecting nature and following sustainable agriculture. Manual selection of grapes, which are stomped in granite tanks and pressed in an ancient vertical press. Aged for 12 months in oak barrels and one year in bottle.
QUINTA DOS MURÇAS PORTO 10 YEARS TAWNY: Port wine produced with grapes of superior quality (A), harvested from vines with an average of 20 years of age. Aged in barrels for a an average period of 10 years.
QUINTA DOS MURÇAS PORTO VINTAGE SINGLE QUINTA: Produced with grapes of superior quality (A) and fermented in tanks of grape-s-tomping, this Vintage Port shows the potential of Covelinhas region to produce Vintage Ports. It is only made in years of excellence, referred to as Vintage, and in small quantities.
Our olive oils produced in Serpa, in the region of Moura, Alentejo are structu-red as follows:
SELEÇÃO EXTRA VIRGIN OLIVE OIL: Olive oil produced from four varieties of olives: Galega, Cobrançosa, Frantoio and Picual. The careful selection of fruit from the field to the mill resulted in a very complex and persistent olive oil, for the most demanding consumers.
DOP MOURA EXTRA VIRGIN OLIVE OIL: Olive oil from the region of Protected Designation of Origin (DOP) of Moura, in Baixo Alentejo. It presents exuberant green leaves and grass notes, velvety tex-ture and a mild almondy aroma.
GALEGA EXTRA VIRGIN OLIVE OIL: Monovarietal olive oil, made from green and mature olives, that features smooth aromas, highlighting the exuberance of almond, corresponding to the characte-ristic profile of Galega, the most emblematic variety of olive in Portugal. Certi-fied for the first time as Alentejo Geographical Indication.
CORDOVIL EXTRA VIRGIN OLIVE OIL: Monovarietal olive oil, produced from green and mature olives and with notes of bitterness and spiciness, corresponding to the characteristic profile of Cordovil, a very representative variety of Alentejo. Certified for the first time as Alentejo Geographical Indication.
EXTRA VIRGIN OLIVE OIL: Olive oil with a soft and smooth profile, a good balance of fruity aromas typical of the varieties of olives from Alentejo.
VIRGIN OLIVE OIL: Olive oil resulting from the combination of several varieties of Alentejo traditio-nal olives, characterized by its discrete aromas and extremely smooth profile.
QUINTA DOS MURÇAS EXTRA VIRGIN OLIVE OIL:. Olive oil produced from the olive varieties Galega and Negrinha de Freixo in or-ganic production, with the olive grove currently under a reconversion process.
ORGANIC EXTRA VIRGIN OLIVE OIL: Olive oil produced from the olive varieties Cobrançosa and Arbequina in organic production. There is a careful selection of fruit from the field to the mill, thereby obtaining an authentic and genuine, full of aroma and flavor, olive oil.
VINEGAR: Produced from selected wines, the red wine vinegar is valued by ageing at least six months in American oak barrels, which makes it soft and fragrant.
In the demarcated region of Lourinhã we produce brandy:
MAGISTRA: Resulting from a partnership with Quinta do Rol, property of Carlos Melo Ri-beiro, it is a brandy XO (Extra Old), thus dignifying the Portuguese tradition of producing spirits. Lourinhã and the regions of Cognac and Armagnac in France are the only three regions in the world with their own denominations for the production of such drinks.
Monte Velho
Alandra
Brand
Consolidated Sales
14,124,011 €
4,859,601 €
EsporãoReserve
4,681,832 €
OliveOil
2,260,737 €
Vinha da
Defesa
1,130,385 €
Varietals
577,486 €
SuperPremium
550,780 €
Pé
534,236 €
Assobio
297,764 €
Quinta dos
Murças
271,005 €
Arco
176,920 €
OtherWines
98,309 €
Sparkling
Wines
86,290 €
Image 6 – Consolidated Sales by brand
03. THE ESPORÃO GROUP
Image 5 – Schematic of the Architecture of brands
Herdade do Esporão
(Alentejo)
Esporão
(Lisboa)
Quintas dos Murças
(Douro)
Quinta dos MurçasReserve
—Assobio
DOC Douro—
Porto Tawny 10 AnosVintage
—Single Quinta
Magistra
(Lourinhã)
Olive OilsHerdade do Esporão
Esporão—
Defesa—
Monte Velho—
Alandra
LEVEL 1COMPANY / INSTITUTIONAL
LEVEL 2ORIGIN/TERROIR
LEVEL 3BRANDS
2013 REPORT 24 | 23
ALANDRAWHITE / RED / ROSE
ESPORÃO RESERVAWHITE / RED
MONOCASTASRED (PETIT VERDOT; SYRAH; TOURIGA NACIONAL)
HE OLIVE OILSELECÇÃO / GALEGA / CORDOVIL / DOP MOURA / VIRGEM EXTRA
QUINTA DOS MURÇASASSOBIO / RESERVA / 10 YEAR PORT TAWNY / 2011 PORT VINTAGE
HE VINEGARRED
MONOCASTASWHITE (VERDELHO)
MONTE VELHOWHITE / RED
ESPORÃO PRIVATE SELECTIONWHITE / RED
VINHA DA DEFESAWHITE / RED / ROSE
PÉWHITE / RED
2 CASTAS E 4 CASTASWHITE / RED
TORRERED
ARCOWHITE / RED
SPARKLINGWHITE
LATE HARVEST MAGISTRAOLD BRANDY
FAMILY COUNCIL / SHAREHOLDERS
> Governing body of the Family/Shareholders
> Composed by a representative of each family branch
> Mission: Follows the issues related to Family and business, ensuring decisions that,
by their nature or importance should be reserved for Family.
> It may appoint, from among its members or members of the extended family,
elements to committees for specific purposes; oversees its scope.
BOARD OF THE SUBSIDIARIES
> Governing bodies of the relevent subsidiaries
> Mission: Operational and strategic management of the Companies, in accordance with
the guidelines of the Board of JHR - SGPS
> Answer and report to the Board of JHR-SGPS
JHR BOARD OF DIRECTORS
> Governing body of the Holding of José Roquette Group
> Composition: 5 Directors and at least one is not a family member.
They are nominated by the Family Council for predefined mandates.
> Mission: Board of a Holding (SGPS)
> To represent and look after the interests of shareholders
> Define business strategies (based on the guidelines of the Family Council)
> Nominate/Oversee the Boards of the subsidiaries on which exercises a controlling position
THE GOVERNANCE STRUCTURETHE SHAREHOLDER
The Esporão Group is part of a group of companies whose sole shareholder is the Roquette family. There is a governance model common to all those companies.
Image 7 - JHR Governance Structure and held companies
JHR SGPS holds 87% stake in Gesparte, which in turn owns 96% of the capital and 99.99% of the voting rights of Esporão Group.The board of JHR SGPS represents the sole shareholder of Esporão Group and is composed by:
CHAIRMAN OF THE BOARD – José Roquette, shareholder and leader of the group. Regarding his involvement we underline strategic orientation, institutio-nal representation of the Group, leading the boards of directors and participa-tion at the annual staff meeting.
NON-EXECUTIVE DIRECTOR - Segismundo Pinto Basto. Directly responsible for legal issues and governance.
EXECUTIVE DIRECTOR - João Roquette. Directly responsible for issues related to strategy and governance. Accumulates position as Managing Director of Es-porão Group.
CONSULTANT - João Alves. Having worked as CEO of E&Y in Portugal, his pro-fessional experience provides him with various competencies that are now avai-lable to this Board of Directors.
All Directors are not remunerated for their duties in JHR. João Roquette is paid for exercising his duties in Esporão Group.
In the document “Roquette Family’s Relationship with business,” prepared by the shareholders, it is set that when there are recommendations on issues re-lated to business, these must be formally passed to the Board of JHR SGPS, so that after analyzing them together are then delivered to the Board of Esporão for feedback or follow-up.
03. THE ESPORÃO GROUP

2013 REPORT 26 | 25
Esporão Group is the most relevant and complex subsidiary of this group of companies and as such, has its own governance structure
There were no significant changes of capital in any of the companies of Esporão Group, thus remaining unchanged the participation of Gesparte as the majority shareholder.
THE BOARD OF DIRECTORS
It is the hierarchically higher executive body of Esporão S.A. (Mother Company) who reports directly to the board of directors of JHR SGPS, through its subsi-diary Gesparte.
All the boards and managements of the subsidiaries report to this Board and are constituted, on this date, by the President of the board of directors and the executive directors of Esporão S.A.. There is still a General Meeting of Sharehol-ders (the highest body) which sets the overall company strategy, approves the action plans and elects the members of the board, and a Statutory Auditor that evaluates and certifies the accounts of the Group.
The Board of Directors acts for terms of three years, implementing a strategic plan that is presented to and ratified by JHR SGPS, consisting of:
CHAIRMAN OF THE BOARD – José Roquette. Leads the Board of Directors and reports to the Board of Directors of JHR SGPS, which he also presides
CEO – João Roquette. Responsible for general leadership and company’s stra-tegy, administrates the areas of production, processing, sales, marketing and distribution.
CFO – Diogo Corrêa Mendes. Responsible for leading the financial, administrative and human resources areas, information systems and continuous improvement.
NON-EXECUTIVE DIRECTOR – José Pedro Roquette. Accumulates the position of Purchasing Manager.
All directors are remunerated except for José Pedro Roquette that accumulates as Purchase Director, for which he is paid.
There is also a governing board that frequently reunites with executive directors and all directors, to monitor, discuss and decide on the company’s executive strategic issues, composed by:
CEO – João Roquette,CFO – Diogo Corrêa Mendes,Agricultural Director – Amândio Rodrigues,Commercial Director – Diogo Melo e Castro,Purchase Director – José Pedro Roquette,Oenology Director – David Baverstock,Financial Director – Manuel Cabaço,Maintenance Director – Miguel Jorge,Marketing Director – Filipe Caetano,Continuous Improvement and Information Systems Director – Sérgio Pereira,Production Director – Mauro Brandão.
Our activity does not present significant risks of conflicts of interest and is there-fore not implemented a formal mechanism for conflicts verification. The method of selection of these constituents is prerogative to JHR, SGPS and of the Chair-man of the Board. There are no restrictions of any kind, positive or negative, on gender, ethnicity or religion.
COMMUNICATION WITH STAKEHOLDERS
We use several instruments of communication with our stakeholders:
PERFORMANCE NOTEBOOK –Monthly made. Reports the main activity of each area as well as the economic and financial performance of the company. Made available in digital format to all employees and to the board of directors and published on the company’s intranet. It is presented to the Board of Directors of Esporão on a quarterly basis and every six months to the Board of JHR SGPS.
ESPORÃO NEWSPAPER - published twice a year, it provides information about the company’s activities and is available to clients and partners of the main ac-tivity of the company. It includes a message from the CEO and an interview with an employee and a partner.
E-LETTER – Electronic release only. Mainly oriented to clients but also with in-ternal distribution. During 2013, 19 press releases were published.
COMPANY’S WEBSITE – Internet website, renewed in 2013, where we gather institutional information on territory, property, production processes, products and wine tourism, addressed to all stakeholders.
SOCIAL MEDIA – In 2013 priority was given to social media as a way to shorten the distance between Esporão and people in general, with Facebook, Twitter and Vimeo, managing to generate more than 5,000 interactions.
INTRANET – Internal website for employees. It is a central tool of the entire company because it is in this platform that many of the processes, procedures and information can be found.
03. THE ESPORÃO GROUP
2013 REPORT 28 | 27
2 Whenever omitted, the figures presented in the report refer to companies within this report.
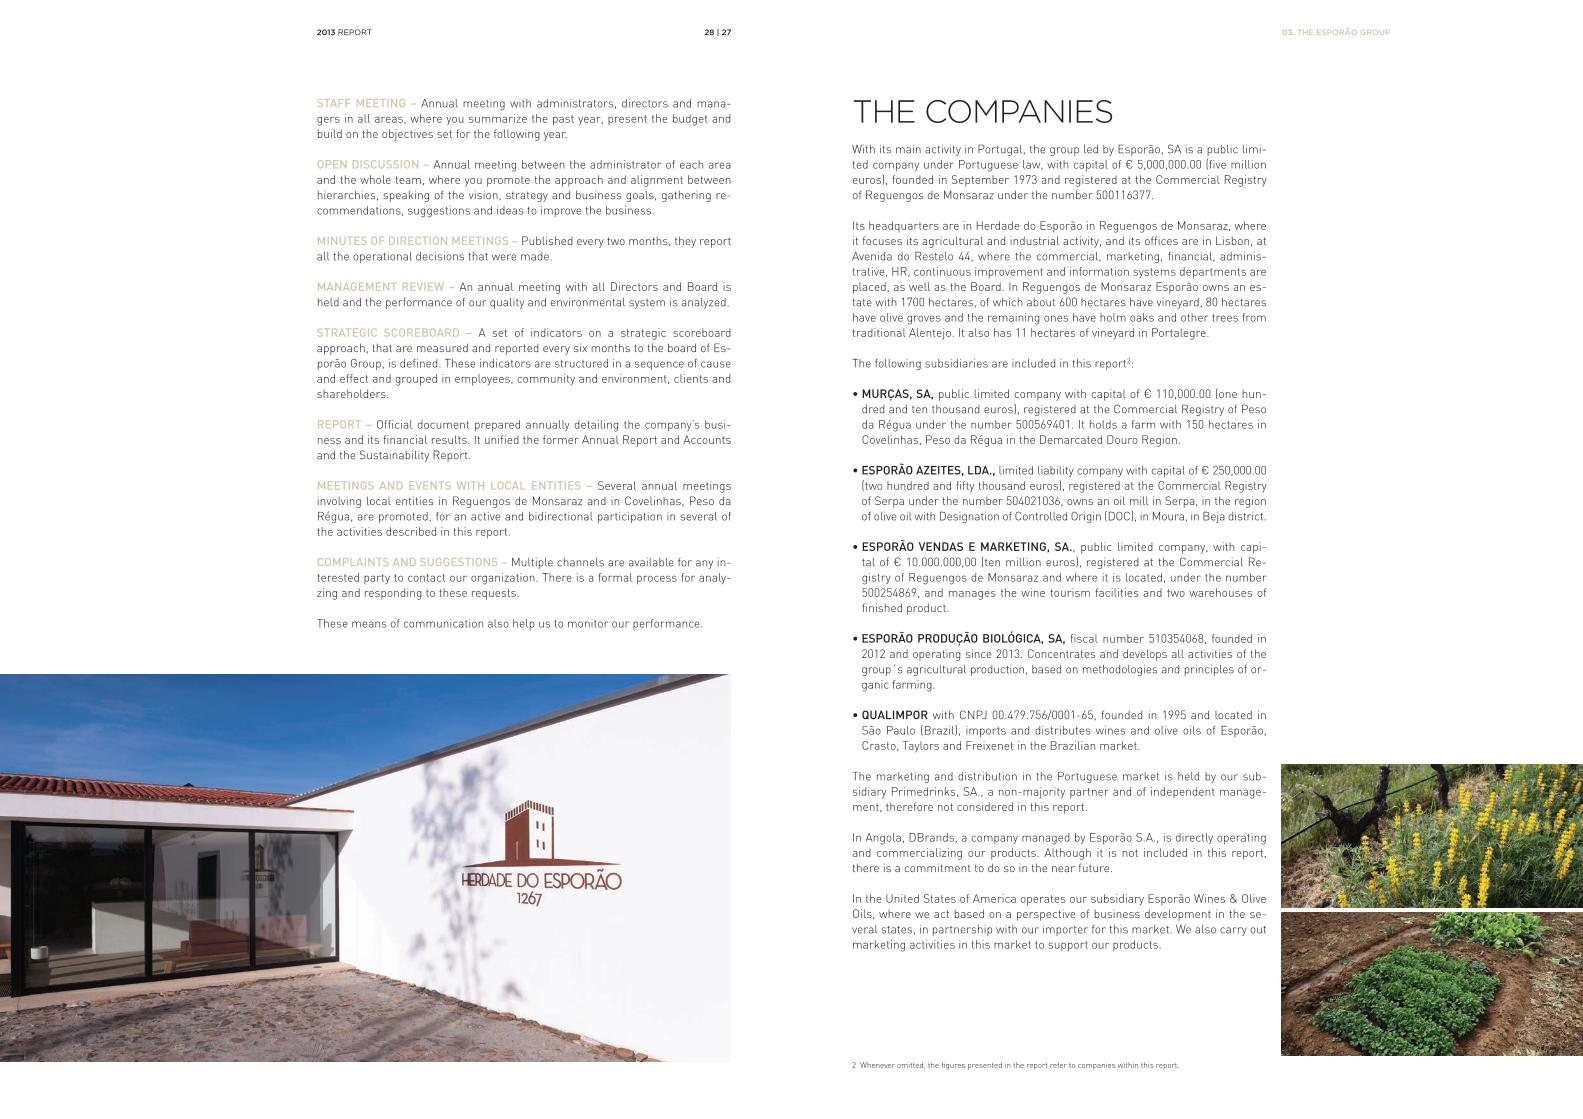
STAFF MEETING – Annual meeting with administrators, directors and mana-gers in all areas, where you summarize the past year, present the budget and build on the objectives set for the following year.
OPEN DISCUSSION – Annual meeting between the administrator of each area and the whole team, where you promote the approach and alignment between hierarchies, speaking of the vision, strategy and business goals, gathering re-commendations, suggestions and ideas to improve the business.
MINUTES OF DIRECTION MEETINGS – Published every two months, they report all the operational decisions that were made.
MANAGEMENT REVIEW – An annual meeting with all Directors and Board is held and the performance of our quality and environmental system is analyzed.
STRATEGIC SCOREBOARD – A set of indicators on a strategic scoreboard approach, that are measured and reported every six months to the board of Es-porão Group, is defined. These indicators are structured in a sequence of cause and effect and grouped in employees, community and environment, clients and shareholders.
REPORT – Official document prepared annually detailing the company’s busi-ness and its financial results. It unified the former Annual Report and Accounts and the Sustainability Report.
MEETINGS AND EVENTS WITH LOCAL ENTITIES – Several annual meetings involving local entities in Reguengos de Monsaraz and in Covelinhas, Peso da Régua, are promoted, for an active and bidirectional participation in several of the activities described in this report.
COMPLAINTS AND SUGGESTIONS – Multiple channels are available for any in-terested party to contact our organization. There is a formal process for analy-zing and responding to these requests.
These means of communication also help us to monitor our performance.
THE COMPANIESWith its main activity in Portugal, the group led by Esporão, SA is a public limi-ted company under Portuguese law, with capital of € 5,000,000.00 (five million euros), founded in September 1973 and registered at the Commercial Registry of Reguengos de Monsaraz under the number 500116377.
Its headquarters are in Herdade do Esporão in Reguengos de Monsaraz, where it focuses its agricultural and industrial activity, and its offices are in Lisbon, at Avenida do Restelo 44, where the commercial, marketing, financial, adminis-trative, HR, continuous improvement and information systems departments are placed, as well as the Board. In Reguengos de Monsaraz Esporão owns an es-tate with 1700 hectares, of which about 600 hectares have vineyard, 80 hectares have olive groves and the remaining ones have holm oaks and other trees from traditional Alentejo. It also has 11 hectares of vineyard in Portalegre.
The following subsidiaries are included in this report2:
• MURÇAS, SA, public limited company with capital of € 110,000.00 (one hun-dred and ten thousand euros), registered at the Commercial Registry of Peso da Régua under the number 500569401. It holds a farm with 150 hectares in Covelinhas, Peso da Régua in the Demarcated Douro Region.
• ESPORÃO AZEITES, LDA., limited liability company with capital of € 250,000.00 (two hundred and fifty thousand euros), registered at the Commercial Registry of Serpa under the number 504021036, owns an oil mill in Serpa, in the region of olive oil with Designation of Controlled Origin (DOC), in Moura, in Beja district.
• ESPORÃO VENDAS E MARKETING, SA., public limited company, with capi-tal of € 10.000.000,00 (ten million euros), registered at the Commercial Re-gistry of Reguengos de Monsaraz and where it is located, under the number 500254869, and manages the wine tourism facilities and two warehouses of finished product.
• ESPORÃO PRODUÇÃO BIOLÓGICA, SA, fiscal number 510354068, founded in 2012 and operating since 2013. Concentrates and develops all activities of the group´s agricultural production, based on methodologies and principles of or-ganic farming.
• QUALIMPOR with CNPJ 00.479.756/0001-65, founded in 1995 and located in São Paulo (Brazil), imports and distributes wines and olive oils of Esporão, Crasto, Taylors and Freixenet in the Brazilian market.
The marketing and distribution in the Portuguese market is held by our sub-sidiary Primedrinks, SA., a non-majority partner and of independent manage-ment, therefore not considered in this report.
In Angola, DBrands, a company managed by Esporão S.A., is directly operating and commercializing our products. Although it is not included in this report, there is a commitment to do so in the near future.
In the United States of America operates our subsidiary Esporão Wines & Olive Oils, where we act based on a perspective of business development in the se-veral states, in partnership with our importer for this market. We also carry out marketing activities in this market to support our products.
03. THE ESPORÃO GROUP

2013 REPORT
04RESULTS OF THE PERIOD

2013 REPORT 32 | 31 04. RESULTS OF THE PERIOD
GM
SM
2010
57,5%
34,2%
2011
58,6%
36,7%
2012
58,4%
36,3%
2013
58,8%
37,8%50,000
40,180
39,910
38,124
37,226
37,320
20,000
10,000
02009 2010 2011 2012
EXPORT
NATIONAL
2013
21,379
15,941
20,080
17,146
16,718
21,406
17,963
21,947
17,078
23,102
2012 2013
48,158
44,717
3,846
49,813
45,988
46,327
3,139
43,854
CURRENT ASSETS
OTHER NON-CURRENT ASSETS
BIOLOGICAL ASSETS
TANGIBLE ASSETS
Image 10 – Assets
3 Gross Value Added is the increase in the value of products and services made available in the markets, either as a result of the production
process, either as a result of commercial and administrative processes.
ECONOMIC RESULTSThe turnover grew by 8% in the four years from 2010 to 2013, reaching up a le-vel above the € 40 million euros in the year 2013. There is some stability in the markets, with an average growth of around 2.5% per year. This performance is achieved despite a reduction in the Portuguese market, more than compensa-ted by other markets. We would like to point out that in 2013 the growth in local currency in value sales was 4% higher than in euros given the unfavourable evolution of the exchange rate of the Brazilian real.
As a result of the activity developed and the means used in operations, Esporão found an operating profit of 8,495 million euros in 2013, an increase of 4.4% over the previous period.
Image 8 – Sales Evolution by market (in thousands of euros)
GVA3 is stable over the years.
Table 3 – Evolution of GVA (in thousands of euros)
Profitability indicators EBIT and EBITDA grew at a moderate pace, reflecting the increase in sales volume and sales margin, as well as the change in the mix of products and markets, despite the devaluation of the Brazilian currency. Without this impact, the growth would have been 4% in value.
Table 4 – Evolution of indicators (in thousands of euros)
“ The turnover grew by 8% in the four
years from 2010 to 2013, reaching up a level above the € 40 million euros in the year 2013.”
There is, in absolute terms, a reduction of about 60 thousand euros in personnel expenses as a result of stability of staff and of the impact of Brazilian real.
The item of supply and services presents a growth of approximately 1%, as a result of cost containment measures.
FINANCIAL RESULTS
ASSETS
The net assets of the Group decreased from 148 to 140 million euros, showing a structure of applications and funding relatively stable.
Image 9 – Gross Margin and selling
2010 2011 2012 2013
GVA 13,909 14,332 14,394 14,632
% 3% 0% 2%
INDICATOR 2010 2011 2012 2013
ECONOMIC DATA
Value Sales 37,226 38,630 39,910 40,179
Box unit Sales 1,241,217 1,279,722 1,292,308 1,266,990
EBITDA 8,069 7,742 8,139 8,495
Net income 2,456 1,677 1,359 2,718
Cash flow 5,677 5,495 6,619 6,534
FINANCIAL DATA
Total assets 136,849 140,046 148,691 140,235
Capital 5,000 5,000 5,000 5,000
Equity 53,275 57,885 60,731 72,765
Net Debt 32,647 37,119 40,774 39,018
Investment 3,386 4,322 2,576 920
ND/EV 0.61 0.64 0.67 0.54

2013 REPORT 34 | 33
2012 2013
EQUITY
BANK DEBT
SHAREHOLDERS
DEFERRED TAXES
OTHERS
10,71512,288
14,229
49,559
60,730
11,075
10,4021,805
44,188
72,765
Image 11 – Financial Resources
Table 5 - Investiments
FINANCIAL RESOURCESIncrease in the value of equity by approximately EUR 12 million as a result of rein-forcing the supplementary capital subscriptions account by EUR 10 million and of the profit for the year, which remains at the company as at December 31, 2013.
Also register for the reduction of the overall bank debt of the Group by EUR 5 million, largely the result of the reinforcement of equity as well as increased ef-ficiency in the management of current assets, especially customers and stocks.
INVESTMENTS
The total investment amounted to 920 thousand euros, by continuing several projects started in previous years, improving the cellars and mills of agricultural production, quality and service of wine tourism and biodiversity initiatives.
As part of the investments made in sustainability and biodiversity, we would like to highlight the installation of the solar park of the dam in order to reduce energy costs and reduce the environmental impact, as well as significant impro-vements in our WWTP in Esporão.
For agricultural production, various equipments were purchased. The main in-vestments in wine-cellars and mills were in the renewal of the barrels, in im-provements to the white wine-cellar, purchasing a new vat to the red wine-cellar and a panel of automating for the reception of grapes.
DISTRIBUTION OF RESULTSSHAREHOLDER
After two decades without distribution of profits to shareholders, we approved in the general meeting of March 31, 2014 the distribution of profits to Gesparte amounting to € 1,907,378.51.
EMPLOYEES
We have a remuneration model that connects the individual profile with the market value of the position, also ensuring internal fairness. This model predic-ts the growth and recognition in accordance with the development and acquisi-tion of new skills, the reward according to the fulfillment of goals and individual challenges in line with the organization’s strategy.
Most positions are evaluated annually on their skill level, on the nature of the position and on the results based on goals’ achievement.
This process is centered on the Performance Management System (SGD) to where the goals of each area and employee are loaded and managed. We make two assessments per year in each end of the semester.
“The overall bank debt of the Group
was reduced by EUR 5 million”.
INVESTIMENT 2011 2012 2013
Wine-cellars and mills 332,316 ¤ 344,744 ¤ 404,085 ¤ Sustainability and biodiversity 56,265 ¤ 60,665 ¤ 143,365 ¤ Agricultural Production 62,650 ¤ 69,650 ¤ 50,712 ¤ Wine Tourism 1,931,332 ¤ 1,973,849 ¤ 175,559 ¤ Filling 0 ¤ 7,895 ¤ 53,046 ¤
Other 115,766 ¤ 101,184 ¤ 92,878 ¤
TOTAL 2,498,329 ¤ 2,557,986 ¤ 919,644 ¤
04. RESULTS OF THE PERIOD

2013 REPORT
COUNTRY 2011 2012 2013
PORTUGAL7 1,597,649 ¤ 1,731,354 ¤ 2,076,870 ¤
Direct 1,184,761 ¤ 1,267,386 ¤ 1,587,966 ¤
Indirect 412,888 ¤ 463,968 ¤ 488,904 ¤
BRAZIL8 2,188,038 ¤ 3,153,080 ¤ 3,306,903 ¤
Direct 2,188,038 ¤ 3,153,080 ¤ 3,306,903 ¤
TOTAL 3,785,687 ¤ 4,884,434 ¤ 5,383,773 ¤
36 | 35
120
100
80
60
40
20
02011 2012 2013
5 The list of supported institutions attached to this report
6 Information on tax payments made in the United States and Angola is not included.
7 Direct taxes in Portugal include IRC, IMI, stamp duty, VAT, costs of the employer with Social Security. Indirect taxes include
fines, state fees (CVRA, IVV) and other indirect taxes.
8 Direct taxes in Brazil include paid values of ICMS, PIS, COFINS, import taxes, IRPJ, CSLL, taxation on salaries.
Image 12 – Average payment period to suppliers
Table 7 – Taxes paid in Portugal and Brazil6
Table 8 - Several awards and distinctions in 2013
Additionally, we annually make the 360º review that allows us to analyze the performance of each employee giving a comprehensive perspective of its skills and areas for improvement. Every 3 years we do a more thorough assessment on certain cultural aspects of the company.
The process of the board of directors’ assessment follows exactly the same me-thod of evaluation of the remaining bodies of the company. The goals of the exe-cutive directors are common amongst themselves, defined by a strategic map. Once a year, the Chairman of the Board meets with the directors to assess their performance.
SUPPLIERS
We have sustained our growth through a strong policy of internationalization, causing the export to international markets to generate over 60% of our sales. This evolution also turns out to reflect an increase in purchases made by group companies located outside Portugal, namely distributors of Brazil and Angola.
Table 6 – Local purchases to Suppliers by location4
4 These values do not include purchases between the group companies, except for purchases of Qualimpor (Brazil) to Esporão
Vendas e Marketing.
This commitment to internationalization allows Esporão Group to remain com-petitive and ready to respond to the current constraints of the Portuguese market, in particular the widespread reduction in domestic demand and its eco-nomy. However we are also exposed to less favorable payment terms. For this reason, we began to settle invoices from our suppliers by the end of the third month following the delivery (90 days after the invoice date).
Taking into consideration the current difficulties in accessing bank credit in Por-tugal and the financial difficulties that this measure may cause in our partners, we adopted a means of payment (Confirming) that allows our partners to mana-ge more conveniently and flexibly their cash flow, ensuring the minimization of the impact of this measure on our suppliers.
COMMUNITY
Several schools from Reguengos de Monsaraz visited Herdade do Esporão for in-formation and knowledge sessions concerning several topics: sustainability pro-jects, renewable energy, promotion of biodiversity, water saving, organic garden.
Partnerships with vocational schools of Alentejo were created, in order to re-ceive trainees in Oenology and Wine Tourism. The Laboratory team also made available part of its time to monitor small lab works of professional courses in oenology and viticulture.
A partnership with “Casa das Avós” (a Charity in Monsaraz), for exchange of services between wine tourism and this institution, was created. The Open Day of the Archaeological Complex of Perdigões, directed to the local community, was conducted.
We supported charitable private institutions completely free and without any material counterpart, except as foreseen in the law on support of social patro-nage. During the year 2013 the benefits granted amounted to € 36,000.00.5.
STATE
ACHIEVED ACKNOWLEDGEMENTS
It is with great satisfaction that every year we see our project recognized by national and international organizations, through awards and honours received by our wines and olive oils, Winemakers and wine tourism, but also for our sus-tainable farming practices:
MAGAZINE / ORGANIZATION AWARD OBSERVATIONS
Drinks Bussiness - Green awards Sustainability of the Year Award Best practices
Green Project Awards 1º Best practices
Green Project Awards Honorable mention Project to reduce water consumption and waste
Revista de Vinhos Enólogo do Ano David Baverstock
RevistaWine - oenologist of the year (David Baverstock)
1º
Best winetourism of the World - Daily Meal 13º
COMPANY HEADQUARTERS 2011 2012 2013
Portugal 28,642.145 ¤ 25,974,448 ¤ 24,318,270 ¤
Brazil 3,174,056 ¤ 4,887,704 ¤ 6,106,777 ¤
USA 255,878 ¤ 474,876 ¤ 490,092 ¤
Angola 1,512,472 ¤ 1,748,510 ¤ 4,164,388 ¤
TOTAL 33,584,551 ¤ 33,085,537 ¤ 35,079,528 ¤
04. RESULTS OF THE PERIOD

2013 REPORT
PRODUCT HARVEST MAGAZINE / ORGANIZATION AWARD OBSERVATIONS
Esporão Reserve 2012 Revista de Vinhos Best Buy
Vinha da Defesa 2012 Revista de Vinhos Best Buy
Assobio 2011 Revista de Vinhos Best Buy
Alicante Bouschet 2009 Revista de Vinhos Best in Portugal
Alandra 2012 Revista de Vinhos Best Buy
White Esporão Reserve 2011 Revista Wine - Sommeliers Brasil
38,4 points Higher classification in whites - in a maximum of 45 pts
White Esporão Reserve 2011 50 Best Portuguese wines - UK
Red Esporão Reserve 2010 50 Best Portuguese wines - UK
Assobio 2011 Revista de Vinhos 16 points Best buy
Verdelho 2011 Wine Enthusiast 90 points 86th place at top 100 best buy wines
Esporão Reserva Branco 2012 Confraria dos Enófilos Gold
Verdelho 2012 Confraria dos Enófilos Gold
White Esporão Reserve 2011 International Wine Challenge Gold Best white wine from Alentejo
White Esporão Reserve 2012 Vinhos de Portugal Bronze
Quinta dos Murças Reserve 2009 Vinhos de Portugal Bronze
4 Castas 2011 Vinhos de Portugal Bronze
Red Esporão Reserve 2010 Vinhos de Portugal Silver
4 Castas 2011 Concours Mondial Bruxelles Silver
White Esporão Reserve 2011 Concours Mondial Bruxelles Silver
White Monte Velho 2011 Revista de Vinhos 14,5 points
38 | 37
Table 9 – Wine awards and distinctions in 2013
Table 10 –Olive Oil awards and distinctions in 2013
ESPORÃO WON THE PRESTIGIOUS AWARD “SUSTAINABILITY OF THE YEAR AWARD” IN “THE DRINKS BUSINESS GREEN AWARDS 2013”
OLIVE OIL HARVEST MAGAZINE /ORGANIZATION AWARD
DOP MOURA 2012 LES OLIVALIES SILVER MEDAL
EXTRA VIRGIN 2012 LES OLIVALIES SILVER MEDAL
SELECÇÃO 2012 LES OLIVALIES SILVER MEDAL
SELECÇÃO 2012 SUPERIOR TASTE AWARD SILVER MEDAL
DOP MOURA 2012 MONTE SELECTION SILVER MEDAL
DOP MOURA 2012 INTERNATIONAL TASTE & QUALITY INSTITUTE SUPERIOR TASTE AWARD
SELECÇÃO 2012 INTERNATIONAL TASTE & QUALITY INSTITUTE SUPERIOR TASTE AWARD
SELECÇÃO 2012 LOS ANGELES INTERNATIONAL EXTRA VIRGEM OLIVE OIL COMPETITION BRONZE MEDAL
EXTRA VIRGIN 2012 LOS ANGELES INTERNATIONAL EXTRA VIRGEM OLIVE OIL COMPETITION BRONZE MEDAL
SELECÇÃO 2012 OLIVE OIL AWARD ZURICH AWARD
DOP MOURA 2012 OLIVE JAPAN SILVER MEDAL
EXTRA VIRGIN 2012 OLIVE JAPAN GOLD MEDAL
SELECÇÃO 2012 OLIVE JAPAN 2013 GOLD MEDAL
SELECÇÃO 2012 TERRA OLIVO 2012 SILVER MEDAL
04. RESULTS OF THE PERIOD

2013 REPORT
05PEOPLE

2013 REPORT 42 | 41
256
254
252
250
248
246
2442011 2012 2013
05. PEOPLE
Image 13 - Evolution of the number of employees
Image 14 – Distribution of the workforce by location and gender9
Table 11 – Distribution of the workforce by location and gender9
Table 12 – New entries and exits by gender in 20139
Table 13 – New entries and exits by location and age group in 20139
Table 14 – Distribution of employees by professional category and gender
9 There are no historical records of the number of employees in 2011 and 2012, or the number of entries and exits of employees
in those years. From 2013, these figures are to be maintained.
Esporão wants its employees to feel that they are one of the pillars of this pro-ject. The group is concerned to carry out their activities with respect and protec-tion of people, seeking integration into the team Esporão through dialogue and fulfillment of their rights.
This section presents the work practices of Esporão, aspects related to health and safety at work, evaluation and training, benefits and compensation, among others.
These figures include Qualimpor, except when mentioned its exclusion.
WORK PRACTICES
“ Esporão wants its employees to feel
that they are one of the pillars of this project.”
LOCATION 2013
PORTUGAL 240
Men 93
Women 147
BRAZIL 14
Men 8
Women 6
TOTAL 254
GENDER ENTRIES EXITS
Men 50 54% 46 49%
Women 24 16% 21 14%
TOTAL 74 29% 67 26%
AGE GROUP ENTRIES EXITS
PORTUGAL 74 31% 67 28%
<30 48 240% 42 210%
30-50 25 16% 19 12%
>50 1 1% 6 9%
BRAZIL 0 0% 0 0%
<30 0 0% 0 0%
30-50 0 0% 0 0%
>50 0 0% 0 0%
TOTAL 74 29% 67 26%
PROFESSIONAL CATEGORY 2013
SENIOR MANAGEMENT 11
Men 11
Women
MIDDLE MANAGEMENT 24
Men 13
Women 11
SUPERVISORS AND TEAM MANAGERS 9
Men 7
Women 2
HIGHLY QUALIFIED PROFESSIONALS
Men
Women
QUALIFIED PROFESSIONALS 48
Men 21
Women 27
SEMI-QUALIFIED PROFESSIONALS 131
Men 36
Women 95
UNQUALIFIED PROFESSIONALS 31
Men 13
Women 18
TOTAL 254
88
140
128
1 5
PERMANENT - MEN
PERMANENT - WOMEN
FIXED TERM - MEN
FIXED TERM - WOMEN
INDEFINITE DURATION - MEN
INDEFINITE DURATION - WOMEN
CONTRACTUAL BOND

2013 REPORT 44 | 43
Table 15 – Distribution of employees by gender and governance body
Table 16 – Distribution of employees by the governance body and age
MINORITIES AND DIVERSITY
We do not keep any record of our employees regarding their cultural, religious, racial or other origin that may be considered discriminatory. No decision or ac-tion taken by Esporão uses or is supported by this type of information.
GOVERNANCE BODY 2011 2012 2013 ADMINISTRATION 3 3 3
Men 3 3 3
Women 0 0 0
DIRECTION 9 9 9
Men 9 9 9
Women 0 0 0
MANAGEMENT 24 24 24
Men 14 14 14
Women 10 10 10
SUPERVISION 6 6 6
Men 5 5 5
Women 1 1 1
TOTAL 42 42 42
GOVERNANCE BODY 2011 2012 2013 ADMINISTRATION 3 3 3
<30
30-50 2 2 2
>50 1 1 1
DIRECTION 9 9 9
<30
30-50 6 6 6
>50 3 3 3
MANAGEMENT 24 24 24
<30
30-50 20 20 21
>50 4 4 3
SUPERVISION 6 6 6
<30 2 2 0
30-50 2 2 4
>50 2 2 2
TOTAL 42 42 42
RIGHTS AND GUARANTEES
According to Portuguese legislation all employees are covered by collective bar-gaining agreements, either through membership of the company either through ordinances.
The hiring of permanent employees is carried out by using the support of lo-cal institutions, the Institute of Employment and the Office of Professional Inte-gration of the Municipality of Reguengos. The demand for professionals always starts in coordination with these local entities. Only after this is the search ex-tended at a national level.
Hiring temporarily or seasonally is mostly made using individuals from the local community, with the exception of national and international trainees that we receive annually at harvest time, given the universality of academic institutions involved.
The vast majority of management positions are occupied by employees who joined the organization still very young, many of them as interns. At that time local supply of qualified professionals was very scarce. Currently 16% of the managers are from the local community in the operating units of Esporão and Quinta dos Murças. However, many of these managers have integrated into local communities and are now part of these.
All deadlines for legal notification to employees of any change in their condition of employment are respected, as defined in the collective bargaining agreement. There is no known case of discrimination across Esporão group. All maternity leaves are fulfilled in accordance with the law and there is no negative correla-tion between enjoying these licenses and the rate of employee retention.
There is no obstacle of any kind to freedom of association of our employees to their employer or others.
There is not and it is not authorized or legal any kind of child labour, slave or forced labour in any of the locations in which we operate.
Given the activity of Esporão, there is no need for training our employees on issues related to human rights.
There is no training on policies or practices of corruption. Esporão is not aware of any cases of active or passive corruption involving their employees.In Portugal there are no indigenous people. Therefore no such incidents are registered.
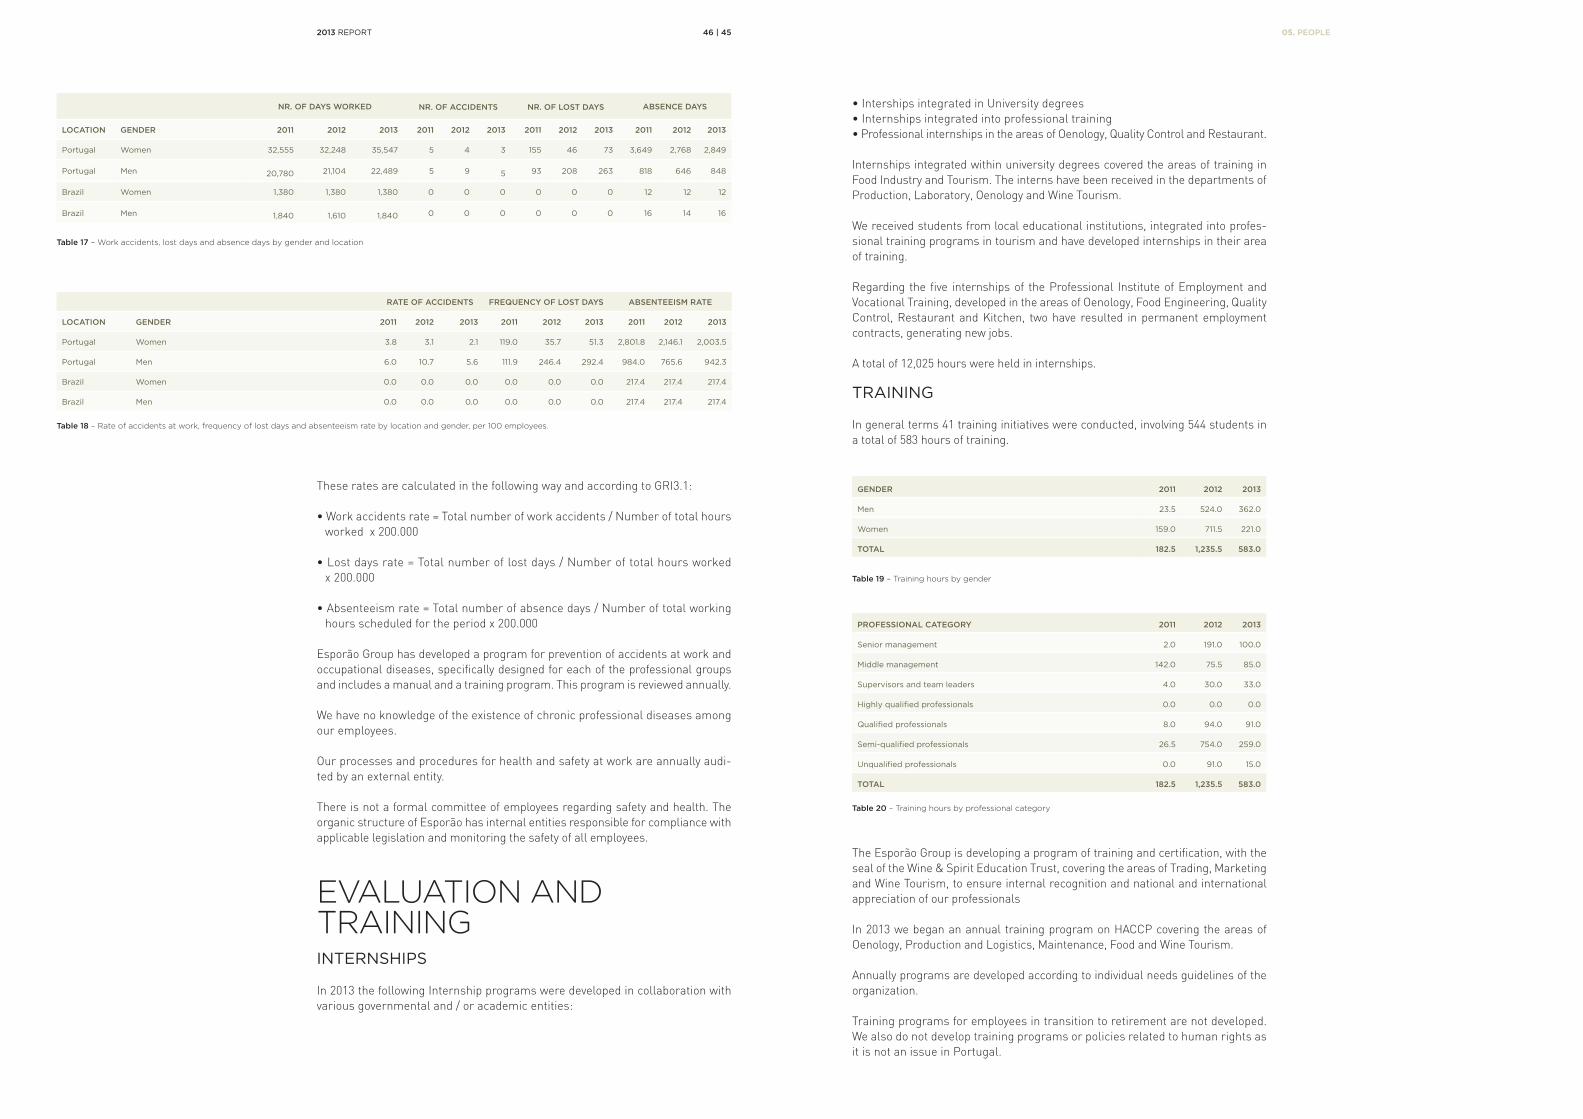
HEALTH AND SAFETY AT WORKWORK ACCIDENTS
The table below quantifies the accidents observed during the reported period, per company. Lost days are working days. There were no occupational diseases or deaths resulting from our activity.
05. PEOPLE
2013 REPORT
RATE OF ACCIDENTS FREQUENCY OF LOST DAYS ABSENTEEISM RATE
LOCATION GENDER 2011 2012 2013 2011 2012 2013 2011 2012 2013
Portugal Women 3.8 3.1 2.1 119.0 35.7 51.3 2,801.8 2,146.1 2,003.5
Portugal Men 6.0 10.7 5.6 111.9 246.4 292.4 984.0 765.6 942.3
Brazil Women 0.0 0.0 0.0 0.0 0.0 0.0 217.4 217.4 217.4
Brazil Men 0.0 0.0 0.0 0.0 0.0 0.0 217.4 217.4 217.4
46 | 45
Table 17 – Work accidents, lost days and absence days by gender and location
Table 18 – Rate of accidents at work, frequency of lost days and absenteeism rate by location and gender, per 100 employees.
Table 19 – Training hours by gender
Table 20 – Training hours by professional category
These rates are calculated in the following way and according to GRI3.1:
• Work accidents rate = Total number of work accidents / Number of total hours worked x 200.000
• Lost days rate = Total number of lost days / Number of total hours worked x 200.000
• Absenteeism rate = Total number of absence days / Number of total working hours scheduled for the period x 200.000
Esporão Group has developed a program for prevention of accidents at work and occupational diseases, specifically designed for each of the professional groups and includes a manual and a training program. This program is reviewed annually.
We have no knowledge of the existence of chronic professional diseases among our employees.
Our processes and procedures for health and safety at work are annually audi-ted by an external entity.
There is not a formal committee of employees regarding safety and health. The organic structure of Esporão has internal entities responsible for compliance with applicable legislation and monitoring the safety of all employees.
EVALUATION AND TRAININGINTERNSHIPS
In 2013 the following Internship programs were developed in collaboration with various governmental and / or academic entities:
• Interships integrated in University degrees• Internships integrated into professional training• Professional internships in the areas of Oenology, Quality Control and Restaurant.
Internships integrated within university degrees covered the areas of training in Food Industry and Tourism. The interns have been received in the departments of Production, Laboratory, Oenology and Wine Tourism.
We received students from local educational institutions, integrated into profes-sional training programs in tourism and have developed internships in their area of training.
Regarding the five internships of the Professional Institute of Employment and Vocational Training, developed in the areas of Oenology, Food Engineering, Quality Control, Restaurant and Kitchen, two have resulted in permanent employment contracts, generating new jobs.
A total of 12,025 hours were held in internships.
TRAINING
In general terms 41 training initiatives were conducted, involving 544 students in a total of 583 hours of training.
The Esporão Group is developing a program of training and certification, with the seal of the Wine & Spirit Education Trust, covering the areas of Trading, Marketing and Wine Tourism, to ensure internal recognition and national and international appreciation of our professionals
In 2013 we began an annual training program on HACCP covering the areas of Oenology, Production and Logistics, Maintenance, Food and Wine Tourism.
Annually programs are developed according to individual needs guidelines of the organization.
Training programs for employees in transition to retirement are not developed. We also do not develop training programs or policies related to human rights as it is not an issue in Portugal.
NR. OF DAYS WORKED NR. OF ACCIDENTS NR. OF LOST DAYS ABSENCE DAYS
LOCATION GENDER 2011 2012 2013 2011 2012 2013 2011 2012 2013 2011 2012 2013
Portugal Women 32,555 32,248 35,547 5 4 3 155 46 73 3,649 2,768 2,849
Portugal Men 20,780 21,104 22,489 5 9 5 93 208 263 818 646 848
Brazil Women 1,380 1,380 1,380 0 0 0 0 0 0 12 12 12
Brazil Men 1,840 1,610 1,840 0 0 0 0 0 0 16 14 16
GENDER 2011 2012 2013
Men 23.5 524.0 362.0
Women 159.0 711.5 221.0
TOTAL 182.5 1,235.5 583.0
PROFESSIONAL CATEGORY 2011 2012 2013
Senior management 2.0 191.0 100.0
Middle management 142.0 75.5 85.0
Supervisors and team leaders 4.0 30.0 33.0
Highly qualified professionals 0.0 0.0 0.0
Qualified professionals 8.0 94.0 91.0
Semi-qualified professionals 26.5 754.0 259.0
Unqualified professionals 0.0 91.0 15.0
TOTAL 182.5 1,235.5 583.0
05. PEOPLE

2013 REPORT 48 | 47
Table 21 – Wage ratio of women vs. men by professional category (in Portugal)
PERFORMANCE EVALUATION
Performance reviews are conducted every six months for management posi-tions and annually for the remaining ones. The system is implemented since 2007, and has since been expanded and improved in contents and format. All employees are covered by this process, and there is no distinction by gender.
All reviews are permanently available for consultation by the covered employees, digitally and online. The reviews include all employees except those involved in the activities of the vineyard.
Employees of the vine are subject to weekly performance analysis based on a set of productivity indicators related to the activities in the vineyard. This analysis is shared and discussed with the whole team and plans for improvement are outli-ned whenever necessary and applicable.
BENEFITS AND WAGESWAGE RATIOS
Internal and external equity is the goal of our policy of human resource mana-gement, combined with a constant concern for the working conditions of our employees.
The following facts are observed in Esporão:
• There is no employee with wages below the Portuguese minimum wage, ac-cording to the legislation in force.
• The lowest salary earned in the administrative position is 30% higher than the minimum wage.
• The food allowance is 41% higher than the minimum required by law for the sector.
PROFESSIONAL CATEGORY 2011 2012 2013
Senior management - - -
Middle management 1,15 1,03 0,92
Supervisors and team leaders 1,14 1,14 1,11
Highly qualified professionals - - -
Qualified professionals 0,92 1,03 0,96
Semi-qualified professionals 0,82 0,87 0,79
Unqualified professionals 1,01 1,09 0,90
“Internal and external equity is
the goal of our policy of human resource management, combined with a constant concern for the working conditions of our employees.”
BENEFITS ATTRIBUTED TO EMPLOYEES AND TEMPORARY WORKERS
Temporary and seasonal workers enjoy most of the benefits and working condi-tions granted to full-time employees, that include transportation, food allowan-ce, medical services at work and safety training in the workplace. The major distinction is made in terms of job promotion, which is not accessible when the duration of the contracts is short.
The Esporão Group grants tolerance for missing work in some days that are not national holidays, such as Carnival Day and December 24th.
To each of the permanent employees, on their birthday, the board offers a box of wine and congratulations.
Public transport is available to the employees of the vineyard, the winery, pro-duction and logistics in Herdade do Esporão.
There are several cafeterias available for employees, located next to the various workplaces.
The canteen of wine tourism started to produce, every day, about 100 takeaway meals for employees of the agricultural area.
An event celebrating Children’s Day is usually held and employees and their respective families participate. This event is also used to promote a culture of sustainability among employees.
05. PEOPLE

2013 REPORT
06OUR SUPPLIERS

2013 REPORT 52 | 51 06. OUR SUPPLIERS
100%
80%
60%
40%
20%
0%
PORTUGAL
LOCAL COUNTRY
OTHER REGIONS
2011
10%
90%
2012
8%
92%
2013
7%
93%
2011
68%
32%
2012
73%
27%
2013
75%
25%
2011
58%
42%
2012
37%
63%
2013
6%
94%
2011
2%
98%
2012
26%
74%
2013
5%
95%
BRAZIL USA ANGOLA
100%
80%
60%
40%
20%
0%
USA
BRAZIL
2011 2012 2013
PORTUGAL
ANGOLA
LOCAL PURCHASES BY LOCATION
PURCHASES IN THE HOST COUNTRY
Table 22 – Distribution of purchases by the supplier’s region10
Esporão Group defines the term “local” at two levels. The first is the country in which each company operates. The second level applies to companies based in Portugal and reports to the municipality in which has its headquarters and all adjacent municipalities.
Image 15 - Distribution of purchasing by the supplier’s country of origin10
10 These values do not include purchases between the group companies, except for purchases of Qualimpor (Brazil) to Esporão
Vendas e Marketing. The values of 2011 and 2012 were revised based on this assumption.
Image 16 - Distribution of purchases from local suppliers 10
In addition to proximity criteria, the Esporão Group implements a policy of re-quirements to suppliers that depends on the type of services or raw materials that they provide:
• Olive and grape suppliers should provide only raw materials from the region in which the buying company operates. Additionally, there are food safety requi-rements and environmental conditions that are required to these suppliers, in order to provide Esporão. There is a manual available to these suppliers that details all selection requirements and the method of evaluation.
• Wine suppliers are also specifically evaluated by Esporão, based on very specific controls for each delivery such as contaminants, pesticides, origin, among others.
• There is also a specific manual for our components suppliers that, in addition to identifying and detailing the form of evaluation and selection of these provi-ders, indicates a preference or need for food and environmental certifications. In 2013 the Department of Purchasing and the Department of Continuous Im-provement and Information Systems started audits to monitor components’ suppliers. This allowed closer and more cooperative relationships with the su-ppliers and also to monitor their production processes.
• Suppliers of food products to the wine tourism are also subject to specific selection and evaluation.
• All remaining suppliers are evaluated globally as to its quality by those respon-sible for buying their products.
We highlight and give preference to all suppliers that demonstrate sustaina-bility concerns, whether through environmental certification and others or as demonstrated by concrete practices. We also act proactively with our suppliers to adopt practices in line with our policies, such as organic farming.
We do not conduct any analysis or evaluation of our suppliers in terms of hu-man rights, since given the countries in which our suppliers operate, the risk of infringement of those rights is practically null. For the same reason, we do not formalize with our suppliers contracts containing specific clauses on human rights safeguard. Our manuals of suppliers of grapes, olives and related compo-nents refer as required conduct, and in a generic way, a set of rights that should be granted to employees of those organizations.
COMPANYPORTUGAL EUROPE NORTH AMERICA SOUTH AMERICA ASIA AFRICA
2011 2012 2013 2011 2012 2013 2011 2012 2013 2011 2012 2013 2011 2012 2013 2011 2012 2013
Esporão, SA 94% 96% 97% 6% 4% 3% 0% 0% 0% 0% 0%
Esporão Vendas e Marketing, SA
81% 82% 73% 1% 2% 6% 6% 8% 12% 3% 4% 6% 0% 0% 0% 8% 4% 3%
Esporão Azeites, SA 80% 95% 99% 20% 5% 1%
Murças, SA 99% 96% 96% 1% 3% 2%
Esporão Produção Biológica 100% 100%
DBrands 2% 26% 5% 98% 74% 95%
ESPWINE 57% 34% 4% 1% 2% 3% 42% 63% 94%
Qualimpor 68% 63% 60% 0% 10% 15% 0% 0% 0% 32% 27% 25% 0% 0%
TOTAL 84% 83% 78% 5% 4% 4% 2% 3% 3% 4% 5% 5% 0% 0% 0% 6% 5% 10%
2013 REPORT
07RESOURCE USE

2013 REPORT 56 | 55 07. RESOURCE USE
Table 23 - Financial support by program
Table 24 – Direct energy consumption by type,in GJ11
Table 25 – Indirect energy consumption (GJ)
Table 26 - Water consumption in cubic meters
FINANCIAL SUPPORT FROM THE STATEDuring 2013 a set of incentives to its activity were assigned to Esporão Group:
• VITIS – Support system for the conversion, replant or vineyards relocation and other improvements to the vineyard;
• IEFP – incentive to job creation;
• RPU – support scheme for farmers;
• PRODER – rural development program;
• OCM - Promotion on third-country markets;
• QREN – National Strategic Reference Framework;
• Others – agricultural subsidies in the use of some products.
VITIS, PRODER and QREN are oriented to the creation of long term assets and require an investment effort, using our own resources.
ENERGYDIRECT ENERGY CONSUMPTION
INDIRECT ENERGY CONSUMPTION
11 The direct energy consumption and the emission of greenhouse gases exclude the values of Qualimpor, whose carbon footprint
is not yet being measured.
12 In 2011 an error was detected in the measurement equipment which invalidated the data. For the calculation we assumed the
value of 2012 and according to the technical team of Esporão this value is close to reality.
13 The water distribution company EPAL presented wrong measurement numbers, once it used a method of estimating con-
sumption. Upon request by Esporão it began performing direct measurements and corrected this effect, resulting in lower
consumption in 2012.
14 By sold liter we consider the total volume of net sales of wine and olive oil in the reported period.
An energy audit was taken in Esporão, which resulted in a Plan of Energy Ratio-nalization for the effective reduction of energy consumption within eight years, focusing mainly on the following points: • Installation of a consumption monitoring system
• Improving the efficiency of some lighting systems
• Installation of a compressor management system for production of compres-sed air
• Repair of compressed air leaks in the distribution network Implementing these actions, as well as becoming ISO 50001 certified, scheduled for 2016, will enable, after eight years, an overall reduction in energy consump-tion of about 20%.
WATER
PROGRAM 2011 2012 2013
OCM 91,350 ¤ 612,406 ¤ 817,083 ¤
VITIS 183,017 ¤ 199,663 ¤ 236,802 ¤
OTHERS 20,002 ¤
RPU 19,156 ¤
PRODER 216,923 ¤ 257,871 ¤ 17,305 ¤
IEFP 16,086 ¤
TOTAL 491,290 ¤ 1,069,940 ¤ 1,126,434 ¤
FUEL LOCATION 2011 2012 2013
Road diesel Herdade do Esporão 2,532 3,093 3,540
Agricultural diesel Herdade do Esporão 3,681 4,018 2,984
Gas Herdade do Esporão 226 172 388
Road diesel Quinta dos Murças 258 165 258
Agricultural diesel Quinta dos Murças 142 132 130
Gas Quinta dos Murças 57 54 54
Road diesel Serpa 716 0 233
Gas Serpa 1 1 1
Olive pit Serpa 247 227 442
Gas Lisboa 1,236 618 2
LOCATION 2011 2012 2013
Herdade do Esporão 8,502 8,746 11,056
Lisboa 230 192 190
Murças 390 420 777
Serpa 547 392 524
TOTAL 9,669 9,751 12,546
LOCATION ORIGIN USE 2011 2012 2013
Herdade do Esporão Groundwater Wine-cellar, Filling, Wine Tourism, Offices
20,320 19,318 16,772
Herdade do Esporão Alqueva dam Agricultural irrigation 367,50012 367,500 457,052
Serpa Groundwater Mill, Filling, Offices 1,046 4,471 2,343
Murças Douro river Agricultural irrigation 3,151 1,426 1,150
ResteloEPAL Municipal
DistributionOffices 84813 298 442
Brazil SABESP Distribution Offices 192 99 142
TOTAL 393,057 393,112 477,901
LITROS POR LITRO VENDIDO14 34.13 33.80 41.86

2013 REPORT 58 | 57 06. OS NOSSOS FORNECEDORES
We conducted the following actions to reduce water consumption:
• Optimizing the time it takes to introduce the water to lubricate the carpets of bottling lines;
• Development and construction of a device to account for the consumption of water in rinsing the vats in wine cellars;
• Optimizing the washing processes of the wine cellar equipments;
• Acquisition of soil water and plants monitoring equipment that enables us to have greater control over crop needs, allowing a more careful application of irrigation water according to production goals.
• Use of a recirculator/refrigerator for cooling the columns of condensation on the laboratory of Herdade do Esporão, thus reusing of water without consu-ming it.
• Training and awareness activities of the harvest temporary teams for reduc-tion of water consumption.
• Placement of water meters for measuring, parameterization and adjustment of water consumption in the Wine Tourism building.
• Transformation of the equipment to wash harvest boxes in Murças;
• Creating a recirculation system in Murças, with programmed discharge of waste water.
Indirectly the water that is used in the production process and then sent to the WWTP’s installed in various locations of the Group, with effluent to be treated, is reused, representing approximately 10% of reusing.
No studies have been conducted to measure the impact of these consumptions since in Quinta dos Murças the water used is taken from the Douro River, being its volume insignificant compared to the flow of the River and therefore we do not expect any impacts. The large volume of water consumption comes from the Al-queva dam, representing 95,6% of the total consumption in 2013 by Esporão. This consumption is regulated by EDIA15 and its sustainability is globally managed, in the region of Herdade do Esporão, by the Portuguese State through this entitie.
15 EDIA – Companhia de Desenvolvimento e Infraestruturas do Alqueva, S.A, publicly owned and whose mission is to manage
water resources in the region where Herdade do Esporão is located. It published a sustainability report for 2009-2011, which
can be consulted at www.edia.pt.
2013 REPORT
08WASTE, EMISSIONS AND OTHER IMPACTS

2013 REPORT
EMISSIONS 2011 2012 2013 VAR. 2011 2012 2013 VAR. 2011 2012 2013
Packaging 17,080 16,754 14,451 -10.1% 13,427 13,226 11,764 -11.1% 1,119 1,102 980
Purchased raw materials 2,997 4,062 3,746 -1.4% 2,356 3,207 3,049 -4.9% 196 267 254
Eletricity 951 959 1,234 1.2% 747 757 1,004 32.7% 62 63 84
Fossil fuels 366 403 358 -0.2% 288 318 292 -8.4% 24 27 24
Waste 161 385 395 0.0% 127 304 322 6.0% 11 25 27
Stationary Combustion 84 72 114 0.2% 66 57 93 63.9% 5 5 8
Secondary Materials 52 54 54 0.0% 41 42 44 3.0% 3 4 4
Hired Equipment 11 11 9 0.0% 9 9 8 -15.5% 1 1 1
Emissions from leakage - - - 0.0% - - - 0.0% - - -
TOTAL 21,702 22,700 20,361 -10.3% 17,061 17,919 16,575 -7.5% 1,422 1,493 1,381
62 | 61 08. WASTE, EMISSIONS AND OTHER IMPACTS
16 To calculate the value in 2013, we considered 5% loss and that the remaining volume of water is treated at the WWTP
and discharged in the dam of Herdade do Esporão.
17 No discharges were performed in Murças in 2011.
Table 27 - Discharges of treated wastewater in WWTPs in cubic meters
Table 28 - CO2 equivalent emissions by type in tons8
Table 29 - CO2 equivalent emissions in tons by scope
WASTEWATER All wastewater generated by our activity is subject to recovery.
LOCATION DESTINATION 2011 2012 2013
Herdade do Esporão
Discharge in Barranco (Lagoon) 9,003 8,351 15,93316
Murças Discharge in Douro River 017 124 788
Composyte analyses of the quality of the water in all its WWTP are performed monthly, ensuring that it is within the legal and elegible parameters, so that these discharges have no impact on the environment.
In the case of Herdade do Esporão and after treatment, the effluent is sent to the existing dam on the property for storage. Later it will allow the irrigation of the vines on the estate and will maintain a minimum flow rate for that habitat.
Additionally, discharges are performed in the urban system of sewage from the office areas in Lisbon and São Paulo, treated by the municipalities of Lisbon and São Paulo, and for which we have no measurements. The water that exists in pits in various locations and in the evaporation lagoon from the mill of Serpa is managed as waste and subject to proper treatment.
GREENHOUSE GASESWe are measuring our emissions of greenhouse gases since 2011, and this work is carried out internally by a team of Esporão Group, without external certifica-tion. No methodological change of this measurement was made, thus keeping the methodology described in the Esporão 2011/2012 sustainability report.
The stationary combustion increased due to the use of a boiler for heating the pavilion where the filling of olive oil takes place and due to the increased use of gas appliances in the building of Wine Tourism, originated by the largest number of visitors and meals served.
Electricity consumption in Herdade do Esporão increased, due to higher con-sumption in the wine cellars, cooling pumps, WWTP, filling line and wine tou-rism. In Quinta dos Murças electricity consumption also increased due to the working of a chiller for heating and cooling the wine cellar. To better understand this phenomenon we will install additional electricity meters in these buildings.The reduction in Scope 3 is the result of the actions of environmental optimi-zation performed in packaging, with a greater impact on glass by reducing the weights of the bottles. This reduction had other effects such as lowering CO2 emissions in which, for example, the use of lighter bottles to Monte Velho and Alandra has allowed to reduce the size of cardboard boxes and to add a pallet by truck.
The reduction of emissions related to our purchase of grapes, olives and wine come from a better agricultural year in 2013 compared to 2012 by an improve-ment in agricultural practices and climatic factors.
The growth seen in emissions from waste derives from an increase of glass breaks, resulting of the implemented quality control processes, particularly the opening of bottles coming from complaints or products of old crops.
The emissions from leakage are measured by recording the quantities of refills during maintenance of all equipments with gas. We maintain an inventory of all equipment with a risk of leakage of greenhouse gases and/or destroyers of the ozone layer. In the measured periods no equipment showed values of refills.
Emissions of NOx and SOx originate from biological processes of the vineyard and/or of fermentation, which are considered naturally balanced in accordance with “International Wine Carbon Calculator Protocol 1.2”.
By the very nature of the activity performed, we do not produce significant har-mful emissions. All sources of gaseous emissions are inventoried, comply with legal requirements and analyses are carried out in accordance with European legislation, not having up to date failed to fulfill any controlled parameter.
TONS CO2 EQ G/ 9L CASES G/BOTTLE(0,75L)
CO2 EQ PER SALES
TONS CO2 EQ
EMISSIONS 2011 2012 2013
Scope 1 – Direct 450 475 473
Fossil fuels 366 403 358
Stationary Combustion 84 72 114
Emissions from leakage 0 0 0
Scope 2 - Electricity 951 959 1234
Electricity 951 959 1234
Scope 3 - Indirect 20,302 21,266 18,655
Packaging 17,080 16,754 14,451
Purchased raw materials 2,997 4,062 3,746
Waste 161 385 395
Secondary materials 52 54 54
Hired equipment 11 11 9
GRAND TOTAL 21,702 22,700 20,361

2013 REPORT
LOCATION 2011 2012 2013
Herdade 138,348 210,470 216,749
Serpa 2,640 4,616 115,962
Murças 1,950 2,032 27
TOTAL 142,938 217,118 332,738
64 | 63
18 The increase presented in 2013 refers to muds of Serpa, produced over several years and that were delivered for treatment
in 2013.
19 Color glass bottles, the color being called “Antique”.
20 Corks obtained from by-products of the cork industry.
Table 30 - CO2 equivalent emissions tons per location for all scopes
Table 31 - Destination of waste generated by location in Kg
Table 32 - Destination of waste generated by type in Kg
Table 33 - Weight of the components received by Production (kg) and corresponding % of recycled material.
08. WASTE, EMISSIONS AND OTHER IMPACTS
WASTE GENERATEDWe follow a policy of waste management, based on the national waste mana-gement system in Portugal, that implements all the guidelines of the European Union. Waste is thus delivered to third parties licensed to treat, transport and further process each type of waste. Internally, we proceed to a rigorous sepa-ration and classification of the various types of waste, recording all quantity produced, to which entities were delivered for treatment and their respective operating licenses.
LOCATION 2011 2012 2013
Herdade do Esporão 19,814 20,598 18,234 90%
Serpa 1,725 1,920 1,955 10%
Murças 130 163 153 1%
Lisboa 23 19 19 0%
TOTAL 21,691 22,700 20,361 100%
In 2013 we completed a survey of all waste produced. The waste was grouped by category associated with their respective weightings.
As a result of this work, training and awareness activities of employees were implemented, for the careful separation of all packaging waste, optimization of the volume of packaging and separation of acids and bases, based on the analy-ses performed in laboratory. Actions of awareness were also carried out to su-ppliers to reduce packaging components, and in particular to the wine tourism suppliers to reuse cartons and plastic.
We do not produce, transport, import or export any waste deemed hazardous under the Basel Convention.
WASTE IN KG DESTINATON 2011 2012 2013 Mud Landfill 56,180 43,994 162,34218
Glass Recycling 18,400 48,940 73,030
Cardboard Recycling 47,422 75,142 59,573
Plastic Recycling 19,172 13,194 11,224
Sewage cleaning Recycling 0 2,500 8,680
Olive oil vegetal waste Landfill 0 0 4,980
Metal Recycling 800 6,580 3,996
Oils Refinement 534 1,869 2,520
Contaminated sands Landfill 0 509 2,336
Wood waste Recycling 0 0 1,840
Plastic waste Landfill 0 17,560 1,760
Cooking oils Valorization 172 93 291
Solvent waste Recycling 65 65 125
Oil waste Recycling 0 0 27
Contaminated Packaging Waste Landfill 0 790 14
Contaminated Packaging Waste Recycling 0 82 0
Used tyres waste Landfill 0 2,200 0
Laboratory Chemicals Elimination 193 0 0
Wood Recycling 0 2,770 0
Oil filter Recycling 0 110 0
Construction and Demolition waste Landfill 0 720 0
TOTAL 142,938 217,118 332,738
COMPONENTS 2011 2012 2013 % RECYCLED MAT.
Antique19glass bottles 6,403,838 6,552,994 5,406,278 70% a 80%
White glass bottles 279,329 61,643 67,716 15%
Natural corks 28,130 8,557 5,289 0%
Micro Particles corks20 24,372 51,882 53,907 100%
Cardboard boxes 654,926 538,583 586,550 88%

2013 REPORT 66 | 65
21 Sociedade Ponto Verde, at http://www.pontoverde.pt/1_2_como_funciona.php
Table 34 - Cost of recycling packaging of our product in Portugal
Table 35- Production modes by location
22 These 5 ha were in process of Organic Production certification.23 Coverage of the vine rows avoiding herbicide use and introducing organic matter in soil.
08. WASTE, EMISSIONS AND OTHER IMPACTS
CLOSER TO NATUREhttp://goo.gl/tMtfxZ
Regarding bottling we continue to study the weights that accompany the various line products in order to meet a pattern that allows their reduction.
There was not any kind of significant spill, planned or accidental. No transport activity of our raw materials, components, products and employees managed by us, had any impact beyond the associated emissions or waste already reported.We maintain an updated analysis of environmental impacts and risks of all acti-vity, with reference to ISO14001 requirement 4.3.1..
The recycling of products sold in Portugal is managed through the Green Dot 21 system, where we assume the role of Packaging Company. As such, we do not directly recover packaging waste or other potential waste derived from their pro-ducts and pay this company a value proportional to these potentials, according to the table below:
HABITATS AND BIODIVERSITYIn 2007 we joined the initiative “Business & Biodiversity” and “Countdown 2010”, committing to a strategy of preservation and promotion of biodiversity in Herda-de do Esporão.
Our agricultural lands are not situated in nature reserves or areas of special protection. There were no identified species at risk of extinction that might be affected by our activities in the areas where we operate.
AGRICULTURAL PRACTICES
The agricultural year was characterized by a wet spring followed by a dry summer with high daytime temperatures, enabling consistent and optimum grape matura-tion. It was a year of high production without the impact of fungal diseases.
The year 2013 was the culmination of a process of conversion of integrated pro-duction to organic production. The first grapes certified in organic production mode were produced in Herdade do Esporão and used in the production of Vinha da Defesa.
YEAR GREEN DOT COST IN THE PORTUGUESE MARKET
2011 117,258.52 ¤
2012 82,840.67 ¤
2013 83,888.00 ¤
VINEYARD OLIVE GROVE
LOCATIONINTEGRATED
PRODUCTIONORGANIC
PRODUCTIONINTEGRATED
PRODUCTIONORGANIC
PRODUCTION
Alentejo 533 77 0 80
Douro 43 522 0 15
TOTAL 576 82 0 95
We are evaluating the possibility of adding 70 ha of Herdade do Esporão to or-ganic production.
All our grape suppliers were certified this year in integrated production.
We avoided mobilization to the detriment of spontaneous cover crops, seeded to protect the soil from erosion, improve fertility and water holding capacity and encourage spontaneous vegetation, which is a fundamental host for auxiliary fauna, predatory of the vineyard’s plagues.
An oat seed was made between the rows of a vineyard plot as a way of testing the possibility of mulching23 using the oat straw that would come from its cut.
We eliminated the use of herbicides in Herdade do Esporão and resort now to mechanical control of spontaneous vegetation on the rows of our cultures. We increased consumption of organic products over synthetic products even in plots that are not officially in organic mode of production.
Using our products (olive pomace, olive leaves, stems, wine grapes and products resulting from pruning), we composted about 200 tons of compost that was used to fertilize the olive grove.
A new area of preparing pesticides for phytosanitary treatments and rinsing sprayers and other application materials was built, with treatment of the resul-ting wastewater.
We kept the trial for wines produced in integrated production and in organic production, aiming to test biologically and organoleptically the quality of wines.
We replaced the use of synthetic fungicides and insecticides for products allowed in organic farming.

2013 REPORT 68 | 67
Table 36 - Annual evolution of weed control by type
Table 37 - Biodiversity of Herdade do Esporão (2008)
08. WASTE, EMISSIONS AND OTHER IMPACTS
LIVING TERRITORYhttp://goo.gl/cbAWuk
The beginning of the olive campaign was characterized by warm temperatures and high relative humidity prone to diseases, making the selection of fruits and a quick harvest an operation of utmost importance to obtain high quality olive oil. It was a year of great production but low income, with very aggressive olive oils in the mouth and very little intense on the nose. For the first time we separated the olives coming from Herdade do Esporão, organically produced, obtaining high quality olive oil that has been certified for European and Brazilian market, the latter with its own specifications and very demanding.
PROTECTION AND HABITAT CREATION
In 2008 the fauna and flora species of Herdade do Esporão were identified. Some of these numbers are far from reality, given the difficult observation:
2008 2009 2010 2011 2012 2013
VAR.HERBICIDES AREA
(HA)QUANT.(KG E L)
AREA (HA)
QUANT.(KG E
L)
AREA (HA)
QUANT.(KG E L)
AREA (HA)
QUANT.(KG E L)
AREA (HA)
QUANT.(KG E L)
AREA (HA)
QUANT.(KG E
L)
Residual 200 1001 82 408 0 0 0 0 0 0 0 0 -
Systemic 100 500 245 1,222 352 1,759 290 1,452 105 168 104.7 167.5 0%
Contact 0 0 0 0 0 0 50 248 16 26 48 78 200%
FUNGICIDES AREA (HA)
QUANT.(KG E L)
AREA (HA)
QUANT. (KG E
L)
AREA (HA)
QUANT. (KG E L)
AREA (HA)
QUANT. (KG E L)
AREA (HA)
QUANT. (KG E L)
AREA (HA)
QUANT. (KG E
L)
Systemic 3,262 5582 2,463 4,644 2,815 5,383 2,237 2,620 2,978 3,281 3,069 2,921 -11%
Organic far-ming
362 127 352 1,759 0 0 397 1,242 1,003 3,965 1,457 7,368 86%
BIODIVERSITY NR. OF SPECIES
FLORA 107
FAUNA Butterflies, moths 146 (some rare)
Damselflies, dragonflies 10
Amphibians 9
Reptiles 10
Birds 101
Mammals 19
The high diversity of species found shows the importance of the estate in promo-ting and sustaining the biodiversity of the region.
In the 20 shelter boxes installed in 2012 with the aim of promoting the fixation of bats (excellent vine auxiliaries), we now have about 92 bats, almost all of the type Pipistrellus spp.
CLIMATE CHANGE We are continuously evaluating all environmental aspects and its implications for the future of our business. The Esporão group includes in its strategy several sustainability axes of which result concrete actions of analysis, monitoring and intervention at the level of climate change.
One of the main risks identified is the desertification of Alentejo region and the increased thermal amplitude variation that our vineyards and olive groves are subject to. If something happens without a proper management of the Esporão Group, it can even lead to the end of our activity.
As a strategy to mitigate potential risks associated with climate change, we pro-ceeded to create an ampelographic field24 of various grape varieties, performing tests and analyses of their behavior in the face of climate change. (an ampe-lographic field is a sample of several grape varieties in the same space, with the specific objective of studying and draw scientific conclusions that serve our business and viticulture in general) This information will enable us to choose the varieties more in line with the climatic changes that may occur, and, for us, one of the main applications of defense of biodiversity.
Climate change in the production region of Alentejo also presents high risks of variation in the availability of water resources, essential for irrigation of our crops. Due to that risk we proceeded to building a dam inside Esporão with water retention capacity capable of meeting irrigation needs for two years of extreme drought.
“ We created an ampelographic
field of various grape varieties, performing tests and analyses to their behavior under climate changes.”
24 An ampelographic field is a sample of several grape varieties in the same vineyard area, with the specific objective of studying and draw scientific conclusions that are relevant to our business and viticulture in general.

2013 REPORT 70 | 69
Table 38 - Investments to mitigate or eliminate environmental impacts
08. WASTE, EMISSIONS AND OTHER IMPACTS
The diversification of our viticulture in areas of different climatic parameters is in progress and compares the evolution of these productions with the production in Reguengos. The recent acquisition of a vineyard in Portalegre, located further north and at a higher altitude than our current vineyards in Alentejo, is already a measure resulting from this policy.As energy generation is one of the main originators of climate change, it is na-tural that its use and rationalization will be targeted in a near future to exten-sive regulation. Our energy needs are particularly striking in pumping water for irrigation, in the various agricultural activities and activities of filling. Therefore we have planned and it is in execution a vast program of energy efficiency and phased replacement of non-renewable energy by renewable.
There are still risks associated with our carbon emissions and to possible future costs that may be created, such as fees and charges for emissions. The current policy also aims to reduce the potential risk of margin reduction, or even unvia-ble business, faced with these potential future costs.
For Esporão Group, mitigation and response to various environmental and cli-matic risks is a key component of differentiation and competition, in which not only our customers can distinguish our products by our responsible practice, but also we ensure future ability to maintain our business and react quickly and meet regulatory changes that force organizations to act responsibly.
MITIGATING THE IMPACTS OF OUR PRODUCTS AND SERVICES
We carried out the following initiatives aimed at reducing the impact directly associated to our products and services:
• We reduced the amount of glass used in Alandra and Monte Velho bottles and the size of cardboard boxes of these products.
• We converted 22% of the area of agricultural production to organic production and maintained the remaining area in integrated production mode. For the first time we produced organic wine.
• We changed the spools of labels of non-recyclable waxed paper to recyclable plastic.
• We reduced the ink used in printing the shipping boxes of products and elimi-nated the use of varnish.
• We reduced in 50% the use of stretch film for wrapping pallets of finished pro-duct by using pre-stretched film.
• We changed the capsules of our wines, reducing the amount of tin to 1%.
• We started returning to our capsule, labels, back labels’ suppliers the “waste” of these items for subsequent re-use.
• We reuse old cardboard and wood boxes for sales of the wine tourism service and also for internal transportation
• We use rechargeable batteries in all equipment for wine tourism.
• We recycle used cooking oil, transforming it into blue and white soap for in-ternal use.
• We sensitize our team of collaborators to sharing transportation to work or to using bicycles.
• We planted an organic garden to supply the restaurant and the staff cafeteria.
• We use water provided by the bore hole of the estate in reusable packaging for the wine tourism customer consumption.
ENVIRONMENTAL MITIGATION INVESTMENTS
ENVIRONMENTAL EXPENSES 2011 2012 2013 TOTAL
Waste treatment 3,300 ¤ 2,700 ¤ 2,565 ¤ 8,565 ¤
Analytical Water Control 4,500 ¤ 4,100 ¤ 5,425 ¤ 14,025 ¤
Optimization of Water Resources 25,900 ¤ 3,150 ¤ 29,050 ¤
Ampelographic Field (200 endemic varieties) 15,000 ¤ 7,500 ¤ 22,500 ¤
WWTP in Murças 52,600 ¤ 3,144 ¤ 55,744 ¤
WWTP in Herdade do Esporão 21,500 ¤ 95,430 ¤ 116,930 ¤
Landscaping in Murças 35,100 ¤ 21,120 ¤ 44,620 ¤ 100,840 ¤
Landscaping in Herdade do Esporão 51,640 ¤ 25,400 ¤ 61,168 ¤ 138,208 ¤
Improvement in water line in Murças 38,396 ¤ 38,396 ¤
Energy Efficiency 2,630 ¤ 28,990 ¤ 31,620 ¤
Sustainable equipment for the Vineyard 3,700 ¤ 5,440 ¤ 9,140 ¤
Equipament to monitor soil water 22,560 ¤ 22,560 ¤
TOTAL 202,547 ¤ 114,550 ¤ 272,492 ¤ 589,589 ¤

2013 REPORT
09COMMITMENTS AND OBLIGATIONS

2013 REPORT 74 | 73 06. OS NOSSOS FORNECEDORES
GENERAL STATEMENTSEsporão states:
• Not having conducted direct contacts or pressures to any governmental entity. All actions related to our economic sector, either by sharing information or by stimulating institutional dialogue with the government and other institutions operating in the economic, financial and social policy areas, are carried out by the various organizations representing our industry, namely:
• Viniportugal - Interprofessional Association of Wine Sector.• ACIBEV - Association of Traders and industrials of Spirits and Wines• ALABE - Association of Oenology Laboratory.• BCSD - Business Council for Sustainable Development.• House of Olive Oil Portugal.• CEPAAL – Center of Study and Promotion of Alentejo Olive Oil• CVRA – Comissão Vitivinícola Regional Alentejana.
• Not having performed risk assessments of corruption in the locations where Esporão operates.
• Not having developed, promoted or sponsored any activity or political entity, internal or external.
• Not being subjected to any kind of legal action due to unfair competition, mo-nopolistic practice or other related.
• Not having been subject to sanctions and / or fines for non-compliance with environmental laws and regulations.
• Not having been subject to sanctions and / or fines for non-compliance with laws and regulations relating to our products.
• Not considering necessary to conduct a formal review in our locations on hu-man rights. In Portugal there are guarantees, both legislative, judicial and social, to ensure the observance of human rights in our locations.
• Not having received any complaint from any part on the violation of human rights in the course of our business.
• Not having done any relocation of our activity, or created new locations, so there was no need for studies of the impact of these actions on local commu-nities, and thus no such damage exists.

2013 REPORT 76 | 75 09. COMMITMENTS AND OBLIGATIONS
25 Traders Association of Spirits and Wines
CONTROL OF THE LIFE CYCLE OF OUR PRODUCTSThe life cycle of the products of Esporão Group takes into account all legal con-siderations in the various markets in which it operates and strictly complies all safety provisions. Special attention is given to all labels, back labels and dif-ferent shipping boxes, so that they contain all the indications and inscriptions relating to the various markets in which it operates. It is reviewed annually for each crop.
During production, both in the vineyard as in the winery and in filling, several control procedures are established that ensure compliance with the criteria of food and environmental security. Analyses are performed for contaminants and pesticides, evidence of dangerous or prohibited substances, elimination of risks resulting from glass breakage or other bodies, following the methodology of HAC-CP. Records with full traceability are kept, including the components supplied by external entities and their respective food certificates whenever applicable.
Corks are tested for their mechanical properties to ensure a correct and easy extraction at the time of use.
All components are marked with symbols indicating the type of separation and recycling to be done.
The logistical requirements are also analysed, with special attention to the correct packing and preparation of cargo for transport. The pallets are reused throughout the transport chain, the strapping tapes that we use on pallets are of the lowest possible weight and the number of turns of each pallet is studied and controlled to achieve a balance between the necessary security packing, using the minimum amount of materials. The ratio between the gross weight of the various logistical transport units and the net weight of the final product is also controlled, in order to reduce the environmental impact of the distribution of our products throughout the supply chain.
During the reporting period no incidents related to our products and referring to legal requirements, that have resulted in significant environmental impacts or any incident of food-nature in every market that we operate, were recorded.
COMMUNICATION AND ETHICAL PROMOTIONOur communications obey the laws and principles of responsible communica-tion in the different countries where we operate, either directly (affiliated dis-tributors) or indirectly in partnership with local partners for distribution of our products . We did not perform any activity in markets where products with al-cohol are prohibited.
Our marketing activities are decided together with distributors that measure and decide, together with us, what can and must be done in accordance with the laws of each market.
All our internal and external communications are based on our ethical princi-ples of objectivity and respect for the integrity of our communication, without leading to deception those who may be impacted by it, contributing to responsi-ble consumption.
As an active member of the program ”Wine in moderation”, we defend and pro-mote that being the wine an alcoholic beverage should be enjoyed in mode-ration, and that its excessive consumption can be detrimental to health and a balanced life.
We have been actively involved in initiatives that contribute to ethical and res-ponsible communication, being a member of APAN (Portuguese Association of Advertisers) and having been part of the advisory group for self-regulation and responsible communication promoted by ACIBEV25.
Esporão Group had no reported incidents related to marketing communications for the period in question, either in Portugal or in other countries, and there is no record of any incident in the past. Similarly, there was no claim related to breach of privacy or personal information of our clients’ data records.

2013 REPORT
10STATEMENTS TO THE REPORT

2013 REPORT 80 | 79 10. STATEMENTS TO THE REPORT
STRUCTURE AND SCOPE OF THE REPORT
The report of Esporão Group becomes only one, comprising Sustainability and financial reporting.
In the perspective of sustainability Esporão prepared this report according to strict criteria and standards, and to this end adopted the Sustainability Repor-ting Guidelines 3.1 as a guide to developing the perspective of sustainability and stating level A.
The table of contents for the various requirements of the GRI Reporting Guideli-nes 3.1 is presented in the attachments to this report.
After analyzing the period 2013, every year we will publish a new report for each subsequent period. Any questions about this report may be addressed by email to [email protected] or by mail to the following address:
EsporãoAv. do Restelo 441400-315 Lisboa Portugal
The content was defined using the principles outlined by the GRI Reporting Fra-mework 3.1 and targeting all stakeholders in our business. Its structure is the-refore well oriented for each of these parts and the information was grouped according to their particular interests. To prepare this report, we did not formally consult our stakeholders.
We decided not to include the full information concerning our businesses Qua-limpor, DBrands and Esporão Wines & Olive Oils. However, whenever possib-le, information regarding these companies is given, although these cases have to be explicitly identified. We assume the future commitment to include these companies comprehensively in the report.
The reported data were collected directly from official and commercial docu-ments, from the records generated directly from our quality and environment management system, by other documents generated internally or by third par-ties for related activities. Whenever it was necessary to convert data or calcu-lations on existing data, coefficients, formulas and/or methodologies, generally accepted and recognized entities were used.
APPLICATION OF THE PRECAUTIONARY PRINCIPLEAccording to the formulation of the precautionary principle written in the 15th paragraph of the Conference on Environment and Development in Rio de Janeiro in 1992, our activities and our products do not ignore or embody significant environmental risks and refuse to use the impossibility of demonstration of impact as justification.
We ensure the scrupulous and verified compliance of all European and Portuguese legislation applicable to our activities, with special focus on the environment and public health, with legislation in line with the precautionary principle. For this purpose we have implemented and documented management tools with this explicit resolution.
We also keep a risk assessment of environmental impacts of all our activities, including a mitigation plan based on actual measurements of relevant environmental parameters. Any action or new product that Esporão Group decides to launch is evaluated in accordance with this methodology.

82 | 001. DECLARAÇÃO DO PRESIDENTEDO CONSELHO DE ADMINISTRAÇÃO2013 REPORT
11ANNEXES

2013 REPORT
EVALUATION CRITERIA
ESPORÃO EVALUATION IMPORTANCE TO THE BUSINESS
Not
Applicable
Bad Good Very GoodNot
Applicable
Critical Very critical
Nr. of answers
% Bad
Nr. of answers
%
GoodNr. of
answers% Very Good
Nr. of answers
%
CriticalNr. of
answers% Very critical
Customer Service 4 57% 3 43% 1 14% 6 86%
Order
management 3 43% 4 57% 2 29% 5 71%
Available
range of
products 1 17% 5 83% 1 17% 5 83%
Technical
and logistics data sheets 1 14% 2 29% 4 57% 2 33% 4 67%
Delivery
Deadlines 3 43% 4 57% 1 14% 6 86%
Promotional Materials 2 2 40% 3 60% 2 1 20% 4 80%
Complaints 3 3 75% 1 25% 2 3 75% 1 25%
Certification 1 14% 6 86% 1 2 40% 3 60%
84 | 83
Table 39 – Client satisfaction
RESULTS OF THE CUSTOMER SATISFACTION SURVEY CHARITIES
A.P.A.D. (ASSOC.PORT.DE APOIO AOS DESPROTEGIDOS)ACREDITAR - ASSOC.DE PAIS E AMIGOS DE CRIANÇAS COM CANCROAGBV - ASSOCIAÇÃO GESTOS DE BOA VONTADEAJUDA DE BERÇOAJUDA E COLOALDEIAS DE CRIANÇAS SOS PORTUGALAMIAPADP-ASS. DE PAIS E AMIGOS DE DEFICIENTES PROFUNDOSAPATI - ASSOC.PROMOTORA DE APOIO À TERCEIRA IDADEAPCE - ASSOC.DE PARALISIA CEREBRAL DE ÉVORAAPEDV - ASSOC.PROM.DE EMPREGO DE DEFICIENTES VISUAISAPPDH - ASSOC. PORT. DE PAIS E DOENTES COM HEMOGLOBINOPATIASASSOCIAÇÃO C.A.O.S.ASSOCIAÇÃO DIAS RENOVADOSASSOCIAÇÃO ESTRELA GUIA IPSSASSOCIAÇÃO NACIONAL DE COMBATE À POBREZAASSOCIAÇÃO PÃO E PAZASSOCIAÇÃO VIAGEM DE VOLTAATT-ASSOC.PARA O TRATAMENTO DAS TOXICODEPENDÊNCIASBANCO ALIMENTAR CONTRA A FOME/LISBOABIPP - BANCO DE INFORMAÇÃO DE PAIS PARA PAISBOMBEIROS VOLUNTÁRIOS DE REGUENGOS DE MONSARAZBUS - BENS DE UTILIDADE SOCIALCASA DE SANTO ANTÓNIO - PROTECÇÃO E AMPAROCENTRO COMUNITÁRIO DE CAMPINHOCENTRO PAROQUIAL DE ASSIST. DA FREGUESIA DE SANTA MARIA DE BELÉMCENTRO SOCIAL DA MUSGUEIRACENTRO SOCIAL PAROQUIAL DE LAMASCOMUNIDADE VIDA E PAZ (OS SEM ABRIGO)CORPO NACIONAL DE ESCUTAS (REGUENGOS DE MONSARAZ)ESCOLA SECUNDÁRIA ANDRÉ DE GOUVEIA (ESAG)FÁBRICA DA IGREJA PAROQUIAL DOS SANTOS REIS MAGOSFUNDAÇÃO D.BOSCO - PROJECTO VIDAFUNDAÇÃO ERNESTO ROMA (ASSOC.DIABÉTICOS)IRMÃS SERVIDORAS DE JESUS DO COTTOLENGO DO PADRE ALEGRELAR DE S.MARTINHO (ÀS CRIANÇAS DO PADRE SERRA)LAR DE SANTA HELENALIGA NACIONAL CONTRA A FOMELIGA PORTUGUESA CONTRA O CANCRO/NÚCLEO REGIONAL DO SULMÃO AMIGA - ASSOC. NACIONAL DE SOLIDARIEDADE SOCIAL - A.M.A.MISSIONÁRIOS COMBONIANOSREMARRENASCER - LIGA NACIONAL CRIANÇA ESPERANÇARESIDÊNCIA DE VELHINHOS DAS IRMÃZINHAS DOS POBRESSOCIALKIDS - ASSOCIAÇÃO DE APOIO SOCIAL, APSSUM OMBRO AMIGOPASTORAL DE REGUENGOS
11. ANNEXES

2013 REPORT 86 | 85
GRI INDEX
STRATEGY AND ANALYSIS
1.1 Statement from the Chairman of the Board 7
1.2 Description of key impacts, risks, and opportunities 7
ORGANIZATIONAL PROFILE
2.1 Name of the organization 27
2.2 Primary brands, products, and/or services 18
2.3 Operational structure of the organization, including main divisions, operating companies, subsidiaries, and joint ventures. 27
2.4 Location of organization’s headquarters 27
2.5Number of countries where the organization operates, and names of countries with either major operations or that are specifically relevant to the sustainability issues covered in the report
27
2.6 Nature of ownership and legal form 27
2.7 Markets served (including geographic breakdown, sectors served, and types of customers/beneficiaries). 14
2.8 Scale of the reporting organization 25
2.9 Significant changes during the reporting period regarding size, structure, or ownership 27, 78
2.10 Awards received in the reporting period 35
REPORT PARAMETERS
3.1 Reporting period for information provided. 78
3.2 Date of most recent previous report 78
3.3 Reporting cycle 78
3.4 Contact point for questions regarding the report or its contents. 78
3.5 Process for defining report content 78
3.6 Boundary of the report 78
3.7 State any specific limitations on the scope or boundary of the report. 78
3.8Basis for reporting on joint ventures, subsidiaries, leased facilities, outsourced operations, and other entities that can significantly affect compa-rability from period to period and/or between organizations
27
3.9Data measurement techniques and the bases of calculations, including assumptions and techniques underlying estimations applied to the com-pilation of the Indicators and other information in the report.
78
3.10 Explanation of the effect of any re-statements of information provided in earlier reports, and the reasons for such re-statement 78
3.11 Significant changes from previous reporting periods in the scope, boundary, or measurement methods applied in the report. 27, 78
3.12 GRI Content Index 84
3.13 External assurance 78
4: GOVERNANCE, COMMITMENTS, AND ENGAGEMENT
4.1Governance structure of the organization, including committees under the highest governance body responsible for specific tasks, such as setting strategy or organizational oversight.
23
4.2 Role of the Chairman 23
4.3 Number and gender of members of the highest governance body that are independent and/or non-executive members.. 24
4.4 Mechanisms for shareholders and employees to provide recommendations or direction to the highest governance body. 24
4.5Linkage between compensation for members of the highest governance body, senior managers, and executives (including departure arrange-ments), and the organization’s performance (including social and environmental performance).
46
4.6 Processes in place for the highest governance body to ensure conflicts of interest are avoided 24
4.7Process for determining the composition, qualifications, and expertise of the members of the highest governance body and its committees, including any consideration of gender and other indicators of diversity.
24
4.8Internally developed statements of mission or values, codes of conduct, and principles relevant to economic, environmental, and social perfor-mance and the status of their implementation
14
4.9Procedures of the highest governance body for overseeing the organization’s identification and management of economic, environmental, and social performance, including relevant risks and opportunities, and adherence or compliance with internationally agreed standards, codes of conduct, and principles.
24
4.10Processes for evaluating the highest governance body’s own performance, particularly with respect to economic, environmental, and social performance
46
COMMITMENTS TO EXTERNAL INITIATIVES
4.11 Explanation of whether and how the precautionary approach or principle is addressed by the organization. 78
4.12Externally developed economic, environmental, and social charters, principles, or other initiatives to which the organization subscribes or endorses.
75, 72
4.13 Memberships in associations (such as industry associations) and/or national/international 72
STAKEHOLDER ENGAGEMENT
4.14 List of stakeholder groups engaged by the organization. 10
4.15 Basis for identification and selection of stakeholders with whom to engage 10
4.16 Approaches to stakeholder engagement, including frequency of engagement by type and by stakeholder group 10, 25
4.17Key topics and concerns that have been raised through stakeholder engagement, and how the organization has responded to those key topics and concerns, including through its reporting.
10
MANAGEMENT APPROACH AND PERFORMANCE INDICATORS
ASPECT: ECONOMIC PERFORMANCE
EC1 Direct economic value generated and distributed 30
EC2 Financial implications and other risks and opportunities for the organization’s activities due to climate change 67
EC3 Coverage of the organization’s defined benefit plan obligations. 46
EC4 Significant financial assistance received from government. 54
ASPECT: MARKET PRESENCE
EC5 Range of ratios of standard entry level wage by gender compared to local minimum wage at significant locations of operation. 46
EC6 Policy, practices, and proportion of spending on locally-based suppliers at significant locations of operation. 48
EC7 Procedures for local hiring and proportion of senior management hired from the local community at locations of significant operation. 43
ASPECT: INDIRECT ECONOMIC IMPACTS
EC8Development and impact of infrastructure investments and services provided primarily for public benefit through commercial, inkind, or pro bono engagement.
34
EC9 Understanding and describing significant indirect economic impacts, including the extent of impacts. 34
LABOR PRACTICES AND DECENT WORK
ASPECT: EMPLOYMENT
LA1 Total workforce by employment type, employment contract, and region, broken down by gender 38
LA2 Total number and rate of new employee hires and employee turnover by age group, gender, and region. 38
LA3 Benefits provided to full-time employees that are not provided to temporary or part-time employees, by significant locations of operation. 46
ASPECT: LABOR/MANAGEMENT RELATIONS
LA4 Percentage of employees covered by collective bargaining agreements. 43
LA5 Minimum notice period(s) regarding operational changes, including whether it is specified in collective agreements. 43
ASPECT: OCCUPATIONAL HEALTH AND SAFETY
LA6Percentage of total workforce represented in formal joint management–worker health and safety committees that help monitor and advise on occupational health and safety programs.
43
LA7 Rates of injury, occupational diseases, lost days, and absenteeism, and number of workrelated fatalities by region and by gender. 43
LA8Education, training, counseling, prevention, and risk-control programs in place to assist workforce members, their families, or community mem-bers regarding serious diseases.
44
LA9 Health and safety topics covered in formal agreements with trade unions 43
ASPECT: TRAINING AND EDUCATION
LA10 Average hours of training per year per employee by gender, and by employee category 44
LA11Programs for skills management and lifelong learning that support the continued employability of employees and assist them in managing career endings.
44
LA12 Percentage of employees receiving regular performance and career development reviews, by gender. 46
ASPECT: DIVERSITY AND EQUAL OPPORTUNITY
LA13Composition of governance bodies and breakdown of employees per employee category according to gender, age group, minority group mem-bership, and other indicators of diversity
43
LA14 Ratio of basic salary and remuneration of women to men by employee category, by significant locations of operation 46
LA15 Return to work and retention rates after parental leave, by gender. 43
SOCIAL PERFORMANCE INDICATORS
HUMAN RIGHTS
ASPECT: INVESTMENT AND PROCUREMENT PRACTICES
HR1Percentage and total number of significant investment agreements and contracts that include clauses incorporating human rights concerns, or that have undergone human rights screening.
72
HR2 Percentage of significant suppliers, contractors and other business partners that have undergone human rights screening, and actions taken. 72
HR3Total hours of employee training on policies and procedures concerning aspects of human rights that are relevant to operations, including the percentage of employees trained.
44, 72
ASPECT: NON-DISCRIMINATION
HR4 Total number of incidents of discrimination and corrective actions taken 72
11. ANNEXES

2013 REPORT 88 | 87
ASPECT: FREEDOM OF ASSOCIATION AND COLLECTIVE BARGAINING
HR5Operations and significant suppliers identified in which the right to exercise freedom of association and collective bargaining may be violated or at significant risk, and actions taken to support these rights.
43
ASPECT: CHILD LABOR
HR6Operations and significant suppliers identified as having significant risk for incidents of child labor, and measures taken to contribute to the effective abolition of child labor. 43
ASPECT: FORCED AND COMPULSORY LABOR
HR7Operations and significant suppliers identified as having significant risk for incidents of forced or compulsory labor, and measures to contribute to the elimination of all forms of forced or compulsory labor. 43
ASPECT: SECURITY PRACTICES
HR8Percentage of security personnel trained in the organization’s policies or procedures concerning aspects of human rights that are relevant to operations.
44
ASPECT INDIGENOUS RIGHTS
HR9 Total number of incidents of violations involving rights of indigenous people and actions taken. 43
HR10 Percentage and total number of operations that have been subject to human rights reviews and/or impact assessments. 72 HR11 Number of grievances related to human rights filed, addressed and resolved through formal grievance mechanisms. 72
SOCIAL PERFORMANCE INDICATORS
SOCIETY
ASPECT: COMMUNITY
SO1 Percentage of operations with implemented local community engagement, impact assessments, and development programs. 72, 35
ASPECT: CORRUPTION
SO2 Percentage and total number of business units analyzed for risks related to corruption 72 SO3 Percentage of employees trained in organization’s anti-corruption policies and procedures. 43 SO4 Actions taken in response to incidents of corruption 43
ASPECT: PUBLIC POLICY
SO5 Public policy positions and participation in public policy development and lobbying 72 SO6 Total value of financial and in-kind contributions to political parties, politicians, and related institutions by country 72
ASPECT: ANTI-COMPETITIVE BEHAVIOR
SO7 Total number of legal actions for anticompetitive behavior, anti-trust, and monopoly practices and their outcomes 72 ASPECT: COMPLIANCE
SO8 Monetary value of significant fines and total number of non-monetary sanctions for noncompliance with laws and regulations. 72 SOCIAL PERFORMANCE INDICATORS
PRODUCT RESPONSIBILITY
ASPECT: CUSTOMER HEALTH AND SAFETY
PR1Life cycle stages in which health and safety impacts of products and services are assessed for improvement, and percentage of significant products and services categories subject to such procedures. 74
PR2Total number of incidents of non-compliance with regulations and voluntary codes concerning health and safety impacts of products and servi-ces during their life cycle, by type of outcomes.
74
ASPECT: PRODUCT AND SERVICE LABELING
PR3Type of product and service information required by procedures, and percentage of significant products and services subject to such informa-tion requirements. 74
PR4Total number of incidents of non-compliance with regulations and voluntary codes concerning product and service information and labeling, by type of outcomes.
74
PR5 Practices related to customer satisfaction, including results of surveys measuring customer satisfaction. 15
ASPECT: MARKETING COMMUNICATIONS
PR6Programs for adherence to laws, standards, and voluntary codes related to marketing communications, including advertising, promotion, and sponsorship.
75
PR7Total number of incidents of non-compliance with regulations and voluntary codes concerning marketing communications, including adverti-sing, promotion, and sponsorship by type of outcomes.
75
ASPECT: CUSTOMER PRIVACY
PR8 Total number of substantiated complaints regarding breaches of customer privacy and losses of customer data. 75 ASPECT: COMPLIANCE
PR9 Monetary value of significant fines for noncompliance with laws and regulations concerning the provision and use of products and services. 72
ENVIRONMENTAL PERFORMANCE INDICATORS
ASPECT: MATERIALS
EN1 Materials used by weight or volume. 62 EN2 Percentage of materials used that are recycled input materials. 62
ASPECT: ENERGY
EN3 Direct energy consumption by primary energy source. 55 EN4 Indirect energy consumption by primary source. 55
EN5 Energy saved due to conservation and efficiency improvements. 55
EN6Initiatives to provide energy-efficient or renewable energy based products and services, and reductions in energy requirements as a result of these initiatives.
55
EN7 Initiatives to reduce indirect energy consumption and reductions achieved. 55
ASPECT: WATER
EN8 Total water withdrawal by source 55
EN9 Water sources significantly affected by withdrawal of water. 55
EN10 Percentage and total volume of water recycled and reused. 55 ASPECT: BIODIVERSITY
EN11Location and size of land owned, leased, managed in, or adjacent to, protected areas and areas of high biodiversity value outside protected areas. 64
EN12Description of significant impacts of activities, products, and services on biodiversity in protected areas and areas of high biodiversity value outside protected areas.
64
EN13 Habitats protected or restored. 66 EN14 Strategies, current actions, and future plans for managing impacts on biodiversity. 64 EN15 Number of IUCN Red List species and national conservation list species with habitats in areas affected by operations, by level of extinction risk. 67
ASPECT: EMISSIONS, EFFLUENTS, AND WASTE
EN16 Total direct and indirect greenhouse gas emissions by weight. 60 EN17 Other relevant indirect greenhouse gas emissions by weight. 60
EN18 Initiatives to reduce greenhouse gas emissions and reductions achieved. 60 EN19 Emissions of ozone-depleting substances by weight 60 EN20 NO, SO, and other significant air emissions by type and weight. 60 EN21 Total water discharge by quality and destination 55 EN22 Total weight of waste by type and disposal method 62
EN23 Total number and volume of significant spills 62 EN24
Weight of transported, imported, exported, or treated waste deemed hazardous under the terms of the Basel Convention Annex I, II, III, and VIII, and percentage of transported waste shipped internationally.
62
EN25Identity, size, protected status, and biodiversity value of water bodies and related habitats significantly affected by the reporting organization’s discharges of water and runoff. 64
ASPECT: PRODUCTS AND SERVICES
EN26 Initiatives to mitigate environmental impacts of products and services, and extent of impact mitigation. 67 EN27 Percentage of products sold and their packaging materials that are reclaimed by category 62
ASPECT: COMPLIANCE
EN 28 Monetary value of significant fines and total number of non-monetary sanctions for noncompliance with environmental laws and regulations 72 ASPECT: TRANSPORT
EN29Significant environmental impacts of transporting products and other goods and materials used for the organization’s operations, and trans-porting members of the workforce. 62
ASPECT: OVERALL
EN30 Total environmental protection expenditures and investments by type 69
11. ANNEXES
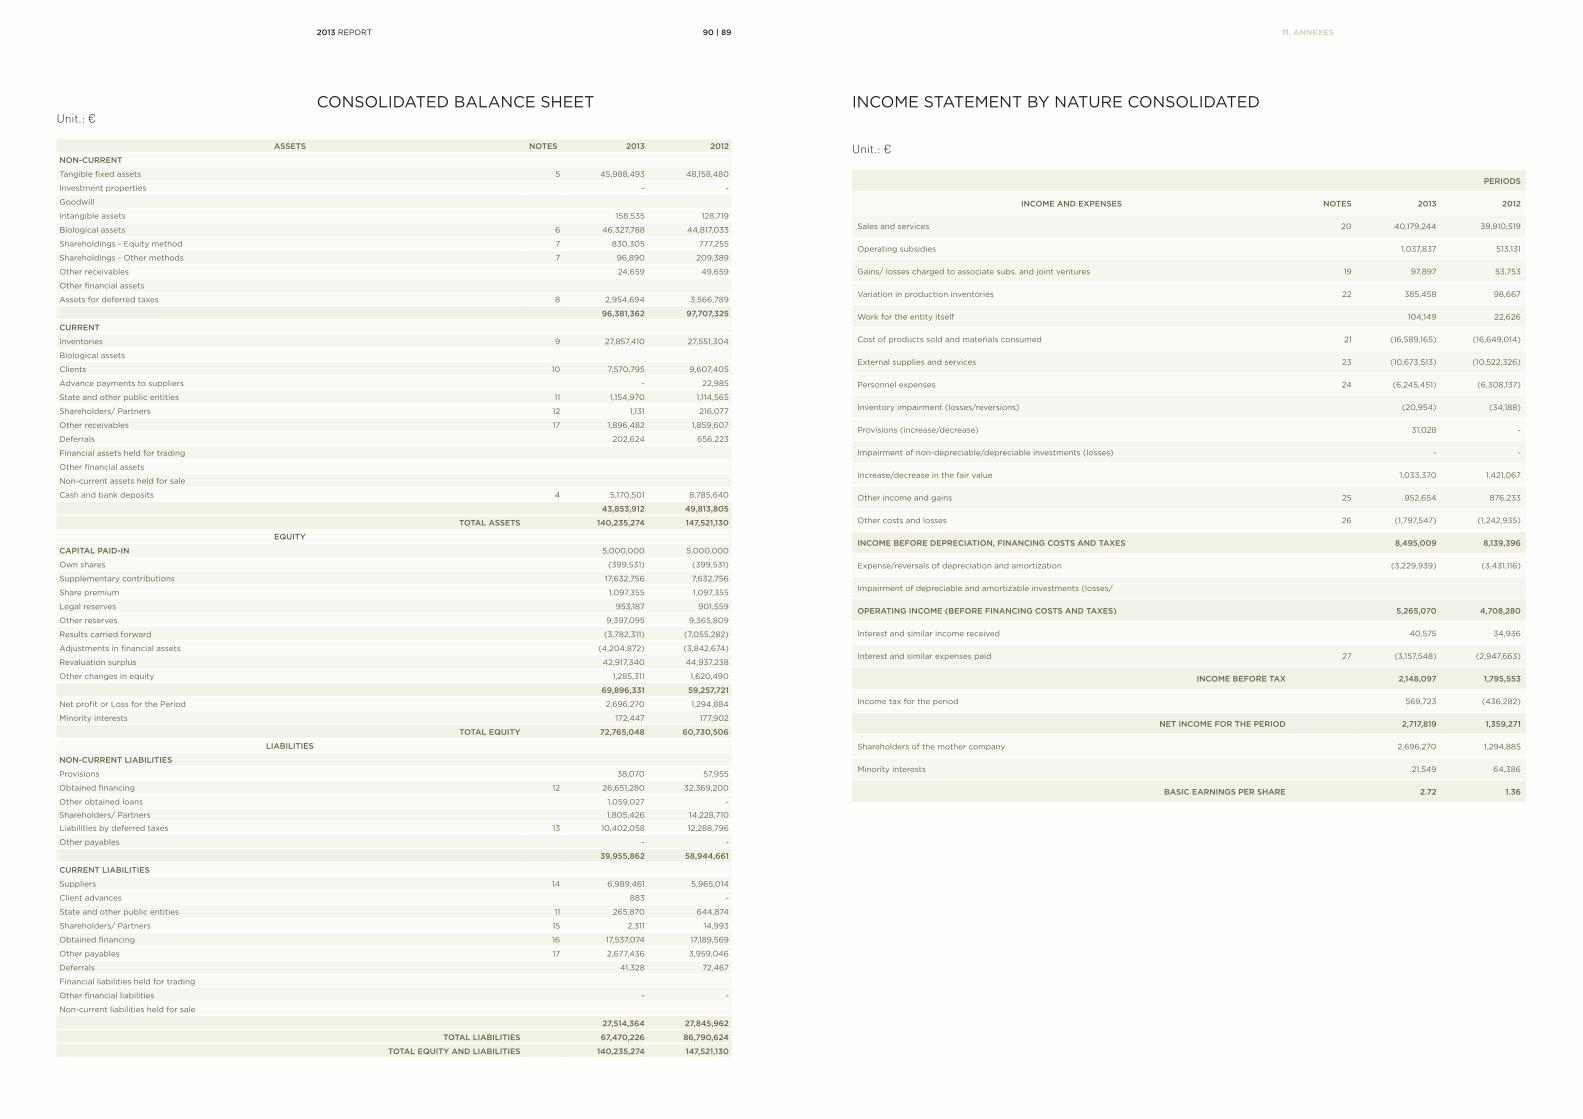
2013 REPORT 90 | 89
CONSOLIDATED BALANCE SHEET INCOME STATEMENT BY NATURE CONSOLIDATEDUnit.: €
ASSETS NOTES 2013 2012
NON-CURRENT
Tangible fixed assets 5 45,988,493 48,158,480
Investment properties - -
Goodwill
Intangible assets 158,535 128,719
Biological assets 6 46,327,788 44,817,033
Shareholdings - Equity method 7 830,305 777,255
Shareholdings - Other methods 7 96,890 209,389
Other receivables 24,659 49,659
Other financial assets
Assets for deferred taxes 8 2,954,694 3,566,789
96,381,362 97,707,325
CURRENT
Inventories 9 27,857,410 27,551,304
Biological assets
Clients 10 7,570,795 9,607,405
Advance payments to suppliers - 22,985
State and other public entities 11 1,154,970 1,114,565
Shareholders/ Partners 12 1,131 216,077
Other receivables 17 1,896,482 1,859,607
Deferrals 202,624 656,223
Financial assets held for trading
Other financial assets
Non-current assets held for sale
Cash and bank deposits 4 5,170,501 8,785,640
43,853,912 49,813,805
TOTAL ASSETS 140,235,274 147,521,130
EQUITY
CAPITAL PAID-IN 5,000,000 5,000,000
Own shares (399,531) (399,531)
Supplementary contributions 17,632,756 7,632,756
Share premium 1,097,355 1,097,355
Legal reserves 953,187 901,559
Other reserves 9,397,095 9,365,809
Results carried forward (3,782,311) (7,055,282)
Adjustments in financial assets (4,204,872) (3,842,674)
Revaluation surplus 42,917,340 44,937,238
Other changes in equity 1,285,311 1,620,490
69,896,331 59,257,721
Net profit or Loss for the Period 2,696,270 1,294,884
Minority interests 172,447 177,902
TOTAL EQUITY 72,765,048 60,730,506
LIABILITIES
NON-CURRENT LIABILITIES
Provisions 38,070 57,955
Obtained financing 12 26,651,280 32,369,200
Other obtained loans 1,059,027 -
Shareholders/ Partners 1,805,426 14,228,710
Liabilities by deferred taxes 13 10,402,058 12,288,796
Other payables - -
39,955,862 58,944,661
CURRENT LIABILITIES
Suppliers 14 6,989,461 5,965,014
Client advances 883 -
State and other public entities 11 265,870 644,874
Shareholders/ Partners 15 2,311 14,993
Obtained financing 16 17,537,074 17,189,569
Other payables 17 2,677,436 3,959,046
Deferrals 41,328 72,467
Financial liabilities held for trading
Other financial liabilities - -
Non-current liabilities held for sale
27,514,364 27,845,962
TOTAL LIABILITIES 67,470,226 86,790,624
TOTAL EQUITY AND LIABILITIES 140,235,274 147,521,130
Unit.: €
PERIODS
INCOME AND EXPENSES NOTES 2013 2012
Sales and services 20 40,179,244 39,910,519
Operating subsidies 1,037,837 513,131
Gains/ losses charged to associate subs. and joint ventures 19 97,897 53,753
Variation in production inventories 22 385,458 98,667
Work for the entity itself 104,149 22,626
Cost of products sold and materials consumed 21 (16,589,165) (16,649,014)
External supplies and services 23 (10,673,513) (10,522,326)
Personnel expenses 24 (6,245,451) (6,308,137)
Inventory impairment (losses/reversions) (20,954) (34,188)
Provisions (increase/decrease) 31,028 -
Impairment of non-depreciable/depreciable investments (losses) - -
Increase/decrease in the fair value 1,033,370 1,421,067
Other income and gains 25 952,654 876,233
Other costs and losses 26 (1,797,547) (1,242,935)
INCOME BEFORE DEPRECIATION, FINANCING COSTS AND TAXES 8,495,009 8,139,396
Expense/reversals of depreciation and amortization (3,229,939) (3,431,116)
Impairment of depreciable and amortizable investments (losses/
OPERATING INCOME (BEFORE FINANCING COSTS AND TAXES) 5,265,070 4,708,280
Interest and similar income received 40,575 34,936
Interest and similar expenses paid 27 (3,157,548) (2,947,663)
INCOME BEFORE TAX 2,148,097 1,795,553
Income tax for the period 569,723 (436,282)
NET INCOME FOR THE PERIOD 2,717,819 1,359,271
Shareholders of the mother company 2,696,270 1,294,885
Minority interests 21,549 64,386
BASIC EARNINGS PER SHARE 2.72 1.36
11. ANNEXES

2013 REPORT 92 | 91
STA
TE
ME
NT
OF
CH
AN
GE
S IN
EQ
UIT
Y
CONSOLIDATED CASH-FLOW STATEMENT
AT
TR
IBU
TA
BL
E T
O S
HA
RE
HO
LD
ER
S
NA
ME
CA
PIT
AL
PA
ID-I
NO
WN
S
HA
RE
SO
TH
ER
IN
ST
RU
ME
NT
S
OF
EQ
UIT
Y
SH
AR
E
PR
EM
IUM
LE
GA
L
RE
SE
RV
ES
OT
HE
R
RE
SE
RV
ES
RE
TA
INE
D
EA
RN
ING
SA
DJU
ST
ME
NT
S
IN F
INA
NC
IAL
A
SS
ET
S
CO
NS
OL
IDA
TIO
N
DIF
FE
RE
NC
ES
RE
VA
LU
AT
ION
S
UR
PLU
SO
TH
ER
V
AR
IAT
ION
S
IN E
QU
ITY
NE
T
INC
OM
E
PE
R P
ER
IOD
MIN
OR
ITY
IN
TE
RE
ST
ST
OTA
L
Po
siti
on
at
the b
eg
inn
ing
o
f p
eri
od
5,0
00
,00
0(3
99
,53
1)7,
63
2,7
56
1,0
97,
35
59
01,
55
99
,36
5,8
09
(7,6
08
,86
0)
(3,8
42,6
74)
-4
4,9
37,
23
81,
53
5,8
55
1,29
4,8
85
177,
90
26
0,0
92,2
94
CH
AN
GE
S I
N
TH
E P
ER
IOD
-
Mo
vem
en
t o
f in
vest
men
t su
bsi
die
s(2
50
,54
3)
-(2
50
,54
3)
Su
rplu
s re
aliz
ati
on
ass
ets
re
valu
ati
on
(2,0
19,8
98
)(2
,019
,89
8)
Mo
vem
en
ts
in e
qu
ity
2,5
31,
66
4(3
62,19
8)
(27,
00
4)
2,14
2,4
62
Ap
plic
ati
on
o
f re
sult
s5
1,6
28
31,
28
61,
29
4,8
85
(1,2
94
,88
5)
82,9
14
5,0
00
,00
0(3
99
,53
1)7,
63
2,7
56
1,0
97,
35
59
53
,18
79
,39
7,0
95
(3,7
82,3
11)
(4,2
04
,872)
-4
2,9
17,3
40
1,28
5,3
11(0
)15
0,8
98
60
,04
7,229
Net
inco
me
for
the p
eri
od
2,6
96
,270
21,
54
92,7
17,8
19
Su
bTo
tal
5,0
00
,00
0(3
99
,53
1)7,
63
2,7
56
1,0
97,
35
59
53
,18
79
,39
7,0
95
(3,7
82,3
11)
(4,2
04
,872)
-4
2,9
17,3
40
1,28
5,3
112,6
96
,270
172,4
47
62,7
65
,04
8
OP
ER
AT
ION
S
WIT
H
SH
AR
EH
OL
DE
RS
-
Cap
ital in
cre
ase
-10
,00
0,0
00
10,0
00
,00
0
Oth
er
dis
trib
uti
on
s o
f in
co
me
10,0
00
,00
0-
--
Po
siti
on
at
the e
nd
o
f p
eri
od
5,0
00
,00
0(3
99
,53
1)17
,63
2,7
56
1,0
97,
35
59
53
,18
79
,39
7,0
95
(3,7
82,3
11)
(4,2
04
,872)
-4
2,9
17,3
40
1,28
5,3
112,6
96
,270
172,4
47
72,7
65
,04
8
Unit.: €
DESIGNATION 2013 2012
CASH-FLOWS OF OPERATING ACTIVITIES - DIRECT METHOD
Payments from clients 42,705,291 38,261,555
Payments to suppliers (27,485,724) (25,300,047)
Payments to personnel (6,148,412) (6,336,851)
Cash generated by operations 9,071,156 6,624,657
Payment or receipt of income activities (448,178) (460,783)
Other receivables/payments (97,672) 93,104
CASH-FLOWS OF OPERATING ACTIVITIES (1) 8,525,306 6,256,978
CAH.FLOWS OF INVESTMENT ACTIVITIES
PAYMENTS FOR:
Tangible fixed assets (1,174,599) (3,285,060)
Intangible assets (278,564) (22,404)
Financial investments (0) (9,541)
Other assets (612,011) (135,410)
RECEIVABLES FROM:
Tangible fixed assets 14,814 18,151
Intangible assets - -
Financial investments 112,500 -
Other assets - -
Investment subsidies 104,964 360,073
Interest and similar income 40,575 34,936
Dividends - -
FLOW OF INVESTMENT ACTIVITIES -1,792,321 -3,039,255
CASH-FLOWS OF FINANCING ACTIVITIES
RECEIVABLES FROM:
Obtained financing 7,887,668 12,822,562
Realizations of capital and other equity instruments 10,000,000 1,632,756
Coverage lossses - -
Donations - -
Other financing operations - -
PAYMENTS FOR:
Obtained financing (12,662,240) (5,675,164)
Interest and similar costs (3,150,268) (3,229,145)
Dividends - -
Capital reductions - -
Other financing operations (12,423,284) (2,063,112)
FLOW OF FINANCING ACTIVITIES -10,348,124 3,487,897
VARIATION IN CASH AND CASH EQUIVALENTS (4)=(1)+(2)+(3) -3,615,139 6,705,620
CASH AND CASH EQUIVALENTS AT THE BEGGINING OF THE PERIOD 8,785,640 2,080,022
CASH AND CASH EQUIVALENTS AT THE END OF THE PERIOD 5,170,501 8,785,640
11. ANNEXES
2013 REPORT 94 | 93
NOTES TO THE CONSOLIDATED FINANCIAL STATEMENTS
INTRODUCTION
ESPORÃO, S.A. is a public limited company, headquartered in Reguengos de Mon-saraz, in the Évora district, whose corporate object is industrialization and com-mercialization of agricultural products and livestock produced on its own agri-cultural land or simply leased or managed by the company, and the exercise of all additional activities directly related to those, including exploration of food and beverage establishments.
Under the terms of the deed of incorporation and subsequent changes to Espo-rão, S.A. society contract, the share capital of 5.000.000 Euros (five million euros) was paid in full, in cash.
The current name was registered in December 2008 as part of an activity restruc-turing between this company and its subsidiaries.
Brief description of the entities integrating Esporão group to 31.12.2013
Esporão Azeites, Lda.:
The company ESPORÃO AZEITES, LDA. is a limited liability company headquarte-red in the industrial zone of the municipality of Serpa. The company was incorpo-rated by public deed on November 25, 1997 under the name SPAZA -. Sociedade Produtora de Azeites do Alentejo, Lda., starting its activity immediately.
The current name was registered in January 2009 as part of the restructuring of Esporão Group activities. ESPORÃO AZEITES, LDA corporate purpose is the pro-duction of quality olive oil.
The company is 98% owned by ESPORÃO, S.A. and headquartered in Herdade do Esporão, Reguengos de Monsaraz.
Esporão Vendas e Marketing, SA:
The company ESPORÃO-Vendas e Marketing, S.A., is a public limited company headquartered in Herdade do Esporão, in Reguengos de Monsaraz. The company was founded in 1890 under the name Francisco Mantero. Lda. and registered in the Commercial Registry of Lisboa in August 5th, 1916.
The current name was registered in December 2008, as part of the restructuring of Esporão Group activities.
Esporão Vendas e Marketing S.A. corporate object is the wholesale trade of wine and olive oil, is 100% owned by ESPORÃO, S.A. and headquartered in Herdade do Esporão in Reguengos de Monsaraz.
Murças, SA:
The company MURÇAS, S.A., is a public company headquartered in Quinta dos Murças, SA, Covelinhas, in Peso da Régua. The company was incorporated by pu-blic deed in 1932, under the juridical form of private limited liability, starting its activity immediately.
The current name and change of the juridical form to a public limited company took place in 2009 as part of the restructuring of Esporão Group activities.
MURÇAS, S.A. corporate object is the production of quality wines comprising the viticultural and winery activities. It also produces a small batch of olive oil. The company is 100% owned by ESPORÃO, SA, heaquartered in Herdade do Esporão, Reguengos de Monsaraz.
Qualimpor:
Qualimpor, headquartered in Rua Antônio Chagas, 529 – Chácara Santo Antônio, in São Paulo, Brazil, was created in 1995 with the purpose of importing and distri-buting wines and olive oils from Herdade do Esporão. The origin of the name came from joining the portuguese words “qualidade de alimentos portugueses”, which stand for “quality of portuguese food”.
Since its birth Qualimpor shows a different profile, as it works exclusively for brands owned by one same family.
The company’s objective is to expand its operations to other brands, complemen-ting products and better positioning them in the Brazilian market, thus benefiting from economies of scale.
This company is 95% owned by Esporão, S.A. and 5% by local management.
Esporão Produção Biológica, Lda.:
The company Esporão-Produção Biológica, Lda., is a private limited liability com-pany headquartered in Herdade do Esporão, in Reguengos de Monsaraz, incor-porated by private document on July 30, 2012, under the juridical form of limited liability and starting its activity immediately. Its corporate object is the production of grapes by using organic farming methods and techniques. The company is 90% owned by ESPORÃO, S.A., headquartered in Herdade do Esporão, Reguengos de Monsaraz, and 10% owned by MURÇAS, SA, headquartered in Covelinhas, Peso da Régua.
Zamagri:
Zamagri is not currently operating and keeps managing its assets.
11. ANNEXES

2013 REPORT 96 | 95
ACCOUNTING STANDARDS FOR PREPARING FINANCIAL STATEMENTS
BASIS OF PREPARATION
These consolidated financial statements were prepared in accordance with the standards that comprise the Accounting Standards System (SNC) in force at the close of the financial year.
As part of those standards, it must be inclued the Basis for the Presentation of Fi-nancial Statements, Models of Financial Statements, the Code of Accounts and Ac-counting Standards and Financial Reporting (NCRF) and the Performing Standards.
Whenever SNC does not respond to particular aspects of transactions or situa-tions, International Accounting Standards as adopted pursuant to Regulation (EC) No. 1606/2002, of the European Parliament and of the Council of 19 July; and International Accounting Standards (IAS) and International Financial Reporting Standards (IFRS) issued by the IASB according to SIC-IFRIC interpretation, are complementarily applied, in the order above indicated.
The financial statements are prepared based on the continuity of business ope-rations in the current economic and social situation in Portugal and the values presented are set in euros, except those who are expressly indicated in other currencies.
In the transition from the previous accounting standards to SNC, the Board has modified some of the accounting and valuation criteria applied in the financial statements of 2010, so that the same are presented in accordance with “NCRF”
The preparation of financial statements in accordance with SNC requires the use of estimates, assumptions and critical judgment in the process of determining the accounting policies to adopt by Esporão Group, with significant impact in the book value of assets and liabilities as well as in the income and expenses of the reporting period.
Although these estimates are based on the best experience of the Board and on their best expectations for the current and future events and actions, current and future results may differ from these estimates.
Areas involving a higher degree of judgment or complexity, or areas where as-sumptions and estimates are significant to the consolidated financial statements are disclosed in Note 3.2.4.
DEROGATION FROM SNC PROVISIONS
During the financial year to which these Financial Statements refer, there were no exceptional cases that directly implied derogation from any of SNC provision.
COMPARABILITY OF FINANCIAL STATEMENTS
The present financial statements of Esporão, S.A., were prepared based on the accounting records maintained in accordance with the legislation in force.
SIGNIFICANT ACCOUNTING POLICIES
The significant accounting policies applied in preparing the financial statemen-ts are those which are described below. These policies have been consistently applied to all years presented, unless otherwise stated.
CONSOLIDATION
Shareholdings – Subsidiaries
Subsidiaries are all entities over which Esporão Group has the power to govern the financial and operating policies and normally has control, directly or indirectly, of more than half of the voting rights.
The existence and effect of potential voting rights that are currently exercisable or convertible are taken into consideration during the evaluation of the control that Esporão holds over an entity.
Investments in subsidiary companies in which the Group exercises control are consolidated using the full consolidation method from the date on which it as-sumed control over its financial and operating activities until the moment such control ceases.
The acquisition of subsidiaries is registered by the purchase method. The cost of an acquisition is measured at the fair value of the assets given, equity instruments issued and liabilities incurred or assumed at the date of acquisition plus costs directly attributable to the acquisition.
The acquired identifiable assets and liabilities and contingent liabilities assumed in a business combination are measured initially at their fair value at the acquisi-tion date, regardless of the existence of minority interests.
The excess of cost of acquisition over the fair value of the Group’s share on the acquired identifiable assets is recorded as goodwill. If the cost of acquisition is less than the fair value of the acquired subsidiary net assets, the difference is recognized directly in the consolidated income statement by nature.
Transactions, balances and unrealized gains on transactions with Group com-panies are eliminated. Unrealized losses are also eliminated but considered an impairment indicator of the asset transferred.
Accounting policies of subsidiaries are changed whenever necessary to ensure that they are applied consistently by all Group companies.
The entities included in consolidation by the global integration method, by Decem-ber 31, 2012 and December 31, 2013, and qualifying as subsidiaries are as follows:
11. ANNEXES
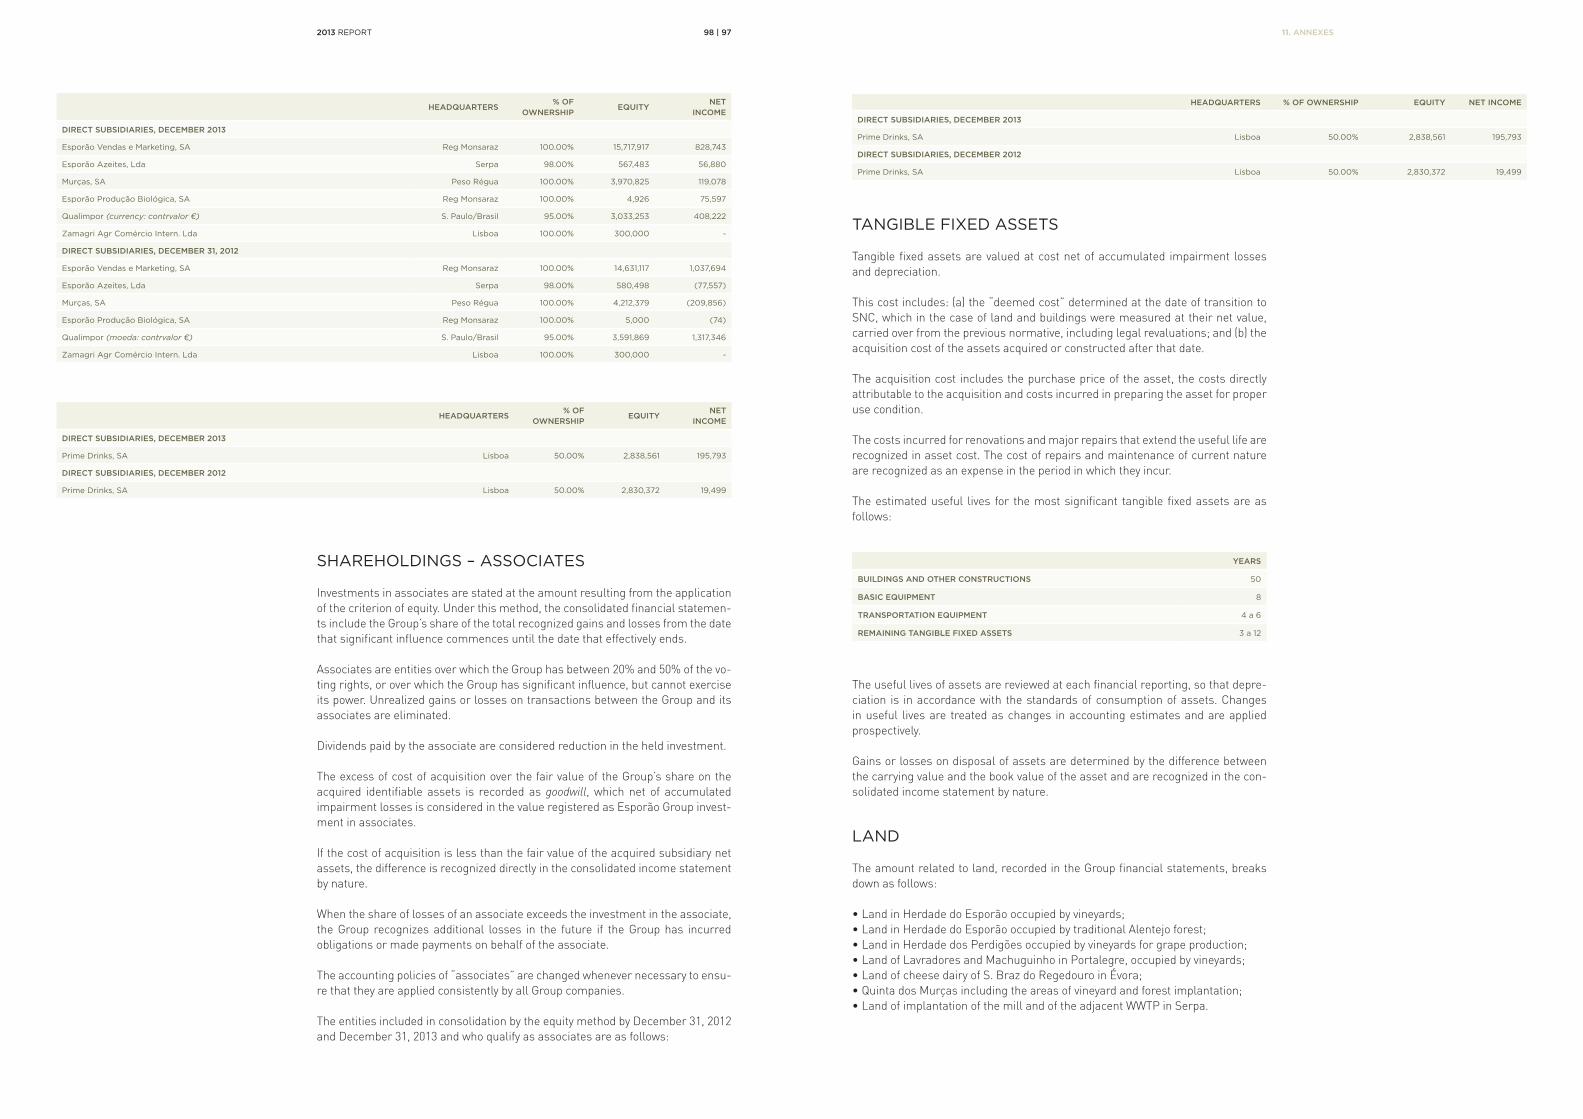
2013 REPORT 98 | 97
SHAREHOLDINGS – ASSOCIATES
Investments in associates are stated at the amount resulting from the application of the criterion of equity. Under this method, the consolidated financial statemen-ts include the Group’s share of the total recognized gains and losses from the date that significant influence commences until the date that effectively ends.
Associates are entities over which the Group has between 20% and 50% of the vo-ting rights, or over which the Group has significant influence, but cannot exercise its power. Unrealized gains or losses on transactions between the Group and its associates are eliminated.
Dividends paid by the associate are considered reduction in the held investment.
The excess of cost of acquisition over the fair value of the Group’s share on the acquired identifiable assets is recorded as goodwill, which net of accumulated impairment losses is considered in the value registered as Esporão Group invest-ment in associates.
If the cost of acquisition is less than the fair value of the acquired subsidiary net assets, the difference is recognized directly in the consolidated income statement by nature.
When the share of losses of an associate exceeds the investment in the associate, the Group recognizes additional losses in the future if the Group has incurred obligations or made payments on behalf of the associate.
The accounting policies of “associates” are changed whenever necessary to ensu-re that they are applied consistently by all Group companies.
The entities included in consolidation by the equity method by December 31, 2012 and December 31, 2013 and who qualify as associates are as follows:
HEADQUARTERS% OF
OWNERSHIPEQUITY
NET INCOME
DIRECT SUBSIDIARIES, DECEMBER 2013
Esporão Vendas e Marketing, SA Reg Monsaraz 100.00% 15,717,917 828,743
Esporão Azeites, Lda Serpa 98.00% 567,483 56,880
Murças, SA Peso Régua 100.00% 3,970,825 119,078
Esporão Produção Biológica, SA Reg Monsaraz 100.00% 4,926 75,597
Qualimpor (currency: contrvalor ¤) S. Paulo/Brasil 95.00% 3,033,253 408,222
Zamagri Agr Comércio Intern. Lda Lisboa 100.00% 300,000 -
DIRECT SUBSIDIARIES, DECEMBER 31, 2012
Esporão Vendas e Marketing, SA Reg Monsaraz 100.00% 14,631,117 1,037,694
Esporão Azeites, Lda Serpa 98.00% 580,498 (77,557)
Murças, SA Peso Régua 100.00% 4,212,379 (209,856)
Esporão Produção Biológica, SA Reg Monsaraz 100.00% 5,000 (74)
Qualimpor (moeda: contrvalor ¤) S. Paulo/Brasil 95.00% 3,591,869 1,317,346
Zamagri Agr Comércio Intern. Lda Lisboa 100.00% 300,000 -
HEADQUARTERS% OF
OWNERSHIPEQUITY
NET INCOME
DIRECT SUBSIDIARIES, DECEMBER 2013
Prime Drinks, SA Lisboa 50.00% 2,838,561 195,793
DIRECT SUBSIDIARIES, DECEMBER 2012
Prime Drinks, SA Lisboa 50.00% 2,830,372 19,499
HEADQUARTERS % OF OWNERSHIP EQUITY NET INCOME
DIRECT SUBSIDIARIES, DECEMBER 2013
Prime Drinks, SA Lisboa 50.00% 2,838,561 195,793
DIRECT SUBSIDIARIES, DECEMBER 2012
Prime Drinks, SA Lisboa 50.00% 2,830,372 19,499
TANGIBLE FIXED ASSETS
Tangible fixed assets are valued at cost net of accumulated impairment losses and depreciation.
This cost includes: (a) the “deemed cost” determined at the date of transition to SNC, which in the case of land and buildings were measured at their net value, carried over from the previous normative, including legal revaluations; and (b) the acquisition cost of the assets acquired or constructed after that date.
The acquisition cost includes the purchase price of the asset, the costs directly attributable to the acquisition and costs incurred in preparing the asset for proper use condition.
The costs incurred for renovations and major repairs that extend the useful life are recognized in asset cost. The cost of repairs and maintenance of current nature are recognized as an expense in the period in which they incur.
The estimated useful lives for the most significant tangible fixed assets are as follows:
YEARS
BUILDINGS AND OTHER CONSTRUCTIONS 50
BASIC EQUIPMENT 8
TRANSPORTATION EQUIPMENT 4 a 6
REMAINING TANGIBLE FIXED ASSETS 3 a 12
The useful lives of assets are reviewed at each financial reporting, so that depre-ciation is in accordance with the standards of consumption of assets. Changes in useful lives are treated as changes in accounting estimates and are applied prospectively.
Gains or losses on disposal of assets are determined by the difference between the carrying value and the book value of the asset and are recognized in the con-solidated income statement by nature.
LAND
The amount related to land, recorded in the Group financial statements, breaks down as follows:
• Land in Herdade do Esporão occupied by vineyards;• Land in Herdade do Esporão occupied by traditional Alentejo forest; • Land in Herdade dos Perdigões occupied by vineyards for grape production;• Land of Lavradores and Machuguinho in Portalegre, occupied by vineyards;• Land of cheese dairy of S. Braz do Regedouro in Évora; • Quinta dos Murças including the areas of vineyard and forest implantation; • Land of implantation of the mill and of the adjacent WWTP in Serpa.
11. ANNEXES

2013 REPORT 100 | 99
Except for the land of Portalegre and Évora, lands are registered at fair value ba-sed on evaluation made referring to December 31 2010 and which was assumed equal book value for the following year, given that there were no facts that could significantly change its value. The technical evaluation performed is based on real estate value of land whether they are connected or not to the operation and to the company’s social business.
The land of Portalegre and Évora were acquired by Esporão, S.A. at the end of this financial year and are valued at cost, taking into account the time elapsed since its acquisition and also for not having occurred exceptional facts that could change the acquisition value.
Quinta dos Murças is valued at fair value based on a study of land valuation con-ducted in 2009 and maintained in the following years for not having occurred facts that could significantly change its value.
The land of implantation of the mill and WWTP is valued at cost, taking into ac-count the time elapsed since its acquisition and also for not having occurred ex-ceptional facts that could change its acquisition value.
BUILDINGS
The buildings comprise all buildings of the winery, wine tourism, warehouses and filling pavilion and tower and were initially registered at their cost of construction and subsequently adjusted in the accounts of the company at their fair value. This value was determined at the date of December 31, 2010 based on the study of pro-perty valuation performed by an independent firm and maintained in the following years because no facts have occurred that could significantly change its value.
The cheese dairy building located in S. Braz do Regedouro joined the company’s assets at year end and is registered at cost value.
The set of buildings of the mill in Serpa integrates the assets of the company Es-porão Azeites since its foundation and is registered at its cost value, because no significant events occurred that could change its value.
PRODUCTION EQUIPMENT
Machines and production equipment are stated at acquisition cost added to all charges resulting from their preparation in view of its use. The value of major repairs that extend the useful life or productive capacity of the asset is registered at asset value.
BIOLOGICAL ASSETS
Biological production assets consist of the following plantations:
• Vineyards intended for the production of grape used for wine manufacturing and marketed by the company.
• Olive grove that is intended to produce olives for sale to Esporão Azeites, Lda., olive oil producer and with which there is a participation in capital. This crop has the technical characteristics of crop in semi-intensive system.
• Forest constituted by plantation of holm oaks and stone pines.
The vineyard is registered at its fair value based on an estimate on the updated value of cash flows in accordance with the following premises:
• Useful life: 25 years.
• Reference price of the grape: average cost of buying in the last two years and adding a cost equivalent to the correlation of the average price of wines.
• Production costs: average of the last two years.
• Average productivity: productivity determined by average for a regular campaign.
• Update rate: 6.53% applied on the value of cash flows at constant prices over the period.
The update rate used is the average rate of the cost of debt capital supported by the company over the past four years, excluding contracted rates a few years ago and that are below market and adding about 1.5% of risk premium.
The price value of the grape was calculated based on the average purchase price for the year, added a bonus determined by a weighted correlation of the average sales prices for the wines that are intended, in the last three years.
The fair value of the olive grove was determined by cash flows method at the up-dated rate of 6.53% per annum applied to the income value net of expected costs and for a 25 years plantation.
DEPRECIATIONS AND AMORTIZATIONS
Depreciation is calculated, after the date on which the asset is available for use by the straight line method in accordance with the estimated useful life for each group of assets, in accordance with DR-25/2009.
The depreciation rates correspond to the periods of expected life (in years) descri-bed in this document.
TANGIBLE ASSETS IN PROGRESS
Tangible assets in progress refer to the reconstruction phase of the cellar and ad-jacent buildings, as well as costs incurred to date with the works of reformulation and expansion of the building of wine tourism, and are registered at acquisition cost less any impairment losses. It also includes the cost of rebuilding and resha-ping the winery and storehouses of Quinta dos Murças in Douro.
These assets are depreciated from the time they are available for use in the ne-cessary conditions to operate.
WARRANTIES
The land and buildings of Quinta dos Murças are mortgaged to CCAM to guaran-tee a loan to Esporão, S.A. that at the date of 12.31.2013 stood at four million, eight hundred thousand euros.
INTANGIBLE ASSETS
Intangible assets are recognized and measured when: i) are identifiable; ii) it is probable that they will result in future economic benefits; and iii) its cost can be measured reliably.
When purchased individually intangible assets are recognized at cost, which com-prises: i) the purchase price, including costs related to intellectual property rights and fees after deducting any discounts; and ii) any costs directly attributable to preparing the asset for its intended use.
11. ANNEXES

2013 REPORT 102 | 101
When acquired under a business settlement, separable from goodwill, intangible assets are valued at fair value, determined under the application of the purchase method as required by NCRF 14 - Concentrations of Business Activities.
Internally generated assets, including expenditure on internal development, are registered as expense when incurred, if it is not possible to distinguish the re-search phase from the development phase, or when is not possible to determine reliably the costs incurred at each stage or the likelihood of economic benefits to the group.
Expenditure on research and evaluations made in the course of operating activi-ties are recognized in the income statement as incurred.
The useful life and amortization method of intangible assets is determined based on the estimated consumption of the economic benefits associated with the asset.
Intangible assets with finite useful lives are amortized on a systematic basis from the date they are available for use, during their estimated useful life
Assets that by their nature do not have an indefinite useful life are not amorti-zed and are subject to annual impairment tests or whenever they show signs of impairment.
The balances carried from the associated Qualimpor are recorded as intangible assets at 31.12.2013 and refer to: i) Software - amounts spent on the acquisition of rights in computer applications and incurred costs of parameterization, to support the activity developed and also the value of construction cost software for shared use, through the provision of services; ii) Telephone Lines - Telephone lines and network.
FINANCIAL ASSETS
The Board of Directors determines the classification of financial assets at the date of initial recognition in accordance with NCRF 27 - Financial InstrumentsFinancial assets can be classified / measured as:
at cost or amortized cost less any impairment loss; orat fair value with changes in fair value being recognized in the income statementThe Group classifies and measures at cost or amortized cost financial assets: i) that in terms of time are paid at sight or have defined maturity; ii) whose return is fixed amount, fixed interest rate or variable corresponding to a market index; and iii) do not have any contractual clause which may result in the loss of face value and accrued interest.
For assets registered at amortized cost, the interest earned to recognize in each period is determined according to the method of the effective interest rate, whi-ch is the rate that exactly discounts estimated future cash receipts through the expected life of the financial instrument.
Financial assets that are loans, accounts receivable (customers, other debtors, etc.) and equity instruments as well as any associated derivative contracts that are not traded in an active market or whose fair value cost cannot be reliably determined, are recorded at cost or amortized cost.
The Group classifies and measures at fair value financial assets that do not meet the conditions to be measured at cost or amortized cost, as described above.
Financial assets that are equity instruments quoted in an active market, deri-vative contracts and financial assets held for trading are recorded at fair value. Changes in fair value are recorded in the results of exercise, except in relation to derivative financial instruments that qualify as hedge of cash flows.
The Group assesses at each financial reporting date for any indication of im-pairment for financial assets that are not measured at fair value through profit or loss. If there is objective evidence of impairment, the Group recognizes an impairment loss in the income statement.
Financial assets are derecognized when the rights to receive cash flows from the investments expire or are transferred, as well as all risks and rewards of ownership.
FAIR VALUE OF ASSETS AND LIABILITIES
In determining the fair value of a financial asset or liability if there is an active market, the quoted market price is applied. In case there is no active market, which is the case for some financial assets and liabilities, valuation techniques generally accepted in the market and based on market assumptions are used.
The Group applies valuation techniques for financial instruments not quoted, such as derivatives, financial instruments at fair value through profit or loss and financial assets available for sale. The valuation models that are used most often are models of discounted cash flows and option valuation models that in-corporate, for example, the interest rate curves and market volatility.
For some types of more complex derivatives, models containing more advanced valuation assumptions and data that are not directly observable in the market, for which the Group uses internal estimates and assumptions are used.
INVENTORIES
Entry of raw materials and packaging materials and consumption are expressed in our accounting records at cost of acquisition. The value of the finished product expressed in the Balance and its variations reflected in the income statement are measured at their production value and there was no value adjustment.
The value of the raw material - UVA incorporated in the finished product was subject to adjustment for the effect of fair value, as explained in paragraph 3.2.4 above.
The existing records of amounts at the year end were confirmed by physical counts.
CLIENTS AND OTHER RECEIVABLES
The value of items of customers and other receivables refer to receivables from customers and other entities, and are expressed at its fair value, which corres-ponds to the price established for operations and subsequently adjusted for any impairment.
CASH AND CASH EQUIVALENTS
Cash and cash equivalents correspond to the amounts included in cash and bank deposits with immediate liquidity without risk or low risk. Bank overdrafts are presented as current liabilities in the balance sheet under the item of financing.
11. ANNEXES
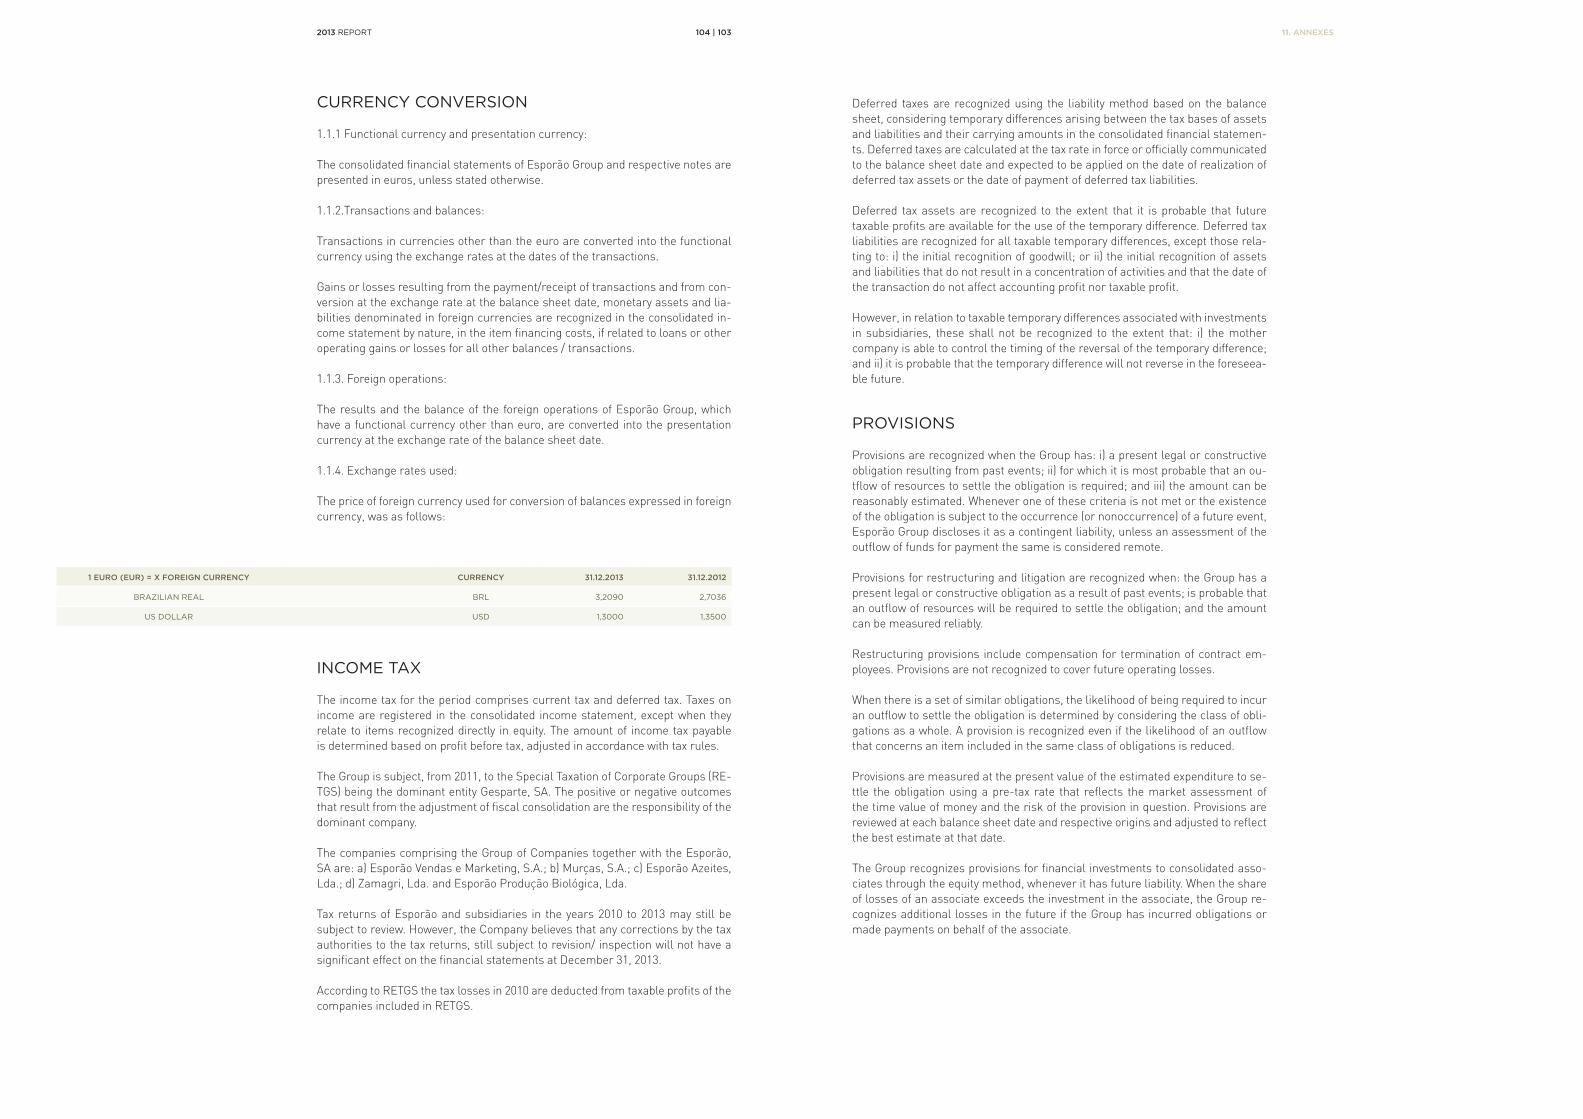
2013 REPORT 104 | 103
CURRENCY CONVERSION
1.1.1 Functional currency and presentation currency:
The consolidated financial statements of Esporão Group and respective notes are presented in euros, unless stated otherwise.
1.1.2.Transactions and balances:
Transactions in currencies other than the euro are converted into the functional currency using the exchange rates at the dates of the transactions.
Gains or losses resulting from the payment/receipt of transactions and from con-version at the exchange rate at the balance sheet date, monetary assets and lia-bilities denominated in foreign currencies are recognized in the consolidated in-come statement by nature, in the item financing costs, if related to loans or other operating gains or losses for all other balances / transactions.
1.1.3. Foreign operations:
The results and the balance of the foreign operations of Esporão Group, which have a functional currency other than euro, are converted into the presentation currency at the exchange rate of the balance sheet date.
1.1.4. Exchange rates used:
The price of foreign currency used for conversion of balances expressed in foreign currency, was as follows:
1 EURO (EUR) = X FOREIGN CURRENCY CURRENCY 31.12.2013 31.12.2012
BRAZILIAN REAL BRL 3,2090 2,7036
US DOLLAR USD 1,3000 1,3500
INCOME TAX
The income tax for the period comprises current tax and deferred tax. Taxes on income are registered in the consolidated income statement, except when they relate to items recognized directly in equity. The amount of income tax payable is determined based on profit before tax, adjusted in accordance with tax rules.
The Group is subject, from 2011, to the Special Taxation of Corporate Groups (RE-TGS) being the dominant entity Gesparte, SA. The positive or negative outcomes that result from the adjustment of fiscal consolidation are the responsibility of the dominant company.
The companies comprising the Group of Companies together with the Esporão, SA are: a) Esporão Vendas e Marketing, S.A.; b) Murças, S.A.; c) Esporão Azeites, Lda.; d) Zamagri, Lda. and Esporão Produção Biológica, Lda.
Tax returns of Esporão and subsidiaries in the years 2010 to 2013 may still be subject to review. However, the Company believes that any corrections by the tax authorities to the tax returns, still subject to revision/ inspection will not have a significant effect on the financial statements at December 31, 2013.
According to RETGS the tax losses in 2010 are deducted from taxable profits of the companies included in RETGS.
Deferred taxes are recognized using the liability method based on the balance sheet, considering temporary differences arising between the tax bases of assets and liabilities and their carrying amounts in the consolidated financial statemen-ts. Deferred taxes are calculated at the tax rate in force or officially communicated to the balance sheet date and expected to be applied on the date of realization of deferred tax assets or the date of payment of deferred tax liabilities.
Deferred tax assets are recognized to the extent that it is probable that future taxable profits are available for the use of the temporary difference. Deferred tax liabilities are recognized for all taxable temporary differences, except those rela-ting to: i) the initial recognition of goodwill; or ii) the initial recognition of assets and liabilities that do not result in a concentration of activities and that the date of the transaction do not affect accounting profit nor taxable profit.
However, in relation to taxable temporary differences associated with investments in subsidiaries, these shall not be recognized to the extent that: i) the mother company is able to control the timing of the reversal of the temporary difference; and ii) it is probable that the temporary difference will not reverse in the foreseea-ble future.
PROVISIONS
Provisions are recognized when the Group has: i) a present legal or constructive obligation resulting from past events; ii) for which it is most probable that an ou-tflow of resources to settle the obligation is required; and iii) the amount can be reasonably estimated. Whenever one of these criteria is not met or the existence of the obligation is subject to the occurrence (or nonoccurrence) of a future event, Esporão Group discloses it as a contingent liability, unless an assessment of the outflow of funds for payment the same is considered remote.
Provisions for restructuring and litigation are recognized when: the Group has a present legal or constructive obligation as a result of past events; is probable that an outflow of resources will be required to settle the obligation; and the amount can be measured reliably.
Restructuring provisions include compensation for termination of contract em-ployees. Provisions are not recognized to cover future operating losses.
When there is a set of similar obligations, the likelihood of being required to incur an outflow to settle the obligation is determined by considering the class of obli-gations as a whole. A provision is recognized even if the likelihood of an outflow that concerns an item included in the same class of obligations is reduced.
Provisions are measured at the present value of the estimated expenditure to se-ttle the obligation using a pre-tax rate that reflects the market assessment of the time value of money and the risk of the provision in question. Provisions are reviewed at each balance sheet date and respective origins and adjusted to reflect the best estimate at that date.
The Group recognizes provisions for financial investments to consolidated asso-ciates through the equity method, whenever it has future liability. When the share of losses of an associate exceeds the investment in the associate, the Group re-cognizes additional losses in the future if the Group has incurred obligations or made payments on behalf of the associate.
11. ANNEXES

2013 REPORT 106 | 105
EXPENSES AND INCOME
Income and expenses are recorded in the period to which they relate, regardless of payment or receipt, in accordance with the accounting principle of accrual. The differences between the amounts received and paid and the corresponding reve-nues and expenses are recognized as assets or liabilities if they qualify as such.
REVENUE
The Revenue is the fair value of the amount received or receivable for the provision of services in the normal course of the Group’s activity. Revenue is recorded net of any taxes, trade discounts and financial discounts.
SPECIALIZATION OF INCOME AND EXPENSES
Income and expenses are recorded in the period to which they relate, regardless of payment or receipt, in accordance with the accounting principle of accrual. The differences between the amounts received and paid and the corresponding reve-nues and expenses are recognized as assets or liabilities if they qualify as such.
BALANCE SHEET CLASSIFICATION
Realizable assets and liabilities due in more than one year from the balance sheet date are classified, respectively, as non-current assets and liabilities.
SUBSEQUENT EVENTS
Events occurring after the balance sheet date that affect the value of existing as-sets and liabilities are considered when preparing the financial statements for the period. If significant such events are disclosed in the notes to the financial statements.
MAIN ESTIMATES AND JUDGEMENTS
All estimates and assumptions used in preparing the financial statements were made by the management based on its best knowledge of events and transactions in progress at the date of approval of the financial statements.
Changes to these estimates, occurring after the date of the financial statements, will be recognized in the income statement prospectively.
LAND BUILDINGS
EQUIPMENT OTHER ASSETS
ONGOING TOTAL
BASIC TRANSPORT ADMINISTR.
INITIAL NET CARRYING AMOUNT 19,949,566 21,253,345 4,704,508 103,180 156,544 848,503 1,142,833 48,158,479
ADDITIONS
Transfers 672,604 41,718 26,586 81,906 (822,814) -
Alienations (177,368) (177,368)
Reversion of depreciations -
Other addititions (660,139) 411,824 409,493 (12,288) 19,063 (24,183) 860,609 1,004,381
TOTAL AMOUNT OF ADDITIONS 12,465 453,542 258,711 (12,288) 19,063 57,723 37,795 827,013
REDUCTIONS
Depreciations (68,477) (1,816,111) (976,925) (18,728) (56,600) (147,874) - (3,084,715)
Alienations 85,613 85,613
Regularizations -
Disposals (4,474) 1,584 4,978 15 2,103
Transfers -
TOTAL REDUCTIONS (68,477) (1,820,585) (891,312) (17,144) (51,622) (147,859) - (2,996,999)
FINAL NET CARRYING AMOUNT 19,893,554 19,886,303 4,071,907 73,748 123,985 758,367 1,180,628 45,988,493
TANGIBLE FIXED ASSETS
During the year ending in December 31, 2013 the movements recorded in the Fixed Assets Tangible item were as follows:
a) Warranties
The registered assets above are not burdened or affected to any guarantees for the fulfillment of bank or other obligations, except for the land and buildings of Quinta dos Murças, given in guarantee for a CCAM loan to Esporão, S.A., which to date stands at four million, eight hundred thousand euros.
b) Revaluations
Tangible assets of Esporão, S.A. were reassessed under the following legislation:
Decree Law nº. 399-G/84 of 28.12 Decree Law nº. 118B/86 of 27.05 Decree Law nº. 49/91 of 25.01 Decree Law nº. 264/92 of 24.11 Decree Law nº. 31/98 of 11.02
Economic revaluations based on studies of expert evaluators, concerning the pro-perties owned by the company.
c) Capitalization of financial charges
The Group has not added any financial charges to projects ended during this year, according to the NCRF 10 (borrowing costs) in combination with NCRF 7 (tangible fixed assets).
11. ANNEXES
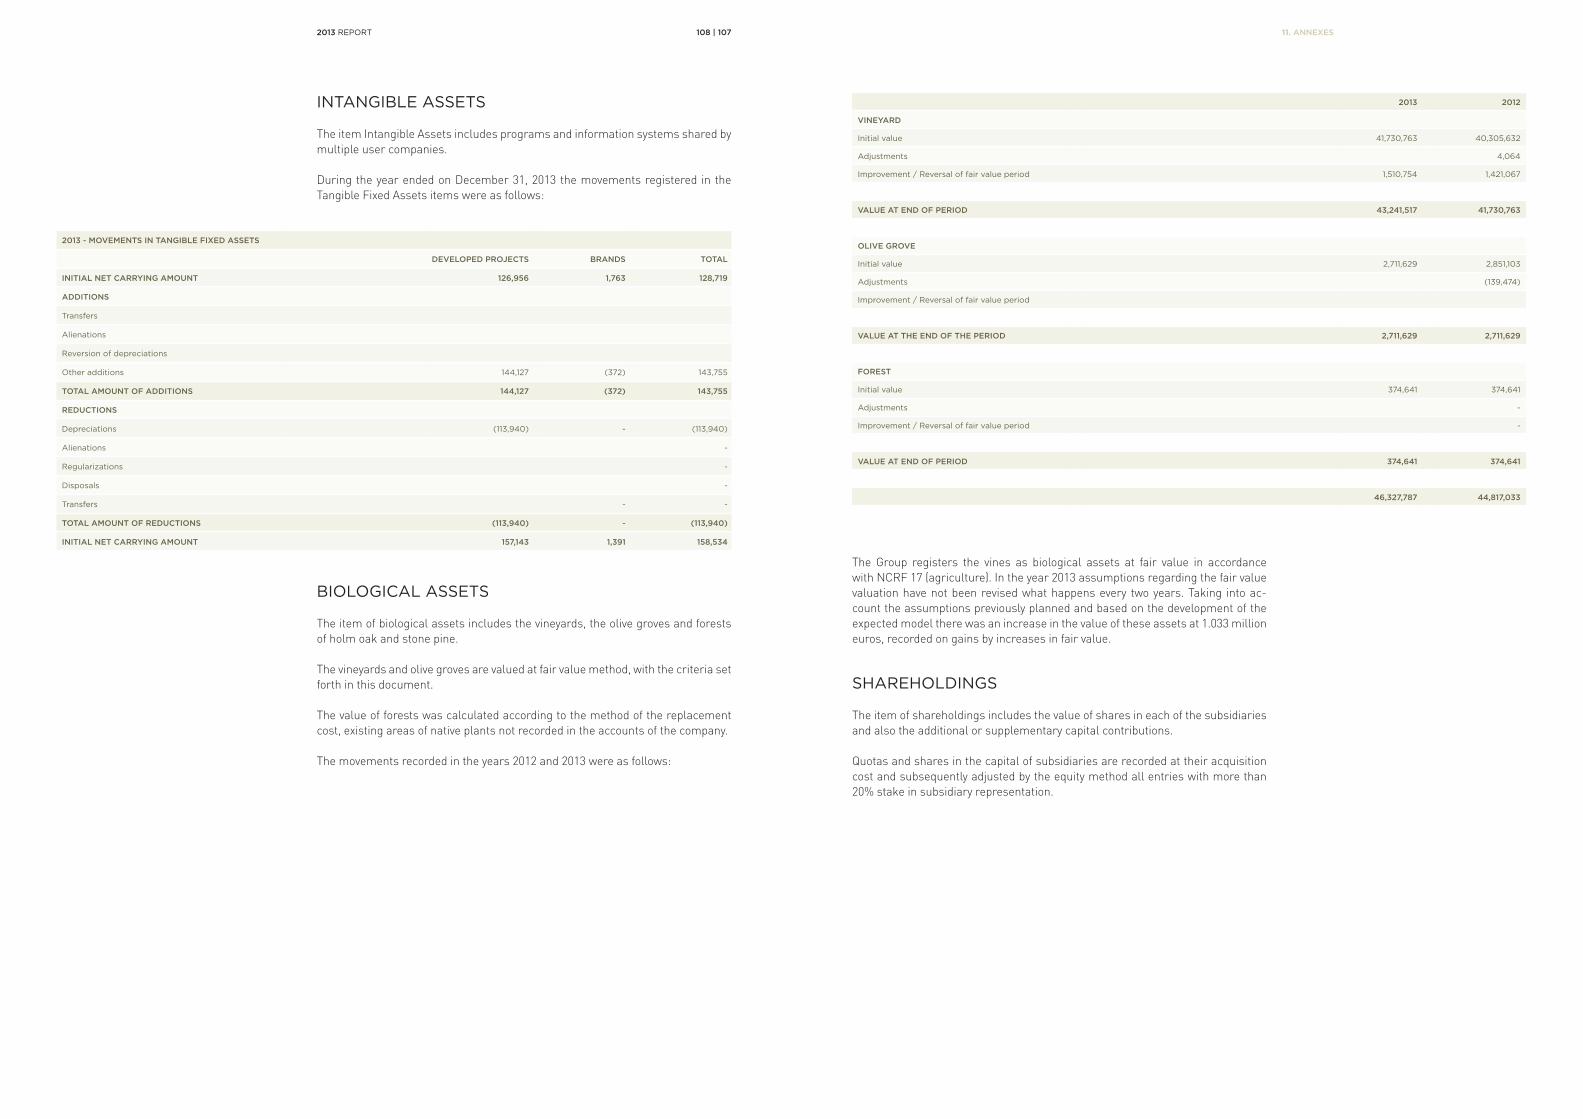
2013 REPORT 108 | 107
INTANGIBLE ASSETS
The item Intangible Assets includes programs and information systems shared by multiple user companies.
During the year ended on December 31, 2013 the movements registered in the Tangible Fixed Assets items were as follows:
2013 - MOVEMENTS IN TANGIBLE FIXED ASSETS
DEVELOPED PROJECTS BRANDS TOTAL
INITIAL NET CARRYING AMOUNT 126,956 1,763 128,719
ADDITIONS
Transfers
Alienations
Reversion of depreciations
Other additions 144,127 (372) 143,755
TOTAL AMOUNT OF ADDITIONS 144,127 (372) 143,755
REDUCTIONS
Depreciations (113,940) - (113,940)
Alienations -
Regularizations -
Disposals -
Transfers - -
TOTAL AMOUNT OF REDUCTIONS (113,940) - (113,940)
INITIAL NET CARRYING AMOUNT 157,143 1,391 158,534
BIOLOGICAL ASSETS
The item of biological assets includes the vineyards, the olive groves and forests of holm oak and stone pine.
The vineyards and olive groves are valued at fair value method, with the criteria set forth in this document.
The value of forests was calculated according to the method of the replacement cost, existing areas of native plants not recorded in the accounts of the company.
The movements recorded in the years 2012 and 2013 were as follows:
2013 2012
VINEYARD
Initial value 41,730,763 40,305,632
Adjustments 4,064
Improvement / Reversal of fair value period 1,510,754 1,421,067
VALUE AT END OF PERIOD 43,241,517 41,730,763
OLIVE GROVE
Initial value 2,711,629 2,851,103
Adjustments (139,474)
Improvement / Reversal of fair value period
VALUE AT THE END OF THE PERIOD 2,711,629 2,711,629
FOREST
Initial value 374,641 374,641
Adjustments -
Improvement / Reversal of fair value period -
VALUE AT END OF PERIOD 374,641 374,641
46,327,787 44,817,033
The Group registers the vines as biological assets at fair value in accordance with NCRF 17 (agriculture). In the year 2013 assumptions regarding the fair value valuation have not been revised what happens every two years. Taking into ac-count the assumptions previously planned and based on the development of the expected model there was an increase in the value of these assets at 1.033 million euros, recorded on gains by increases in fair value.
SHAREHOLDINGS
The item of shareholdings includes the value of shares in each of the subsidiaries and also the additional or supplementary capital contributions.
Quotas and shares in the capital of subsidiaries are recorded at their acquisition cost and subsequently adjusted by the equity method all entries with more than 20% stake in subsidiary representation.
11. ANNEXES

2013 REPORT 110 | 109
DEFERRED TAX ASSETS AND LIABILITIES
As mentioned in point 3.10. the Group is subject, from 2011, to the Special Taxation of Corporate Groups (RETGS) being the dominant entity Gesparte, S.A. and initially using the deferred tax rate of 26.5%, was updated during this exercise to 24.5%, reflecting the updating of the general income tax rate of 23%.
The movements in the item Deferred tax assets and liabilities for the years pre-sented are as follows:
HEADQUARTERS
BOOK VALUE
% OFOWNERSHIP
DATA FROM THE LAST AVAILABLE ACCOUNTS
2013 2012 EQUITY NET INCOME YEAR
SUBSIDIARIES
Esporão – Wine & Olive Oils - 16,825 16,825 100%
Primedrinks LISBOA 50% 2,848,310 195,793 2013
Value of participation 272,052 218,939
Financing loans 541,491 541,491
830,369 777,255
SUBSIDIARIES - OTHER METHODS
C.A.R.M. - 170 170
Lisgarante Totta - 38,000 38,000
Garval - 14,500 14,500
Reguengos Sustentável - 112,563
Coop Agrícola de Mourão - 15 15
ZAMAGRI - -
Ind. Council Devel. Serv. - 41,576 41,576
Caixa Cred. Agricol. Mutua - 499 499
CEPAAL - 2,000 2,000
Other companys - 65 65
96,825 209,388
INVENTORIES
The accounting policies and measurement criteria adopted in preparing the finan-cial statements are described in section 3.6. of this report.
Breakdown of the balance of inventories to 31.12.2012 and 31.12.2013:
BRANDSLAND
REVALUATIONSBIOLOGICAL
ASSETSINTAGIBLE
ASSETSNO RESULTS
NON TAXABLETOTAL
INITIAL BALANCE 26,305 2,319,520 658,476 63,092 499,396 3,566,789
Increases - - - - - -
Reversions (12,626) (175,058) (351,480) (35,242) (37,690) (612,096)
FINAL BALANCE 13,679 2,144,462 306,996 27,850 461,706 2,954,693
DEFERRED TAX LIABILITIES – 2013
NON-FISCAL REVALUATIONS
BIOLOGICAL ASSETS
INVESTMENT SUBSIDIES
NO RESULTSNON TAXABLE
TOTAL
INITIAL BALANCE 1,811,616 9,774,756 697,796 4,628 12,288,796
Increases - -
Reversions (881,646) (717,783) (286,960) (349) (1 886 738)
FINAL BALANCE 929,970 9,056,973 410,836 4 279 10 402 058
INVENTORIES 2013 2012
Goods 5,476,450 5,657,326
Raw materials 1,213,103 1,060,089
Products and work in progress 2,716,455 3,100,140
Finished products and intermediate products 18,451,402 17,733,749
By-products,waste, residue and rejects - -
27,857,410 27,551,304
CLIENTS
In the year ending December 31, 2013, the breakdown of the item Clients is as follows:
2013 2012
i)Clients - current account
<90 days 5,243,199 8,614,013
>90 e <150 days 1,377,259 112,814
>150 days 950,254 900,611
ii) Clients - receivables - -
iii) Clients - Doubtful debt 78,451 64,413
7,649,163 9,691,851
Clients impairment (78,367) (84,446)
TOTAL CLIENTS 7,570,795 9,607,405
1) Clients - Current Account: This account refers to amounts receivable by the Group on behalf of services rendered, whose deadline for receiving is substan-tially reduced
2) Clients - receivables: this item shows credits of client entities securitized in the form of letters, which had not yet been discounted to the balance sheet date
3) Doubtful debtors: Client credits for which was evaluated and identified maxi-mum risk of collectability by the Group, and these balances are fully adjusted.
11. ANNEXES

2013 REPORT 112 | 111
STATE AND OTHER PUBLIC ENTITIES
There are no debts to the State in arrears.
Decomposition of the balance at end of year:
OTHER RECEIVABLES AND PAYABLES
Breakdown of the items to December 31:
2013 2012
RECEIVABLES FROM THE STATE
VAT 534,681 625,018
Corporation income tax (deducted from advance payments to the State) 619,828 489,547
Other receivables from the State 461 -
1,154,970 1,114,565
PAYABLES TO THE STATE
Corporate income tax (deducted from advance payments to the State) -
Income tax 152,282 519,007
VAT (0) 136
Social Security Payments 113,589 125,731
Other payables to the State - -
265,870 644,874
STATE AND OTHER PUBLIC ENTITIES 889,099 469,691
2013 2012
OTHER ACCOUNTS RECEIVABLE
Non-current 24,659 49,659
Other accounts receivables
Current
Receivable amounts IFAP/INGA - 807,192
Personnel 57,337 13,210
Debtors for accruals 741,952 293,133
Other receivables 1,114,780 763,660
Impairments (17,588) (17,588)
1,921,141 1,909,266
OTHER ACCOUNTS PAYABLE
Non current
Payable amounts IFADAP -
Current
Investment suppliers 542,365 2,552,486
Remunerations payable 759,189 706,325
Interest payable 76,720 67,365
Creditors for accruals 714,865 5,660
Personnel 20,560 71,663
Other payables 563,737 555,547
2,677,436 3,959,046
TOTAL (756,295) (2,049,780)
CASH AND BANK DEPOSITS
Cash and cash equivalents that are not available for use
Esporão Group does not hold any cash fund or equivalent with restrictions on its use in the years presented.
Breakdown of values registered in the item of cash and bank deposits
On December 31, 2013, the breakdown of cash and cash equivalents are as follows:
2013 2012
CASH 37,033 30,780
Bank deposits 3,711,476 1,161,521
Other bank deposits 926,373 6,974,834
Other financial assets 495,619 618,505
CASH AND BANK DEPOSITS 5,170,501 8,785,640
SHAREHOLDERS / PARTNERS
It refers to the positive / negative balances of non-consolidated subsidiaries and of the shareholder. The breakdown is as follows at December 31:
2013 2012
SHAREHOLDERS/ PARTNERS RECEIVABLE
Current
Esporão Wines & Olive Oils 1,131 -
216,077
1,131 216,077
SHAREHOLDERS/ PARTNERS PAYABLE
Non current
Gesparte, SA 1,589,681 13,896,595
Dr. José Roquette 215,745 332,116
Current
ZAMAGRI - -
Others 2,311 14,992
1,807,737 14,243,703
TOTAL (1,806,606) (14,027,626)
11. ANNEXES

2013 REPORT 114 | 113
DEFERRALS
In the year ending December 31, 2013, the breakdown of the items of Assets and Liabilities Deferrals is as follows:
2013 2012
DEFERRED ASSETS
i) Compensations - -
ii) Other recognizable expenses 119,881 343,496
iii) OCM subsidies 82,743 312,727
202,624 656,223
DEFERRED LIABILITIES
iv) Investment subsidies 41,507 -
v) Other recognizable income (179) 72,467
41,328 72,467
I) Values in transition from E.V.M. that correspond to cost allocation and change of the distributor in Angola;
II) Amounts paid in 2012 and recognized as an expense in 2013III) Amount of subsidies granted by OCM relative to the costs of internationalizationIV) Income recognition in 2013 but received in 2012
SUPPLIERS
In the year ending December 31, 2013, the breakdown of the item Suppliers is as follows:
DESCRIPTION 2013 2012
i) Suppliers - current-account (group) - -
ii) Suppliers - current-account (Third party) 5,897,131 5,828,969
iii) Suppliers - invoice reception and conference 1,092,331 136,045
TOTAL SUPPLIERS BALANCE 6,989,462 5,965,014
i) Suppliers - current account (group): balances relating to transactions for open services between Group companies, which do not consolidate by the global in-tegration method;
ii) Suppliers - current account (third party): the item reflects commercial activities established between the Group and service providers;
iii) Suppliers - invoices reception and conference: documentation relating to tran-sactions carried out by Group companies, which remains in a state of conference at the balance sheet date. The costs of these operations were considered in this exercise, moving to the next financial year the registration of the invoice and respective payment.
FINANCING OBTAINED
Loan details as for the term (current and non-current) and by type of loan at the end of the year is as follows:
LIABILITIES NON CURRENT
LIABILITIES CURRENT
TOTAL
ESPORÃO CONSOLIDATED (COMPLETE PLAN)
Bank loans 26,651,280 10,041 291 36,692,572
Overdrafts - 5,829,235 5,829,235
Confirming - 1,666,547 1,666,547
Others 2,013
Total on December 2013 26,651,280 17,537,073 44,188,354
Total on December 2012 32,369,200 17,189,569 49,558,769
COMPOSITION OF CAPITAL
On December 31, 2013, the capital of the Esporão Group was fully subscribed and paid, represented by 1,000,000 shares with a nominal value of 5 euro each.
The movements related to adjustments and changes in equity for the year ended December 31, 2013 and 2012, are decomposed and systematized in the statement of changes in equity.
MINORITY INTERESTS
Minority interests at the date of December 31, 2013 were calculated as follows:
ESPORÃO EVM E.AZEITES MURÇAS E. BIOLÓGICA QUALIMPOR ACUMULATED
Group Net Income 1,954,191 1,073,308 56,880 67,008 75,596 408,222 3,635,205
Total Equity 55,297,633 6,372,074 26,046 3,027,243 4,926 3,438,516 68,166,438
% Ownership 100.0% 100.0% 98.0% 100.0% 100.0% 95.0%
Minority interest 0.0% 0.0% 2.0% 0.0% 0.0% 5.0%
I.M. on the result 0 0 1,138 0 0 20,411 21,549
I.M. on Equity 0 0 521 0 0 171,926 172,447
SALES AND SERVICES
The amount of Sales and Services recognized in the consolidated income state-ment by nature is detailed as follows:
2013 2012
SALES AND SERVICES
Domestic market 16,424,132 15,382,079
Intra-Community market 3,691,384 4,220,347
External markets 18,963,334 19,567,325
Provision of services 1,100,395 740,767
40,179,244 39,910,519
11. ANNEXES

2013 REPORT 116 | 115
COST OF MATERIALS CONSUMED
2013 2012
GOODS RAW MATERIALS GOODS RAW MATERIALS
COST OF USED MATERIALS
Initial inventories 5,657,326 1,060,089 7,584,974 1,027,687
Purchases 2,711,542 13,849,761 845,296 13,861,960
Reclassification and regularization of inventories - - 46,512 -
Final inventories 5,476,450 1,213,103 5,657,326 1,060,089
C.M.V.M.C. 2,892,418 13,696,747 2,819,456 13,829,558
VARIATION IN PRODUCTION
2013 2012
FINISHED PRODUCTWORK IN
PROGRESSFINISHED PRODUCT
WORK IN PROGRESS
STATEMENT OF PRODUCT VARIATION
Initial Inventories 17,733,749 3,100,140 15,892,961 2,830,254
Reclassification and regularization of inventories 71,834 (2,012,007) -
Final inventories 18,431,058 2,716,455 17,733,749 3,100,140
PRODUCTION VARIATION 769,144 (383,685) (171,219) 269,886
SUPPLIES AND EXTERNAL SERVICES
The breakdown of costs for supplies and services is as follows:
2013 2012
SUPPLIES AND EXTERNAL SERVICES
Subcontracts 98 70,339
Specialized work 1,770,962 2,457,038
Surveillance and security 48,656 45,118
Fees 1,590 14,609
Comissions 474,753 395,255
Marketing and publicity 3,234,445 2,482,135
MAINTENANCE AND REPAIRS 365,535 555,601
Buildings and others constructions 25,075 25,645
Basic equipment 299,379 501,266
Transport equipment 38,851 28,196
Others 2,231 494
Office material 19,571 17,932
Fuel 228,336 265,156
Electricity 350,594 327,513
Travel and accommodation 1,653,702 1,517,509
RENTS AND LEASES 1,308,529 1,249,938
Real estate 724,152 627,578
Vehicles 256,755 302,128
Equipment 118,627 153,808
Other rents and leases 208,995 166,425
Communication 189,099 184,872
Insurances 153,178 144,510
Expenses of representation 100,618 47,168
Other services 773,848 747,632
10,673,513 10,522,326
PERSONNEL EXPENSES
2013 2012
COSTS WITH PERSONNEL
Remuneration of corporate bodies 338,309 362,961
Remuneration of personnel 4,683,046 4,607,807
Post-employment benefits 1,200 1,000
Compensations 3,218 14,609
Charges on Remuneration 966,750 1,021,891
Insurance for work accidents and professional diseases 83,210 134,894
Expenses with social action 9,982 10,530
Other costs with personnel 159,737 154,444
6,245,451 6,308,137
OTHER INCOME AND GAINS
2013 2012
OTHER INCOME AND EARNING
Supplementary income 281,764 375,511
Prompt payment discounts 98,269 223
Investment subsidy 373,909 309,087
Income and earnings in financial investments 79,911 25,470
Income and earnings in non financial investments 1,237 8,432
Other income and earnings 117,564 157,510
952,654 876,233
OTHER EXPENSES AND LOSSES
2013 2012
OTHER COSTS AND LOSSES
Taxes 480,695 511,299
Donations 42,522 46,050
Offers and samples from stock 587,247 431,084
Disposal of tangible assets 124,190 78,387
Unfavorable foreign exchange differences 195,329 176,116
Other costs and losses 367,563 -
1,797,547 1,242,935
FINANCIAL INCOME AND EXPENSES
2013 2012
OBTAINED INTEREST AND SIMILAR INCOME
Obtained interest 31,618 34,914
Other income and financial earnings 8,957 22
40,575 34,936
INTEREST AND SIMILAR COSTS PAID
Interest paid 2,579,403 2,514,172
Other costs and financing losses 578,145 433,491
3,157,548 2,947,663
11. ANNEXES
2013 REPORT 118 | 117
Expenses and financial costs include costs associated with financing agreements, including management fees, immobilization, opening and organizing the process, stamp duty, and others.
REMUNERATION OF CORPORATE BODIES
The remuneration paid to the members of the board of directors of Esporão, SA amounts to 310.711 Eur.
Total fees related to compliance with supervisory duties paid to the Auditor for the financial year 2013, amount to 37 600 Eur.
AUTHORIZATION TO ISSUE
The Consolidated Financial Statements for the year ended December 31, 2013 were approved by the Board of Directors and authorized for issue on March 18, 2013.
It is the opinion of the Board that the financial statements reflect truly and fairly the Group’s operations and its financial position, performance and cash flows.
Lisboa, March 18, 2014
The Board