essays in comparative economic development alberto...
TRANSCRIPT

Essays in comparative economic development
Alberto Basso
Essays in comparative economic development
Alberto Basso
Supervisor: Dr. David Cuberes
A thesis submitted to
the Departamento de Fundamentos del Análisis Económico
Universidad de Alicante
In partial fulfilment of the requirements for the degree of
Doctor of Philosophy
March 2013


To my family


Acknowledgements
I am grateful to my advisor, David Cuberes, for his support and advice throughout my graduatestudies. I am indebted also to Carl-Johan Dalgaard for his guidance during my visiting period
at the Department of Economics of the University of Copenhagen in the Fall of 2012.
Many thanks go to the faculty members of the Departamento de Fundamentos del AnálisisEconómico at the University of Alicante: in particular, Sonia Oreffice, Climent
Quintana-Domeque, Pedro Albarran, Asier Mariscal, and Marc Teignier.
I thank Jacob Weisdorf, Fabrice Murtin, the participants to the "7th Sound Economic HistoryWorkshop" in Tampere and to the MEHR seminar in Copenhagen for helpful comments and
suggestions.
Many thanks go to the staff of the Departamento de Fundamentos del Análisis Económico, inparticular Marilo Rufete and Josefa Zaragoza.
My appreciation and gratitude go to my classmates for their help, company and friendship: inparticular, Nathan, Serafima, Xavier, Victor, MJosé, Danilo and Fernando.

Contents
Introducción ix
0.1 Transición de la fecundidad y el compromiso cantidad-calidad: evidencia históricaen España . . . . . . . . . . . . . . . . . . . . . . . . . . . . . . . . . . . . . . . . xi
0.2 La cantidad afecta a la calidad: fecundidad, educación, y género en la España de1887 . . . . . . . . . . . . . . . . . . . . . . . . . . . . . . . . . . . . . . . . . . . xvi
0.3 Capital humano, cultura y el comienzo de la transición de la fecundidad . . . . . xviii
1 Fertility transition and the quantity-quality trade-off: historical evidence fromSpain 1
1.1 Introduction . . . . . . . . . . . . . . . . . . . . . . . . . . . . . . . . . . . . . . . 1
1.2 Conceptual framework . . . . . . . . . . . . . . . . . . . . . . . . . . . . . . . . . 5
1.2.1 Motivation . . . . . . . . . . . . . . . . . . . . . . . . . . . . . . . . . . . 5
1.2.2 Literature review . . . . . . . . . . . . . . . . . . . . . . . . . . . . . . . . 7
1.3 Data description . . . . . . . . . . . . . . . . . . . . . . . . . . . . . . . . . . . . 9
1.4 Empirical strategy . . . . . . . . . . . . . . . . . . . . . . . . . . . . . . . . . . . 11
1.4.1 Framework . . . . . . . . . . . . . . . . . . . . . . . . . . . . . . . . . . . 13
1.4.2 Instrument choice . . . . . . . . . . . . . . . . . . . . . . . . . . . . . . . . 14
1.5 Evidence on fertility transition and quantity-quality trade-off . . . . . . . . . . . 18
1.5.1 Panel analysis: OLS . . . . . . . . . . . . . . . . . . . . . . . . . . . . . . 18
1.5.2 Panel analysis: 2SLS . . . . . . . . . . . . . . . . . . . . . . . . . . . . . . 21
1.5.3 Long-time differences: 2SLS, 3SLS and robustness checks . . . . . . . . . 24
1.5.4 Long-time differences: spatial diffusion . . . . . . . . . . . . . . . . . . . . 26
1.6 Conclusion . . . . . . . . . . . . . . . . . . . . . . . . . . . . . . . . . . . . . . . . 31

0 Contents
2 Quantity affects quality: fertility, education, and gender in 1887 Spain 33
2.1 Introduction . . . . . . . . . . . . . . . . . . . . . . . . . . . . . . . . . . . . . . . 33
2.2 Data and empirical strategy . . . . . . . . . . . . . . . . . . . . . . . . . . . . . . 38
2.2.1 Data . . . . . . . . . . . . . . . . . . . . . . . . . . . . . . . . . . . . . . . 38
2.2.2 Empirical strategy . . . . . . . . . . . . . . . . . . . . . . . . . . . . . . . 40
2.3 Quantity and quality of children: results . . . . . . . . . . . . . . . . . . . . . . . 41
2.3.1 Allowing for spatial dependence . . . . . . . . . . . . . . . . . . . . . . . . 48
2.4 Conclusion . . . . . . . . . . . . . . . . . . . . . . . . . . . . . . . . . . . . . . . . 51
3 Human capital, culture and the onset of the fertility transition 53
3.1 Introduction . . . . . . . . . . . . . . . . . . . . . . . . . . . . . . . . . . . . . . . 53
3.2 Literature review . . . . . . . . . . . . . . . . . . . . . . . . . . . . . . . . . . . . 59
3.3 Data and methodology . . . . . . . . . . . . . . . . . . . . . . . . . . . . . . . . . 61
3.3.1 Baseline analysis . . . . . . . . . . . . . . . . . . . . . . . . . . . . . . . . 61
3.3.2 Bilateral analysis . . . . . . . . . . . . . . . . . . . . . . . . . . . . . . . . 62
3.3.3 Robustness checks . . . . . . . . . . . . . . . . . . . . . . . . . . . . . . . 63
3.4 Results: genetic distance to the technological frontier and the onset of fertilitytransition . . . . . . . . . . . . . . . . . . . . . . . . . . . . . . . . . . . . . . . . 67
3.4.1 Baseline analysis . . . . . . . . . . . . . . . . . . . . . . . . . . . . . . . . 67
3.4.2 Bilateral analysis . . . . . . . . . . . . . . . . . . . . . . . . . . . . . . . . 69
3.4.3 Robustness checks . . . . . . . . . . . . . . . . . . . . . . . . . . . . . . . 69
3.5 Verification of the mechanism: genetic distance to technological frontier, educationand fertility transition . . . . . . . . . . . . . . . . . . . . . . . . . . . . . . . . . 72
3.6 Conclusion . . . . . . . . . . . . . . . . . . . . . . . . . . . . . . . . . . . . . . . . 74
Bibliography 79
viii
Introducción
Esta Tésis Doctoral está compuesta de tres capítulos que tratan temas relacionados con el estu-
dio de las diferencias en los niveles de desarrollo entre areas geográficas. La literatura económica
sobre el desarrollo comparativo es amplia y propone diferentes mecanismos basados en factores
culturales, institucionales, geográficos, climáticos, etc., para explicar diferentes patrones de de-
sarrollo. En este ámbito está creciendo el interes sobre el papel jugado por el proceso de transición
de fecundidad y la interacción entre la cantidad y la calidad de los hijos, es decir, el concepto de
quantity-quality trade-off. Como consecuencia de esto, el estudio de las causas de los procesos de
transición demográfica, en particular de la transición de fecundidad, en economía ha crecido en
importancia en los últimos años. La identificación de los factores que explican este fenómeno es
importante para mejorar nuestra comprensión del proceso de desarrollo entre los países y dentro
de ellos mismos. Además, nos ayuda a entender por qué algunos países han tenido éxito y otros
no. Los economistas se han centrado en el análisis de varios factores para explicar el descenso de
la fecundidad: entre los más estudiados estan el aumento de la inversión en la educación de los
hijos (es decir un incremento en la calidad), el descenso de la mortalidad infantil, y el cambio
del papel jugado por las mujeres en la sociedad. De estos factores, el incremento de la inversión
en la calidad de los hijos aparece como el más interesante, debido al reciente desarrollo de la
teoría unificada del desarrollo (unified growth theory) por Galor y Weil (2000). Esta teoría está
basada en un modelo teórico que describe el proceso de desarrollo y el cambio de una fase de
subsistencia (pre-malthusiana) a una de crecimiento económico (post-malthusiana). El mecan-
ismo fundamental de esta teoría se centra en el papel jugado por el progreso tecnológico en el
0 Introducción
fomento de la demanda de capital humano. Debido a la mayor remuneración de la educación, los
hogares reaccionan invirtiendo más recursos en la calidad de su hijos, reduciendo así su cantidad
para mantener el equilibrio presupuestario. Desde el trabajo de Galor y Weil, varios economistas
han analizado los procesos de transición en la fecundidad. Algunos ejemplos de análisis histórico
de los determinantes del descenso de la fecundidad son Bleakley y Lange (2009), Murphy (2010)
y Murtin (próximamente). Además, varios estudios se han centrado específicamente en la carac-
terización del compromiso cantidad-calidad en contextos históricos como, por ejemplo, Becker,
Cinnirella y Woessmann (2010), Klemp y Weisdorf (2011).
El objetivo de esta tésis es ampliar el análisis empírico sobre los procesos de transición de fe-
cundidad y el compromiso cantidad-calidad teniendo en cuenta los resultados de la investigación
económica reciente. Sin embargo, uno de los principales problemas a los que se enfrentan las
investigaciones empíricas que estudian el desarrollo comparativo es la dificultad en la contabi-
lización de toda la heterogeneidad que hay, entre las areas geográficas utilizadas como unidades
de análisis, y que podría ser responsable de los diferentes patrones de desarrollo. Una manera
de resolver parcialmente esta cuestión es explotar la variación en el tiempo y así poder tener en
cuenta todos los factores históricos, culturales, climáticos y geográficos que se pueden considerar
constantes en un período de tiempo. El primer capítulo de esta tésis - titulado Transición de la
fecundidad y el compromiso cantidad-calidad: evidencia histórica en España - utiliza esta estrate-
gia para analizar las causas del comienzo del proceso de transición de la fecundidad en España.
El estudio se centra en las primeras dos décadas del siglo XX y está realizado usando datos a
nivel provincial. El análisis se caracteriza por el papel jugado por los aumentos de la inversión en
la educación de los hijos como uno de los factores claves para explicar el descenso en la fecundidad.
Una segunda manera para afrontar el problema mencionado anteriormente es centrarse en analizar
zonas geográficas bastante homogéneas, como por ejemplo explotando las diferencias que hay en-
tre áreas dentro de cada país. El segundo capítulo de esta tésis, titulado La cantidad afecta a
la calidad: fecundidad, educación, y género en la España de 1887, analiza y caracteriza el com-
promiso cantidad-calidad de los hijos utilizando datos a nivel de distrito (partido judicial) en el
año 1887. En particular, se estudia el impacto de la fecundidad sobre los niveles de educación
x

0 Introducción
infantil distinguiendo el efecto por género.
Finalmente, el tercer capítulo de esta tésis, titulado Capital humano, cultura y el comienzo de
la transición de la fecundidad, en colaboración con David Cuberes analiza la interacción entre
factores culturales, acumulación de capital humano y el comienzo del proceso de transición de la
fecundidad a lo largo de diferentes países del mundo. En particular, la evidencia empírica sugiere
que una gran distancia genética, utilizada como medida de diferencias culturales, con respecto
a la frontera tecnológica (Reino Unido o Estados Unidos) retrasa el comienzo de la transición
demográfica de un país. Este resultado se puede explicar con un mecanismo indirecto que opera
a través de la difusión tecnológica sugerido por Spolaore y Wacziarg (2009). Una mayor distancia
cultural de la frontera tecnológica tiende a retrasar la adopción de tecnología, disminuyendo la
demanda de capital humano. En consecuencia, este patrón conduciría a un inicio tardío en la
transición de la fecundidad. El mecanismo sigue el trabajo de Galor y Weil (2000) que argumen-
tan que los avances tecnológicos aumentan la demanda de capital humano y, debido a la mayor
remuneración de la educación, los hogares tienden a intercambiar la cantidad por la calidad de
los hijos. Cuando una fracción significativa de las familias decide tener menos hijos pero más
educados, tiene lugar el inicio de la transición de la fecundidad. A continuación se describe de
manera más detallada el análisis realizado en cada capítulo.
0.1 Transición de la fecundidad y el compromiso cantidad-calidad:
evidencia histórica en España
El estudio de los fenomenos de transición de fecundidad ha proporcionado diferentes factores
explicativos. En este capítulo se estudia la relación entre los cambios en la educación, es decir,
la alfabetización, de los hijos y los cambios en la fecundidad de los padres utilizando datos a
nivel provincial en España durante el período 1900-1920. En este estudio se considera un período
alrededor del inicio de la transición demográfica en España para comprender sus factores des-
encadenantes. En particular, nos centramos en un mecanismo específico: la interacción entre
la calidad y la cantidad de los hijos. De acuerdo con este mecanismo, un incremento en la es-
xi
0 Introducción
colarización de los hijos afecta a la decisión de los padres sobre su fecundidad. Varios factores
podrían inducir a los padres a invertir más en la educación de sus hijos. Entre estos factores
se encuentra un incremento en la demanda de capital humano que aumentaría la remuneración
de la educación y por lo tanto la asistencia escolar. Sin embargo, las reformas educativas y los
cambios en las leyes de escolarización obligatoria también afectan a las decisiones de los hogares
sobre la educación de sus hijos. A principios del siglo XX, en España tuvo lugar una amplia
reforma del sistema escolar, que incluye la creación del Ministerio de Educación Pública en 1900
y la extensión de la edad de escolarización obligatoria de 6-9 a 6-12 años en 1909. El nuevo
sistema, llamado Escuelas graduadas, separaba a los estudiantes en clases diferentes según la
edad y el nivel educativo. El sistema anterior, llamado Escuelas unitarias, agrupaba a los estudi-
antes independientemente de su edad y capacidad. Sin embargo, el desarrollo del nuevo sistema
fue lento debido a los limitados recursos financieros y a las presiones provenientes de sectores
tradicionales que trataron de evitar cambios radicales. Explotando la variación regional entre
provincias en la demanda y en la oferta local de educación, estrechamente relacionados con la
reacción a las reformas educativas, se estudia si los cambios en la educación de los hijos estan
relacionados con los cambios en la fecundidad.
Uno de los primeros estudios sobre la natalidad, el Princeton European Fertility Project (EFP en
lo sucesivo), identificó factores culturales y sociológicos como clave para el proceso de reducción
de la fecundidad en Europa (por ejemplo, Coale y Watkins 1986). El propósito del EFP era
caracterizar la reducción de las tasas de natalidad que se inició en Europa en los siglos XIX y
XX. Sus conclusiones finales sugieren que las variables socioeconómicas desempeñaron un papel
de escasa importancia en el desencadenamiento de las transiciones de fecundidad en los países
europeos. No obstante, estudios posteriores han señalado varios defectos en el análisis utilizado
en el EFP, que podrían ser la causa de este hallazgo. Entre estos estudios, Brown y Guinnane
(2007) ponen de relieve los principales problemas estadísticos relacionados con la metodología
del EFP. En primer lugar, según los autores las unidades estadísticas de análisis están muy
agregadas. En segundo lugar, y más importante desde el punto de vista de este estudio, la mod-
elización del cambio de la natalidad en el tiempo. El enfoque del EFP no parece en consonancia
xii

0 Introducción
con el concepto de transición de la fecundidad, debido a que cambios en el comportamiento de
la fecundidad deberian ser causados por cambios en las variables explicativas. Varios estudios
que han examinados las causas de los cambios de fecundidad han encontrado que las variables
económicas han desempeñado un papel importante (por ejemplo, Galloway, Lee y Hammel 1994;
Brown y Guinnane 2002). Además, Brown y Guinnane (2007) subrayan que la mayoría de los
estudios del EFP se basan en simples correlaciones, por lo que adolecen de varios problemas tales
como la causalidad inversa y el sesgo de variables omitidas.
Estudios recientes, que abordan varios de los defectos mencionados anteriormente, han propor-
cionado evidencia histórica que sugiere la existencia de un compromiso cantidad-calidad y han
destacado su papel en el desencadenamiento del descenso de la fecundidad. Entre estos Bleakley
y Lange (2009) exploran el efecto causal de la educación infantil sobre la fecundidad mediante la
explotación de la política de erradicación de la anquilostomiasis en los estados del sur de América
del Norte en 1910. Su estudio sostiene que esta erradicación aumentó la remuneración de la ed-
ucación y por lo tanto redujo el precio de la calidad de los hijos. Como consecuencia, tuvo lugar
un aumento de la asistencia escolar y una reducción de la fecundidad. Murphy (2010) encuentra
evidencia que los factores económicos y culturales han afectado a los cambios en la fecundidad a
lo largo de los departamentos francéses a finales del siglo XIX. En particular, la asistencia a la es-
cuela primaria está asociada negativamente con la fecundidad. Becker, Cinnirella y Woessmann
(2010) utilizan datos de los condados de Prusia en 1849 e identifican una relación negativa entre
la cantidad de hijos y la asistencia a la escuela en un contexto en el que la transición demográfica
aún no ha tenido lugar. También destacan que el nivel inicial de la educación es un buen pre-
dictor de la transición de la fecundidad que se produjo en Prusia durante el período 1880-1905.
Klemp y Weisdorf (2011) encuentran un impacto negativo significativo del tamaño de la familia
sobre la alfabetización de los hijos a partir de datos procedentes de los registros parroquiales
anglicanos en Inglaterra durante el período 1700-1830. Por último, Fernihough (2011) encuentra
evidencia de compromiso cantidad-calidad a partir de datos censales para Irlanda en 1911. En
concreto, utilizando datos de Belfast y Dublín, encuentra que el aumento de la fecundidad redujo
la probabilidad de asistencia escolar.
xiii
0 Introducción
En la literatura económica no se encuentran estudios centrados en analizar el papel desempeñado
por los cambios provocados por la educación de los hijos sobre la fecundidad en España a partir
de datos históricos a nivel provincial. Los estudios previos sobre los determinantes de los niveles
de fecundidad en las provincias españolas en la primera parte del siglo XX proporcionan una
imagen desconcertante (Leasure 1963; Reher y Iriso Napal-1989). Por un lado, los diferentes
contextos culturales y linguísticos parecen importantes en determinar los niveles de la fecundi-
dad en las distintas provincias. Por otro lado, el papel jugado por los factores socioeconómicos
es incierto. Concretamente, con respecto a la educación, no hay una relación inequívoca en-
tre los niveles de educación y los niveles de fecundidad. Los estudios empíricos recientes sobre
transiciones de fecundidad y el compromiso calidad-cantidad se han centrado principalmente en
analizar los países de Europa septentrional y central. Este trabajo contribuye a ampliar el análi-
sis e incluir el sur de Europa, concretamente España, que es un área periférica con respecto al
proceso histórico de industrialización. Además, este trabajo afronta tres cuestiones principales
que la literatura económica reciente ha señalado. En primer lugar, se aborda el posible sesgo
debido a la omisión de las diversidades culturales y de las características históricas utilizando
datos de panel y estimando un modelo empírico con efectos fijos (por ejemplo, Galloway, Lee y
Hammel 1994). La omisión de las características culturales e históricas está relacionada tambien
con un problema conceptual. Con el fin de captar los factores responsables de la transición de la
fecundidad, este estudio se centra en explicar los cambios de la fecundidad en lugar de los niveles.
Esto significa implícitamente que el análisis tiene en cuenta los factores históricos y culturales
que son constantes en cada provincia y que pueden afectar tanto a la educación de los hijos como
a la fecundidad de los padres. En cuanto a la alfabetización, varias características específicas de
cada provincia pueden ser responsables de los niveles educativos infantiles tales como, por ejem-
plo, los sistemas de cultivo y las prácticas agrícolas. Estas características son particularmente
importantes ya que afectan a la productividad agrícola y a la demanda de trabajo infantil. A
su vez, éstas dependen fundamentalmente de las condiciones geográficas y climáticas que pode-
mos considerar como constantes en el tiempo. Entonces comparar simplemente los niveles de
educación y de fecundidad entre las provincias llevaría a ignorar algunas de las fuerzas que son
xiv
0 Introducción
responsables de la alfabetización infantil y de la fecundidad. En segundo lugar, se aborda el
sesgo de la endogeneidad debido a errores de medición, a variables omitidas y al problema de
causalidad inversa utilizando estimaciones de variables instrumentales (por ejemplo, Brown y
Guinnane 2002). El problema de endogeneidad puede tener varios orígenes. Entre estos se en-
cuentra la causalidad inversa que existe entre la fecundidad y la educación de los hijos. Además,
el error de medición, de los datos históricos y de censo utilizados en este estudio, es probable
que afecte los valores tomados por las variables. Finalmente, el problema de variables omitidas
debido a la falta de datos también es susceptible de afectar al análisis empírico. Para hacer
frente a estos problemas y para establecer una relación causal entre cambios en la alfabetización
infantil y cambios en la fecundidad este estudio explota diferentes estrategias de variables instru-
mentales (IV). En concreto, se instrumenta la alfabetización de los hijos con medidas directas
e indirectas de apoyo local a la educación. La medida indirecta de apoyo local a la educación
está definida como la cuota de propietarios de ganado, de tamaño medio-grande, en 1865. Esta
medida es parecida a otras ya utilizadas en estudios recientes (Galor, Moav y Vollrath 2009;
Becker, Cinnirella y Woessmann 2010). Según Galor, Moav y Vollrath (2009), la desigualdad en
la distribución de la propiedad de la tierra retrasa el desarrollo de instituciones que promuevan
la acumulación de capital humano. Este fenomeno es debido al hecho de que los grandes ter-
ratenientes no se beneficiarían de la acumulación de capital humano ya que este último no es
complementario a la tierra en su función de producción. Siguiendo este razonamiento, Becker,
Cinnirella y Woessmann (2010) utilizan la proporción de grandes proprietarios como instrumento
para la asistencia escolar infantil para estimar el efecto causal de la educación de los hijos sobre la
fecundidad en la Prusia del siglo XIX. Desafortunadamente, no existen datos sobre la propiedad
de la tierra a nivel provincial para España en el siglo XIX. Sin embargo, en 1865 se llevó a cabo
un Censo de Ganadería. Suponiendo que la propiedad del ganado, especialmente de los animales
empleados principalmente en agricultura, va junta, o, por lo menos, está bien correlacionada,
con la propiedad de la tierra, ésta puede ser utilizada para construir un instrumento para los
cambios en la educación infantil en el período 1900-1920. La medida directa de apoyo local a
la educación está definida como la inversión en educación financiada por las autoridades locales
xv
0 Introducción
dividida por el número de hijos en la edad comprendida entre 5-15. Es factible pensar que la
inversión financiada localmente afecte a las decisiones de fecundidad sólo a través de su efecto
sobre la decisión de los padres de enviar a sus hijos a la escuela, es decir, lo que desencadena el
compromiso cantidad-calidad. Finalmente, se tiene en cuenta el papel jugado por el proceso de
difusión espacial (por ejemplo, Murphy 2010). La cuestión de la difusión (o dependencia) espacial
se refiere a la presencia de patrones geográficos en los descensos de fecundidad. La difusión de
nuevas normas sociales y culturales puede ser responsable de tales patrones espaciales, los cuales
reflejan, por ejemplo, nuevas actitudes hacia las prácticas de control de la natalidad inducidas
por un proceso de modernización.
0.2 La cantidad afecta a la calidad: fecundidad, educación, y
género en la España de 1887
En 1857 la Ley Moyano estableció en España la asistencia escolar obligatoria para los hijos de
edades comprendidas entre los 6 y 9 años. Sin embargo, treinta años después la alfabetización
infantil era aún relativamente baja. En 1887 la alfabetización infantil, definida como la propor-
ción de hijos que sabian leer y escribir de edad entre los 5 y 15 años, era alrededor del 24%.
Las diferencias de género eran evidentes: la alfabetización masculina (29%) era superior a la
femenina (19%).
Los niveles educativos de los hijos son generalmente utilizados para medir su calidad. La for-
malización de la teoría de la demanda de hijos y del compromiso cantidad-calidad como un
mecanismo económico se remonta a la teoría de la familia de Gary Becker (por ejemplo, Becker
y Lewis 1973; Becker 1981). La mayoría de los estudios que investigan el efecto del tamaño de la
familia (cantidad) sobre la calidad de los hijos utiliza datos modernos (por ejemplo Angrist, Lavy
y Schlosser 2005; Black, Devereux y Salvanes 2005). Este estudio está relacionado estrechamente
con la literatura económica reciente que se centra en el análisis del compromiso cantidad-calidad
en un contexto histórico. El objetivo de este capítulo es estudiar la relación entre el nivel de
educación de los hijos y el nivel de fecundidad de los padres utilizando datos a nivel de distri-
xvi

0 Introducción
tos en España a finales del siglo XIX. Los datos utilizados en el análisis empírico provienen del
censo de población de 1887 que proporciona datos a nivel de distrito (o partido judicial). Estas
unidades, mucho más pequeñas en tamaño que las provincias, permiten lograr una muestra de
más de 400 observaciones. El uso de estas unidades estadísticas de análisis reduce los problemas,
típicos de la macroeconomía, relacionados con unidades de análisis demasiado agregadas. Para
medir la cantidad de hijos, la variable utilizada es la relación hijo-mujer calculada de dos modos
diferentes: como el número de hijos de edad 0-5 dividido por el número de mujeres de edad 16-45
y como el número de hijos de edad 6-15 dividido por el número de mujeres de edad 21-50. La
segunda medida incluye a los hijos de edad comprendida entre 6 y 15 años con el fin de eliminar
el impacto de las tasas de mortalidad infantil sobre la fecundidad, de manera que se captura
exclusivamente el número de hijos supervivientes. La calidad de los hijos es representada por la
proporción de hijos alfabetizados, es decir, capaces de leer y escribir, de edad comprendida entre
5 y 15 años. Éste parece ser un buen indicador tanto de la asistencia a la escuela primaria y
de su terminación, ya que la alfabetización es uno de los principales resultados de la enseñanza
primaria y la enseñanza obligatoria en 1887 se limitaba a hijos de edad entre los 6 y 9 años. Se
consideran tres diferentes medidas de alfabetización infantil: una que incluye tanto a los hijos
como a las hijas, una que incluye sólo a las hijas, y otra que considera exclusivamente a los hijos.
El análisis empirico está desarrolado en tres partes. La primera parte estudia la correlación entre
el nivel de fecundidad y el nivel de educación de los hijos usando estimaciones de MCO (Mini-
mos Cuadrados Ordinarios). La segunda parte aborda el sesgo de la endogeneidad debido a los
errores de medición, a las variables omitidas y a la causalidad inversa mediante estimaciones de
variables instrumentales. La variable utilizada para construir el instrumento para los niveles de
la fecundidad es la relación entre mujeres y hombres (RMH de aquí en adelante) en la población
adulta, es decir, de edad comprendida entre 21 y 50 años. La RMH en la población adulta quiere
identificar una variación exógena en los niveles de fecundidad. Esta estrategia está empleada en
otro trabajo reciente, Becker, Cinnirella y Woessmann (2010), que estudia el mismo fenómeno
pero a lo largo de los condados de Prusia en el siglo XIX. La evidencia empírica sugiere que la
fecundidad tuvo un efecto negativo sobre las tasas de alfabetización de los hijos, mientras este
xvii

0 Introducción
efecto parece menos importante en el caso de las hijas. Por un lado, el impacto significativo de la
cantidad de hijos sobre la educación de los varones confirma la existencia de un compromiso entre
cantidad y calidad en un contexto histórico como España a finales del siglo XIX. Por lo tanto,
cuando los padres tenian familias más numerosas, los hijos varones eran más propensos a ser
analfabetos. Por otro lado, este resultado es consistente con la existencia de una heterogeneidad
cultural entre las areas geográficas de España en el papel jugado por la mujer en la sociedad.
Este resultado sugiere que la fecundidad, a través de un mecanismo presupuestario y económico,
no estaba entre los principales determinantes de la escolarización de las hijas.
0.3 Capital humano, cultura y el comienzo de la transición de la
fecundidad
La transformación de una economía de una fase de estancamiento malthusiano a una fase de crec-
imiento está fundamentalmente vinculada al proceso de transición de la fecundidad. Cambiando
la relación entre ingresos y fecundidad de positiva a negativa, esta transición tiene un papel
clave en el fomento de la inversión en el capital humano y en el crecimiento económico a largo
plazo (por ejemplo Galor y Weil 1999, 2000). Como consecuencia, se observa que los países que
experimentaron primero el inicio de la transición de la fecundidad son relativamente más ricos y
más desarrollados que los que lo experimentaron más tarde o que aún no lo han experimentado.
El comienzo de la transición en la fecundidad difiere ampliamente entre países. Reher (2004) ha
estimado los años en los cuales los diferentes países alcanzaron su transición demográfica. Según
estas estimaciones, la mayoría de los países que experimentaron la transición a finales del siglo
XIX y a principios del siglo XX se encuentran en Europa occidental. En cambio, la mayoría
de los países que experimentaron una transición tardía, es decir, después de 1950, pertenecen a
Asia, África y América Latina.
Una parte reciente de la literatura económica enfatiza el papel jugado por los factores culturales
para explicar los diferentes niveles de desarrollo económico entre países (Guiso, Sapienza y Zin-
gales 2006; Spolaore y Wacziarg 2009). El trabajo de Spolaore y Warcziarg (2009) muestra que
xviii

0 Introducción
una fracción significativa de las diferencias de ingresos entre los países se puede explicar utilizando
su distancia genética en relación con el país que se ecuentra en la frontera tecnológica. Según la
opinión de los autores esta medida debería captar las barreras en la adopción y difusión de nuevas
tecnologías desde el país que se encuentra en la frontera tecnológica. La medida de distancia
genética pretende capturar una relación general y cultural entre poblaciones. Las poblaciones
que se encuentran más cercanas en términos de distancia genética tienen menores diferencias en
los rasgos y en las normas sociales tales como, por ejemplo, creencias y hábitos. Por otro lado,
la literatura destaca también el papel histórico jugado por la acumulación de capital humano en
el proceso de desarrollo de un país. La expansión de la educación es a menudo considerada como
uno de los factores fundamentales en el desarrollo económico. Análisis comparativos sugieren que,
entre varios factores, las diferencias históricas en el capital humano pueden ser responsables de
los diferentes patrones de desarrollo observados durante y después del período de la colonización.
Por ejemplo, Glaeser, La Porta, Lopez-de-Silanes y Shleifer (2004) sostienen que los colonos eu-
ropeos trajeron consigo su capital humano donde se establecieron en gran número, fomentando
así el progreso tecnológico, el crecimiento económico y la formación de mejores instituciones.
Varios mecanismos han sido propuestos para explicar el fenomeno de descenso en la fecundidad.
Entre estos se encuentran un aumento de la inversión en la calidad de los hijos debida a un
incremento de la demanda del capital humano por el efecto de los avances tecnológicos (Galor y
Weil 2000), un aumento de los ingresos durante el período de industrialización (Becker y Lewis,
1973; Becker 1981), una reducción de la tasa de mortalidad infantil que reduce los motivos pre-
ventivos y de reemplazo (Coale 1973; van de Walle 1986; Sah 1991; Galloway, Lee y Hammel
1998; Eckstein, Mira y Wolpin 1999; Kalemli-Ozcan 2002; Angeles 2010); una reducción de las
brechas de género que provoca un cambio en el papel jugado por las mujeres en la sociedad
(Galor y Weil 1996; Goldin 1990; Lagerlöf 2003). Trabajos recientes como aquellos realizados
por Guinnane (2011) y Galor (2012) analizan en detalle las teorías y los estudios empíricos que
se han centrado en explicar los factores detrás de las transiciónes en la fecundidad.
En este estudio se explotan las variaciones en los factores culturales y en el capital humano entre
países para determinar los factores explicativos del comienzo de las transiciones de la fecundidad
xix

0 Introducción
en el mundo. El objetivo es explorar la contribución de una variable específica en el proceso de
transición demográfica y racionalizar el mecanismo a través del cual ha operado. En concreto, el
análisis se centra en la relación cultural de un país con la frontera tecnológica y en mostrar que
su impacto puede atribuirse a su efecto sobre la acumulación de capital humano. Tras el estudio
de Warcziarg y Spolaore (2009), que utilizan la distancia genética con respecto a Reino Unido
(UK) y a Estados Unidos (EE.UU.) como una medida de la relación cultural con la frontera
tecnológica, este trabajo estudia si la distancia genética de Reino Unido (o EE.UU.) ha sido un
factor importante en determinar las diferencias en el comienzo de la transición de la fecundidad
entre países. Este hecho se puede explicar con un mecanismo indirecto que opera a través de
la difusión de tecnologías como el sugerido por Spolaore y Wacziarg (2009, 2011). Una mayor
distancia cultural con respecto a la frontera tecnológica retrasaría la adopción de tecnología y
disminuiría la productividad y la demanda del capital humano. Como consecuencia, este patrón
conduciría a un inicio tardío de la transición en la fecundidad. El mecanismo empleado aquí sigue
el trabajo de Galor y Weil (2000). Éstos argumentan que los avances tecnológicos aumentan la
demanda del capital humano y, debido a la mayor remuneración de la educación, los hogares
intercambian la cantidad por la calidad de los hijos. Cuando una fracción significativa de las
familias decide tener menos hijos pero más educados, tiene lugar el inicio de la transición en la
fecundidad. Por lo tanto, los factores culturales y las instituciones informales, al afectar a los
incentivos para innovar y acumular capital humano, podrían haber afectado al comienzo de la
transición de la fecundidad y, en consecuencia, la actual distribución de los ingresos entre los
países del mundo. El razonamiento es que la distancia genética de Reino Unido (o EE.UU.), a
través de su efecto sobre la adopción de tecnología y sobre la acumulación de capital humano,
ha facilitado el inicio de la transición. Sin embargo, esto no significa necesariamente que el país
situado en la frontera tecnológica tenga que ser el primero en experimentar dicha transición.
Existen otros factores que son importantes para explicar la aparición de las transiciones en la
fecundidad.
A lo largo del análisis se tiene en cuenta el efecto de las características geográficas y climáticas,
como por ejemplo la latitud de cada país y el índice de malaria. Se tiene también en cuenta
xx

0 Introducción
factores históricos como la densidad de población en el año 1400 y los años pasados desde la
revolución neolítica (es decir, la transición agrícola). También se controla por el tipo de orígen
en las leyes del país y por medidas de similitudes linguísticas y religiosas. Además, se controla
por diferentes medidas históricas de la calidad institucional, como por ejemplo el nivel de democ-
racia. Algunas de las fechas del comienzo de la transición en la fecundidad proporcionadas por
Reher (2004) pueden ser criticadas porque a veces asignan un año relativamente tardío, como
por ejemplo en el caso de Francia. Para tener en cuenta esto, se utilizan tambien las fechas
proporcionadas por otros estudios, en particular Coale y Watkins (1986) y Bailey (2009). Estas
fechas alternativas conciernen al comienzo de las transiciones en la fecundidad en países que
experimentaron este proceso más allá en el pasado. También siguiendo el enfoque de Spolaore
y Wacziarg (2009), se evalúa si la distancia cultural de la frontera tecnológica es un factor de-
terminante del inicio de la transición demográfica con un análisis bilateral, es decir, analizando
países de dos en dos. Una ventaja de este enfoque es que permite aumentar el conjunto de datos
de manera significativa y, en consecuencia, ayuda a aumentar la precisión de las estimaciones.
En concreto, se estima una regresión de la distancia en el inicio de la transición de fecundidad
entre cada par de países sobre la distancia genética en relación al Reino Unido (o EE.UU.) y un
conjunto de variables de control muy similares a las utilizadas por Spolaore y Wacziarg (2009),
con el objetivo de capturar diferencias o similitudes geográficas, climáticas, e históricas.
Los principales hallazgos de este estudio se pueden resumir de la siguiente manera. En primer
lugar, una distancia genética grande con respecto al Reino Unido (EE.UU.), es decir, una difer-
encia cultural grande retrasa el comienzo de la transición en la fecundidad de un país. Este
efecto perdura despues de controlar por varios determinantes del desarrollo a largo plazo y de la
productividad sugeridas por la literatura económica. Segundo, se encuentra un efecto causal del
capital humano sobre la fecha de comienzo de la transición en la fecundidad, como el predecido
por Galor y Weil (2000). Este resultado se obtiene instrumentando los niveles de la escolarización
de un país en el año 1870 con la distancia genética con respecto al Reino Unido y con otra medida
que captura los incentivos a acumular capital humano, en concreto una medida de la difusión
del protestantismo.
xxi

Chapter 1
Fertility transition and the
quantity-quality trade-off: historical
evidence from Spain
1.1 Introduction
This paper studies the relationship between children’s education and parents’ fertility using
provincial level data in Spain during the first decades of the 20th century. We focus on the
mechanism through which children’s schooling affects parents’ fertility choice: the interaction
between quality and quantity of children. Different factors might induce parents to invest more
in the education of their children. Among these, an increase in the demand for human capital
that would raise returns to schooling and hence school attendance. However also educational
reforms and changes in compulsory schooling laws affect households’ schooling decisions. One of
the first steps to implement a system of primary school at the national level in Spain dates back
to the Ley Moyano of 1857. This established compulsory schooling attendance between 6 and 9
years old, that could be voluntarily extended till the age of 12. However during the 19th century
school attendance was relatively low on average in Spain, especially compared to other European
1 Fertility transition and the quantity-quality trade-off: historical evidence from Spain
countries as it can be noticed looking at illiteracy rates.1 Primary school enrolment was generally
free in public schools, the latter being financed at the municipality level through income-based
taxes (Nuñez 2005a).2 During the whole 19th century the system of financing for primary school
was decentralized, meaning that the burden was on municipalities that had to collect resources
from households. The financing of public education depended heavily on local funding till the
end of the second decade of the 20th century, meaning that large inequalities in education related
expenditures across localities persisted (or even increased). The share of investments funded by
local authorities over total investments was 0.53 in 1900, 0.35 in 1910 and 0.38 in 1920 while
it decreased substantially in the following years.3 At the beginning of the 20th century, Spain
witnessed the onset of a broad reform of the schooling system including the establishment of
the Ministry of Public Education in 1900 and the extension of compulsory schooling age from
6-9 to 6-12 in 1909. However, the development of the new system (called escuelas graduadas)
was slow due to limited financial resources and pressures coming from traditional sectors that
tried to avoid radical changes.4 Exploiting regional variation across provinces in local demand
and supply for education - closely related to the reaction to the educational reforms - we study
whether changes in children’s education are related to changes in fertility. This study considers
a period around the onset of the demographic transition at the country level (i.e. 1900-1920),
so to understand its triggers. Reher (2004) provides estimates of the year of the onset of the
demographic transition for a large group of countries. Reher (p. 21) explains the criterion
for choosing the year of the onset of the transition: "It has been set at the beginning of the first
quinquennium after a peak, where fertility declines by at least 8% over two quinquennia and never
increases again to levels approximating the original take-off point". Accordingly, Spain started
the transition in 1910. This means that - at the country level - the time period we consider can
1According to Morrisson and Murtin (2007), the illiteracy rate in Spain in 1900 was 0.59. Compared to otherwestern European countries it stands out as relatively high: 0.05 in Austria, 0.19 in Belgium, 0.16 in France, 0.18in Ireland.
2Even if primary school enrolment was essentially free, sending children to school entailed indirect costs interms of foregone income due to child labour.
3One of the reasons why our analysis focuses on the period 1900-1920 is that our identification assumption inthe instrumental variable strategies relies on the fact that the local environment played a major role in triggeringthe process of education expansion.
4The new system separated students in different classes according to age and level of education. The previoussystem (called escuelas unitarias) pooled students together independently of their age and ability.
2

1 Fertility transition and the quantity-quality trade-off: historical evidence from Spain
10
20
30
40
cbr
1880 1900 1920 1940year
Spain Portugal
England and Wales France
Switzerland
Figure 1.1: Crude birth rate in selected European countries: 1880-1940 (Source: Mitchell, 2007)
be divided in a pre-transition (1900-1910) and a post-transition (1910-1920) decade. Figure 1.1
shows the time-series of the crude birth rates in selected European countries for the period 1880-
1940. We can notice that fertility was higher at the beginning of the period in the two southern
countries (Spain, Portugal) compared to those belonging to continental Europe (England and
Wales, France and Switzerland). This difference persisted until 1940 due to a later onset of a
(sustained) fertility decline.
Recent studies have provided historical evidence suggesting the existence of a quantity-quality
trade-off and have emphasised its role in triggering fertility declines. Among these Becker et
al. (2010) for 19th century Prussia, Murphy (2010) for late 19th century France, Klemp and
Weisdorf (2011) for 18th century England and Fernihough (2011) for early 20th century Ire-
land. To our knowledge there are no specific studies focusing on the role played by increases
in children’s education in triggering fertility declines in historical Spain using provincial level
data. This study then adds to the literature by providing evidence in a peripheral European
country that experienced the transition later compared to other western countries. Previous
studies on the determinants of fertility levels across Spanish provinces in the first part of the
3
1 Fertility transition and the quantity-quality trade-off: historical evidence from Spain
20th century highlight a puzzling picture (Leasure 1963; Reher and Iriso-Napal 1989). While it
is stressed that cultural and linguistic contexts are important in shaping fertility profiles across
provinces, the role of socio-economic factors is uncertain. In particular, regarding education,
no unambiguous negative relationship between education (i.e. illiteracy in the total population)
and fertility levels is found. Regarding the latter finding, Reher and Iriso-Napal (1989) state
(p. 410): "Regional differences in literacy probably date back as far as the sixteenth century and
were relatively impervious to social and economic change. In other words, the index need not
necessarily be interpreted as a sign of modernization or of changing value structures. Thus, while
in the northeastern part of the peninsula high literacy indicates development, in the northwest
relatively high literacy may well be a sign of traditional rather than innovative behaviour."
The contribution of this paper is to study the role played by increases in children’s education
in triggering fertility declines in Spain in the early 20th century, tackling three main issues that
the recent literature pointed out. First, we address the potential bias due to the omission of
cultural and historical characteristics using fixed-effects in a panel framework (e.g. Galloway et
al. 1994). Second, we address the endogeneity bias due to measurement error, omitted variables
and reverse causality using IV estimation (e.g. Brown and Guinnane 2002). Finally we account
for the role of spatial dependence or diffusion (e.g. Murphy 2010).5 The main finding of the
paper is that there is evidence of a negative association between children’s education and parents’
fertility across Spanish provinces in a period around the onset of the fertility transition. This
is consistent with those theories - as unified growth theory - arguing that increases in children’s
quality are important in explaining fertility declines.
The paper is structured as follows. Section 1.2 motivates the analysis and reviews the literature
on the determinants of fertility transitions focusing on a specific mechanism, the quantity-quality
trade-off. Section 1.3 describes the data and the main variables used in the analysis while Section
1.4 introduces the baseline empirical strategy. Section 1.5 displays the results of the empirical
analyses including panel and long-time differences frameworks. Finally, Section 1.6 concludes.
5These problems are described in more details in Section 1.2.
4
1 Fertility transition and the quantity-quality trade-off: historical evidence from Spain
1.2 Conceptual framework
As mentioned in the introduction we study the relationship between changes in children’s educa-
tion and changes in fertility tackling three main issues: the potential bias due to the omission of
cultural and historical characteristics, the endogeneity bias due to measurement error, omitted
variables and reverse causality and the role of spatial dependence. In this section we motivate
why it is important to account for these problems and we review the related literature.
1.2.1 Motivation
The first issue - the omission of cultural and historical characteristics - is related to a concep-
tual problem: in order to capture the factors responsible of the fertility transition we focus
on explaining changes in fertility rather than levels. This implicitly means that the analysis
takes into consideration province-specific cultural and historical factors that might affect both
children’s education and parents’ fertility. Regarding literacy, several province-specific charac-
teristics might be responsible of educational levels such as, for example, farming systems and
agricultural practices. These are particularly important as they shape agricultural productivity
and the demand for child labour: also, they depends fundamentally on geographic and climatic
conditions that we can regard as constant over time. Simply comparing levels of education and
fertility across provinces would lead to ignore some of those forces that are responsible of literacy
and fertility behaviour. To understand why this is the case let’s consider a simple variation of the
framework commonly used to characterize fertility choice and its interaction with investments in
children’s quality (Galor 2012). Assume an hypothetical household enjoys utility from consuming
an amount of generic goods, c, the quantity of children, n and their human capital, h according
to the following utility function:
U = (1− γ) ln c+ γ[ρi lnn+ β lnh] (1.1)
5
1 Fertility transition and the quantity-quality trade-off: historical evidence from Spain
The term ρi represents cultural, social and historical factors that should captures heterogeneity
in preferences over quantity of children. The household budget constraint, naming household’s
income y, takes the form:
yn[τq + τee] + c ≤ y (1.2)
As in Galor (2012) the term in square brackets in Equation 1.2 is the time cost of raising a child
with education e, where τq is the fraction of time endowment necessary to take care of a child
while τe is the fraction of time endowment necessary for one unit of education per child. Solving
for the optimal level of children yields:
n =γρi
γρi + (1− γ)
1
τq + τee(1.3)
Even if the quantity-quality trade-off tells us that quantity and quality of children are negatively
related, in some cases evidence of such association might be weak. As it can be noticed from
Equation 1.3 even if parents intend to invest few resources in children’s education, they might
have relatively few children if their preferences do not place a high weight on quantity of children
(i.e. low ρi).
The second issue - endogeneity - might have several sources. The simple model developed above
tells us that reverse causality between fertility and children’s education has to be taken into
account.6 Measurement error using historical and census data is likely to affect the values taken
by our variables. Omitted variables - due to data unavailability - are also likely to affect our
analysis. To cope with these issues and establish a causal link, we exploit alternative instrumental
variable (IV) strategies by instrumenting children’s literacy with direct and indirect measures of
local support to education. The direct measure is constructed using investments in education
6This is because the optimal choice in terms of children’s education is itself a function of the quantity ofchildren parents decide to have over their lifetime.
6
1 Fertility transition and the quantity-quality trade-off: historical evidence from Spain
funded by local authorities and it allows to perform IV estimation in a panel framework.7 Locally
financed investments can be regarded as a direct measure of local support to education and should
affect fertility decisions only through their effect on the decision of parents to send their children
to school, thus triggering the quantity-quality trade-off. In addition, we use as additional (and
alternative) instrument an indirect measure of local support to education following recent works
(Galor et al. 2009; Becker et al. 2010): a time-invariant measure capturing the share of medium-
large livestock owners in 1865 that is used in a long-time differences set-up.
The third issue - spatial diffusion - relates to the presence of geographical patterns in fertility
declines. The diffusion of new social and cultural norms might be responsible of such spatial
patterns, reflecting for example new attitudes towards birth control practices induced by a mod-
ernization process. We account for this possibility and show that our main result is robust to
controlling for such phenomena.
1.2.2 Literature review
The literature analysing the determinants of fertility choice and demographic transitions across
and within countries has proposed several possible explanations (Guinnane 2011; Galor 2012).
This paper focuses on a specific one: the role played by increases in children’s education in
triggering fertility declines. The formalization of the theory of the demand for children and of the
quantity-quality trade-off as an economic mechanism date back to Becker’s theory of the family
(e.g. Becker and Lewis 1973; Becker 1981). Accordingly the main trigger of the fertility decline
is a change in the relative price of quantity and quality of children. While this change might have
several causes, the one originally suggested as crucial is rising income, under the assumption that
as income increases parents shift their preference from quantity to quality of children (Becker
and Lewis 1973). This effect takes place assuming that the substitution effect is larger than the
income effect.8 Other recent works have focused instead on the role of technological progress in7Both supply and demand factors are important in explaining educational attainments. An increase in local
investments in education (i.e. in the supply of school services) is likely to be driven by - and will be more effectivein fostering school attendance where there is - higher demand for education.
8Higher incomes, besides shifting parents’ focus towards quality, might redirect expenditure towards otherconsumption goods as suggested by Guzman and Weisdorf (2010). They argue that, assuming children and other
7

1 Fertility transition and the quantity-quality trade-off: historical evidence from Spain
fostering the demand for human capital. Due to higher returns to education, households would
react by investing more in the quality of their offspring, thus reducing their quantity to keep their
budget balanced (e.g. Galor and Weil 2000). Even if the factors fostering higher educational
attainments can be multiple - including educational reforms as the extension of compulsory
schooling age - the ultimate effect of increases in children’s education would be a reduction in
the optimal number of children.
One of the first comprehensive studies, the Princeton European Fertility Project (EFP here-
after), identified cultural and sociological factors as key in the process of reduction of fertility
across Europe (e.g. Coale and Watkins 1986). The purpose of the EFP was to characterize
the reduction in fertility rates that started in Europe during the 19th and early 20th centuries.
Its final conclusions suggest that socio-economic variables played a minor role in triggering the
demographic transitions across European countries.9 Subsequent studies pointed out several
flaws in the analyses used within the EFP framework that might be the cause of such finding.
Among these, Brown and Guinnane (2007) stress two main statistical problems related to the
EFP methodology. First, the statistical units of analysis, that according to them are too aggre-
gated. Second, and most important from the perspective of this study, "the way that it modelled
change over time" (p. 585). Basically the approach of the EFP is not in line with the concept
of fertility transition, that is where changes in fertility behaviour should be caused by changes
in the explanatory variables. Several studies that looked at the causes of fertility changes have
found that economic variables played an important role (e.g. Galloway et al. 1994; Brown and
Guinnane 2002). Also, Brown and Guinnane (2007) stress that most of these studies use simple
cross-section and bivariate correlations, so they suffer of several issues such as reverse causality
and omitted variables bias.
Recent empirical studies - tackling several of the flaws just mentioned - support the existence of
a negative relationship between children’s schooling attainments and parents’ fertility in histor-
consumption items are normal goods and substitutes to each other, an increase in the variety of consumptiongoods might lead to a lower demand for children.
9An exception is van de Walle (1980) that, using educational data from military recruit tests in Switzerland,finds a negative correlation between marital fertility and education in a period around 1900 and a general tendencyof fertility to decline as educational attainments increased.
8

1 Fertility transition and the quantity-quality trade-off: historical evidence from Spain
ical contexts.10 Bleakley and Lange (2009) explore the causal effect of education on fertility by
exploiting the eradication policy of the hookworm disease in southern states of North America
in 1910. Their study argues that this eradication increased the return to schooling and hence
reduced the price of child quality, thus increasing school attendance and reducing fertility. Mur-
phy (2010) finds that both economic and cultural factors affected fertility changes across French
department in the late 19th century. In particular, enrolment in primary schools is found to
be negatively associated to fertility. Becker et al. (2010) use data on Prussian counties in 1849
and identify a negative relation between child quantity and enrolment at school in a context in
which the demographic transition has not yet taken place. They also highlight that the initial
level of education is a good predictor of the fertility transition that occurred in Prussia during
the 1880-1905 period. Klemp and Weisdorf (2011) find a significant negative impact of family
size on children’s literacy using data from Anglican parish registers in England over the period
1700-1830. Finally, Fernihough (2011) finds evidence of the quantity-quality trade-off using cen-
sus data for Ireland in 1911. Specifically, using data for Belfast and Dublin, he finds that higher
fertility (measured by the number of siblings) reduced the probability of school attendance.
1.3 Data description
This paper studies the effect of quality on quantity of children in Spain using historical provincial
level data for the period 1900-1920. Data is taken from population censuses (carried out in 1900,
1910, 1920) and several other sources including the anuarios (i.e. yearly statistical issues).11
The main variables used in the analysis are related to parents’ fertility and children’s education.
To measure fertility we use an index of marital fertility - specifically the Ig index - which is a
measure of fertility within marriage. As a robustness check we also use the total fertility rate
(TFR).12 To capture quality of children we use the share of children (aged 5 to 15) that can read
10The literature includes also cross-country historical analysis of the determinants of demographic transitions(e.g. Murtin, forthcoming).
11Population censuses and yearly statistical issues are available at www.ine.es.12Both measures are taken from Delgado (2009). Marital fertility is computed following the methodology in
Coale and Watkins (1986).
9

1 Fertility transition and the quantity-quality trade-off: historical evidence from Spain
Álava
Albacete
Alicante
Almería
Ávila
BadajozBaleares
Barcelona
Burgos
Cáceres
Cádiz
Canarias
Castellón de La Plana
Ciudad RealCórdoba
La Coruña
Cuenca
Gerona
Granada
Guadalajara
Guipúzcoa
Huelva
Huesca
Jaén
León
Lérida
Logroño
Lugo
Madrid
Málaga
Murcia
Navarra
Orense
Oviedo
Palencia
Pontevedra
Salamanca
SantanderSegoviaSevilla
Soria
Tarragona
Teruel
ToledoValencia
Valladolid
VizcayaZamora
Zaragoza
.2.4
.6.8
1P
rim
ary
school attendance in 1
908
0 .2 .4 .6 .8Children’s literacy in 1910
Corr=0.73***
Figure 1.2: Children’s literacy and primary school attendance around 1910
and write. Literacy should proxy for school attendance and basic educational attainment as it
is the main output of primary school. To provide some evidence suggesting that this is actually
the case, we look at the correlation between primary school attendance (for children aged 6-12)
in 1908 and the share of literate children (aged 5-15) in 1910.13 As displayed in Figure 1.2 the
correlation between these two variables is high and significant, suggesting that children’s literacy
is indeed a good proxy for primary school attendance.
A specific issue regarding our measure of children’s education has to be taken into account. As
fertility and fertility changes affect the population age structure, provinces might differ in the
age distribution of children between 5 and 15 years old. Since younger children would tend to
be declared illiterate, there is a mechanical effect from fertility to the share of educated children
via the age structure of children aged 5 to 15. Hence to make the share of literate children
comparable across provinces and over time, we construct an age-adjusted measure of children’s
education. First, we compute age-specific literacy rates for children aged 5, 6, 7, 8, 9, 10 and
11-15:14
13School attendance is not available for the whole period under consideration, so it cannot be used as measureof children’ education.
14Census data allows for this disaggregation of children’s literacy by age.
10

1 Fertility transition and the quantity-quality trade-off: historical evidence from Spain
sharelitj = # literate children in age group j# children in age group j ∗ 100
where j=1,2,3,4,5,6,7 represents age groups 5,6,7,8,9,10,11-15 respectively.
Using as weights the share of children in each of these categories in the U.S. population (aged 5 to
15) in 2000 (here used as standard population) we define the age-adjusted measure of children’s
education as follows:
adjeduc=7∑
j=1(sharelitj ∗ wj) where
7∑j=1
wj = 1
Finally, several control variables are included in the empirical specifications. The share of adult
men (aged 20-60) that work in the agriculture or fishery sector and the share of adult individuals
(aged 20-60) employed in the industry sector; the share of population living in urban areas
defined as the fraction of individuals living in towns with more than 10000 inhabitants. These
variables aim at measuring the stage of development and the economic structure of the province.
Population density is used to capture the degree of interaction between individuals and the
consequent sharing of information (for example on birth control practices, mortality events,
etc.). Child (infant) mortality and life expectancy at 15 to measure the mortality environment
during both childhood and adulthood.15 To account for the effect of inter-provincial migration
flows, we use measures of permanent and temporary in-migration.16 Table 1.1 lists the variables
used in our analysis and their sources.
1.4 Empirical strategy
This paper studies the association between children’s education and parents’ fertility controlling
for province-fixed characteristics, so to get rid of all unobservable factors that can be assumed
constant within provinces over time.17 This methodology is consistent with the concept of fertility15Several theories emphasize the importance of precautionary and replacement motives to explain fertility
behaviour (e.g. Kalemli-Ozcan 2003).16Permanent in-migration is measured by the number of individuals born in another province over total popu-
lation. Temporary in-migration is taken from Silvestre (2007).17The implicit assumption is that a province fixed effect should capture those geographical, climatic and cultural-
historical factors that are constant over the time period considered.
11

1 Fertility transition and the quantity-quality trade-off: historical evidence from Spain
Table
1.1:Variables
anddata
sourcesChildren’s
education(aged
5-15)Author’s
computation
usingpopulation
censuses(1900,1910,1920)
Age-adjusted
children’seducation
(aged5-15)
Author’s
computation
usingpopulation
censuses(1900,1910,1920)
andUSPopulation
Census
(2000)Index
ofmaritalfertility
Ig
Delgado
(2009)Totalfertility
rate(T
FR)
Delgado
(2009)Crude
birthrate
(CBR)
Author’s
computation
usingstatisticalyearbooks
(1912,1915,1930)and
populationcensuses
(1900,1910,1920)Crude
birthrate
(nationaltime-series)
Mitchell(2007)
Sharein
agriculture,men
(aged20-60)
Author’s
computation
usingpopulation
censuses(1900,1910,1920)
Sharein
industry(aged
20-60)Author’s
computation
usingpopulation
censuses(1900,1910,1920)
Shareurban
Author’s
computation
usingpopulation
censuses(1900,1910,1920)
Population
densityStatisticalyearbooks
(1921-22,1931)Child
mortality
rateDopico
andReher
(1999)Infant
mortality
rateDopico
andReher
(1999)Life
expectancyat
15Dopico
andReher
(1999)Perm
anentin-m
igrationAuthor’s
computation
usingpopulation
censuses(1900,1910,1920)
Tem
poraryin-m
igrationSilvestre
(2007)Realinvestm
entsin
educationfunded
bylocalauthorities
Mas
Ivarsand
Cucarella
Torm
o(2009)
Prim
aryschoolattendance
(childrenaged
6-12)in
1908Author’s
computation
usingstatisticalyearbook
(1912)Nuptiality
indexDelgado
(2009)Share
wom
en(aged
16-45)Author’s
computation
usingpopulation
censuses(1900,1910,1920)
Sharemarried
wom
en(aged
16-45)Author’s
computation
usingpopulation
censuses(1900,1910,1920)
12

1 Fertility transition and the quantity-quality trade-off: historical evidence from Spain
transition which entails the characterization of fertility changes over time.
1.4.1 Framework
The relationship between children’s education and parents’ fertility is characterized as follows:
ferti,t = γ1 educi,t + γ2Xi,t + ρi + θt + ψi,t (1.4)
where t=1900, 1910, 1920 and i=1,..49, ferti,t is parents’ fertility at time t in province i, educi,t
is the share of literate children aged 5-15 at time t in province i, Xi,t includes control variables,
ρi captures province-specific characteristics and θt include time effects.18
Equation 1.4 is first estimated by OLS. To cope with endogeneity issues, we use an instrumental
variable strategy where children’s literacy is instrumented with a time-varying measure of local
support to education. Then, the estimation framework is reduced to a simple cross-section
relating changes in children’s education to changes in fertility in the period 1900-1920:
∆ferti = γ1∆educi + γ2∆Xi + const+ εi (1.5)
In such a way we can rely also on a time invariant instrument for the change in children’s
education between 1900 and 1920.
18Throughout the analysis we apply the log transformation to the measures of fertility and children’s educationso to provide easy to interpret coefficients’ estimates (i.e. elasticities) and reduce the impact of outliers.
13

1 Fertility transition and the quantity-quality trade-off: historical evidence from Spain
1.4.2 Instrument choice
The period considered in this study is characterized by the beginning of a process of transforma-
tion of the educational system that took place with large heterogeneity across the country. Hence,
it is reasonable to think that part of the changes in schooling achievements across provinces are
due to the different support that citizens gave to this process. To assess whether the causal effect
of changes in children’s education on changes in parents’ fertility is indeed present, changes in
children’s literacy are instrumented with both a direct and an indirect measure of local support to
education expansion: per child investments in education funded by local authorities and the share
of medium-large livestock owners in 1865. Regarding the former, this is available for the whole
period under consideration and it allows to implement an IV estimation in a panel framework.
This measure can be regarded as a valid instrument if it satisfies the exclusion restriction, that
is it does not affect fertility directly but only through children’s education. While expenditure
financed by the central government is determined by several factors, locally funded expenditure
(i.e. the local supply of school services) should reflect the local demand for education. A bet-
ter supply of education - responding to the higher demand - affects the decision of parents to
send their children to school by increasing the incentives of parents to educate their children.
Our reasoning is that in provinces where local efforts to promote and develop schooling were
higher, the (current and/or expected future) demand for human capital was higher too. House-
holds recognizing that school attendance would bring future returns (or learning this by looking
at the behaviour of their peers) would then reduce the number of children to afford schooling
expenditures. If one accepts this reasoning, our measure of local support to education should
affect fertility decisions only through its effect on the decision of parents to send their children
to school, thus triggering the quantity-quality trade-off. We provide some evidence in favour of
the validity of the exclusion restriction in Section 1.5.3 where we use multiple instruments.
The second instrument, an indirect measure of local support to education, is the share of medium-
large livestock owners in 1865. It is a time-invariant measure that should capture exogenous
variation in the support to education expansion following Galor et al. (2009). According to
14

1 Fertility transition and the quantity-quality trade-off: historical evidence from Spain
the latter, inequality in the distribution of land ownership delays the implementation of human-
capital promoting institutions because large landowners would not gain from the accumulation
of human capital since the latter is not complementary to land in production. Following this
reasoning, Becker et al. (2010) use land ownership inequality as instrument for education to
estimate the causal effect of children’s education on parent’s fertility choice in Prussia using
cross-county data. Unfortunately, to our knowledge, no data on land ownership at the province
level is available for Spain in the late 19th century. However, in 1865 a livestock census (Censo
de Ganaderia) was carried out. Assuming that livestock ownership, especially of those animals
employed mainly in agriculture, goes along (or, at least, is well correlated) with land ownership,
it can be used to construct an instrument for changes in educational attainments.
Demand factors seem particularly important in explaining cross-province differences in education
in historical Spain. Nuñez (2005b) suggests that (p.132):"...in regions where peasant owners were
more numerous, however, demand for primary schooling was also higher and the school calendar
was frequently adapted to the agricultural one to make work compatible with schooling. Day-
labourers put a very low premium on schooling and education while peasants expected higher
rewards and were thus more committed to it".19 Hence provinces with a relatively large amount
of small land owners would be characterized by a higher local support (both in terms of demand
and supply factors) for education and by a higher propensity to react positively to the incentives
provided by educational reforms, especially the change in the compulsory schooling age. On the
other hand, provinces with large land owners (and consequently many day-labourers) would react
slowly or not react since the majority of individuals (both land owners and day-labourers) would
not gain by educating their children.20 Our measure of livestock ownership aims at capturing
this source of heterogeneity that seems plausibly exogenous in our context. The identification
assumption is that, if in a given province there is a sufficiently high number of small livestock
owners, demand and supply factors will favour schooling in response to an educational reform
19According to Núñez (2005b) these rewards might come from reduced transaction costs related to changes inland property-rights and to other market-related elements.
20The presence of large land owners in a given province affect the opportunity cost of the time spent in school.In fact, as large farms need a high number of daily labourers, parents would face higher incentives to send theirchildren to work rather than to school.
15
1 Fertility transition and the quantity-quality trade-off: historical evidence from Spain
aiming to expand education. On the other hand human capital accumulation would be slower
where large land owners and day-labourers sum up to a large share, as they would not (or to a
lower extent) support education expansion. Hence the reforms affected differently the decision of
parents to send their children to school, and through this channel also the decision about their
fertility.21
The Censo de Ganaderia of 1865 provides information on how many livestock owners were enti-
tled a certain amount of units of different type of animals. Since this information is available at
the province level, it can be used to construct a measure of the share of medium-large livestock
owners. It also provides the allocation of each animal according to the task it was assigned.
Overall there are five possible destinations: consumption, agricultural work, machines’ move-
ment, transportation and reproduction (including production of dairy products, etc.). Among
all type of animals the ones that were assigned, among others, to agricultural tasks are the follow-
ing: cattle (cows, oxen), mules, donkeys and horses. Analysing the distribution across Spanish
provinces, two main features characterize the allocation of these animals according to the above
tasks (see Table 1.2). First, the animal that within its type is used mostly in agriculture is the
mule followed by donkeys, bovine animals and horses. Second, by looking only at the animals
used in agriculture the most used is cattle followed by mules, donkeys and horses. Average
mules, donkeys, horses and cattle per owner are 1.9, 1.4, 1.8 and 4.8 units, respectively. Hence,
to capture medium-large livestock owners a lower bound of 3 units is used for mules, donkeys
and horses while of 5 units for cattle. In order to check whether this measure is a good proxy
of the share of large land owners, we look at the correlation between the share of medium-large
livestock owners in 1865 and a measure of land ownership concentration in 1924 for 27 (out of 49)
provinces. Land ownership inequality is the share of land owners with more than 100 hectares
of land in 1924. Despite the 60-years time period passed since 1865, the correlation between this
measure and our proxy of livestock ownership concentration is high (0.7) as it can be noticed by
looking at Figure 1.3.
21Large land owners might have had a role in marriage decisions, but as Becker et al. (2012) suggest it isunlikely that they could affect decision about (changes and levels of) marital fertility. Hence since we use anage-adjusted indicator of marital fertility, we can exclude a direct effect from our instrument to the dependentvariable.
16
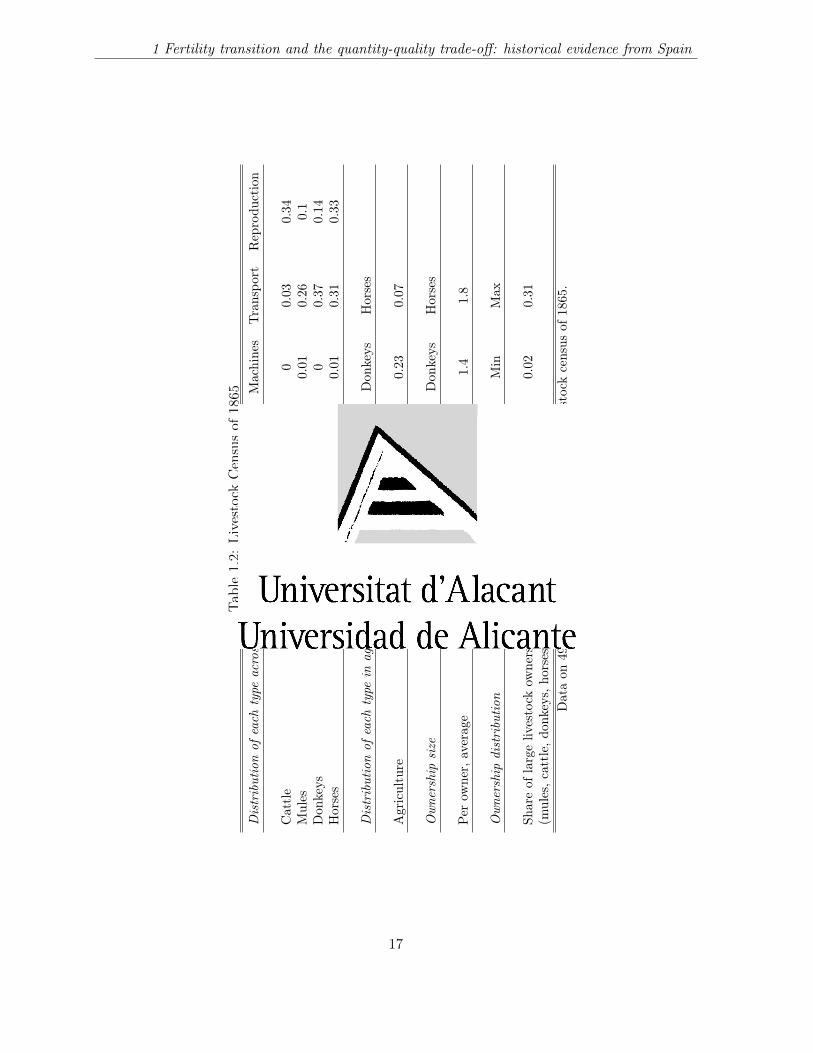
1 Fertility transition and the quantity-quality trade-off: historical evidence from Spain
Tab
le1.2:
LivestockCensusof
1865
Distributionof
each
type
across
activities
Con
sumption
Agriculture
Machines
Transpo
rtReprodu
ction
Cattle
0.07
0.56
00.03
0.34
Mules
00.62
0.01
0.26
0.1
Don
keys
00.48
00.37
0.14
Horses
00.35
0.01
0.31
0.33
Distributionof
each
type
inagricultu
reCattle
Mules
Don
keys
Horses
Agriculture
0.43
0.27
0.23
0.07
Owne
rshipsize
Cattle
Mules
Don
keys
Horses
Per
owner,
average
4.8
1.9
1.4
1.8
Owne
rshipdistribution
Mean
Std.
dev.
Min
Max
Shareof
largeliv
estock
owne
rs0.14
0.07
0.02
0.31
(mules,c
attle,
donk
eys,
horses,),a
vg.
Dataon
49Sp
anishprovincescollected
from
theliv
estock
census
of18
65.
17
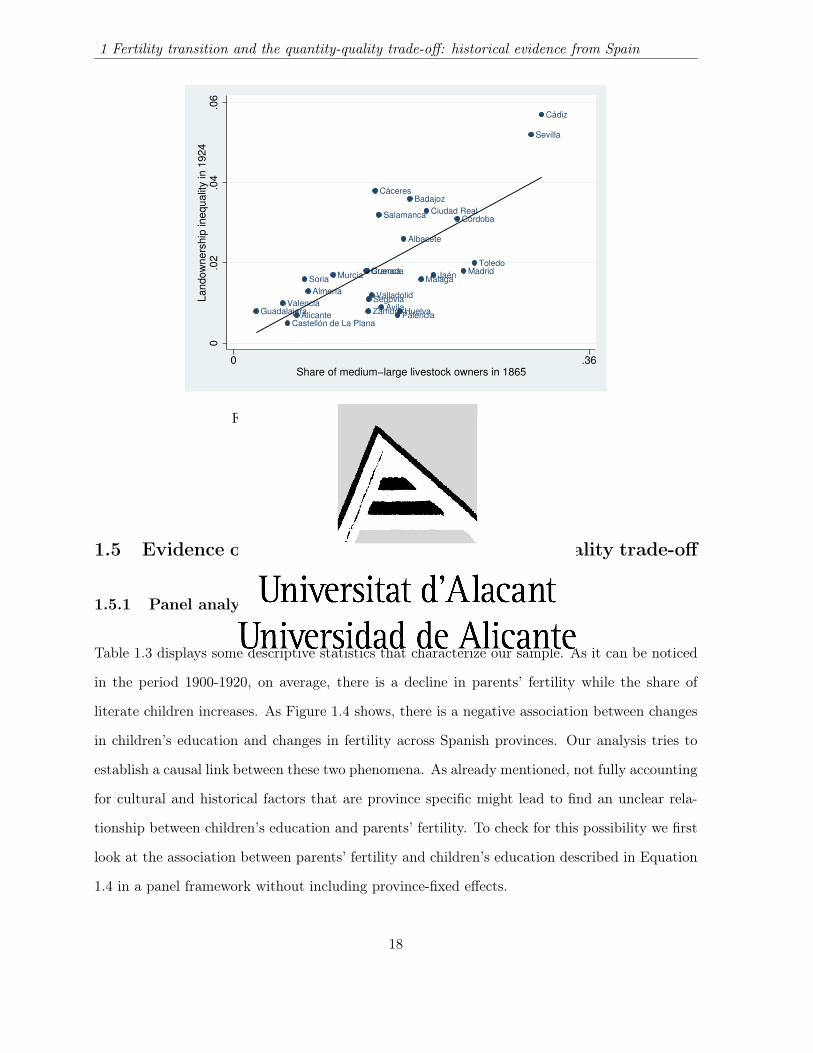
1 Fertility transition and the quantity-quality trade-off: historical evidence from Spain
Albacete
Alicante
Almería
Ávila
BadajozCáceres
Cádiz
Castellón de La Plana
Ciudad RealCórdoba
CuencaGranada
Guadalajara Huelva
Jaén MadridMálagaMurcia
Palencia
Salamanca
Segovia
Sevilla
Soria
Toledo
ValenciaValladolid
Zamora
0.0
2.0
4.0
6Landow
ners
hip
inequalit
y in 1
924
0 .36Share of medium−large livestock owners in 1865
Figure 1.3: Livestock and land ownership inequality
1.5 Evidence on fertility transition and quantity-quality trade-off
1.5.1 Panel analysis: OLS
Table 1.3 displays some descriptive statistics that characterize our sample. As it can be noticed
in the period 1900-1920, on average, there is a decline in parents’ fertility while the share of
literate children increases. As Figure 1.4 shows, there is a negative association between changes
in children’s education and changes in fertility across Spanish provinces. Our analysis tries to
establish a causal link between these two phenomena. As already mentioned, not fully accounting
for cultural and historical factors that are province specific might lead to find an unclear rela-
tionship between children’s education and parents’ fertility. To check for this possibility we first
look at the association between parents’ fertility and children’s education described in Equation
1.4 in a panel framework without including province-fixed effects.
18

1 Fertility transition and the quantity-quality trade-off: historical evidence from Spain
Table 1.3: Province level data: descriptive statistics(1) (2) (3) (4)
Mean Std. dev. Min MaxYear 1900Share of literate children (aged 5-15) 0.31 0.14 0.12 0.57Age-adjusted share of literate children (aged 5-15) 0.32 0.14 0.13 0.59Marital fertility (Ig) 0.67 0.09 0.46 1.01Total fertility rate (TFR) 4.91 0.67 3.19 6.17Share in agriculture, men (aged 20-60) 0.71 0.12 0.33 0.88Share in industry, all (aged 20-60) 0.07 0.04 0.03 0.21Share urban (>10000) 0.25 0.2 0 0.81Population density 45.38 30.9 14.59 143.79Infant mortality rate 206.53 40.08 110 290Child mortality rate 207.34 51.14 100 310Life expectancy at 15 43.1 1.47 40 48.33Permanent in-migration 0.07 0.07 0.01 0.42Temporary in-migration 2.85 1.54 0.3 6.6Local investments in education (per child, aged 5-15) 1.4 1.3 0.22 6.8Nuptiality 0.57 0.07 0.41 0.66
Year 1910Child mortality rate 153.26 38.75 90 230Infant mortality rate 163.47 30.72 90 210Life expectancy at 15 45.8 1.28 43.03 49.92
Year 1920Share of literate children (aged 5-15) 0.43 0.16 0.18 0.69Age-adjusted share of literate children (aged 5-15) 0.43 0.16 0.18 0.7Marital fertility (Ig) 0.61 0.09 0.38 0.78Total fertility rate (TFR) 4.06 0.71 2.59 5.25Share in agriculture, men (aged 20-60) 0.6 0.17 0.14 0.86Share in industry, all (aged 20-60) 0.08 0.05 0.02 0.34Share urban (>10000) 0.3 0.22 0 0.83Population density 52.47 40.13 14.7 189.43Infant mortality rate 162.65 32.58 90 230Child mortality rate 155.1 38.35 80 230Life expectancy at 15 45.92 1.52 41.77 50.63Permanent in-migration 0.08 0.07 0.01 0.4Temporary in-migration 2.12 1.21 0.2 5.2Local investments in education (per child, aged 5-15) 1.46 1.28 0.25 6.57Nuptiality 0.51 0.07 0.34 0.62
Data on 49 Spanish provinces. Temporary in-migration is not available for the Canary Islands.
19
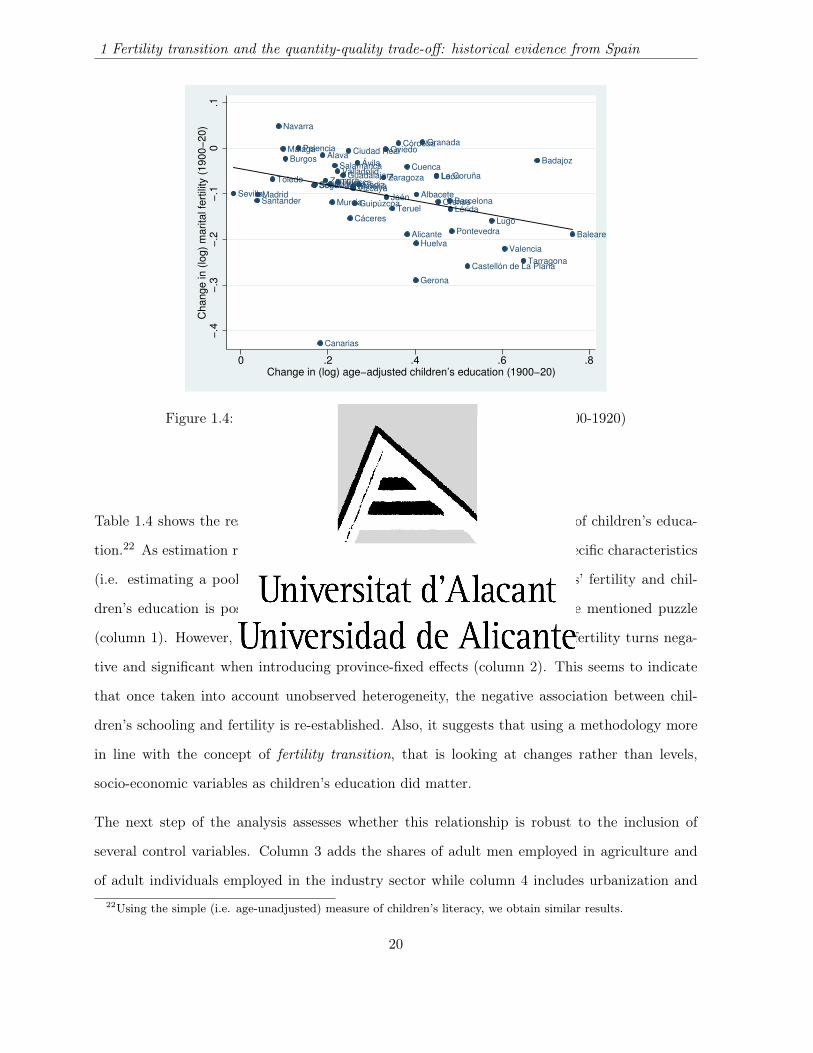
1 Fertility transition and the quantity-quality trade-off: historical evidence from Spain
Álava
Albacete
Alicante
Almería
Ávila Badajoz
Baleares
Barcelona
Burgos
Cáceres
Cádiz
Canarias
Castellón de La Plana
Ciudad RealCórdoba
La CoruñaCuenca
Gerona
Granada
Guadalajara
Guipúzcoa
Huelva
Huesca
Jaén
León
Lérida
Logroño
Lugo
Madrid
Málaga
Murcia
Navarra
Orense
OviedoPalencia
Pontevedra
Salamanca
Santander
SegoviaSevilla
Soria
Tarragona
Teruel
Toledo
Valencia
Valladolid
VizcayaZamora Zaragoza
−.4
−.3
−.2
−.1
0.1
Change in (
log)
marita
l fe
rtili
ty (
1900−
20)
0 .2 .4 .6 .8Change in (log) age−adjusted children’s education (1900−20)
Figure 1.4: Change in children’s literacy and fertility change (1900-1920)
Table 1.4 shows the results of this exercise using the age-adjusted measure of children’s educa-
tion.22 As estimation results point out, when not accounting for province specific characteristics
(i.e. estimating a pooled OLS regression), the relationship between parents’ fertility and chil-
dren’s education is positive and not significant, consistently with the above mentioned puzzle
(column 1). However, the association of children’s education with parents’ fertility turns nega-
tive and significant when introducing province-fixed effects (column 2). This seems to indicate
that once taken into account unobserved heterogeneity, the negative association between chil-
dren’s schooling and fertility is re-established. Also, it suggests that using a methodology more
in line with the concept of fertility transition, that is looking at changes rather than levels,
socio-economic variables as children’s education did matter.
The next step of the analysis assesses whether this relationship is robust to the inclusion of
several control variables. Column 3 adds the shares of adult men employed in agriculture and
of adult individuals employed in the industry sector while column 4 includes urbanization and22Using the simple (i.e. age-unadjusted) measure of children’s literacy, we obtain similar results.
20
1 Fertility transition and the quantity-quality trade-off: historical evidence from Spain
population density. Column 5 adds child mortality and life expectancy at 15.23 Column 6
controls for permanent in-migration flows as heterogeneity in the support to the schooling reform
might have contributed to such phenomena and temporary in-migration to capture seasonal
migration flows.24 In column 7 and 8 we exploit the long-time variation between 1900 and 1920.
As estimation results point out the coefficient associated to children’s literacy is negative and
significant in all specifications. In particular when focusing on the long-time difference we find
a stronger association: this is in line with the fact that the effect of the increase in compulsory
schooling age in 1909 - together with the gradual innovation introduced by the educational reform
- in triggering fertility declines is likely to appear in the second decade of the 20th century.
1.5.2 Panel analysis: 2SLS
We deal with the potential bias of OLS estimates by instrumenting children’s literacy with
(per child) investments in education funded by local institutions.25 The latter should capture
the average local support to education expansion. Table 1.5 shows the first (columns 1-2) and
second stage (columns 3-4) estimates. We also use as measure of fertility the total fertility rate:
as the latter is an age-adjusted measure of total (including non-marital) fertility, we include an
index of nuptiality among the regressors. The instrument’s coefficient is positive and significantly
different from zero in all specifications and the F statistic is above 10. Second stage estimates
show that children’s literacy is negatively related to fertility independently of the measure of
fertility. As IV estimates are larger in size (in absolute value) if compared to the corresponding
OLS estimates in Table 1.4, the latter are likely to be biased downward due to reverse causality,
measurement error and omitted variables problems.
23In 1918-20 took place a temporary increase in mortality due to the influenza pandemic known as the Spanishflu. To fully account for this our analysis controls for child mortality - which shows an increase both at the countrylevel and in some provinces in the year 1920 compared to 1910 - and for adult mortality as well.
24Data on temporary in-migration from Silvestre (2007) is not available for the Canary Islands.25Our sample size ranges from 147 to 27 observations depending on different empirical models. Instrumental
variable estimates might suffer of bias due to this relatively small sample. However, rather than presenting onlyresults based on least squares estimates, we prefer to provide also IV estimates based on alternative instruments.If the latter satisfy the two requirements to be valid (i.e. being well correlated with the endogenous variable andfulfilling the exclusion restrictions), their use can be regarded as an added value to OLS estimates.
21

1 Fertility transition and the quantity-quality trade-off: historical evidence from Spain
Table
1.4:Determ
inantsof
fertilitydeclines:
OLS
panelevidenceDependent
variable(Log)
Maritalfertility
t
(1)(2)
(3)(4)
(5)(6)
(7)(8)
(Log)Age-adjusted
0.0346-0.0915*
-0.0918*-0.0896*
-0.0837*-0.0903**
-0.1793**-0.1744***
children’seducationt
[0.0406][0.0489]
[0.0484][0.0482]
[0.0480][0.0442]
[0.0675][0.0637]
Shareinagriculture
t(m
en)0.0386
0.03730.0448
0.0190-0.0402
-0.0362[0.0603]
[0.0605][0.0658]
[0.0711][0.1128]
[0.1216]Sharein
industryt
0.22530.3597
0.34420.1800
0.1640-0.0027
[0.2297][0.2971]
[0.2966][0.2423]
[0.3837][0.3581]
Shareurbant
0.14410.1172
0.15220.0537
-0.0471[0.1927]
[0.2043][0.2217]
[0.3136][0.2940]
(Log)Population
densityt
-0.1731-0.1683
-0.0989-0.0509
0.0293[0.1497]
[0.1518][0.1240]
[0.1678][0.1702]
(Log)Child
mortality
ratet
0.02800.0288
0.0579[0.0359]
[0.0349][0.0509]
(Log)Infantmortality
ratet
0.1684**[0.0733]
Lifeexpectancyat15
t-0.0039
-0.0039-0.0064
-0.0047[0.0082]
[0.0081][0.0083]
[0.0070](Log)
In-migration
t-0.0328
0.01340.0122
[0.0536][0.0719]
[0.0594](Log)
Tem
poraryin-m
igrationt
-0.0060-0.0085
-0.0140[0.0082]
[0.0097][0.0085]
Constant
-0.3677***-0.5225***
-0.5663***0.0182
0.0291-0.3116
-0.4380-1.3445
[0.0589][0.0600]
[0.0756][0.4997]
[0.6751][0.5755]
[0.7654][0.8356]
Tim
edum
mies
yesyes
yesyes
yesyes
yesyes
Province-fixed
effectsno
yesyes
yesyes
yesyes
yesProvinces
4949
4949
4948
4848
Observations
147147
147147
147144
9696
***,**,*denote
statisticalsignificanceat
1%,5%
and10%
levels,respectively.The
dependentvariable
is(log)
maritalfertility
(Ig )
attim
et.
Children’s
educationis
theshare
ofchildren
aged5-15
thatcan
readand
write.
t=1900,1910,1920
exceptcolum
ns7-8
(t=1900,1920).
Robust
standarderrors
clusteredat
theprovince
levelreportedin
parentheses.
22

1 Fertility transition and the quantity-quality trade-off: historical evidence from Spain
Tab
le1.5:
Determinan
tsof
fertility
declines:2S
LS.F
irst
andsecond
stageestimates
Depen
dent
variable
(Log)Age-adjustedchild
ren’seducation t
(Log
)Marital
(Log)
fertility
tTFR
t
(1)
(2)
(3)
(4)
First
stage
Second
stag
e
(Log)A
ge-adjustedchild
ren’se
ducation
t-0.401
8**
-0.343
1**
[0.154
9][0.1310]
Localsup
portto
education t
0.2747***
0.2742***
[0.0736]
[0.0733]
Shareinagriculture t
(men)
0.0625
0.0631
0.05
16-0.064
8[0.1461]
[0.1480]
[0.096
6][0.082
1]Sh
areinindu
stry
t-0.4746
-0.4768
0.01
07-0.175
9[0.4198]
[0.4255]
[0.324
5][0.333
4]Sh
areu
rban
t-0.2049
-0.2065
0.10
83-0.028
6[0.8350]
[0.8385]
[0.383
0][0.348
5](L
og)C
hildmortalityrate
t-0.0732
-0.0729
-0.011
30.01
28[0.1175]
[0.1185]
[0.063
3][0.061
0]Lifeexpe
ctan
cyat
15t
0.0001
0.0000
-0.003
1-0.014
4*[0.0134]
[0.0134]
[0.008
1][0.008
3](L
og)P
opulationdensity t
0.5371
0.5459
-0.033
10.01
75[0.3226]
[0.3323]
[0.150
8][0.174
7](L
og)In-m
igration
t0.2251*
0.2279*
0.04
510.05
33[0.1249]
[0.1206]
[0.064
8][0.064
0](L
og)Tem
porary
in-m
igration
t0.0116
0.0114
-0.004
0-0.012
3*[0.0172]
[0.0175]
[0.007
9][0.0066]
Nup
tiality t
-0.0950
1.24
90**
*[0.5946]
[0.454
0]
F-statistic
1ststage
13.94
13.98
Tim
edu
mmies
yes
yes
yes
yes
Province-fix
edeff
ects
yes
yes
yes
yes
Provinces
4848
4848
Observation
s144
144
144
144
***,
**,*
deno
testatisticals
ignifican
ceat
1%,5
%an
d10%
levels,r
espe
ctively.
Children’seducationis
theshareof
child
renag
ed5-15
that
canread
andwrite.Lo
cals
uppo
rtto
educationis
investments
ineducation(per
child
)fund
edby
localinstitution
s.t=
1900
,191
0,19
20.
Rob
uststan
dard
errors
clusteredat
theprovince
levelr
eportedin
parenthe
ses.
23

1 Fertility transition and the quantity-quality trade-off: historical evidence from Spain
Álava
AlbaceteAlicante
Almería Ávila
Badajoz
Baleares
Barcelona
Burgos
CáceresCádiz
Canarias
Castellón de La Plana
Ciudad Real
Córdoba
La Coruña
CuencaGerona
Granada
GuadalajaraGuipúzcoa
Huelva
Huesca
Jaén
LeónLérida
Logroño
Lugo
Madrid
Málaga
Murcia
Navarra
Orense
Oviedo
Palencia
Pontevedra
Salamanca
Santander
Segovia
Sevilla
Soria
Tarragona
Teruel
Toledo
Valencia
Valladolid
Vizcaya
Zamora
Zaragoza
0.2
.4.6
.8C
hange in (
log)
age−
adj child
ren’s
education (
1900−
20)
0 .34Share of medium−large livestock owners in 1865
Figure 1.5: Livestock ownership inequality and change in children’s education
1.5.3 Long-time differences: 2SLS, 3SLS and robustness checks
Moving to the long-time differences set-up described above, we now estimate Equation 1.5 using
three alternative IV strategies. First, we use as only instrument for changes in children’s literacy
the share of medium-large livestock owners in 1865. Figure 1.5 points out a negative relationship
between this measure and changes in children’s education in the period 1900-20. Second, we use
both livestock ownership concentration and changes in (per child) local investments in education
as instruments for changes in children’s literacy. This allows to investigate the validity of the
exclusion restrictions. Third, since our reasoning is that provinces characterized by a substantial
share of medium-large livestock owners would support to a lower extent education expansion,
we use a 3SLS procedure where the share of medium-large livestock owners in 1865 is used
as instrument for the change in local support to education in the period 1900-20. The latter
procedure is more in line with our reasoning outlined in Section 1.4.2, as livestock ownership
concentration represents a plausibly exogenous source of variation in the local support to human
capital accumulation.
24

1 Fertility transition and the quantity-quality trade-off: historical evidence from Spain
Table 1.6 shows the first (columns 1-3) and second stage (columns 4-6) estimates of the 2SLS
regressions. We notice that the share of medium-large livestock owners in 1865 is negatively
correlated to changes in children’s education between 1900 and 1920 both when used as unique
instrument and when used together to the change in locally funded (per child) investments in
education (the latter being positively related to changes in the endogenous variable). When
using both instruments we notice from the first stage estimates that there is some collinearity
between them, leading to lower first stage F statistics: this is consistent with the reasoning
that our measure of livestock ownership concentration explains (part of) the local support to
education expansion. Looking at second stage estimates, the negative impact of changes in
children’s education on changes in parents’ fertility is significant in all cases, thus confirming our
previous findings.26 Also, the Hansen J test suggests that we cannot reject the null hypothesis
that the instruments satisfy the exclusion restrictions, thus providing some evidence in favour
of our reasoning(s) about their validity. As in the panel estimation, 2SLS estimates are larger
in size (in absolute value) with respect to OLS ones, suggesting the latter are biased downward.
As we show in the section 1.5.4 a spatially lagged dependent variable is likely to be one of the
omitted variables that, being positively related to changes in fertility, would cause such bias of
OLS estimates.
Table 1.7 shows the results from the 3SLS procedure including several robustness checks.27 We
first notice that - in line with our reasoning - the share of medium-large livestock owners in
1865 is negatively related to changes in the support to education expansion (first-stage), the
latter being positively related to changes in children’s literacy (second-stage). While column 1
replicates the results obtained using the 2SLS procedure, columns 2-6 present evidence to rule
out the possibility that our results are driven by the Spanish flu. We start by dropping provinces
most affected by this phenomenon: specifically, in columns 2 and 3 we drop provinces where child
26As shown in columns 7-8, this result holds when replacing the child mortality rate with the infant mortalityrate.
27First and second stage panels display only the estimates of the variables of interest.
25

1 Fertility transition and the quantity-quality trade-off: historical evidence from Spain
mortality increased from 1910 to 1920. We observe that - despite the smaller sample size - the
relationship between changes in children’s education and fertility is still negative and significant.
Columns 4 and 5 replicate the analysis using the TFR as measure of fertility. Finally, we use
as dependent variable the change in (log) crude birth rate (CBR) between 1900 and 1917, that
is the year before the influenza pandemic (column 6): this measure of fertility change is then
completely unaffected by the Spanish flu.28 As we notice the estimation results confirm the
negative relationship previously pointed out, meaning that our results are not driven by the
influenza pandemic.
1.5.4 Long-time differences: spatial diffusion
The diffusion of new social and cultural norms has been considered one of the drivers of fertility
transitions, especially after the conclusions reached by the EFP.29 This has also been suggested
for the case of Spain: Reher and Iriso-Napal (1989) argue that a process of diffusion of new ideas
favourable to birth control was actually taking place across Spanish provinces at the beginning
of the 20th century. As it can be noticed by looking at Figure 1.6, there appears to be some
spatial correlation in fertility changes between 1900 and 1920, with larger declines taking place
along the east coast and in some north-western provinces. However, when looking at the spatial
distribution of changes in children’s literacy, a similar pattern stands out (Figure 1.7). Provinces
that improved most in children’s literacy rates are located in the eastern and north-western
regions of Spain. This might suggest that also the spread of new attitudes towards child quality
was taking place.
A first assessment of the degree of spatial autocorrelation in the decline of fertility across Spanish
provinces can be obtained by looking at the Moran’s I.30
28Among the additional control variables, the share of women is defined as women aged 16-45 over populationwhile the share of married women is computed as married women aged 16-45 over women of the same age.
29Other studies dealing with the role of spatial diffusion are Tolnay (1995), Goldstein (2010) et al. and Murphy(2010).
30Moran’s I is a measure of spatial autocorrelation characterizing the relationship of the values of a variablewith the geographical location where they were measured.
26
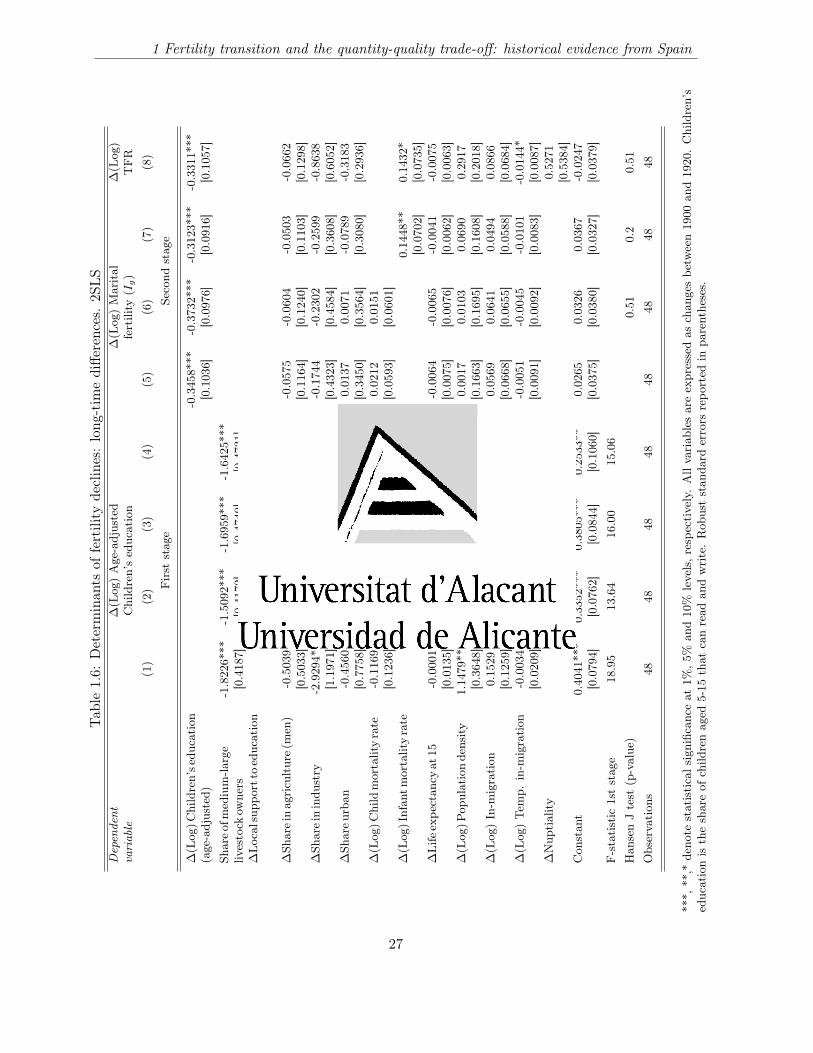
1 Fertility transition and the quantity-quality trade-off: historical evidence from Spain
Tab
le1.6:
Determinan
tsof
fertility
declines:long
-tim
ediffe
rences.2S
LSDependent
∆(L
og)Age-adjusted
∆(L
og)Marital
∆(L
og)
variable
Children’sed
ucation
fertility
(Ig)
TFR
(1)
(2)
(3)
(4)
(5)
(6)
(7)
(8)
First
stage
Second
stag
e
∆(L
og)C
hildren’se
ducation
-0.345
8***
-0.373
2***
-0.3123*
**-0.331
1***
(age-adjusted)
[0.103
6][0.097
6][0.091
6][0.105
7]Sh
areo
fmed
ium-la
rge
-1.822
6***
-1.509
2***
-1.695
9***
-1.642
5***
livestock
owne
rs[0.418
7][0.417
2][0.474
9][0.473
1]∆Localsupp
orttoed
ucation
0.26
85**
*0.27
36**
*0.28
37**
*[0.094
1][0.087
3][0.091
0]∆Sh
areinag
riculture(
men
)-0.503
9-0.582
5-0.620
4-0.697
2-0.057
5-0.060
4-0.050
3-0.066
2[0.503
3][0.508
5][0.509
7][0.512
3][0.116
4][0.124
0][0.110
3][0.129
8]∆Sh
areinindu
stry
-2.929
4**
-2.928
7**
-3.181
4**
-3.846
7***
-0.174
4-0.230
2-0.259
9-0.863
8[1.197
1][1.085
3][1.176
2][1.202
0][0.432
3][0.458
4][0.360
8][0.605
2]∆Sh
areu
rban
-0.456
0-0.441
4-0.599
3-0.810
10.01
370.00
71-0.078
9-0.318
3[0.775
8][0.754
4][0.744
0][0.718
4][0.345
0][0.356
4][0.308
0][0.293
6]∆(L
og)C
hild
mortalityrate
-0.116
9-0.042
50.02
120.01
51[0.123
6][0.132
3][0.059
3][0.060
1]∆(L
og)Infan
tmortalityrate
0.14
520.20
590.14
48**
0.14
32*
[0.174
9][0.167
6][0.070
2][0.073
5]∆Life
expe
ctan
cyat
15-0.0001
0.00
140.00
630.01
13-0.006
4-0.006
5-0.004
1-0.007
5[0.013
5][0.013
4][0.012
4][0.012
1][0.007
5][0.007
6][0.006
2][0.006
3]∆(L
og)P
opulationde
nsity
1.14
79**
*1.32
27**
*1.51
22**
*1.81
43**
*0.00
170.01
030.06
900.29
17[0.364
8][0.355
7][0.411
7][0.393
9][0.166
3][0.169
5][0.160
8][0.201
8]∆(L
og)In-m
igration
0.15
290.10
110.09
290.13
890.0569
0.0641
0.04
940.08
66[0.125
9][0.124
7][0.127
8][0.130
3][0.066
8][0.065
5][0.058
8][0.068
4]∆(L
og)Tem
p.in-m
igration
-0.003
40.01
030.00
440.00
50-0.0051
-0.004
5-0.010
1-0.014
4*[0.020
9][0.022
9][0.023
1][0.023
0][0.009
1][0.009
2][0.008
3][0.008
7]∆Nup
tiality
-1.640
9**
0.52
71[0.747
0][0.538
4]Con
stan
t0.40
41**
*0.33
52**
*0.38
05***
0.25
33**
0.02
650.03
260.03
67-0.024
7[0.079
4][0.076
2][0.084
4][0.106
0][0.037
5][0.038
0][0.032
7][0.037
9]F-statistic
1ststag
e18
.95
13.64
16.00
15.06
Han
senJtest
(p-value
)0.51
0.2
0.51
Observation
s48
4848
4848
4848
48
***,
**,*
deno
testatisticals
ignifican
ceat
1%,5
%an
d10
%levels,r
espe
ctively.
Allvariab
lesareexpressedas
chan
gesbe
tween19
00an
d19
20.Children’s
educationis
theshareof
child
renag
ed5-15
that
canread
andwrite.Rob
uststan
dard
errors
repo
rted
inpa
renthe
ses.
27

1 Fertility transition and the quantity-quality trade-off: historical evidence from Spain
Table 1.7: Determinants of fertility declines: long-time differences. 3SLS and robustness checksDependent variable ∆ (Log)Ig ∆ (Log)TFR ∆ (Log)
CBR1900−17
(1) (2) (3) (4) (5) (6)No No No No
∆1910−20 ∆1910−20 ∆1910−20 ∆1910−20
cmr>0 cmr>0 cmr>0 cmr>0Panel A: Three-stage least squares
∆(Log)Children’s education -0.3458*** -0.3860*** -0.3812*** -0.4298*** -0.3946*** -0.6153***(age-adjusted) [0.1135] [0.1212] [0.1056] [0.1238] [0.0985] [0.1821]∆Share in agriculture (men) -0.0575 -0.1033 -0.1554 -0.1436 -0.1899 -0.3047
[0.1497] [0.1443] [0.1445] [0.1451] [0.1384] [0.2139]∆Share in industry -0.1744 0.0808 -0.1713 -0.3393 -0.6811 -1.2414
[0.5149] [0.4724] [0.4987] [0.5055] [0.5141] [0.7727]∆Share urban 0.0137 -0.6308 -0.6015 -1.0952** -1.1306** -0.0870
[0.3228] [0.5195] [0.5160] [0.5294] [0.5043] [0.4499]∆(Log)Childmortality rate 0.0212 0.1566** 0.1149 -0.0019
[0.0645] [0.0769] [0.0796] [0.0912]∆(Log) Infantmortality rate 0.1863** 0.1822**
[0.0824] [0.0797]∆Life expectancy at 15 -0.0064 -0.0076 -0.0029 -0.0092 -0.0015 -0.0063
[0.0090] [0.0119] [0.0123] [0.0124] [0.0124] [0.0131]∆(Log)Population density 0.0017 0.3505 0.4543* 0.5967** 0.7602*** 0.4870*
[0.1698] [0.2551] [0.2681] [0.2738] [0.2789] [0.2503]∆(Log) In-migration 0.0569 0.1006 0.0625 0.1061 0.0747 0.0294
[0.0651] [0.0733] [0.0724] [0.0783] [0.0721] [0.0911]∆(Log) Temp. in-migration -0.0051 0.0282** 0.0074 0.0165 -0.0035 0.0014
[0.0102] [0.0118] [0.0132] [0.0119] [0.0126] [0.0145]∆Nuptiality 1.2610** 0.9733**
[0.5303] [0.4891]∆Sharewomen 4.9653
[3.2793]∆Sharemarriedwomen 0.4908
[0.8049]
Panel B: Second stage for ∆(Log)Age-adjusted children’s education
∆Local support 1.5610** 1.4072** 1.0604*** 1.3856** 1.1173*** 1.4704**to education [0.6346] [0.6004] [0.3487] [0.5883] [0.3618] [0.6341]
Panel C: First stage for ∆Local support to education
Share ofmedium-large -1.1676** -1.6188** -2.4533*** -1.6220** -2.4086*** -1.1023**livestock owners [0.4974] [0.7791] [0.8534] [0.7806] [0.8568] [0.5033]Observations 48 27 27 27 27 48
***, **,* denote statistical significance at 1%, 5% and 10% levels, respectively. All variables are expressed aschanges between 1900 and 1920 except the dependent variable in column 5.
28

1 Fertility transition and the quantity-quality trade-off: historical evidence from Spain
(−.023,.048](−.061,−.023](−.08,−.061](−.115,−.08](−.181,−.115][−.427,−.181]
Change in (log) marital fertility (1900−1920)
Figure 1.6: Change in (log) marital fertility (1910-1930)
(.48,.76](.38,.48](.27,.38](.22,.27](.17,.22][−.01,.17]
Change in (log) age−adjusted children’s education (1900−1920)
Figure 1.7: Change in (log) age-adjusted children’s literacy, aged 5-15 (1900-1920)
29

1 Fertility transition and the quantity-quality trade-off: historical evidence from Spain
Moran scatterplot (Moran’s I = 0.069)dlnifm
Wz
z−4 −3 −2 −1 0 1 2
−1
0
1
Figure 1.8: Moran’s I: marital fertility
Moran scatterplot (Moran’s I = 0.078)dlnisf
Wz
z−4 −3 −2 −1 0 1 2
−1
0
1
Figure 1.9: Moran’s I: TFR
Figures 1.8 and 1.9 show the Moran scatterplot of the relationship between the change in (log)
marital fertility and (log) TFR between 1900 and 1920 respectively and their corresponding spa-
tially lagged component. As it can be noticed the majority of observations are placed in the first
and third quadrants, suggesting the existence of (positive) spatial autocorrelation (i.e. provinces
characterized by larger declines in fertility surrounded by provinces with a similar pattern, and
similarly for provinces with smaller declines). We account for the role of spatial dependence in
explaining fertility declines by estimating spatial lag and error models via maximum likelihood
estimator (MLE) following Anselin (1988). The spatial lag model is defined as follows:
∆ferti = ρW∆fertj + α1∆educi + α2∆Xi + const+ εi (1.6)
where j 6= i, W is the spatial weight matrix and W∆ferti is the spatially lagged dependent
variable.31
Instead the spatial error model includes a spatial component in the error term:
31The inverse distance spatial weights matrix is computed using latitude and longitude of the capital city ofeach province. This choice is consistent with the fact that new behavioural and cultural norms tend to spreadfirst in the urban environment and then to diffuse also in rural areas.
30

1 Fertility transition and the quantity-quality trade-off: historical evidence from Spain
∆ferti = α1∆educi + α2∆Xi + const+ εi where εi = λWεi + ψi (1.7)
where Wεi is the spatially lagged error term.
Table 1.8 shows the results of estimating Equations 1.6 and 1.7 by MLE.32 Even if there is some
evidence suggesting that a diffusion process might have been in place (positive and significant
rho), we still observe a negative relationship between changes in children’s education and changes
in fertility.
1.6 Conclusion
This paper finds evidence supporting a negative association between quality and quantity of chil-
dren using provincial level data for early 20th century Spain. In the period under consideration,
Spain witnessed the beginning of a process of transformation of the educational system that took
place with large heterogeneity across the country. It is then reasonable to think that part of the
changes in schooling across provinces were due to the different local support that citizens gave to
this process. Taking advantage of this fact this study establishes a causal effect linking children’s
education and parents’ fertility by exploiting instrumental variable strategies that use direct and
indirect measures of local support to education expansion. Specifically, evidence points out that
increases in children’s literacy, which proxies for higher primary school attendance and comple-
tion, are related to declines in fertility. Our result indicates that, by focusing on changes rather
than on levels as the concept of fertility transition suggests and by tackling the endogeneity is-
sues related to the quantity-quality trade-off, there is evidence of a negative association between
children’s education and parents’ fertility across Spanish provinces at the beginning of the 20th
century. This adds evidence in favour of theories arguing that increases in children’s quality are
important in explaining fertility declines.
32Estimation results using infant mortality instead of child mortality (not reported) are qualitatively similar.
31

1 Fertility transition and the quantity-quality trade-off: historical evidence from Spain
Table
1.8:Determ
inantsof
fertilitydeclines:
long-timedifferences.
Spatiallagand
errormodels
(MLE
)Dependent
variable∆(L
og)∆(L
og)∆(L
og)∆(L
og)∆(L
og)∆(L
og)∆(L
og)∆(L
og)Ig
TFR
Ig
TFR
Ig
TFR
Ig
TFR
(1)(2)
(3)(4)
(5)(6)
(7)(8)
Model
SpatiallagSpatialerror
SpatiallagSpatialerror
∆(L
og)Children’seducation
-0.1573**-0.1965***
-0.1422*-0.1859**
-0.1519**-0.1761***
-0.1687**-0.1957***
(age-adjusted)[0.0697]
[0.0736][0.0832]
[0.0861][0.0653]
[0.0672][0.0773]
[0.0744]
∆Sharein
agriculture(men)
0.16850.1393
0.16660.1409
-0.0279-0.0195
-0.0381-0.0315
[0.1875][0.1736]
[0.1609][0.1662]
[0.1079][0.1165]
[0.1385][0.1420]
∆Sharein
industry0.5741
-0.06910.6226
-0.00180.2599
-0.17130.2076
-0.2387[0.4751]
[0.4190][0.5261]
[0.6044][0.3623]
[0.4058][0.4802]
[0.5483]∆Shareurban
-0.1625-0.3501
-0.1888-0.3453
-0.0065-0.1634
0.0269-0.1382
[0.3692][0.3591]
[0.3751][0.3730]
[0.3013][0.2824]
[0.3255][0.3067]
∆(L
og)Population
density-0.0540
0.1465-0.0602
0.1309-0.0378
0.0846-0.0459
0.0893[0.1698]
[0.1898][0.1947]
[0.2220][0.1569]
[0.1825][0.1581]
[0.1804]∆(L
og)Child
mortality
rate0.0233
0.01270.0196
0.01300.0540
0.03850.0534
0.0406[0.0677]
[0.0658][0.0680]
[0.0681][0.0468]
[0.0446][0.0602]
[0.0586]∆Lifeexpectancy
at15-0.0060
-0.0096-0.0051
-0.0086-0.0063
-0.0112-0.0062
-0.0111[0.0088]
[0.0094][0.0103]
[0.0104][0.0076]
[0.0073][0.0084]
[0.0086]∆(L
og)In-m
igration0.1074
0.14640.1068*
0.1408**0.0190
0.05000.0142
0.0397[0.0876]
[0.0915][0.0629]
[0.0652][0.0665]
[0.0652][0.0556]
[0.0584]∆Nuptiality
0.58380.6037
0.9971**0.9826**
[0.5356][0.5626]
[0.4472][0.4677]
∆(L
og)Tem
poraryin-m
igration-0.0089
-0.0130-0.0092
-0.0135[0.0089]
[0.0084][0.0098]
[0.0095]Constant
0.03470.0452
-0.0362-0.0839
0.02930.0622
-0.0165-0.0411
[0.0447][0.0728]
[0.0578][0.0660]
[0.0430][0.0721]
[0.0447][0.0518]
ρ0.6090*
0.6367*0.5645
0.5856λ
0.56150.5168
0.20380.1479
Observations
4949
4949
4848
4848
***,**,*denote
statisticalsignificanceat
1%,5%
and10%
levels,respectively.Allvariables
areexpressed
aschanges
between
1900and
1920.Children’s
educationis
theshare
ofchildren
aged5-15
thatcan
readand
write.
Robust
standarderrors
reportedin
parentheses.
32
Chapter 2
Quantity affects quality: fertility,
education, and gender in 1887 Spain
2.1 Introduction
This paper aims at testing the effect of quantity of (surviving) children on quality of children
in historical context. Using district level data for Spain in the year 1887, it provides evidence
suggesting that parents’ fertility had a significant negative effect on boys’ literacy rates while
evidence is weaker and less robust for girls. On the one hand the significant impact of quantity of
children on boys’ education confirms the existence of a quantity-quality trade-off in the historical
context of late 19th century Spain. Hence, this suggests that in larger families male children
were more likely to be unschooled. On the other hand, this result is consistent with the existence
of cultural heterogeneity across Spain regarding the role of women in society, suggesting that
parents’ fertility - through a budgetary and economic mechanism - was not among the main
determinants of girls’ schooling attainments. For example, if women were not expected to work
outside the house or social norms were such that they were not supposed to attend school, the
number of their siblings would not have affected significantly their school attendance.
The formalization of the theory of the demand for children and of the quantity-quality trade-

2 Quantity affects quality: fertility, education, and gender in 1887 Spain
off as an economic mechanism date back to Becker’s theory of the family (e.g. Becker and
Lewis 1973; Becker 1981). More recently the interplay of quality and quantity of children has
gained attention from the literature analysing the determinants of fertility choice and fertility
transitions (see Guinnane 2011; Galor 2012). The development of unified growth theories suggest
that increasing returns to education - due to technological progress - would lead parents’ to invest
more in the quality of their offspring, thus reducing their quantity to keep their budget balanced
(Galor and Weil 2000). The central mechanism of unified growth theories entails a change in the
relative price of quality with respect to quantity of children. A change in the price of quality
- as due to higher returns to schooling - would lead parents to react by changing their optimal
number of children. In this paper we do not measure (or exploit) changes in returns to schooling
or in relative prices.1 Our paper is a simple test of the existence of a child quantity-quality
trade-off in late 19th century Spain.
Most of the studies investigating the effect of family size (i.e. quantity) on quality of children
uses modern data (e.g. Angrist et al. 2005; Black et al. 2005). This paper closely relates to
the literature that recently focused on analysing the quantity-quality trade-off in a historical
context. Within this literature, Bleakley and Lange (2009) explore the causal effect of education
on fertility by exploiting the eradication policy of the hookworm disease in Southern states
of North America in 1910. Their study argues that this eradication increased the return to
schooling and hence reduced the price of child quality, thus increasing school attendance and
reducing fertility. Becker et al. (2010, 2012) use data on Prussian counties in 1849 and find
evidence of the quantity-quality trade-off in a context in which the demographic transition has
not yet taken place.2 Becker et al. (2010) show that the negative correlation between quantity
and quality of children can be given a causal interpretation. One of their instrumental variable
strategies employs sex ratios in the adult population to instrument fertility levels. Klemp and
Weisdorf (2011) find a significant negative impact of family size on children’s literacy using data
1Bleakley and Lange (2009) claim their are able to measure a change in relative prices of children’s qualityand quantity.
2Our paper is closely related to Becker et al. (2010) as we study the existence of a quantity-quality trade-off in1887, that is before the onset of the demographic transition in Spain. The onset of the transition at the countrylevel is dated 1910 (Reher 2004).
34
2 Quantity affects quality: fertility, education, and gender in 1887 Spain
from Anglican parish registers in England over the period 1700-1830. One of the novelties of
their approach is their instrumental variable strategy. Fertility is instrumented using marital
fecundability, measured by the time interval elapsed from marriage to the first birth. Finally,
Fernihough (2011) finds evidence of the quantity-quality trade-off using census data for Ireland
in 1911: using data for Belfast and Dublin, he finds that higher fertility (measured by the number
of siblings) reduced the probability of school attendance.
In 1857 the Ley Moyano established in Spain compulsory schooling attendance for children aged
between 6 and 9 years.3 As it can be noticed from Table 2.1 children’s literacy - defined as the
share of children aged 5-15 able to read and write - was around 24% in 1887. Gender differences
were also evident as boys’ literacy (29%) was higher than girls’ (19%). Hence, even if school
attendance became compulsory for children aged 6-9 in 1857, in practice children’s literacy was
still relatively low in 1887. Quality of children is usually measured by educational achievements.
Population census data used in this analysis provide information on literacy rates at the judicial
district level. Consequently the measure of quality of children used throughout the paper is
children’s literacy, measured for children aged 5-15.4 This appears to be a good proxy both for
primary school attendance and completion, since literacy is one of the main outputs of primary
school and compulsory schooling in 1887 was restricted to children aged 6-9. A quantity-quality
trade-off exists if, on average, when the number of children is high, quality of children is low
since fewer resources are available for each of them. While there are no specific cultural reasons
why the quantity-quality trade-off should not apply for boys, there are good reasons to believe
this might be the case for girls. In particular, girls might be unschooled not because they have
many siblings but because cultural and social norms are not favourable for them to get educated.
One can expect that in a period in which female education is driven by several factors that go
beyond a pure budgetary mechanism, evidence of the quantity-quality trade-off will be stronger
if considering only boys’ education as indicator of children’s quality.5
3The age limit for compulsory schooling was raised to 12 years in 1909.4Using literacy for children aged 9-15 does not change the qualitative results of the analysis.5This is also in light of the fact that when the analytical framework is a simple cross-section, controlling for
heterogeneity in cultural and social norms is a difficult task.
35

2 Quantity affects quality: fertility, education, and gender in 1887 Spain
Table 2.1: Descriptive statistics(1) (2) (3) (4)
Mean Std. dev. Min Max
District level data
Child-woman ratio 1 0.67 0.09 0.34 0.89
Child-woman ratio 2 1.02 0.11 0.46 1.34
Children’s literacy (aged 5-15) 0.24 0.13 0.02 0.59
Girls’ literacy, (aged 5-15) 0.19 0.11 0.01 0.55
Boys’ literacy (aged 5-15) 0.29 0.15 0.04 0.67
Share in agriculture, men (aged 21-40) 0.72 0.15 0.07 0.93
Share urban 0.1 0.24 0.00 1
Temporary male migration 0.00 0.21 -0.3 4.37
Share in industry, all (aged 21-40) 0.01 0.04 0.00 0.4
Adult literacy (aged 21-50) 0.35 0.13 0.11 0.7
Women-to-men ratio (aged 21-50) 1.09 0.23 0.61 2.42
Population 37085.34 33322.55 7410 470283
Data for 473 judicial districts collected from Spanish population census in 1887.
36

2 Quantity affects quality: fertility, education, and gender in 1887 Spain
The data used in the empirical analysis come from the population census of 1887 which pro-
vides data at the judicial district (partido judicial) level. These units, much smaller in size than
provinces, allow for a relative large cross-sectional sample of more than 400 observations.6 Using
these district-level data, this paper studies the effect of quantity on quality of children allowing
for gender-specific measures of quality. To capture the number of children, we use two alter-
native measures of fertility. One is the child-woman ratio computed as the number of children
aged 0-5 over the number of women aged 16-45 (labelled Child-woman ratio 1 ). The other is
the child-woman ratio computed as the number of children aged 6-15 over the number of women
aged 21-50 (labelled Child-woman ratio 2 ). As mentioned above, quality of children is proxied
by the share of literate (i.e. able to read and write) children aged 5-15. Three measures are
considered: one that includes both boys and girls, one that includes only girls, and another that
considers only male children.
Potential bias of OLS estimates is tackled using an instrumental variable strategy that employs
women-to-men ratios (WMRs hereafter) in the adult population to instrument fertility levels.
WMRs in the adult population identify exogenous variation in parental fertility: it seems reason-
able to assume that they affect children’s education only through their effect on parents’ fertility
behaviour. This strategy is employed in Becker et al. (2010) when studying the effect of parents’
fertility on children’s education across Prussian counties in the 19th century. We cannot use
other - probably more plausible - instruments that have been used in the literature (e.g. twins,
length of time to first birth) as they are not available.
Evidence of a negative effect of parents’ fertility on boys’ education is strong, while the rela-
tionship is weaker when considering girls’ education. The result is robust to various robustness
checks, including the presence of spatial dependence. One the one hand, this study contributes to
the literature by widening the historical empirical evidence on the quantity-quality trade-off to a
Southern European country. On the other hand it suggests that when studying the existence of
a quantity-quality trade-off, especially in a historical and cultural context in which heterogeneity
regarding gender roles is present, distinguishing children’s quality by gender might be important.
6This allows to tackle one of the main criticisms of previous studies analysing, for example, fertility behaviour:the use of statistical units of analysis that are too aggregated (Brown and Guinnane 2007).
37

2 Quantity affects quality: fertility, education, and gender in 1887 Spain
Therefore, conclusions drawn on the base of a measure of quality that does not distinguish female
and male children’s education could be mistaken.
The paper is structured as follows. Section 2.2 describes the data and the empirical strategy.
Section 2.3 shows the results of the analysis. Finally, Section 2.4 concludes.
2.2 Data and empirical strategy
2.2.1 Data
This paper studies the relationship between quantity and quality of children in historical Spain
using district level data. Data is taken from a population census carried out in 1887.7 One of the
advantages that the 1887 census provides is that several data is available not only at the provin-
cial level (49 observations) but also at a much more disaggregated level, that is district-level.8
To capture fertility we use two measures: one is the child-woman ratio computed as the number
of children aged 0-5 over the number of women aged 16-45 (labelled Child-woman ratio 1 ). The
other is the child-woman ratio computed as the number of children aged 6-15 over the number
of women aged 21-50 (labelled Child-woman ratio 2 ). The latter measure includes children aged
6-15 in order to remove the impact that child mortality rates might have on the number of
surviving children. Assuming that women did not have normally children before being 15 years
old, we consider women aged 21-50 to match the age lower bound for children (6).9 The child-
woman ratio is to our knowledge the best indicator of fertility we can obtain using district-level
data. The use of disaggregated data (such as district-level data in this paper) entails a trade-off
between sample size and the quality of some indicators. We assume this is a good indicator since
other studies dealing with the same issue have recently used it to proxy fertility (Becker et al.
2010; Becker et al. 2012). To capture quality of children we use the share of children (aged 5-15)
7The population census is available at www.ine.es.8To give an idea about their size, the districts were on average populated by 37085 individuals with a min-max
of 7410-470283 inhabitants. The maximum value corresponds to the Madrid district.9Using the age range 16-50 for women to compute the child-woman ratio does not affect the results of our
analysis.
38

2 Quantity affects quality: fertility, education, and gender in 1887 Spain
that can read and write, which is also disaggregated by gender. Literacy is used as proxy for
basic schooling attainment as it is the main output of primary school: a literate child is expected
to attend or have attended primary school.
The analysis controls for several possible determinants of children’s educational levels. We mea-
sure the stage of development of the district by using a measure of the dependence on agriculture
(measured by the share of men aged 21-40 working in the primary sector). The development of the
industrial sector is proxied by the share of adult men and women aged 21-40 that work in industry
where industry includes manufacturing, mines and related industries ("industrias derivadas").10
Table 2.1 displays some descriptive statistics that characterize the sample in the year 1887. We
notice that due to the definition of industry some districts (precisely 8) are characterized by
0 shares. Very low shares of industrial employment identify extremely rural environments: of
course this depends to some extent on the definition of the industry sector, but it is in line with
the low industrial development that characterized Spain in 1887: the average share is 0.01 and
also the maximum figure (0.4) is not particularly high. As a proxy of urban environment we use
the share of population living in urban areas defined as the fraction of individuals living in towns
with more than 20000 inhabitants and in the capital city of each province. In addition we use a
dummy variable that takes value one for districts where the capital of each province is located.
This would control for the role of administrative and public jobs opportunities on stimulating
the demand for human capital (at least in terms of literacy and numeracy) and consequently
school attendance. To capture cultural and social norms that affected both parents’ fertility and
children’s education, we use province dummies aiming at capturing within-provinces cultural and
historical similarities: the rationale for this is that individuals living in districts belonging to the
same province are more likely to share common cultural, social and historical characteristics. In
our instrumental variable strategy, we include a measure of temporary men’s migration defined
as the difference between married males and married females, divided by married females. This
measure serves to control for possible migratory phenomena that might happen between districts
because of sex imbalances: Becker et al. (2010) use it for this purpose.
10The disaggregation available regarding occupations does not allow for other categorizations. Transportationis not included in the industry.
39
2 Quantity affects quality: fertility, education, and gender in 1887 Spain
2.2.2 Empirical strategy
The relationship between children’s education and quantity of children is characterized as follows:
educi = γ1 ferti + γ2Xi + ψi (2.1)
where educi is the share of literate children (boys and/or girls) aged 5-15 in judicial district i,
ferti is the child-woman ratio in judicial district i and Xi includes district-level control variables
In order to tackle endogeneity problems due to omitted variables, measurement error and si-
multaneity, an instrumental variable approach is employed. As stated before, fertility levels are
instrumented with the WMR in the adult (i.e. aged 21-50) population.11 The latter should cap-
ture the tightness of the marriage market and consequently the likelihood of couple formation
which is one of the most important factors in determining fertility behaviour, as suggested by
Becker et al. (2010) arguing that (p. 187): "A lower sex ratio (less men than women) establishes
a constraint on the number of children that a typical household may have, e.g., because it leads to
later marriage or decreases the marriage rate of women, pushing fertility rates down... Econo-
metrically, the identifying assumption for this instrument is that the sex ratio is exogenously
determined by differential birth and death rates and that it affects fertility behavior only through
its influence on the probability of finding a mate, but is otherwise unrelated to education." As the
authors point out, migration flows could affect the WMR and being also related to educational
outcomes. We use the same indicator of migration they propose to control for this fact. In
addition the inclusion of province dummies - to control for common cultural characteristics -
should partially account for cultural factors that affect both the WMR and children’s education.
11We use as instrument the log of the WMR to reduce the effect of potential outliers. As we notice from thedescriptive statistics, the WMR varies from 0.61 to 2.42. Five districts take on a value above 2, but these outliersdo not affect significantly the average picture (1.09) that is similar to the one observed, for example, in 1849Prussia where the women-to-men ratio (age 15-45) was 1.01 (Becker et al. 2010).
40

2 Quantity affects quality: fertility, education, and gender in 1887 Spain
Figure 2.1: Boys’ literacy in 1887: larger dots stand for higher literacy rates.
2.3 Quantity and quality of children: results
We estimate the association between fertility and children’s literacy controlling for the set of
controls mentioned in the previous section. In addition we include also latitude and longitude
of each district as there appears to be a North-South divide in children’s literacy (see Figure
2.1).12 Also, we include a measure of adult literacy to account for persistence in educational
choice. We limit its introduction to OLS regressions as it might have a counter-intuitive effect
leading to a difficult interpretation of our estimates. This because after the introduction in 1857
of compulsory schooling for children aged 6-9, there were no significant educational or structural
reforms before 1900. Hence, we can assume that the incentives to get educate were in practice
constant in the second half of the 19th century. Introducing adult literacy - that is the result
of past children’s literacy - might result in the impossibility of identifying the factors explaining
educational levels: as we notice from Table 2.2, the high coefficient associated to adult literacy
12In addition, latitude and longitude should partially capture differences in mortality risk, including childhoodmortality.
41

2 Quantity affects quality: fertility, education, and gender in 1887 Spain
suggests this might be the case.13 Table 2.2 displays OLS estimates of Equation 2.1 using the
first measure of fertility (labelled child-woman ratio 1 ). Overall the association of quantity of
children and literacy is negative but not always significant; also it is stronger when the boys-
specific indicator of quality is used. The inclusion of province dummies seems appropriate as their
coefficients are jointly significantly different from zero in all specifications. We obtain similar
results, but better in terms of significance, using the child-woman ratio 2 as dependent variable
(Table 2.3). The coefficients are always significantly different from zero: a possible explanation
is that the child-woman ratio 2 partially accounts for child mortality. In fact, by reducing
the number of surviving children, higher child mortality can be positively related to children’s
literacy. However causal interpretation cannot be drawn using OLS estimates, which might be
biased for several reasons mentioned above. To address this issue, fertility is instrumented with
the (log of the) women-to-men ratio (WMR), a measure of the tightness of the marriage market.
We start our analysis by estimating the reduced form of this empirical model, that is we look at
the association between the WMR and children’s literacy. Table 2.4 displays the results: these
suggest that higher WMRs - i.e. few men relative to women - are significantly associated with
higher literacy levels but only for boys. We then move to the IV regressions: Table 2.5 reports
the first-stage and second-stage estimates obtained using child-woman ratio 1 to proxy fertility.
As it can be noticed the instrument is significantly correlated with the endogenous variable (see
also Figure 2.2): tighter marriage markets are associated with lower fertility levels.14 Second
stage estimates present a twofold picture similar to the one from the reduced form model: causal
evidence is absent when considering a general measure of children’s education, while it appears
significant when using boys’ literacy as indicator of quality. Similar results are obtained using
child-woman ratio 2 as dependent variable (see Table 2.6). This suggests that across Spain in
the late 19th century parents’ fertility behaviour had an impact mainly on their sons’ education
rather than on their daughters’.
13When regressing children’s literacy only on adult literacy we get an R-squared above 0.86 and the associatedcoefficient is above 1. Also, by looking at Table 2.2 we notice that including adult literacy does not add much interms of model explanation (R-squared increases but slightly), while it seems to be capturing the effect due tothe dependence on agriculture, urbanization (capital city) and (partially) latitude.
14The set of controls X used to obtain the partial correlation plot in Figure 2.2 is the same as the one displayedin Table 2.5.
42
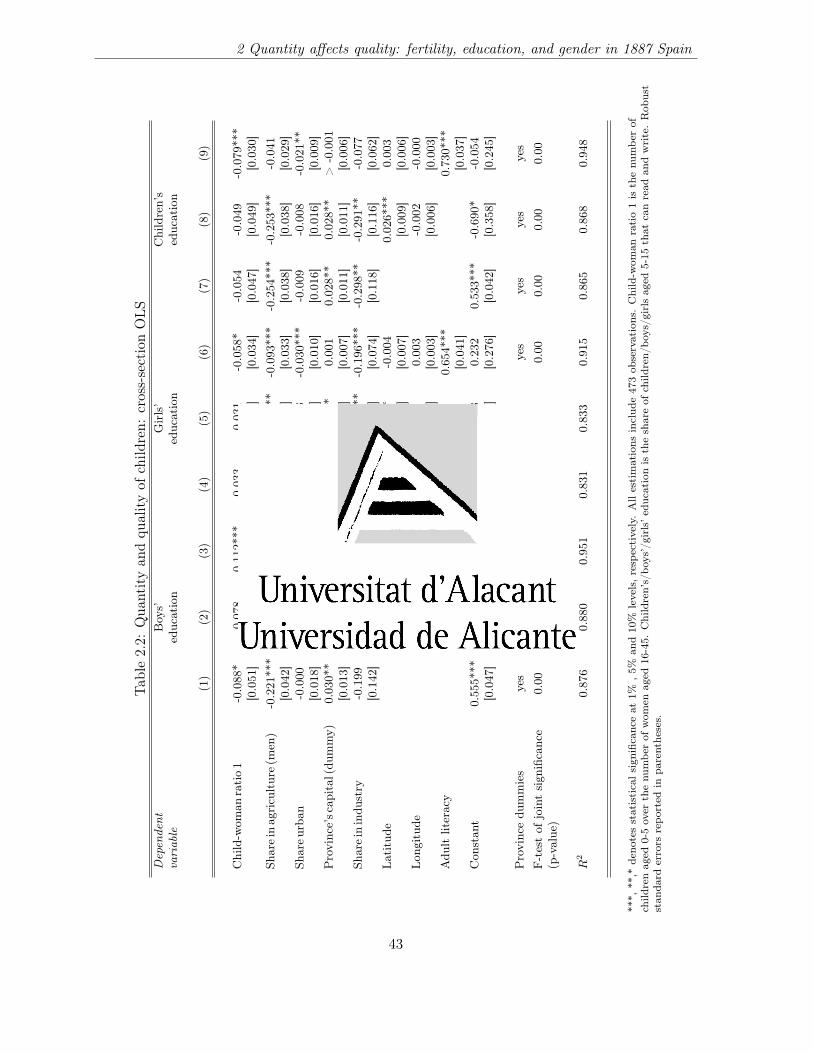
2 Quantity affects quality: fertility, education, and gender in 1887 Spain
Tab
le2.2:
Qua
ntityan
dqu
alityof
child
ren:
cross-sectionOLS
Dependent
Boys’
Girls’
Children’s
variable
education
education
education
(1)
(2)
(3)
(4)
(5)
(6)
(7)
(8)
(9)
Child-w
oman
ratio1
-0.088
*-0.078
-0.112
***
-0.033
-0.031
-0.058
*-0.054
-0.049
-0.079
***
[0.051
][0.052
][0.033
][0.050]
[0.050
][0.034
][0.047
][0.049
][0.030
]Sh
areinagriculture(
men
)-0.221
***
-0.220
***
0.01
4-0.285
***
-0.283
***
-0.093
***
-0.254
***
-0.253
***
-0.041
[0.042
][0.042
][0.032
][0.040]
[0.040
][0.033
][0.038
][0.038
][0.029
]Sh
areu
rban
-0.000
0.00
2-0.013
-0.019
-0.018
-0.030
***
-0.009
-0.008
-0.021
**[0.018
][0.018
][0.011
][0.016]
[0.016
][0.010
][0.016
][0.016
][0.009
]Province’sc
apital(dum
my)
0.03
0**
0.03
0**
-0.002
0.02
7**
0.028*
*0.00
10.02
8**
0.02
8**
>-0.001
[0.013
][0.013
][0.007
][0.011]
[0.011
][0.007
][0.011
][0.011
][0.006
]Sh
areinindu
stry
-0.199
-0.192
0.04
5-0.396
***
-0.389
***
-0.196
***
-0.298
**-0.291
**-0.077
[0.142
][0.136
][0.068
][0.104]
[0.104
][0.074
][0.118
][0.116
][0.062
]Latitud
e0.03
7***
0.01
2*0.01
6*-0.004
0.02
6***
0.00
3[0.010
][0.007
][0.009
][0.007
][0.009
][0.006
]Lon
gitude
-0.006
-0.004
0.00
20.00
3-0.002
-0.000
[0.007
][0.004
][0.006
][0.003
][0.006
][0.003
]Adu
ltliteracy
0.80
5***
0.65
4***
0.73
0***
[0.042
][0.041
][0.037
]Con
stan
t0.55
5***
-1.107
***
-0.405
0.51
8***
-0.338
0.23
20.53
3***
-0.690
*-0.054
[0.047
][0.388
][0.249
][0.042]
[0.358
][0.276
][0.042
][0.358
][0.245]
Provincedu
mmies
yes
yes
yes
yes
yes
yes
yes
yes
yes
F-testof
jointsign
ificance
0.00
0.00
0.00
0.00
0.00
0.00
0.00
0.00
0.00
(p-value
)
R2
0.87
60.88
00.95
10.83
10.83
30.91
50.86
50.86
80.94
8
***,
**,*
deno
tesstatisticalsign
ificanceat
1%,5%
and10%
levels,respectively.Allestimations
includ
e47
3ob
servations.Child-w
oman
ratio1is
thenu
mbe
rof
child
renag
ed0-5over
thenu
mbe
rof
wom
enaged
16-45.
Children’s/bo
ys’/girls’educationistheshareof
child
ren/
boys/g
irlsaged
5-15
that
canread
andwrite.Rob
ust
stan
dard
errors
repo
rted
inpa
rentheses.
43
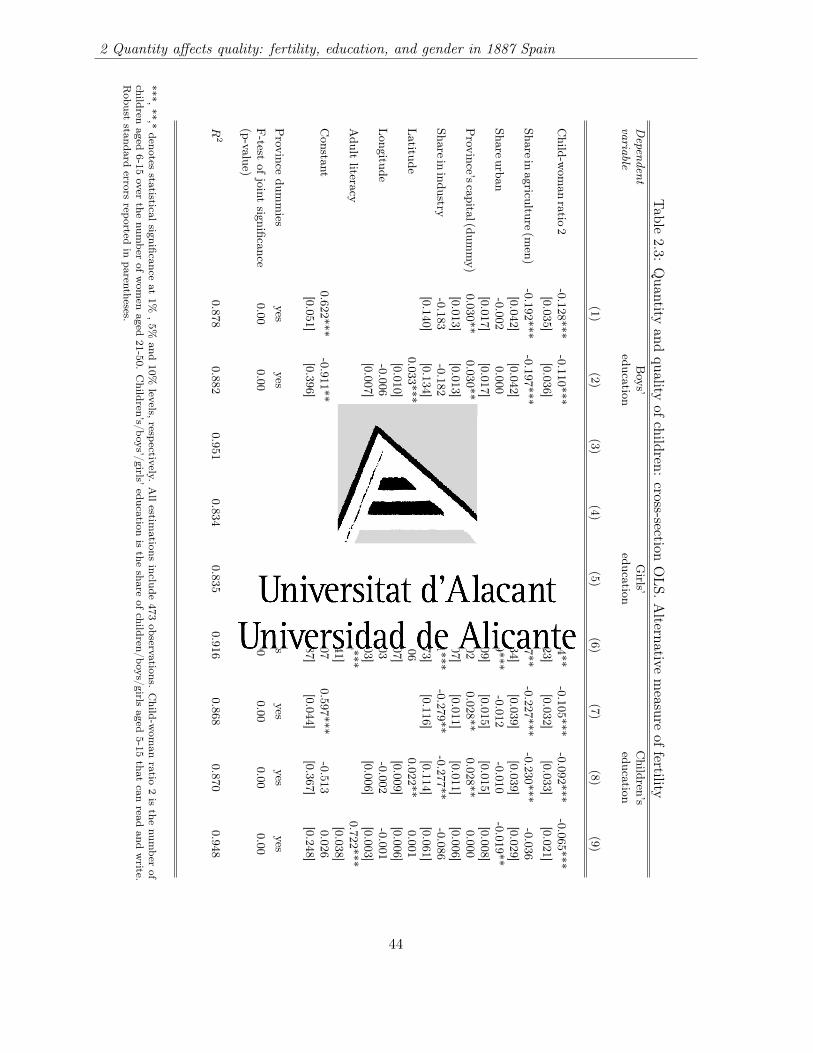
2 Quantity affects quality: fertility, education, and gender in 1887 Spain
Table
2.3:Quantity
andquality
ofchildren:
cross-sectionOLS.A
lternativemeasure
offertility
Dependent
Boys’
Girls’
Children’s
variableeducation
educationeducation
(1)(2)
(3)(4)
(5)(6)
(7)(8)
(9)
Child-w
oman
ratio2
-0.128***-0.110***
-0.080***-0.086***
-0.079**-0.054**
-0.105***-0.092***
-0.065***[0.035]
[0.036][0.025]
[0.033][0.033]
[0.023][0.032]
[0.033][0.021]
Shareinagriculture(m
en)-0.192***
-0.197***0.016
-0.260***-0.261***
-0.087**-0.227***
-0.230***-0.036
[0.042][0.042]
[0.032][0.041]
[0.041][0.034]
[0.039][0.039]
[0.029]Shareurban
-0.0020.000
-0.009-0.023
-0.021-0.029***
-0.012-0.010
-0.019**[0.017]
[0.017][0.011]
[0.015][0.015]
[0.009][0.015]
[0.015][0.008]
Province’scapital(dum
my)
0.030**0.030**
-0.0010.027**
0.027**0.002
0.028**0.028**
0.000[0.013]
[0.013][0.007]
[0.011][0.011]
[0.007][0.011]
[0.011][0.006]
Shareinindustry
-0.183-0.182
0.028-0.375***
-0.372***-0.201***
-0.279**-0.277**
-0.086[0.140]
[0.134][0.067]
[0.102][0.102]
[0.073][0.116]
[0.114][0.061]
Latitude
0.033***0.010
0.013-0.006
0.022**0.001
[0.010][0.006]
[0.009][0.007]
[0.009][0.006]
Longitude
-0.006-0.005
0.0010.003
-0.002-0.001
[0.007][0.004]
[0.006][0.003]
[0.006][0.003]
Adult
literacy0.794***
0.648***0.722***
[0.043][0.041]
[0.038]Constant
0.622***-0.911**
-0.3190.578***
-0.1770.307
0.597***-0.513
0.026[0.051]
[0.396][0.248]
[0.043][0.371]
[0.287][0.044]
[0.367][0.248]
Province
dummies
yesyes
yesyes
yesyes
yesyes
yesF-test
ofjoint
significance0.00
0.000.00
0.000.00
0.000.00
0.000.00
(p-value)
R2
0.8780.882
0.9510.834
0.8350.916
0.8680.870
0.948
***,**,*
denotesstatistical
significanceat
1%,5%
and10%
levels,respectively.
Allestim
ationsinclude
473observations.
Child-w
oman
ratio2is
thenum
berof
childrenaged
6-15over
thenum
berof
wom
enaged
21-50.Children’s/boys’/girls’
educationis
theshare
ofchildren/boys/girls
aged5-15
thatcan
readand
write.
Robust
standarderrors
reportedin
parentheses.
44
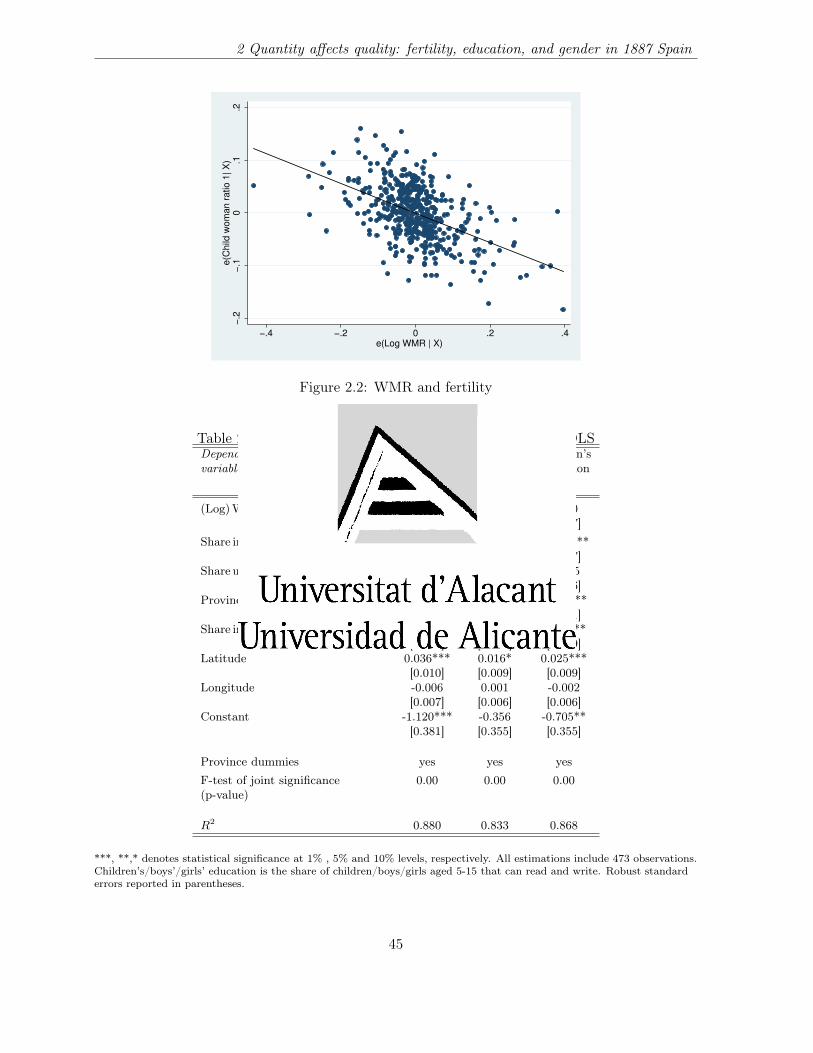
2 Quantity affects quality: fertility, education, and gender in 1887 Spain
−.2
−.1
0.1
.2e(C
hild
wom
an r
atio 1
| X
)
−.4 −.2 0 .2 .4e(Log WMR | X)
Figure 2.2: WMR and fertility
Table 2.4: WMR and children’s education: reduced form. OLSDependent Boys’ Girls’ Children’svariable education education education
(1) (2) (3)
(Log)Women-to-men ratio (WMR) 0.061** 0.009 0.030[0.029] [0.030] [0.027]
Share in agriculture (men) -0.229*** -0.288*** -0.259***[0.041] [0.039] [0.037]
Share urban 0.007 -0.016 -0.005[0.018] [0.016] [0.016]
Province’s capital (dummy) 0.035*** 0.029*** 0.031***[0.013] [0.011] [0.011]
Share in industry -0.182 -0.395*** -0.291**[0.142] [0.105] [0.119]
Latitude 0.036*** 0.016* 0.025***[0.010] [0.009] [0.009]
Longitude -0.006 0.001 -0.002[0.007] [0.006] [0.006]
Constant -1.120*** -0.356 -0.705**[0.381] [0.355] [0.355]
Province dummies yes yes yesF-test of joint significance 0.00 0.00 0.00(p-value)
R2 0.880 0.833 0.868
***, **,* denotes statistical significance at 1% , 5% and 10% levels, respectively. All estimations include 473 observations.Children’s/boys’/girls’ education is the share of children/boys/girls aged 5-15 that can read and write. Robust standarderrors reported in parentheses.
45

2 Quantity affects quality: fertility, education, and gender in 1887 Spain
Table 2.5: Quantity and quality of children: cross-section IV. First and second stage estimatesDependent Child-woman Boys’ Girls’ Children’svariable ratio 1 education education education
(1) (2) (3) (4)
First stage Second stage
Child-woman ratio 1 -0.196** -0.014 -0.087[0.095] [0.100] [0.090]
(Log)Women-to-men ratio (WMR) -0.280***[0.028]
Share in agriculture (men) 0.172*** -0.193*** -0.284*** -0.242***[0.036] [0.044] [0.041] [0.040]
Share urban -0.077*** -0.010 -0.019 -0.013[0.016] [0.018] [0.017] [0.017]
Province’s capital (dummy) -0.033*** 0.030** 0.030*** 0.030***[0.011] [0.012] [0.010] [0.010]
Temporarymalemigration 0.013** -0.022*** -0.020*** -0.021***[0.006] [0.005] [0.005] [0.005]
Share in industry 0.203** -0.133 -0.384*** -0.264**[0.102] [0.137] [0.105] [0.117]
Latitude -0.000 0.036*** 0.016* 0.025***[0.010] [0.010] [0.009] [0.009]
Longitude 0.005 -0.005 0.001 -0.002[0.006] [0.007] [0.005] [0.006]
Constant 0.560 -0.888** -0.231 -0.536[0.403] [0.407] [0.354] [0.365]
Province dummies yes yes yes yes
First-stage F-statistics 100.11
***, **,* denotes statistical significance at 1% , 5% and 10% levels, respectively. All estimations include 473 observations.Child-woman ratio 1 is the number of children aged 0-5 over the number of women aged 16-45. Children’s/boys’/girls’education is the share of children/boys/girls aged 5-15 that can read and write. Robust standard errors reported inparentheses. The instrument for the child-woman ratio is the log of the women-to-men ratio (WMR) in the adultpopulation (aged 21-50).
46

2 Quantity affects quality: fertility, education, and gender in 1887 Spain
Table 2.6: Quantity and quality of children: cross-section IV. Alternative dependent variableDependent Child-woman Boys’ Girls’ Children’svariable ratio 2 education education education
(1) (2) (3) (4)
First stage Second stage
Child-woman ratio 2 -0.187** -0.013 -0.083[0.092] [0.095] [0.085]
(Log)Women-to-men ratio (WMR) -0.294***[0.051]
Share in agriculture (men) 0.321*** -0.166*** -0.282*** -0.230***[0.060] [0.052] [0.049] [0.048]
Share urban -0.063** -0.007 -0.018 -0.012[0.028] [0.017] [0.017] [0.016]
Province’s capital (dummy) -0.027 0.031*** 0.030*** 0.030***[0.018] [0.012] [0.010] [0.010]
Temporarymalemigration 0.016 -0.021*** -0.020*** -0.021***[0.014] [0.005] [0.005] [0.005]
Share in industry 0.168 -0.142 -0.385*** -0.268**[0.157] [0.137] [0.104] [0.115]
Latitude -0.031*** 0.030*** 0.015* 0.022**[0.011] [0.010] [0.009] [0.009]
Longitude -0.002 -0.007 0.001 -0.003[0.009] [0.006] [0.005] [0.005]
Province dummies yes yes yes yes
First-stage F-statistics 33.73
***, **,* denotes statistical significance at 1% , 5% and 10% levels, respectively. All estimations include 473 observations.Child-woman ratio 2 is the number of children aged 6-15 over the number of women aged 21-50. Children’s/boys’/girls’education is the share of children/boys/girls aged 5-15 that can read and write. Robust standard errors reported inparentheses. The instrument for the child-woman ratio is the log of the women-to-men ratio (WMR) in the adultpopulation (aged 21-50).
47

2 Quantity affects quality: fertility, education, and gender in 1887 Spain
2.3.1 Allowing for spatial dependence
Children’s education might be also driven by a diffusion process, where the geographical spread
of attitudes towards education might play a relevant role. As mentioned above, Figure 2.1 shows
the geographical distribution of boys’ literacy where larger dots stand for higher literacy rates.
We notice that there are geographical patterns, with Northern areas on average characterized by
higher children’s education.
We check the degree of spatial autocorrelation in boys’ education across Spanish districts by
looking at the Moran’s I. Moran’s I is a measure of spatial autocorrelation characterizing the
relationship of the values of a variable with the geographical location where they were measured.
Figure 2.3 shows the Moran scatterplot of the relationship between the share of literate boys (aged
5-15) and its corresponding spatially lagged component. As it can be noticed, the majority of
observations are placed in the first and third quadrants, suggesting the existence of positive
spatial autocorrelation (i.e. districts characterized by higher boys’ education surrounded by
districts with a similar pattern, and similarly for districts with lower literacy rates).
To assess whether accounting for spatial dependence affects the negative association between
quantity of children and boys’ education, spatial lag and error models are estimated using OLS
and IV (Anselin 1988).15
The spatial lag model is defined as follows:
educi = ρWeduci + γ1 ferti + γ2Xi + ψi (2.2)
where W is the spatial weight matrix and Weduci is the spatially lagged dependent variable.
15The inverse distance spatial weights matrix is computed using latitude and longitude of the seat of each dis-trict. Latitude and longitude are available at http://www.businessintelligence.info/docs/listado-longitud-latitud-municipios-espana.xls
48

2 Quantity affects quality: fertility, education, and gender in 1887 Spain
Moran scatterplot (Moran’s I = 0.292)educm5_15_h
Wz
z−2 −1 0 1 2 3
−1
0
1
Figure 2.3: Moran scatter plot of boys’ literacy in 1887
Instead the spatial error model includes a spatial component in the error term:
educi = γ1 ferti + γ2Xi + µi where µi = λWµi + εi (2.3)
where Wµi is the spatially lagged error term.
Table 2.7 displays the estimations of the empirical models: OLS spatial lag model (columns 1
and 2), OLS spatial error model (columns 3 and 4), and 2SLS spatial lag model (columns 5
and 6).16 As estimation results suggest, a process of diffusion might be in place (positive and
significant rho) but it does not affect the negative association between fertility and boys’ literacy
across Spanish districts in 1887.
16Using a maximum likelihood estimator to estimate the spatial lag and error models yields similar results.
49
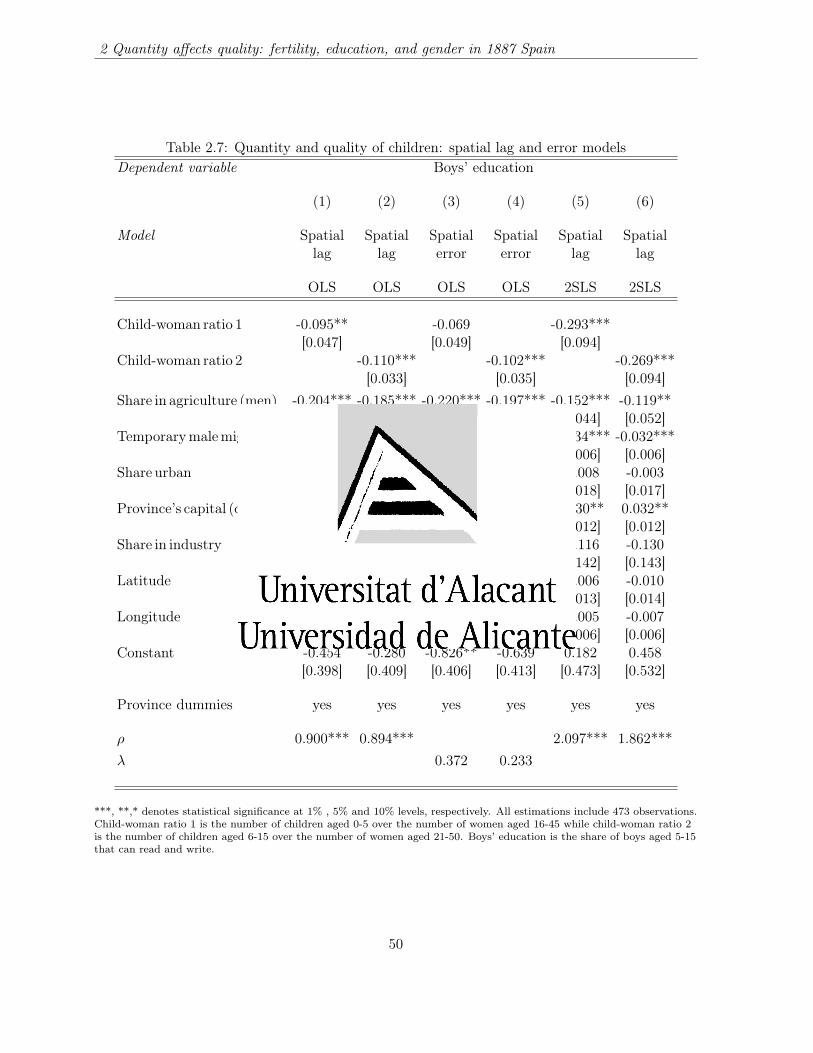
2 Quantity affects quality: fertility, education, and gender in 1887 Spain
Table 2.7: Quantity and quality of children: spatial lag and error modelsDependent variable Boys’ education
(1) (2) (3) (4) (5) (6)
Model Spatial Spatial Spatial Spatial Spatial Spatiallag lag error error lag lag
OLS OLS OLS OLS 2SLS 2SLS
Child-woman ratio 1 -0.095** -0.069 -0.293***[0.047] [0.049] [0.094]
Child-woman ratio 2 -0.110*** -0.102*** -0.269***[0.033] [0.035] [0.094]
Share in agriculture (men) -0.204*** -0.185*** -0.220*** -0.197*** -0.152*** -0.119**[0.038] [0.038] [0.039] [0.040] [0.044] [0.052]
Temporarymalemigration -0.031*** -0.030*** -0.027*** -0.025*** -0.034*** -0.032***[0.006] [0.006] [0.006] [0.006] [0.006] [0.006]
Share urban 0.003 0.003 0.001 -0.001 -0.008 -0.003[0.017] [0.016] [0.017] [0.016] [0.018] [0.017]
Province’s capital (dummy) 0.033*** 0.033*** 0.031*** 0.032*** 0.030** 0.032**[0.012] [0.012] [0.012] [0.012] [0.012] [0.012]
Share in industry -0.179 -0.176 -0.188 -0.176 -0.116 -0.130[0.129] [0.128] [0.130] [0.128] [0.142] [0.143]
Latitude 0.020** 0.017* 0.037*** 0.033*** -0.006 -0.010[0.009] [0.010] [0.009] [0.009] [0.013] [0.014]
Longitude -0.006 -0.007 -0.005 -0.006 -0.005 -0.007[0.006] [0.006] [0.007] [0.007] [0.006] [0.006]
Constant -0.454 -0.280 -0.826** -0.639 0.182 0.458[0.398] [0.409] [0.406] [0.413] [0.473] [0.532]
Province dummies yes yes yes yes yes yes
ρ 0.900*** 0.894*** 2.097*** 1.862***λ 0.372 0.233
***, **,* denotes statistical significance at 1% , 5% and 10% levels, respectively. All estimations include 473 observations.Child-woman ratio 1 is the number of children aged 0-5 over the number of women aged 16-45 while child-woman ratio 2is the number of children aged 6-15 over the number of women aged 21-50. Boys’ education is the share of boys aged 5-15that can read and write.
50
2 Quantity affects quality: fertility, education, and gender in 1887 Spain
2.4 Conclusion
This paper studies the association between quantity and quality of children in historical Spain
using macroeconomic (i.e. district level) data. While evidence of a negative effect of parents’
fertility on a general measure of child literacy is weak, the relationship is significant when consid-
ering only boys’ literacy. This result adds to the within-country empirical evidence that supports
the existence of a quantity-quality trade-off in a historical context (e.g. Becker et al. 2010, Klemp
and Weisdorf 2011) for a Southern European country, thus widening the literature on this issue.
As one can expect that in a historical period in which girls’ education is driven by several factors
that go beyond a pure budgetary mechanism, it also highlights that distinguishing quality of
children by gender might be important.
51


Chapter 3
Human capital, culture and the onset
of the fertility transition
3.1 Introduction
The transformation of an economy from a regime of Malthusian stagnation to one of sustained
growth is fundamentally linked to the process of the demographic transition. By turning to
negative the relation between income and fertility, this transition plays a key role in fostering
economic development and income growth (e.g. Galor and Weil 1999, 2000). As a consequence,
one would expect that countries that first experienced the onset of the demographic transition
would be relatively richer than those that experienced it later on or that have not yet experienced
it. Figure 3.1 shows a scatterplot of per-capita income in the year 2000 and the year at which each
country experienced its fertility transition. These dates have been estimated by Reher (2004)
and identify permanent declines in birth rates, assigning the year 2000 as the transition date
for countries that had not yet experienced the onset.1 The relation between these two variables
is strongly negative, which is consistent with the importance of experiencing a demographic
1These data has been recently used and cited in several papers like for instance Galor (2012) and Andersen etal. (2010). We drop 12 countries that were assigned the year 2000 to avoid arbitrariness.

3 Human capital, culture and the onset of the fertility transition
DZA
ARG
AUT
BHR
BGD
BRBBEL
BEN
BOL
BWABRA
CMR
CAN
CAF
CHL
CHN
COL
CRI
DNK
DOM
ECUEGYSLV
GBRFINFRA
GMB
DEU
GHA
GTM
GUY
HTI
HND
HUN
IND
IDNIRQ
ISRITA
JAM
JPN
JOR
KEN
KOR
KWT
LSO
LBR
MWI
MYS
MLI
MUS
MEX
NPL
NLD
NIC
NER
NOR
PAN
PRYPERPHL
PRT
PRI
RWA
SEN
SGP
ZAF
ESP
LKA
SDN
SWZ
SWECHE
SYR
TZA
THA
TGO
TTO
TUN
USA
URY VEN
ZMB
ZWE
68
10
12
(Lo
g)
GD
P p
er
ca
pita
in
20
00
1850 1900 1950 2000Onset of the DT
Figure 3.1: Onset of the fertility transition and GDP per capita in 2000
transition to enter the sustained growth regime.2
A recent strand of the literature highlights the role of culture in explaining economic development
across countries (Guiso et al. 2006; Spolaore and Wacziarg 2009). Spolaore and Wacziarg (2009)
explain a significant fraction of income differences across countries using their genetic distance
(relative to the technological frontier), which, according to their view, should measure barriers
to the adoption and diffusion of new technology from this frontier. Their measure of genetic
distance captures the general relatedness between populations: the closer two populations are in
terms of genetic distance, the smaller their differences in traits and social norms (e.g., beliefs,
habits, biases, etc.). On the other hand, the literature emphasizes also the role of historical
human capital in promoting a country’s development. Expansion of education is often regarded
as one of the fundamental factors in economic development. Comparative analysis suggests that,
2Another channel through which the demographic transition may spur a country’s per-capita income is theso-called demographic gift, by which a lower population growth rate decreases the dependency rate through itseffect on the population age structure (Bloom and Williamson 1998).
54

3 Human capital, culture and the onset of the fertility transition
among several factors, historical differences in human capital might be responsible for different
paths of development observed during and after the colonization period. For example, Glaeser et
al. (2004) argue that European settlers brought their human capital where they settled in large
numbers, thus fostering technological progress, growth and better institutions.
Following Spolaore and Wacziarg (2009), that use genetic distance to the United Kingdom (UK)
and the United States (US) as a proxy for cultural relatedness to the technological frontier, we
show that genetic distance to the UK (US) has been important in shaping the timing of the fertil-
ity transition across countries. This result is consistent with an indirect channel working through
technology diffusion as in Spolaore and Wacziarg (2009, 2011). Larger genetic distance to the
technological frontier would delay technology adoption and lower productivity and the demand
for human capital, consequently leading to a late onset of the fertility transition. The mechanism
we highlight here follows Galor and Weil (2000) who argue that increasing technological progress
boosts the demand for human capital and, because of the higher return to education, households
eventually trade quantity for quality of children. When a significant fraction of families de-
cides to have fewer and more educated children, the onset of demographic transition takes place.
Therefore, culture and informal institutions, by affecting incentives to innovate and accumulate
human capital, might have shaped the timing of fertility transitions and, consequently, the cur-
rent distribution of income across countries throughout the world. Our reasoning is that genetic
distance to the UK, through its effect on technology adoption and human capital accumulation,
facilitate the onset of the transition, but this does not necessarily mean that the technological
frontier has to be the first country to experience such transition.3
In our analysis we use the UK as the main reference country since it was the technological
leader until the early twentieth century. However, given that most of the fertility transitions in
our sample took place after 1950, we also consider using the US as the reference country.4 The
timing of the demographic transition differs widely across countries, as shown in Table 3.1, which
3There are other factors that are important in explaining the onset of fertility transitions across countries.In fact, the UK, which belongs to the group of "early" transitions (i.e. before 1950) is not the first countryexperiencing the onset - Sweden had its transition in 1865, according to Reher.
4In our largest sample 23 out of 124 countries experienced the onset of the transition before 1950, excludingthe countries assigned a transition in the year 2000.
55

3 Human capital, culture and the onset of the fertility transition
lists the years at which the different countries reached their fertility transition as estimated in
Reher (2004). Figure 3.2 displays a histogram of these dates.5
Table 3.1: Reher’s (2004) estimates of the onset of the demographic transition
Albania 1965 Denmark 1910 Korea, Rep. 1960 Portugal 1925Algeria 1975 Djibouti 1985 Korea, Dem. Rep. 1970 Qatar 1955Angola 1995 Dominican Rep. 1965 Kuwait 1975 Romania 1935Antigua 1960 Ecuador 1970 Kyrgyzstan 1965 Rwanda 1995Argentina 1910 Egypt 1965 Laos 1995 Saudi Arabia 1980Armenia 1965 El Salvador 1965 Lebanon 1965 Senegal 1980Austria 1915 Eritrea 1990 Lesotho 1985 Seychelles 1955Azerbaijan 1965 Ethiopia 1990 Liberia 1995 Singapore 1955Bahamas 1965 Finland 1915 Libya 1980 South Africa 1975Bahrain 1970 France 1900 Madagascar 1990 Spain 1910Bangladesh 1980 Gambia 1985 Malawi 1980 Sri Lanka 1960Barbados 1955 Georgia 1965 Malaysia 1965 Sudan 1980Belgium 1905 Germany 1900 Mali 1995 Suriname 1965Belize 1965 Ghana 1985 Mauritania 1980 Swaziland 1975Benin 1985 Guatemala 1985 Mauritius 1960 Sweden 1865Bhutan 1995 Guinea 1995 Mexico 1970 Switzerland 1910Bolivia 1975 Guyana 1965 Mongolia 1975 Syria 1985Botswana 1975 Haiti 1985 Morocco 1965 Taiwan 1955Brazil 1965 Honduras 1985 Myanmar (Burma) 1975 Tanzania 1975Brunei 1960 Hungary 1890 Namibia 1990 Thailand 1965Bulgaria 1925 India 1960 Nepal 1995 Togo 1985Burundi 1995 Indonesia 1970 Netherlands 1910 Trinidad and Tobago 1965Cameroon 1980 Iran 1985 Nicaragua 1985 Tunisia 1965Canada 1905 Iraq 1975 Niger 1985 Turkmenistan 1965Central Afr. R. 1990 Israel 1955 Nigeria 1995 United Kingdom 1910Chile 1960 Italy 1925 Norway 1905 United States 1925China 1970 Ivory Coast 1985 Oman 1995 Uruguay 1890Colombia 1965 Jamaica 1925 Panama 1970 Uzbekistan 1965Comoros 1990 Japan 1950 Paraguay 1985 Venezuela 1965Costa Rica 1965 Jordan 1975 Peru 1975 Vietnam 1980Cuba 1920 Kenya 1980 Philippines 1955 Zambia 1980 Zimbabwe 1970
Excluding countries that were assigned the onset in the year 2000. These are: Afghanistan, BurkinaFaso, Chad, Congo, Democratic Republic of Congo, Gabon, Guinea Bissau, Mozambique, Sierra Leone,Somalia, Uganda, Yemen.
5Some of Reher’s onset dates differ from other sources (Coale and Watkins 1986, Bailey 2009). In Section 3.3.3we check the robustness of our results using alternative dates.
56
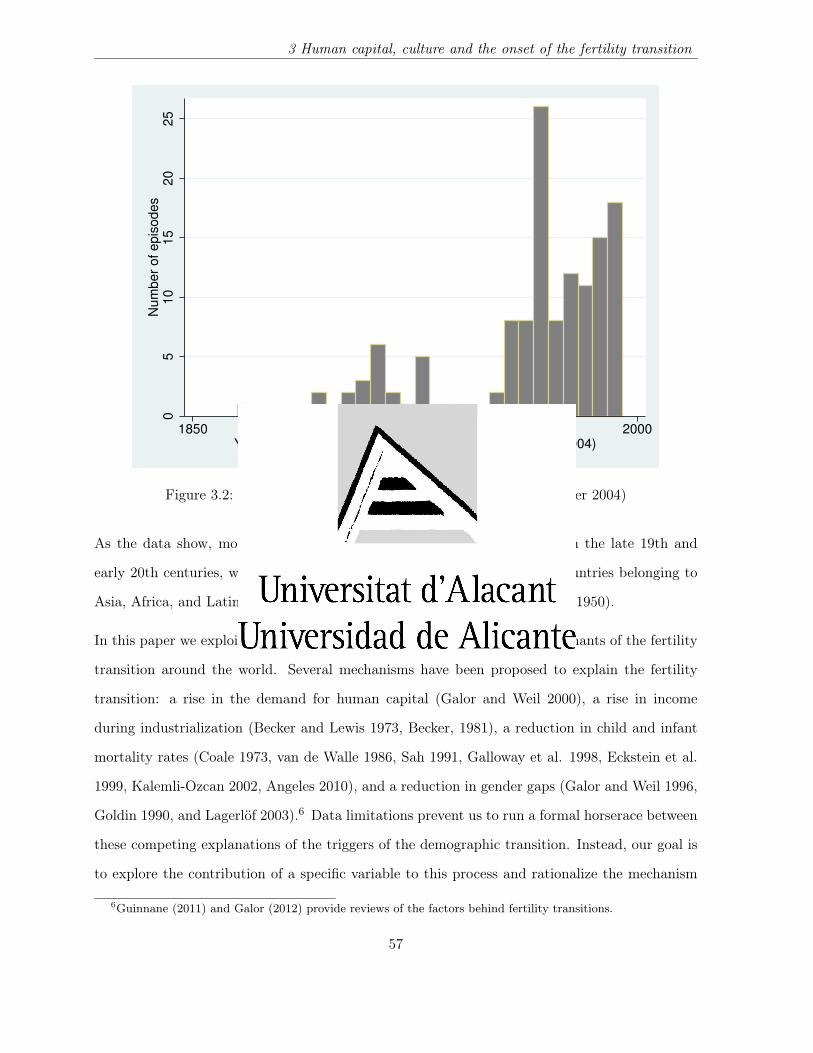
3 Human capital, culture and the onset of the fertility transition
05
10
15
20
25
Nu
mb
er
of
ep
iso
de
s
1850 1900 1950 2000Year of the onset of the demographic transition (Reher, 2004)
Figure 3.2: Year of the onset of the demographic transition (Reher 2004)
As the data show, most of the countries that experienced the transition in the late 19th and
early 20th centuries, were located in Western Europe. In contrast, most countries belonging to
Asia, Africa, and Latin America experienced a late transition (that is, after 1950).
In this paper we exploit cross-country variation to shed light on the determinants of the fertility
transition around the world. Several mechanisms have been proposed to explain the fertility
transition: a rise in the demand for human capital (Galor and Weil 2000), a rise in income
during industrialization (Becker and Lewis 1973, Becker, 1981), a reduction in child and infant
mortality rates (Coale 1973, van de Walle 1986, Sah 1991, Galloway et al. 1998, Eckstein et al.
1999, Kalemli-Ozcan 2002, Angeles 2010), and a reduction in gender gaps (Galor and Weil 1996,
Goldin 1990, and Lagerlöf 2003).6 Data limitations prevent us to run a formal horserace between
these competing explanations of the triggers of the demographic transition. Instead, our goal is
to explore the contribution of a specific variable to this process and rationalize the mechanism
6Guinnane (2011) and Galor (2012) provide reviews of the factors behind fertility transitions.
57
3 Human capital, culture and the onset of the fertility transition
through which it operates. In particular, here we focus on a country’s cultural relatedness to
the technological frontier and show that its impact can be mainly attributed to its effect on
human capital accumulation. We also test whether other measures of historical institutions -
executive constraints and polity2 scores - are related to the onset of the demographic transition
across countries. Contrary to the proxy of informal institutions (i.e. genetic distance), these
alternative measures of historical formal institutions do not show a robust relationship with the
year of the onset. This result is consistent with cultural relatedness to technological frontier
favouring technology adoption (Spolaore and Wacziarg 2009, 2011) which foster human capital
accumulation and the onset of the fertility transition (Galor 2012). Figure 3.3 shows a strong
positive correlation between the demographic transition years and genetic distance to the UK.
The main findings of our paper can be summarized as follows. First, a large genetic distance
with respect to the UK (US) delays a country’s fertility transition. Second, when we instrument
a country’s schooling levels in 1870 with genetic distance to the UK and the percentage of
Protestants in the population - or alternatively with a country’s physical distance from Germany
- we find a strong causal effect of human capital on the onset of the fertility transition, as predicted
by Galor andWeil (2000).The mechanism behind this relationship is as follows. Genetic proximity
to the UK enhances a country’s demand for human capital. Protestantism, on the other hand,
is associated with a boost in the supply of human capital. These two effects enhance human
capital accumulation which in turn induces families to reduce their offspring, triggering the
fertility transition.
The paper is organized as follows. Section 3.2 summarizes the sparse empirical literature that
has attempted to isolate different triggers of fertility transitions across countries. Section 3.3
describes the data and methodology used in the analysis. Section 3.4 presents the finding that
genetic distance from the UK is a robust determinant of the onset of the fertility transition across
countries. Section 3.5 illustrates the mechanism at work. Finally, Section 3.6 concludes.
58

3 Human capital, culture and the onset of the fertility transition
ALB
DZA
AGO
ATG
ARG
ARM
AUT
AZE BHSBHR
BGD
BRB
BEL
BLZ
BEN
BTN
BOL BWA
BRABRN
BGR
BDI
CMR
CAN
CAF
CHL
CHNCOL
COM
CRI
CUB
DNK
DJI
DOMECU
EGY SLV
ERIETH
FIN
FRA
GMB
GEO
DEU
GHAGTM
GIN
GUY
HTIHND
HUN
IND
IDN
IRN
IRQ
ISR
ITA
CIV
JAM
JPN
JORKEN
KOR
PRKKWT
KGZ
LAO
LBN
LSO
LBR
LBY
MDG
MWI
MYS
MLI
MRT
MUS
MEXMNG
MAR
MMR
NAMNPL
NLD
NIC NER
NGA
NOR
OMN
PAN
PRY
PER
PHL
PRT
QAT
ROU
RWA
SAU SEN
SYCSGP
ZAF
ESP
LKA
SDN
SUR
SWZ
SWE
CHE
SYR
TWN
TZA
THA
TGO
TTOTUN TKM
USA
URY
UZBVEN
VNM ZMB
ZWE7
.52
7.5
47
.56
7.5
87
.6(L
og
) O
nse
t o
f th
e D
T
3 4 5 6 7 8(Log) Genetic distance to the UK (weighted)
Correlation=0.70***
Figure 3.3: Genetic distance to the UK and the onset of the fertility transition
3.2 Literature review
Since our contribution is purely empirical, in this section we limit ourselves to discussing the
empirical papers that analyze possible triggers of fertility transitions.7 The Princeton European
Fertility Project (e.g. see Coale andWatkins 1986) was one of the first comprehensive studies that
used data from the 19th century to document different demographic transitions in Europe and
analyze their possible triggers. The emphasis in this project, however, was mainly on cultural and
sociological explanations, ignoring economic factors. More recently, the development of unified
growth theories that seek to explain economic growth in the very long run has spurred interest
in identifying the role of different socio-economic factors in explaining demographic transitions.
The first - and most common - methodological approach has been to study the correlation between
fertility and income at different time periods. For instance, using a sample of countries in the
7The literature review in Galor (2012) also includes theoretical papers.
59
3 Human capital, culture and the onset of the fertility transition
1960-1999 period, Lehr (2009) examines the existence of different regimes in terms of fertility
dynamics. She finds that, at early stages of development, increases in productivity and primary
schooling-enrolment are typically associated with increases in fertility. In contrast, at higher
levels of development, productivity and education are shown to be negatively associated with
fertility, whereas the level of parents’ human capital has a somewhat positive effect. In all periods,
increases in secondary-schooling enrolment are correlated with drops in fertility rates. Herzer et
al. (2012) find evidence that increasing income and falling mortality are the main explanatory
factors of fertility declines over the 20th century across a selected sample of countries. Murtin
(forthcoming) uses data for a large panel of countries since 1870 and concludes that education
is the main trigger of changes in the birth rate and that the effect of health improvements is of
second order. Becker et al. (2010) use data on Prussian counties in 1849 and identify a negative
relation between child quantity and education in a context in which the demographic transition
has not yet taken place. Another finding of their study is that the initial level of education is
a good predictor of the demographic transition that occurred in Prussia during the 1880-1905
period. Finally, Murphy (2010) analyzes historical French département data for the late 19th
century and finds that both economic and cultural factors had an effect on different fertility
patterns across these geographical units. In particular, education, measured as female literacy
and child enrolment in primary schools, has a negative impact on fertility, whereas wealth is
correlated with larger family sizes.8
A different approach is to use information on the years of the onset of fertility transitions in
different countries to directly identify their main historical determinants. Andersen et al. (2010)
use this strategy to analyze how cataract incidence explain cross-country variation in labour
productivity. They argue that an earlier onset of vision loss reduces the return to human capital,
8There are several studies that focus on the closely related children’s quantity-quality trade-off. For instance,Rosenzweig and Wolpin (1980) were the first to use exogenous variations in fertility to identify the effect of childquantity on child quality. They instrumented child quantity with increases in family size resulting from multiplebirths and show that child quantity significantly reduces children’s education. Bleakley and Lange (2009) explorethe causal effect of education on fertility by exploiting the eradication policy of the hookworm disease in southernstates in North America. Their paper argues that this eradication increased the return to schooling and hencereduced the price of child quality. This exogenous change, in turn, increased school attendance and reducedfertility. Other relevant papers are Angrist et al. (2005), Black et al. (2005), and Qian (2009). See Schultz (2008)for a summary of this literature.
60

3 Human capital, culture and the onset of the fertility transition
and hence delays the demographic transition.
3.3 Data and methodology
3.3.1 Baseline analysis
In our baseline analysis our main variable of interest is a proxy of informal institutions. Specifi-
cally we consider a measure of cultural relatedness, genetic distance to the UK (or the US) taken
from Spolaore and Wacziarg (2009) - SW henceforth - aiming to capture cultural proximity to
the technological frontier.9
We first investigate the effect of genetic distance to the UK on the timing of the fertility transition
across countries by estimating the following model using ordinary least squares (OLS):10
log onseti = β1 + β2 ∗ log gendisti,UK + β′3Xi + εi (3.1)
where log onseti represents (the log of) the year of the onset of the fertility transition in country
i, log gendisti,UK represents (the log of) genetic distance to the UK in country i, Xi is a set of
country i control variables, and ε is a standard error term. Xi includes different sets of standard
determinants of long-run development and productivity used in the literature. To account for
the potential effect of geography and climate, we control for the absolute latitude of a country’s
centroid, the average distance to the nearest ice-free coast, the malaria ecology index, and a set of
continental dummies (Africa, Asia, Europe, North America, and South America). The historical
variables included in the regressions are population density in 1400 and the years passed since
the Neolithic revolution (i.e. the agricultural transition).11 We also control for the type of legal
origins (British common law, French civil law, socialist law, German civil law, and Scandinavian
9Throughout our analysis we use the measure weighted genetic distance that accounts for sub-populations’genetic groups. The other measure provided by Spolaore and Wacziarg (2009), named dominant genetic distance,considers only the largest groups of each country’s population.
10We take logs of the two key variables to reduce the impact of outliers.11Data on the agricultural transition are from Louis Putterman’s Agricultural Transition Year Country Data
Set.
61
3 Human capital, culture and the onset of the fertility transition
law) and the 1900 shares of protestants, catholics and muslims.12
Table 3.2 contains the definitions and sources of all the variables used in the cross-sectional
exercise.
3.3.2 Bilateral analysis
In this section we follow an approach similar to SW. We assess whether the role of cultural
relatedness to the technological frontier as a determinant of the fertility transition is still present
using a bilateral approach considering countries pair by pair. One advantage of this approach
is that it makes use of a much larger dataset and so it helps increasing the precision of our
estimates. To do so, we regress the distance in the onset of the fertility transition between each
pair of countries on their genetic distance relative to the UK (US) and on a set of controls very
similar to those of SW aimed at capturing geographical, climatic, and historical differences which
can be interpreted as distances. We account for the effect of geographical distances by including
the absolute difference in latitudes and longitudes, the geodesic distance between countries, a
dummy that takes a value of one if both countries in the pair are contiguous, a dummy that
takes a value of one if at least one country is landlocked, a dummy that takes a value of one if at
least one country is an island, and a measure of climatic similarity based on 12 Koeppen-Geiger
climate zones.13 We also add as covariates a set of dummies that take a value of one if two
countries in a pair are located in the same continent. We include a measure of transportation
costs based on freight rates for surface transport (sea or land).14 To control for common historical
and cultural characteristics we use a dummy taking a value of one if both countries in a pair share
the same legal origins, and zero otherwise; a dummy taking a value of one if both countries in a
pair share the same colonial origins, and zero otherwise; and a dummy taking a value of one if
both countries share a common official language. As for climate, religious similarity is measures
12Religion adherence is particularly important in our context as some religions differed substantially in thepromotion of literacy and education (Ferguson, 2011).
13This is measured as the average absolute value difference in the percentage of land area in each of the 12climate zones between two countries.
14Transportation-cost data is from http://www.importexportwizard.com/. The measure refers to 1000kg ofunspecified freight transported over sea or land, with no special handling.
62
3 Human capital, culture and the onset of the fertility transition
with the average absolute value difference, between two countries, in the percentages of religions
followers in 1900 in each of 10 religious categories. All variables used in this section, along with
their sources, are listed in Table 3.3. Our estimation model in this case is the following:
|log onseti − log onsetj | = α+ β|log gendisti,UK − log gendistj,UK |+ γ′Qi,j + εi,j (3.2)
where |log onseti − log onsetj | represents the absolute value of the log difference in the year of
the onset of the fertility transition between country i and j, |log gdi,UK − log gdj,UK | represents
the absolute value of the genetic (log) distance relative to the UK between country i and j and
Qi,j includes the mentioned measures of geographical, climatic and historical distances between
country i and j. Finally, εi,j is the error term associated with the country pair ij.15 This approach
allows us to investigate whether differences (and similarities) in culture (relative to the UK and
the US) explain the distance in the timing of the onset of fertility transitions between pairs
of countries. Specifically, we ask whether similar (different) timing in the onset is explained
by similar (different) culture (relative to the UK and US), controlling for the effect of similar
(different) geographical, climatic, and historical contexts.
3.3.3 Robustness checks
Next we perform two robustness checks. First, we use alternative dates for the onset of fertility
transitions for those who experienced an "early transition". Reher’s dates might be criticized
especially for some countries as France which are assigned a relatively late onset. To account for
this, we use dates from Coale and Watkins (1986) and Bailey (2009) which are directly related
to the European Fertility Project. Using alternative onset dates is a sensible thing to do, since
some of Reher dates have been criticized on two grounds.
15As Spolaore and Wacziarg (2009) point out, spatial correlation results from the construction of the dependentvariable. We follow their strategy to address this issue by using two-way clustered standard errors.
63

3 Human capital, culture and the onset of the fertility transition
Table
3.2:Variables
anddata
sources:cross-section
analysis
Variable
nameand
descriptionSource
Onset
ofthe
fertilitytransition
Reher
(2004);Bailey
(2009)Genetic
distanceto
theUK
(USA
),weighted
Spolaoreand
Wacziarg
(2009)Executive
constraintsin
1850and
1900Polity4,version
3(2008)
Polity2
scorein
1850and
1900Polity4,version
3(2008)
Absolute
valueof
latitudeof
countrycentroid
Nunn
andPuga
(2012);andGallup
etal.(2001)
Average
distanceto
nearestice-free
coast(1000
km)
Nunn
andPuga
(2012)Continentaldum
mies
Nunn
andPuga
(2012)Malaria
ecologyindex
Sachset
al.(2004)
Population
densityin
1400Nunn
andPuga
(2012)Years
passedsince
theNeolithic
revolutionPutterm
an(2006)
LegaloriginsNunn
andPuga
(2012)Shares
ofreligion
followers
in1900
Robert
Barro’s
website
Average
yearsof
education(age
15-64)Morrisson
andMurtin
(2009)Geodesic
distanceto
Germ
anyhttp://w
ww.cepii.fr/anglaisgraph/bdd/distances.htm
64

3 Human capital, culture and the onset of the fertility transition
Tab
le3.3:
Variables
andda
tasources:
bilaterala
nalysis
Variablena
mean
ddescription
Source
Onset
ofthefertility
tran
sition
Reher
(2004)
Genetic
distan
cerelative
toUK,w
eigh
ted
Spolaore
andWacziarg(2009)
Absolutevalueof
latitude
ofcoun
trycentroid
Nun
nan
dPug
a(2012);a
ndGallupet
al.(2001)
Con
tinental
dummies
Nun
nan
dPug
a(2012)
Dum
myforland
locked
Nun
nan
dPug
a(2012)
Dum
myforisland
CIA
Factbo
okDum
myforcoun
tries’
contiguity
http://w
ww.cepii.fr/ang
laisgrap
h/bd
d/distan
ces.htm
Legalo
rigins
Nun
nan
dPug
a(2012)
Colon
ialh
istory
Nun
nan
dPug
a(2012)
Areain
each
Kop
perclim
atic
zone
Gallupet
al.(2001)
Absolutevalueof
long
itud
eof
coun
trycentroid
Nun
nan
dPug
a(2012);a
ndGallupet
al.(2001)
Geodesicdistan
cebe
tweencoun
tries
http://w
ww.cepii.fr/ang
laisgrap
h/bd
d/distan
ces.htm
Com
mon
official
lang
uagesbe
tweenpa
irof
coun
tries
http://w
ww.cepii.fr/ang
laisgrap
h/bd
d/distan
ces.htm
Shares
ofrelig
ionfollo
wersin
1900
Rob
ertBarro’s
website
Transpo
rtationcosts
http://w
ww.im
portexpo
rtwizard.com/
65

3 Human capital, culture and the onset of the fertility transition
First, some of the "early" transitions in Reher seem to take place too late. This seems to be the
case for instance in France, where other sources suggest that the fertility transition took place
around 1827 rather than 1900. Second, there seems to be too much bunching across fertility
transition years in the Reher estimates, as all the dates occur precisely at the beginning of a
decade or exactly in the middle of it. Table 3.4 shows the discrepancies in the dates calculated
by Reher (2004), Coale and Watkins (1986) and Bailey (2009). The first thing to notice is that
the discrepancies only occur in Western countries, the ones that were the focus of Coale and
Watkins (1986) and Bailey (2009). Second, the Coale-Watkins dates and the Bailey’s ones are
very similar in most cases. One exception is France, for which Coale-Watkins estimate that
the fertility transition took place in 1827, while Bailey’s date is 1814. The second robustness
check we perform is to control for alternative measures of formal historical institutions, namely
executive constraints and an index of democracy scores in 1850 and 1900.16 Although there is no
formal theory that directly links the fertility transition to the quality of institutions it can be the
case that human capital promotion is enhanced by a well-functioning institutional framework.
Table 3.4: Alternative fertility transitions datesCountry Reher Coale-Watkins Bailey
Austria 1915 1907 1908Belgium 1905 1881 1882Denmark 1910 1898 1899England 1905 1892 1892Finland 1915 1912 1911France 1900 1827 1814Hungary 1890 1910 1900Italy 1925 1913 1912Netherlands 1910 1897 1897Norway 1905 1903 1904Portugal 1925 1916 1916Spain 1910 1920 1919Sweden 1865 1902 1897Switzerland 1910 1887 1886
Coale and Watkins (1986) also provide transition dates for Germany, Greece, Ireland, Russia, and Scotland. Weomit those here since Reher does not include these countries in his sample. Bailey (2009) adds Bulgaria and
Wales to this list.
16The variables we use are xconst and polity2 from the data set Polity IV and measure a country’s institutionalframework. See Marshall and Jaggers (2008) for a detailed description.
66

3 Human capital, culture and the onset of the fertility transition
3.4 Results: genetic distance to the technological frontier and the
onset of fertility transition
3.4.1 Baseline analysis
Following SW, genetic distance might indirectly affect the timing of the fertility decline as it
proxies for a cultural environment favourable to technological progress and adoption of innova-
tions. This would favour education and human capital accumulation, then triggering an earlier
onset of the fertility transition (Galor 2012). Here we test for the existence of this indirect
channel. In Section 3.5 we will provide evidence suggesting that this mechanism is plausible
and that the effect of genetic distance from the technological frontier on the timing of the on-
set of the fertility transition is accounted by historical levels of educational attainments. Table
3.5 shows the estimation results obtained by regressing the timing of the fertility transition on
genetic distance to the UK. Specification 1 simply uses the log of genetic distance to the UK
as regressor. Its impact is positive and statistically significant, suggesting that a larger genetic
distance from the UK (i.e. a larger difference in the cultural environment with respect to the
technological frontier) delays the onset of the fertility transition. This estimate is qualitatively
similar if one adds geography and climate, history, legal origins, and religion as controls. In-
cluding all these regressors simultaneously in the same specification does not significantly alter
the results (column 6); the same applies when considering genetic distance to the US (column
7) which, as mentioned above, it may be considered the technological frontier after 1950. The
size of these estimates is quantitatively important. The coefficients from specification 6 suggest
that, for instance, if Lesotho had been culturally as similar - in terms of genetic distance - to the
British population as Spain, then it would have experienced a fertility transition twenty-eight
years earlier than what the model predicts (in 1944 rather than 1972).
67

3 Human capital, culture and the onset of the fertility transition
Table
3.5:Cross-section
OLS:determ
inantsof
theonset
offertility
transitions(1)
(2)(3)
(4)(5)
(6)(7)
(Log)Genetic
distance0.0093***
0.0024**0.0106***
0.0085***0.004**
0.0034**to
theUK
[0.0008][0.0012]
[0.0011][0.0008]
[0.0017][0.0016]
(Log)Genetic
distance0.0055*
tothe
USA
[0.0028]Geography
andclim
ateno
yesno
noyes
yesyes
History
nono
yesno
yesyes
yesLegalorigins
nono
noyes
yesyes
yesReligion
nono
nono
noyes
yesR-squared
0.490.73
0.530.61
0.780.81
0.8Observations
124116
114124
109108
108**,**,*
denotesstatisticalsignificance
at1%
,5%and
10%levels,respectively.
Estim
ationwith
robuststandard
errors(reported
insquared
brackets).Allregressions
includeaconstant.
Dependent
variable:(Log)
Onset
ofthefertility
transitionas
inReher
(2004).
68
3 Human capital, culture and the onset of the fertility transition
3.4.2 Bilateral analysis
Table 3.6 shows the OLS estimates obtained from the regression in Equation 3.2. In column 1,
where we do not add any control variable, larger differences in genetic distance (relative to the
UK) are associated with larger time distances in the onset of fertility transition. In columns 2 to
5, we add different controls. In particular, column 2 adds measures of geographical differences,
column 3 includes a measure of climatic similarity, column 4 includes a set of continental dum-
mies, whereas column 5 adds the measure of transportation costs described above. Throughout
all specifications, including column 6 where we add all the controls, larger genetic distances (rel-
ative to the UK) are associated with wider differences in the timing of the fertility transition.
In columns 7-9 we add controls for similar legal origins, colonial history, language and religion,
respectively. The inclusion of these variables affects neither the significance nor the size of the
coefficient associated with the difference in genetic distance relative to the UK. These results
again provide strong evidence of the importance of cultural differences - specifically relative to
the technological frontier - in determining international differences in the onset of the fertility
transition.
3.4.3 Robustness checks
Using alternative dates of the onset of fertility decline for some of the transitions (mainly "early"
ones, which correspond to Western countries) does not alter our main result as it can be noticed
by looking at Table 3.7.17 If anything, the association is strengthened as, in all cases, the
coefficients of interest are larger in absolute value using these onset dates. We also test the role
of formal institutions on the timing of fertility transition using different proxies as executive
constraints and a democracy index scores measured in 1850 and 1900 (from the data set Polity
IV, see Marshall and Jaggers 2008). The question we ask here is whether the effect of genetic
distance to the technological frontier on the timing of the onset of the fertility transition is robust
17For the sake of brevity we only report the results using the alternative dates from Coale and Watkins (1986).Considering the Bailey (2009) dates gives us almost identical estimates.
69
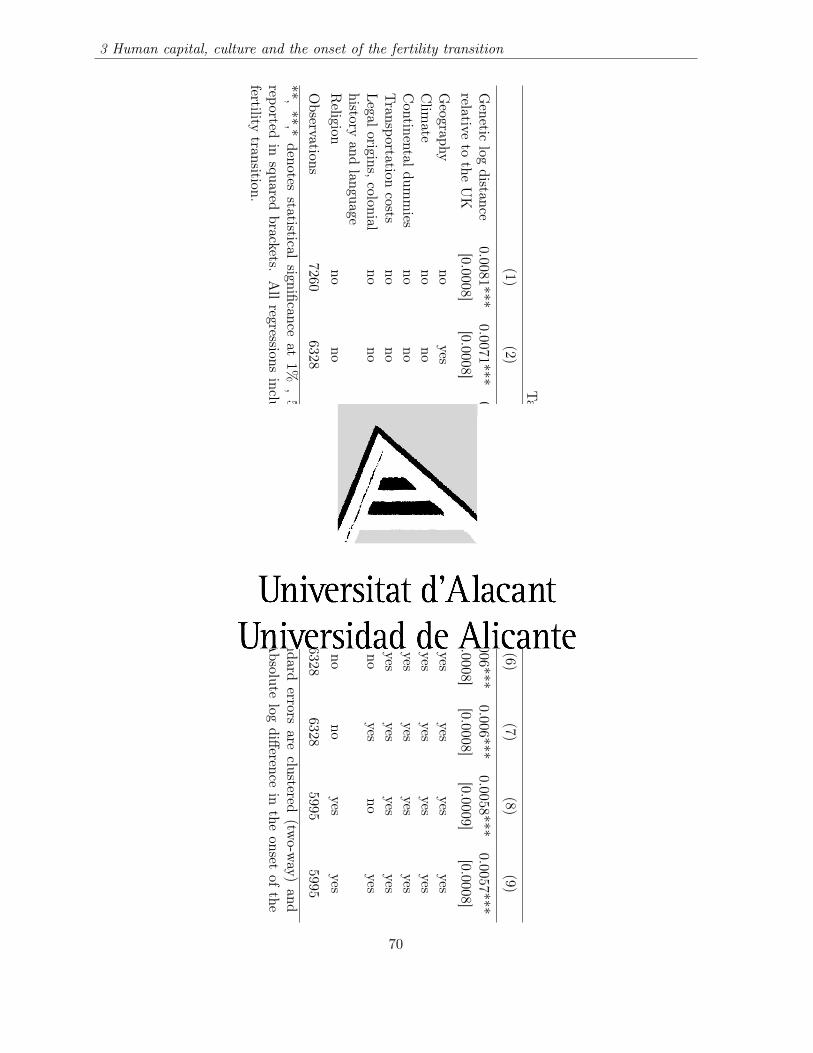
3 Human capital, culture and the onset of the fertility transition
Table
3.6:Bilateralanalysis:
OLS
(1)(2)
(3)(4)
(5)(6)
(7)(8)
(9)
Genetic
logdistance
0.0081***0.0071***
0.0078***0.0075***
0.0081***0.006***
0.006***0.0058***
0.0057***relative
tothe
UK
[0.0008][0.0008]
[0.0008][0.0008]
[0.0008][0.0008]
[0.0008][0.0009]
[0.0008]Geography
noyes
nono
noyes
yesyes
yesClim
ateno
noyes
nono
yesyes
yesyes
Continentaldum
mies
nono
noyes
noyes
yesyes
yesTransportation
costsno
nono
noyes
yesyes
yesyes
Legalorigins,colonialno
nono
nono
noyes
noyes
historyand
languageReligion
nono
nono
nono
noyes
yesObservations
72606328
63287260
72606328
63285995
5995**,
**,*denotes
statisticalsignificance
at1%
,5%
and10%
levels,respectively.
Standarderrors
areclustered
(two-w
ay)and
reportedin
squaredbrackets.
Allregressions
includeaconstant.
Dependent
variable:Absolute
logdifference
inthe
onsetof
thefertility
transition.
70
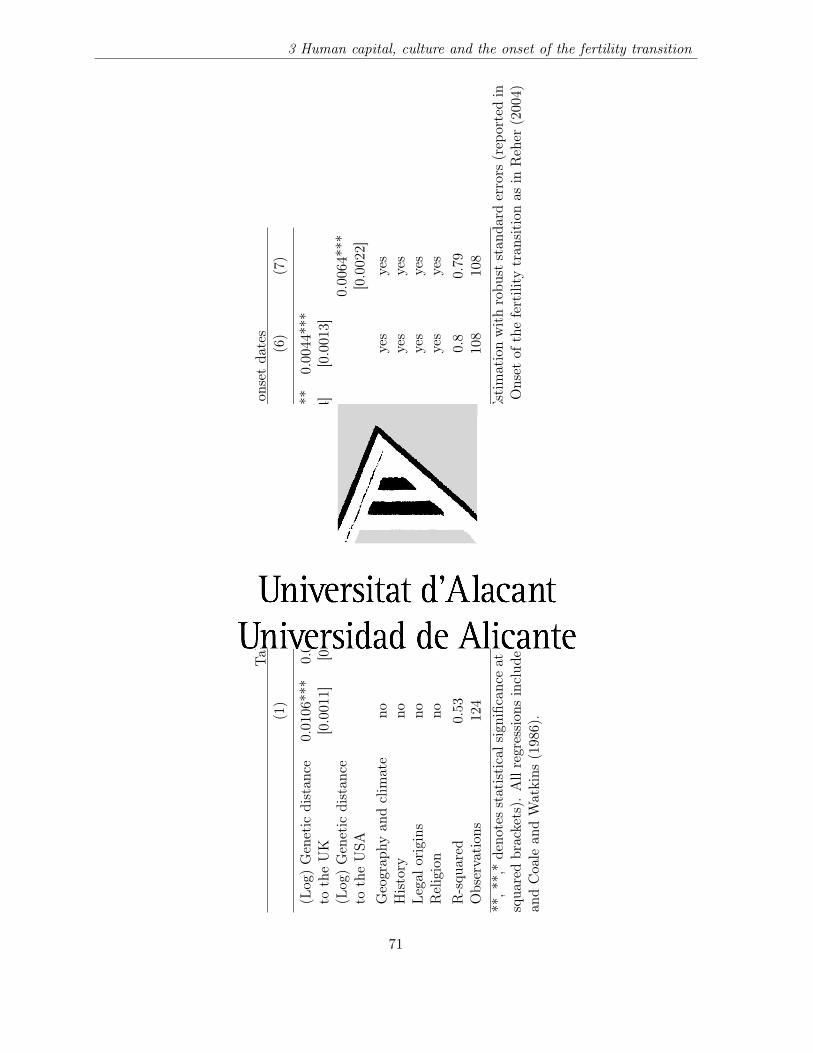
3 Human capital, culture and the onset of the fertility transition
Tab
le3.7:
Cross-section
OLS
:alterna
tive
onsetda
tes
(1)
(2)
(3)
(4)
(5)
(6)
(7)
(Log)Genetic
distan
ce0.0106***
0.004***
0.0121***
0.01***
0.0051***
0.0044***
totheUK
[0.0011]
[0.0014]
[0.0013]
[0.0014]
[0.0014]
[0.0013]
(Log)Genetic
distan
ce0.0064***
totheUSA
[0.0022]
Geograp
hyan
dclim
ate
noyes
nono
yes
yes
yes
History
nono
yes
noyes
yes
yes
Legalo
rigins
nono
noyes
yes
yes
yes
Religion
nono
nono
noyes
yes
R-squ
ared
0.53
0.73
0.58
0.6
0.78
0.8
0.79
Observation
s124
116
114
124
109
108
108
**,*
*,*deno
tesstatisticalsignific
ance
at1%
,5%
and10%
levels,respe
ctively.
Estim
ationwithrobu
ststan
dard
errors
(rep
ortedin
squa
redbrackets).
Allregression
sinclud
eaconstant.Dep
endent
variab
le:(L
og)Onset
ofthefertility
tran
sition
asin
Reher
(2004)
andCoale
andWatkins
(1986).
71

3 Human capital, culture and the onset of the fertility transition
Table 3.8: Cross-section OLS: alternative measures of historical institutions(1) (2) (3) (4)
(Log) Genetic distance to the UK 0.0077*** 0.0079*** 0.0071** 0.0073***[0.0025] [0.0025] [0.0025] [0.0024]
(Log of) Executive constraints in 1850 -0.0007[0.0014]
Polity2 in 1850 0.0001[0.0003]
(Log of) Executive constraints in 1900 -0.0019[0.0017]
Polity2 in 1900 -0.0001[0.0002]
Geography and climate yes yes yes yesHistory yes yes yes yesLegal origins yes yes yes yesR-squared 0.9 0.9 0.91 0.91Observations 36 36 39 39
**, **,* denotes statistical significance at 1% , 5% and 10% levels, respectively. Estimationwith robust standard errors (reported in squared brackets). All regressions include a constant.Dependent variable: (Log) Onset of the fertility transition as in Reher (2004). In columns (3,4)onsets taking place before 1900 are dropped.
to controlling for early formal institutions.18 Consistent with our hypothesis, Table 3.8 shows
that the effect of genetic distance to the UK is still positive and significant in spite of the
considerable drop in the number of observations while these proxies of formal institutions do not
have a significant effect.
3.5 Verification of the mechanism: genetic distance to technolog-
ical frontier, education and fertility transition
In this section we provide evidence supporting the channel of causation we think might be driving
our results. Specifically we show that the impact of cultural relatedness to the technological
frontier on the onset of fertility transition can be attributed mainly to its effect on human capital
18When using measures of formal institutional quality in 1900 we exclude four countries that experienced theonset of the transition before (or in 1900) to avoid reverse causality issues. These are: Hungary, Germany, Swedenand Uruguay.
72

3 Human capital, culture and the onset of the fertility transition
accumulation. This is consistent with the idea that cultural relatedness to the technological
frontier favoured technology adoption (Spolaore and Wacziarg 2009, 2011) which in turn fostered
human capital accumulation and the onset of the fertility transition (Galor 2012). As a first
step we show that genetic distance to the technological frontier is an important determinant of
historical educational attainments. We use average years of education in the population aged
15-64 from Morrisson and Murtin (2009) in the year 1870 to capture historical schooling levels.
As we can notice in Table 3.9, genetic distance to the UK has a negative and significant effect on
schooling in 1870, in line with our reasoning, even after controlling for geography and climate,
legal origins, history and religion. Our strategy to disentangle the mechanism at work goes as
follows. We use genetic distance to the UK as an instrument for schooling levels in 1870 to assess
the impact of historical education levels on the timing of the onset of fertility transitions across
countries. In order to show that we can plausibly argue that genetic distance to the UK affected
the onset of fertility transitions mainly through education - by favouring technology adoption -
we use additional instruments so that we can use an overidentification test to check whether the
instruments are valid. The additional instruments we use are the share of Protestants in 1900
and a country’s (log) distance from Germany. The former is likely to capture heterogeneity in
the incentives to get educated. As Becker and Woessmann (2009) and Ferguson (2011) point
out, adherents to Protestantism had a big incentive to become educated, in order to be able to
read and interpret the Bible by themselves, a crucial element of Protestantism:
"Because of the central importance in Luther’s thought of individual reading of the Bible,
Protestantism encouraged literacy, not to mention printing, and these two things unquestion-
ably encouraged economic development (the accumulation of ’human capital’) as well as sci-
entific study. This proposition holds good not just for countries like Scotland, where spending
on education, school enrolment and literacy rates were exceptionally high, but for the Protes-
tant world as a whole. Wherever Protestant missionaries went, they promoted literacy, with
measurable long-term benefits to the societies they sought to educate; the same cannot be said
of Catholic missionaries throughout the period of the Counter-Reformation to the reforms of
the Second Vatican Council (1962-5)..." (Ferguson 2011, pp. 259)
73
3 Human capital, culture and the onset of the fertility transition
Following this reasoning, we also use as an additional instrument the (log) distance to Germany.
This would capture the heterogeneity in the spread of the Protestant reform which started in
Germany in the early 16th century.19 Table 3.10 displays the results from the first and second
stage of the IV regressions. We run regressions without additional controls in columns (1,2,5,6)
and including the controls used previously, that is geography and climate, history and legal origins
(columns 3,4,7,8). As it can be noticed, the instruments are well correlated with the endogenous
variable and in all cases we cannot reject the null hypothesis that the instruments are valid.
The Hansen-J test checks if genetic distance to the UK and the additional instrument have an
effect on the onset of fertility transitions that goes beyond their effect on initial (historical)
educational attainments. As we cannot reject instruments validity throughout all specifications,
it’s likely that genetic distance (which should capture cultural differences) with respect to the
technological frontier affected the onset of fertility transitions mainly through education and
human capital accumulation. This result is in line with the reasoning that cultural distance to
the technological frontier affected the diffusion of technology and this, consequently, affected the
incentives for human capital accumulation, the quantity-quality trade-off and the timing of the
onset of fertility decline. As we saw above, the estimated coefficients have a strong economic
significance. Using the estimates from the last column of Table 3.10 we can make the following
calculation. Suppose it would have been possible to rise the schooling level of a country like India
in 1870 to the level of Switzerland, keeping everything else constant. In that case, our IV model
predicts that India would have then experienced its fertility transition in 1925, rather than in
1966, forty-one years earlier.
3.6 Conclusion
This paper contributes to our understanding of the main determinants of the fertility transitions
across a large sample of rich and developing countries. We provide evidence suggesting that a
specific type of informal institutions or culture, genetic distance to the technological frontier (the
19The logic is similar to Becker and Woessmann (2009) and Becker et al. (2010) who use distance to Wittenbergas an instrument for education in a cross-county framework in 19th century Prussia.
74

3 Human capital, culture and the onset of the fertility transition
Tab
le3.9:
Cross-section
OLS
:determinan
tsof
historical
scho
olinglevels
(1)
(2)
(3)
(4)
(5)
(6)
(7)
(Log)Genetic
distan
ce-1.009***
-0.4709*
-1.1583**
-0.9417***
-0.7135**
-0.9101***
totheUK
[0.1355]
[0.2393]
[0.1893]
[0.1522]
[0.2741]
[0.2564]
(Log)Genetic
distan
ce-1.592***
totheUSA
[0.5778]
Geograp
hyan
dclim
ate
noyes
nono
yes
yes
yes
History
nono
yes
noyes
yes
yes
Legalo
rigins
nono
noyes
yes
yes
yes
Religion
nono
nono
noyes
yes
R-squ
ared
0.52
0.66
0.59
0.68
0.77
0.85
0.83
Observation
s68
6766
6865
6565
**,*
*,*deno
tesstatisticalsignific
ance
at1%
,5%
and10%
levels,respe
ctively.
Estim
ationwithrobu
ststan
dard
errors
(rep
ortedin
squa
redbrackets).
Allregression
sinclud
eaconstant.Dep
endent
variab
le:averageyearsof
scho
olingin
thepo
pulation
aged
15-64
in1870.
75
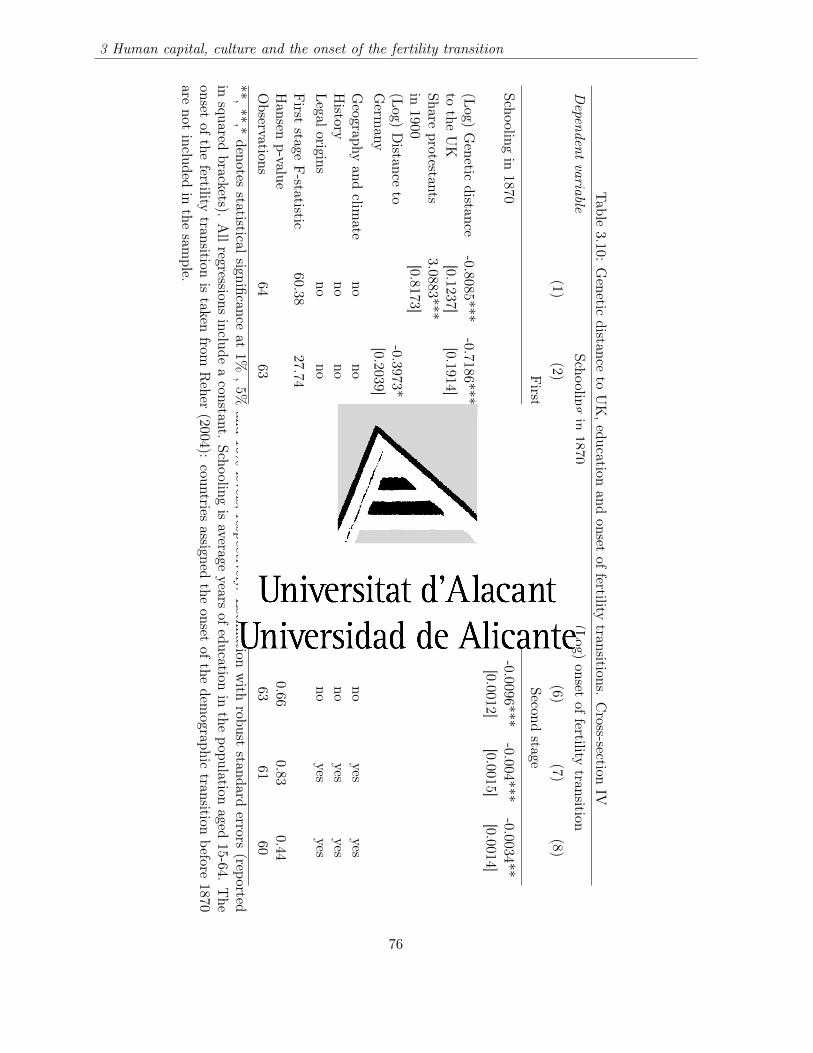
3 Human capital, culture and the onset of the fertility transition
Table
3.10:Genetic
distanceto
UK,education
andonset
offertility
transitions.Cross-section
IVDependent
variableSchooling
in1870
(Log)onset
offertility
transition(1)
(2)(3)
(4)(5)
(6)(7)
(8)First
stageSecond
stage
Schoolingin
1870-0.0089***
-0.0096***-0.004***
-0.0034**[0.001]
[0.0012][0.0015]
[0.0014](Log)
Genetic
distance-0.8085***
-0.7186***-0.7616***
-0.4992*to
theUK
[0.1237][0.1914]
[0.2272][0.2885]
Shareprotestants
3.0883***3.4475**
in1900
[0.8173][1.3713]
(Log)Distance
to-0.3973*
-0.8239**Germ
any[0.2039]
[0.3451]Geography
andclim
ateno
noyes
yesno
noyes
yesHistory
nono
yesyes
nono
yesyes
Legaloriginsno
noyes
yesno
noyes
yesFirst
stageF-statistic
60.3827.74
9.317.04
Hansen
p-value0.44
0.660.83
0.44Observations
6463
6160
6463
6160
**,**,*
denotesstatistical
significanceat
1%,5%
and10%
levels,respectively.
Estim
ationwith
robuststandard
errors(reported
insquared
brackets).Allregressions
includeaconstant.
Schoolingis
averageyears
ofeducation
inthe
populationaged
15-64.The
onsetof
thefertility
transitionis
takenfrom
Reher
(2004):countries
assignedthe
onsetof
thedem
ographictransition
before1870
arenot
includedin
thesam
ple.
76
3 Human capital, culture and the onset of the fertility transition
UK or the US), has been a crucial factor of the timing of the fertility transition across these
economies. We provide evidence that genetic distance to the technological frontier affected the
timing of the onset of the fertility transitions through an indirect channel working through tech-
nology diffusion as suggested in Spolaore and Wacziarg (2009, 2011). A larger genetic distance
to the technological frontier would delay technology adoption and lower the demand for human
capital, consequently leading to a late onset of the fertility transition (Galor 2012). We first
estimate a reduced form regression in which genetic distance to the UK is a strongly significant
variable in explaining the timing of the fertility transitions across countries, even after controlling
for a large set of geographical and historical variables. We show that these estimates are robust
to considering a bilateral analysis that compares pairs of countries in terms of their onsets of the
fertility transitions and their differences in terms of their distance to the UK. Also the result is
robust to using different estimates of the fertility transition dates. Finally, we unveil a plausible
mechanism that may be behind this reduced form. A large cultural difference with respect to the
UK may be proxying a lower technological adoption and less incentives to accumulate human
capital, which in turn may delay the onset of the fertility transition. We test this possible channel
by instrumenting a country’s initial levels of human capital with genetic distance from the UK,
and two measure of the degree of spread of Protestantism, a religion known for its emphasis on
the promotion of human capital among its followers. Our finding that cultural characteristics
matter as triggers of fertility transitions may be seen as a bridge between the literature that
emphasizes the importance of economic determinants of these transitions (e.g. Galor 2012) and
the one that points to purely cultural factors (e.g. Coale and Watkins 1986).
77


Bibliography
[1] Andersen, T. B., Dalgaard, C.-J. and Selaya, P. (2010), "Eye Disease and Development,"
LEPAS Conference Papers, vol. 1: The Mechanics of Aging, Vienna.
[2] Angeles, L. (2010), "Demographic transitions: analyzing the effects of mortality on fertility,"
Journal of Population Economics, 23 (1), pp. 99-120.
[3] Angrist, J. D., Lavy, V. and Schlosser, A. (2005), "New Evidence on the Causal Link between
the Quantity and Quality of Children," NBER working paper 11835. Cambridge, MA.
[4] Anselin, L. (1988), Spatial Econometrics: Methods and Models. Kluwer Acedemic Publishers.
[5] Bailey, A. K. (2009), "How Personal Is the Political? Democratic Revolution and Fertility
Decline," Journal of Family History, 34 (4), pp. 407-425.
[6] Becker, G. S., and Lewis, H. G. (1973), "On the Interaction between the Quantity and
Quality of Children," Journal of Political Economy, 81, pp. 279-288.
[7] Becker, G. S. (1981), A Treatise on the Family. Cambridge and London: Cambridge Uni-
versity Press.
[8] Becker, S. O. and Woessmann, L. (2009), "Was Weber Wrong? A Human Capital Theory of
Protestant Economic History," The Quarterly Journal of Economics, 124 (2), pp. 531-596.
[9] Becker, S. O., Cinnirella, F. and Woessmann, L. (2010), "The Trade-off between Fertility
and Education: Evidence from Before the Demographic Transition," Journal of Economic
Growth, 15(3), pp. 177-204.

3 Bibliography
[10] Becker, S. O., Cinnirella, F. and Woessmann, L. (2012), "The effect of investment in chil-
dren’s education on fertility in 1816 Prussia," Cliometrica, 6, pp. 29-44.
[11] Black, S. E., Devereux, P. J. and Salvanes, K. G. (2005), "The More the Merrier? The Effect
of Family Size and Birth Order on Children’s Education," Quarterly Journal of Economics
120 (2), pp. 669-700.
[12] Bleakly, H., and Lange, F. (2009), "Chronic Disease Burden and the Interaction of Educa-
tion, Fertility, and Growth," Review of Economics and Statistics, 91 (1), pp. 52-65.
[13] Bloom, David E., and Jeffrey G. Williamson (1998), "The Demographic Transition and
Economic Miracles in Emerging Asia", The World Bank Economic Review, 12 (3), pp. 419-
455.
[14] Brown, J. C. and Guinnane, T. W. (2002), "Fertility Transition in a Rural, Catholic Popu-
lation: Bavaria 1880-1910," Population Studies, 56 (1), pp. 35-49.
[15] Brown, J. C. and Guinnane, T. W. (2007), "Regions and Time in the European Fertility
Transition: Problems in the Princeton Project’s Statistical Methodology," Economic History
Review, 60 (3), pp. 574-95.
[16] Coale, A. J. (1973), "The Demographic Transition." in International Population Conference.
vol. 1, International Union for the Scientific Study of Population: Liege, pp. 53-72.
[17] Coale, A. J., and Watkins, S. C. (1986), The Decline of Fertility in Europe. Princeton, NJ:
Princeton University Press.
[18] Delgado, M. (2009), "La fecundidad de las provincias espan̋olas en perspectiva historica,"
Estudios geográficos, 267, pp. 387-442.
[19] Dopico F. and Reher D. S. (1999), "El declive de la mortalidad en Espan̋a, 1860-1930",
Monografias ADEH, 1, Zaragoza, Asociacion de Demografia Historica, 1999.
[20] Eckstein, Z., Mira, P. and Wolpin, K. (1999), "A Quantitative Analysis of Swedish Fertility
Dynamics: 1751-1990," Review of Economic Dynamics, 2, pp. 137-65.
80

3 Bibliography
[21] Ferguson, N. (2011), Civilization, Penguin Books.
[22] Fernihough, A. (2011), "Human Capital and the Quantity-Quality Trade-Off during the
Demographic Transition: New Evidence from Ireland," Working Papers 201113, School Of
Economics, University College Dublin.
[23] Galloway, P.R., Lee, R. D., and Hammel, E. A. (1994), "Fertility decline in Prussia 1875 to
1910: a pooled cross-section time series analysis", Population Studies, 48 (1), pp. 135-158.
[24] Galloway, P.R., Lee, R. D. and Hammel, E. A. (1998), "Infant Mortality and the Fertil-
ity Transition: Macro Evidence from Europe and New Findings from Prussia." Chapter
6 in From Death to Birth: Mortality Decline and Reproductive Change, edited by M. R.
Montgomery, B. Cohen (ed). Washington, D.C: National Academy Press
[25] Gallup, J. L., Sachs, J. D. and Mellinger, A. D. (1999), "Geography and Economic Devel-
opment," CIDHarvard University Working Paper No. 1, March.
[26] Galor, O. (2012), "The Demographic Transition: Causes and Consequences," Cliometrica,
6 (1), pp. 1-28.
[27] Galor, O. and Weil, D. N. (1996), "The Gender Gap, Fertility, and Growth," American
Economic Review, 86 (3), pp. 374-387.
[28] Galor, O. and Weil, D. N. (1999), "From Malthusian Stagnation to Modern Growth," Amer-
ican Economic Review, 89 (2), pp. 150-154.
[29] Galor, O. and Weil, D. N. (2000), "Population, Technology, and Growth: From Malthusian
Stagnation to the Demographic Transition and Beyond," American Economic Review, 90
(4), pp. 806-828.
[30] Galor, O., Moav, O. and Vollrath, D. (2009), "Inequality in Landownership, the Emergence
of Human-Capital Promoting Institutions, and the Great Divergence," Review of Economic
Studies, 76 (1), pp. 143-179.
81

3 Bibliography
[31] Glaeser, E. L., La Porta, R., Lopez-de-Silanes,F. and Shleifer, A. (2004), "Do Institutions
Cause Growth?," Journal of Economic Growth, 9 (3), pp. 271-303.
[32] Goldin, C. (1990), Understanding the Gender Gap: An Economic History of American
Women. Oxford University Press, New York.
[33] Goldstein, J. R. and Klüsener, S. (2010), "Culture revisited: a geographic analysis of fertility
decline in Prussia," MPIDR Working Paper, WP-2010-012.
[34] Guinnane, T. W. (2011), "The Historical Fertility Transition and Theories of Long-Run
Growth: A Guide for Economists," Journal of Economic Literature, 49 (3), pp. 589-614.
[35] Guiso L., Sapienza, P. and Zingales, L. (2006), "Does Culture Affect Economic Outcomes?"
Journal of Economic Perspectives 20 (2), pp. 23-48.
[36] Guzman, R. and Weisdorf, J. L. (2010), "Product Variety and the Demographic Transition",
Economics Letters, 107(1), pp. 74-76.
[37] Herzer, D., Strulik, H. and Vollmer, S. (2012), "The long-run determinants of fertility:
one century of demographic change 1900-1999," Journal of Economic Growth, 17 (4), pp.
357-385.
[38] INE, Instituto Nacional de Estadística (www.ine.es).
[39] Kalemli-Ozcan, S. (2002), "Does the Mortality Decline Promote Economic Growth?", Jour-
nal of Economic Growth 7, pp. 411-439.
[40] Kalemli-Ozcan, S. (2003), "A stochastic model of mortality, fertility, and human capital
investment," Journal of Development Economics, 70, pp. 103-118.
[41] Klemp, M. and Weisdorf, J. L. (2011), "The Child Quantity-Quality Trade-Off during the
Industrial Revolution in England", Discussion Papers 11-16, University of Copenhagen,
Department of Economics.
[42] Lagerlöf, N. (2003), "Gender Equality and Long-Run Growth", Journal of Economic Growth
8 (4), pp. 403-426.
82
3 Bibliography
[43] Leasure, J. W. (1963), "Factors involved in the decline of fertility in Spain, 1900-1950",
Population Studies, 16 (3), pp. 271-285.
[44] Lehr, C. S. (2009), "Evidence on the Demographic Transition." Review of Economics and
Statistics 91 (4), pp. 871-887.
[45] Marshall, M. G. and Jaggers, K. (2008), "Polity IV project. Political Regime Characteristics
and Transitions, 1800-2002," Integrated Network for Societal Conflict Research (INSCR),
Program Center for International Development and Conflict Management (CIDCM), Uni-
versity of Maryland.
[46] Mas Ivars, M. and Cucarella Tormo, V. (2009), "Series históricas de capital público en
Espan̋a y su distribución territorial (1900-2005)", Fundación BBVA.
[47] Mitchell, B. R. (2007), "International historical statistics Europe 1750-2005", Palgrave
Macmillan.
[48] Morrisson, C. and Murtin, F. (2007), "Education Inequalities: a Global Perspective Since
1870", PSE Working Paper.
[49] Morrisson, C. and Murtin, F. ( 2009), "The Century of Education." Journal of Human
Capital 3(1): pp. 1-42.
[50] Murphy, T. E. (2010), "Old Habits Die Hard (Sometimes): What can Département hetero-
geneity tell us about the French fertility decline?", IGIER working paper No. 364.
[51] Murtin, F. (forthcoming), "Long-term Determinants of the Demographic Transition, 1870-
2000," Review of Economics and Statistics.
[52] Nunn, N. and Puga, D. (2012), "Ruggedness: the Blessing of Bad Geography in Africa,"
Review of Economics and Statistics, 94 (1), pp. 20-36.
[53] Núñez, C.E. (2005a), "Educación". In Carreras, A. y Tafunell, X. (coords.), "Estadísticas
históricas de Espan̋a, siglos XIX y XX". Fundación BBVA, Bilbao, Tomo 1, pp. 155-245.
83

3 Bibliography
[54] Núñez, C.E. (2005b), "A Modern Human Capital Stock. Spain in the Nineteenth and Twen-
tieth Centuries," in Magnus Jerneck, Magnus MÃűrner, Gabriel Tortella y Sune Akerman
editors, "Different Paths to Modernity. A Nordic and Spanish Perspective". Lund: Nordic
Academic Press. pp. 122-142.
[55] Putterman, L. (2006), Agricultural Transition Dataset, Brown University.
[56] Qian, N. (2009), "Quantity-Quality and the One Child Policy: The Only-Child Disadvantage
in School Enrolment in Rural China." NBER Working Paper 14973. Cambridge, MA.
[57] Reher, D. S. (2004), "The Demographic Transition Revisited as a Global Process," Popula-
tion Space and Place, 10, pp. 19-42.
[58] Reher, D. S. and Iriso-Napal, P.L. (1989), "Marital Fertility and its Determinants in Rural
and in Urban Spain, 1887-1930," Population Studies, 43 (3), pp. 405-427.
[59] Rosenzweig, M. R., and Wolpin, K. I. (1980), "Testing the Quantity-Quality Fertility Model:
The Use of Twins as a Natural Experiment," Econometrica, 48 (1), pp. 227-240.
[60] Sachs, Jeffrey, Kiszewski, A., Mellinger, A., Spielman, A., Malaney, P., and Ehrlich, S.
(2004), "A Global Index of the Stability of Malaria Transmission," American Journal of
Tropical Medicine and Hygiene 70 (5), pp. 486-498.
[61] Sah, R. K. (1991), "The Effects of Child Mortality Changes on Fertility Choice and Parental
Welfare," Journal of Political Economy, 99 (3), pp. 582-606.
[62] Schultz, T. P. (2008), "Population Policies, Fertility, Women’s Human Capital, and Child
Quality." In T. Paul Schultz, John Strauss (eds.), Handbook of Development Economics, vol.
4: 3249-3303. Amsterdam: Elsevier.
[63] Silvestre, J. (2007), "Temporary Internal Migrations in Spain, 1860-1930," Social Science
History, 31 (4), pp. 539-574.
[64] Spolaore, E. and Wacziarg, R. (2009), "The Diffusion of Development," Quarterly Journal
of Economics 124 (2), pp. 469-529.
84
3 Bibliography
[65] Spolaore, E., and R. Wacziarg (2011), "Long Term Barriers to the International Diffusion
of Innovations." in Jeffrey Frankel and Christopher Pissarides, eds., NBER International
Seminar on Macroeconomics 2011, Chapter 1, pp. 11-46. Chicago: University of Chicago
Press, May.
[66] Tolnay, S. E. (1995), "The Spatial Diffusion of Fertility: A Cross-Sectional Analysis of
Counties in the American South, 1940," American Sociological Review, 60, pp. 299-308.
[67] van de Walle, F. (1980), "Education and the Demographic Transition in Switzerland," Pop-
ulation and Development Review, 6 (3), pp. 463-472.
[68] van de Walle, F. (1986), "Infant Mortality and the European Demographic Transition."
in The Decline of Fertility in Europe, Coale, A. J., and S. C. Watkins (eds). Princeton
University Press: Princeton: pp. 201-233.
85