essential labs: 4th grade miami - florida department of ... · essential labs grade 4 . ... o 1...
TRANSCRIPT

Essential Labs Grade 4
Based on New Generation Science Sunshine State Standards Annually Assessed (AA) Benchmarks
School Year 2011-2012
Miami-Dade County Public Schools Education Transformation and Performance

THE SCHOOL BOARD OF MIAMI-DADE COUNTY, FLORIDA
Dr. Solomon C. Stinson, Chairman Ms. Perla Tabares Hantman, Vice Chairman
Mr. Agustin J. Barrera Mr. Renier Diaz de la Portilla
Dr. Lawrence S. Feldman Dr. Wilbert "Tee" Holloway
Dr. Martin S. Karp Ms. Ana Rivas Logan
Dr. Marta Pérez
Ms. Eboni Finley Student Advisor
Mr. Alberto M. Carvalho Superintendent of Schools
Mr. Nikolai P. Vitti Assistant Superintendent
Education Transformation and Performance

ANTI-DISCRIMINATION POLICY
Federal and State Laws The School Board of Miami-Dade County, Florida adheres to a policy of nondiscrimination in employment and educational programs/activities and strives affirmatively to provide equal opportunity for all as required by law: Title VI of the Civil Rights Act of 1964 - prohibits discrimination on the basis of race, color, religion, or national origin. Title VII of the Civil Rights Act of 1964, as amended - prohibits discrimination in employment on the basis of race, color, religion, gender, or national origin. Title IX of the Educational Amendments of 1972 - prohibits discrimination on the basis of gender. Age Discrimination in Employment Act of 1967 (ADEA), as amended - prohibits discrimination on the basis of age with respect to individuals who are at least 40. The Equal Pay Act of 1963, as amended - prohibits gender discrimination in payment of wages to women and men performing substantially equal work in the same establishment. Section 504 of the Rehabilitation Act of 1973 - prohibits discrimination against the disabled. Americans with Disabilities Act of 1990 (ADA) - prohibits discrimination against individuals with disabilities in employment, public service, public accommodations and telecommunications. The Family and Medical Leave Act of 1993 (FMLA) - requires covered employers to provide up to 12 weeks of unpaid, job-protected leave to “eligible” employees for certain family and medical reasons. The Pregnancy Discrimination Act of 1978 - prohibits discrimination in employment on the basis of pregnancy, childbirth, or related medical conditions. Florida Educational Equity Act (FEEA) - prohibits discrimination on the basis of race, gender, national origin, marital status, or handicap against a student or employee. Florida Civil Rights Act of 1992 - secures for all individuals within the state freedom from discrimination because of race, color, religion, sex, national origin, age, handicap, or marital status. Veterans are provided re-employment rights in accordance with P.L. 93-508 (Federal Law) and Section 295.07 (Florida Statutes), which stipulates categorical preferences for employment.

Table of Contents
Introduction………………………………………………………………………………….………5
Resources…….………………………………………….............................................................6 Materials List………………………………………………………………………….…......7 Laboratory Safety…………………………………………………………………….…….8
Lab Roles……………………………………………………………………………….……9 Annually Assessed Benchmarks……………………………………………………….10
Lab Activities………………………………………………………………………………………..11
1. BIG IDEA 1: WHAT’S YOUR REACTION……………………………………………………..12
2. BIG IDEA 1: GUMMY BEAR LAB………………………………………………………………16
3. BIG IDEA 1: RAINBOW MEASURING FUN LAB……………………………………………..20
4. SC.4.E.5.1: CONSTELLATIONS………………………………………………………………..24
5. SC.4.E.5.2: PHASES OF THE MOON…………………………………………….……………30
6. SC.4.E.5.3: SHADOWS………………………………………………………….………………35
7. SC.4.E.6.2: ROCKS AND MINERALS……………………………………….………………...39 8. SC.4.E.6.1: THE ROCK CYCLE……………………………………………….……………….44
9. SC.4.E.6.3: WATER TURBINE………………………………………………….……………...50
10. SC.4.E.6.3: SOLAR POWER………………………………………………………………….55
11. SC.4.E.6.4: WEATHERING AND EROSION…………………………………………………62
12. SC.4.E.6.4: EROSION…………………………………………………………………………..67
13. SC.4.L.16.4: TYPES OF PLANT REPRODUCTION…………………………………………72
14. SC.4.L.16.4: LIFE CYCLES…………………………………………………………………….78 15. SC.4.L.17.2:ENERGY FLOW THROUGH THE FOOD CHAINS………………………….. 83 16. SC.4.L17.2: PLANT AND ANIMAL INTERDEPENDENCE………………………………....89 17. SC.4.L.17.2: PREDATOR AND PREY………………………………………………………...95 Appendix
Essential Lab Quizzes

Introduction
The purpose of this document is to provide a venue for 5th grade science teachers to facilitate the discussion of the New Generation Science Sunshine State Standards Annually Assessed Benchmarks in the 4th grade science course. Each lesson plan included in this document is aligned with the assessed benchmarks. The lessons and laboratory activities were developed with the intention of allowing the students to grow in critical thinking within the content of the benchmark. These labs were developed to enable all 4th grade science teachers to address these very important concepts in their science courses prior to the Science FCAT. The labs were designed to cover the most important tested concepts for which the students will be assessed on the 2012 Science FCAT. Some benchmarks are extremely broad and will address different content foci. Lab activities may also cover multiple benchmarks. The “N Strand” of the Sunshine State Standards, which deals with the Practice of Science, is infused in all labs. For the most part, the activities were modestly designed without the use of advanced technological equipment to make it possible for all teachers to use these activities. However, it is highly recommended that technology, such as the use of computers be used to access the Internet and to utilize additional resources such as Gizmos at www.explorelearning.com, and Discovery Education. This document is intended to be used by the 4th grade science teachers so that all teachers within this grade level can collaborate as they work together, plan together, and rotate lab materials among classrooms. Through this practice, all students and teachers will have the same opportunities to participate in these experiences and promote discourse among learners, which are the building blocks of authentic learning communities.
• Lessons • Essential Labs • Science Projects and
Activities
• FOCUS Assessment
• Pacing Guide (District Provided) • Focus Calendar (School Specific
and Data Driven)
• FCAT Explorer • www.explorelearning.com (Gizmos) • Differentiated Instruction
PLAN
ACT
DO
CHECK
• Data Disaggregation• Calendar Development
• Direct InstructionalFocus
• Tutorials• Enrichment
• Assessment• Maintenance• Monitoring

Resources

Materials List** Grade 4 Essential Labs
SC.4.N.1.1 WHAT’S YOUR SC.4.E.5.3/E.5.4 SHADOWS LAB SC.4.E.6.4 WEATHERING AND SC.4.L.17.2/L.17.3 REACTION? EROSION LAB PLANT AND ANIMAL
Partner to test reaction distance o overhead projector
o o Sand Water INTERDEPENDENCE LAB o Ruler o 1 large sheet of white poster board o Large pans (i.e. lasagna) Small beakers o Pass the Energy, Please!
o Rulers Eye droppers 1 sharpened pencil or a craft stick o Barbara Shaw McKinney, SC.4.N.1.2 GUMMY BEAR LAB o Rain cup Safety goggles 1999, Dawn Publications 1 clock or watch Popsicle sticks Drinking straws o 1 gummy bear per student
o o Baking soda Pebbles o 1 small cup or beaker of water (4 o 1 compass oo Vinegar SC.4.L.17.2/L.17.3
oz.) o 1 colored pencil or crayon PREDATOR AND PREY LAB o Measuring tools- metric ruler and
o 1 metric ruler SC.4.E.6.4 EROSION LAB o flagging tape, ribbon strips, or scale /triple-beam balance o construction paper strips (2 1 student lab report sheet 1 cookie sheet/shallow pan/erosion table o 1 small lump of clay oo colors enough for the whole graduated cylinder several craft sticks o class) 1 Styrofoam cup
SC.4.E.6.2 ROCKS AND o o 4 hula hoops (or yarn circles) grass or other vegetation (optional) SC.4.N.1.3 RAINBOW MINERALS LAB o placed on the field to mark masking tape MEASURING FUN LAB o temporary shelters markers or crayons o various items (jewelry, clay, chalk, o 6 test tubes (label the test tubes o o 3 chips per student for food 1 metric ruler penny, sand, etc.) with the letters A-E) o tokens (or use paper squares) mixture of dirt, clay, gravel, sand, and rock samples o test tube rack o scattered on the field water in a 10 oz. cup o mineral samples: quartz, pyrite, o 1 pipette or medicine dropper for o blue chips for water tokens 1 book (approx. 1-2 inches thick, covered o
hematite stirring (optional) to avoid damage)
halite (rock salt) o 1 empty cup (for contaminated
oo 1 metric measuring cup hand lens
waste) o
200 mL water o science notebook and pencil oo 1 cup of clean water (for rinsing 1 sharp pencil or a pin for punching holes o iron nail o
your graduated cylinder) o pictures of the Grand Canyon streak plate o 1 graduated cylinder
o o newspaper
construction paper (1 sheet per student) SC.4.E.6.1 THE ROCK CYCLE o
SC.4.E.5.1 CONSTELLATIONS o Erosion, Lola M. Schaefer, Benchmark LAB Education Co.
o Reference materials on stars and o dropper constellations rock samples (3-5 of each type of
o pre-made constellation viewer o
rock) SC.4.L.16.1/L.16.4 TYPES OF PLANT o light source vinegar REPRODUCTION LAB o scissors
o 3 pieces of Starburst candy photographs of plants, if needed (see o 1 cardboard toilet tissue tube
o o 1 hand lens Teaching Tips) o 1 black marker o
o “Inferring about Rocks” activity o access to plants (such as a school o 1 flashlight sheet garden) o 1 push pin Rock Chart science notebook and pencil o masking tape o o
o student notebooks o glue o 1 circle of black construction paper SC.4.P.16.4 LIFE CYCLES LAB
SC.4.E.6.3 – the size of the tube opening o Poster of butterfly life cycle o 1 cardboard circle – the size of the WATER TURBINE LAB O Science notebook
tube opening o 1 half-gallon milk or juice carton o 1 constellation pattern (black dots
o 1 metric ruler on white copy paper the size of the SC.4.L.17.2/ L.17.3 ENERGY FLOW o Duct tape tube opening) 1 nail
THROUGH FOOD CHAINS oo Water o Reference material on animals
SC.4.E.5.2/E.5.4/E6.5 o Masking tape o 25-40 pictures of various animals pictured o 1 half-gallon milk carton or soda in their habitats in a paper bag PHASES OF THE MOON LAB can with 5 holes pre-punched by hole punch
o one 4-inch foam ball the teacher o 1 paper plate (Sun) string
o overhead projector S ring oo t index cards o The Moon book by Gail Gibbons o Scissors o
crayons or markers o science notebook o
glue or tape SC4.E.6.3/E.6.6 SOLAR POWER o
o 1 black and 1 white t-shirt o 2 thermometers
o 2 black solar trays o 2 white solar trays o 2 solar tray covers o 4 thermometers o large container of water (a gallon
milk jug works well) o Solar Energy data sheet
**Materials are per group *Materials listed with a * are included in the Science Replacement Consumable Materials kits
Laboratory Safety
Safety Rules: 1. Always make safety your first consideration in the laboratory. 2. Know the primary and secondary exit routes from the classroom. 3. Know the location of and how to use the safety equipment in the classroom. 4. Wear appropriate clothing, proper footwear and eye protection. 5. Work at your assigned seat unless obtaining equipment or chemicals. 6. Wait for the teacher’s permission before handling all lab equipment and chemicals. 7. Follow laboratory procedures as explained and do not perform unauthorized experiments. 8. Avoid drinking, eating or smelling the chemicals or anything that is used in the lab. 9. Report all injuries, accidents and potential hazards to the teachers. 10. Remove all unnecessary materials from the work area and completely clean up the work area
after the experiment. Safety Contract: I will: • Follow all instructions given by the teacher. • Protect eyes, face and hands, and body while conducting class activities. • Carry out good housekeeping practices. • Know where to get help fast. • Know the location of the first aid and fire safety equipment. • Conduct myself in a responsible manner at all times in the science class. I, _______________________, have read and agree to follow the safety regulations (Print name) as set forth above and any additional printed instructions provided by the teacher. I further agree to abide by all other written and verbal instructions given in class. Signature: ____________________________Date: ________________________ Parent Signature: _____________________Date: ________________________

Lab Roles
Cooperative learning activities are made up of four parts: group accountability, positive interdependence, individual responsibility, and face-to-face interaction. The key to making cooperative learning activities work successfully in the classroom is to have clearly defined tasks for all members of the group.
Annually Assessed Benchmarks Grade 5 Annually Assessed Benchmarks

Grade 4 Annually Assessed (AA) Benchmarks
The following list includes the Grade 4 Annually Assessed Benchmarks and the Nature of Science Benchmarks that will be tested on the Grade 5 Science FCAT. It should also be noted that within the specific Annually Assessed Benchmarks are other embedded benchmarks that may also be tested. SC.4.N.1.1 Raise questions about the natural world, use appropriate reference materials that support understanding to obtain information (identifying the source), conduct both individual and team investigations through free exploration and systematic investigations, and generate appropriate explanations based on those explorations. SC.4.N.1.2 Compare the observations made by different groups using multiple tools and seek reasons to explain the differences across groups. SC.4.N.1.3 Explain that science does not always follow a rigidly defined method ("the scientific method") but that science does involve the use of observations and empirical evidence. SC.4.N.1.4 Attempt reasonable answers to scientific questions and cite evidence in support. SC.4.N.1.5 Compare the methods and results of investigations done by other classmates. SC.4.N.1.6 Keep records that describe observations made, carefully distinguishing actual observations from ideas and inferences about the observations. SC.4.N.1.7 Recognize and explain that scientists base their explanations on evidence. SC.4.N.1.8 Recognize that science involves creativity in designing experiments. SC.4.N.2.1 Explain that science focuses solely on the natural world. SC.4.N.3.1 Explain that models can be three dimensional, two dimensional, an explanation in your mind, or a computer model. SC.4.E.6.2 Identify the physical properties of common earth-forming minerals, including hardness, color, luster, cleavage, and streak color, and recognize the role of minerals in the formation of rocks. SC.4.E.6.3 Recognize that humans need resources found on Earth and that these are either renewable or nonrenewable. SC.4.E.6.4 Describe the basic differences between physical weathering (breaking down of rock by wind, water, ice, temperature change, and plants) and erosion (movement of rock by gravity, wind, water, and ice). SC.4.L.16.4 Compare and contrast the major stages in the life cycles of Florida plants and animals, such as those that undergo incomplete and complete metamorphosis, and flowering and nonflowering seed-bearing plants. SC.4.L.17.2 Explain that animals, including humans, cannot make their own food and that when animals eat plants or other animals, the energy stored in the food source is passed to them.

Lab Activities
“What’s Your Reaction?” Teacher Reference Form

BIG IDEA 1: THE PRACTICE OF SCIENCE
Essential Question: Why is it important to make a hypothesis before conducting an experiment? An experiment is done to test if the hypothesis is true or valid. If the hypothesis is not true, another hypothesis can be made to find out new information. Problem Statement: Does the hand that you use more affect your reaction time? Hypothesis (20 Points): If I test my left and right hand for reaction time, then my left or right hand will have the fastest reaction time. (Circle your prediction.) Materials:
• Partner to test reaction distance • Ruler
Procedures: 1. Place your hand on the edge of a table. 2. Have your partner place the ruler above your two fingers with the zero mark closest to your fingers. 3. Your partner will drop the ruler above your hand without warning. 4. You must catch the ruler with only 2 fingers. 5. Record the cm. that your caught the ruler on in the data table. 6. Repeat steps for your left and right hands. Data (40 Points): (To get the average, have students add up their trials and divide by 5.)
LEFT Distance caught HAND on ruler (inches) Trials 1 ___________inches 2 ___________inches 3 ___________inches
4 ___________inches 5 ___________inches Average Distance __________inches
RIGHT HAND Trials
Distance caught on ruler (inches)
1 ___________inches 2 ___________inches 3 ___________inches 4 ___________inches 5 ___________inches Averag eDistan ___________inches ce

TEACHER NOTES: Variable: (What was changed?) The different hands that the students are comparing for reaction time is changed (left and right). Control: (What stayed the same for each trial in the experiment?) Each student can only catch the ruler with two fingers (thumb and index finger), the hand being tested should be resting on the edge of a table, the same subject or student is being tested for both hands. Conclusion Questions: Students should answer the conclusion question in their student lab report. Extended Learning: Students can also construct a graph of their results. The left and right hand should be on the x-axis and the distance caught should be on the y-axis of the graph. All graphs should have a title at the top and the x and y axis should be labeled. Moreover, the numbering scale should be even and always begin at zero. For instance: 0, 2, 4, 6,8,10 or 0,5,10,15,20,25, etc. In addition, you can also add the average reaction times for girls and boys and find out which gender has the best overall reaction time.

Scientist : ______________________ Date:___________
Title: What’s Your Reaction Time? Student Lab
Benchmarks: SC.4.N.1.1- Students will conduct both individual and team investigations through free exploration and systematic investigations, and generate appropriate explanations based on those explorations. Problem Statement (10 POINTS): How does ________________________________________________________ affect__________________________________________________________?
Hypothesis (15 POINTS):
If , then ______________
Materials:
• student partner
• ruler
Procedures: 1. Place your hand on the edge of a table. 2. Have your partner stand at the edge of the table and place the ruler above your two fingers with the zero mark closest to your fingers. 3. Your partner will drop the ruler above your hand without warning. 4. You must catch the ruler with only 2 fingers (thumb and index finger only). 5. Record the cm. mark that the ruler was caught on in the data table. 6. Repeat steps 1-5 for your other hand and switch positions with your partner.
Control (5 POINTS) Variable (5 POINTS)

Data (20 POINTS):
Observations (10 POINTS): Which hand had the fastest reaction time (the lowest total distance) according to your data? ____________________________________________________________________________________________________________________________________
Conclusion (35 POINTS): After analyzing the data it was determined that the hypothesis was . (Correct OR Incorrect), because -____ To conclude, from this lab I learned that _________________________
TOTAL POINTS:____________
LEFT HAND Trials
Distance caught on ruler (cm)
1 ___________inches 2 ___________inches 3 ___________inches 4 ___________inches 5 ___________inches Total Distance
__________inches
RIGHT HAND Trials
Distance caught on ruler (cm)
1 ___________inches 2 ___________inches 3 ___________inches 4 ___________inches 5 ___________inches Total Distance
__________inches

Gummy Bear Lab (Fourth Grade) –Teacher Reference Form
Benchmark: SC.4.N.1.2-Compare the observations made by different groups using multiple tools and seek reasons to explain the differences across groups. Essential Question: What tools or instruments are used to measure the mass and volume of materials? ruler, tape measure, triple beam balance, electronic scale, etc. Problem Statement: How does mass and volume affect the density of the gummy bear? Hypothesis: If a gummy beak is soaked in water for 1 day, then the density of the gummy bear will (increase or decrease). Teacher Notes: *Use an electronic scale to have students measure the mass (g) of the gummy bear in grams. * A ruler should be used to find the length, width, and height of the gummy bear in centimeters (cm). * Density is calculated by dividing the mass by the volume. * The variable in the experiment will be the brands of the gummy bear if applicable. The control will be the brand and/or type of candy (gummy bears) for each student and/or group. Materials:
• 1 gummy bear per student • 1 small cup or beaker of water (4 oz.) • Measuring tools- metric ruler and scale /triple-beam balance • 1 student lab report sheet • graduated cylinder
Procedure:
1. Distribute one (1) gummy bear to each student. Use the metric ruler to measure your gummy bear and record the data in the table for Day 1.
2. The length of your gummy bear should be measured from the top of its head to the bottom of its feet and round to the nearest tenth of a centimeter.
3. Measure the width at the widest point across the back of the gummy bear to the nearest tenth of a centimeter.
4. Measure the thickness from the front to the back at the thickest point to the nearest tenth of a centimeter.
Density = Mass (g) or Mass (g) ÷ Volume (cm3) = _______ density (g/cm3) Volume (cm3)

5. Calculate the volume by multiplying the length, width, and height. Round to the nearest hundredth.
(Volume= L X W X H) 6. Measure the mass using a scale or triple beam balance to the nearest tenth of a gram. (Note: An
electronic scale may be easier and more time efficient that using the triple beam balance.) 7. Calculate the density by dividing the mass by the volume. Round the answer to the nearest hundredth.
(D= M ÷ V) 8. Place the gummy bear in a cup labeled with your name and class period. 9. Using a beaker add 50 mL of water to the cup with the gummy bar and allow it to sit for 1 day. 10. On Day 2, remove the gummy bear the cup of water and use a paper towel to dry it removing excess
water and preventing it from dripping over your lab work station. 11. Repeat steps 1 through 8 and record your data in the area marked Day 2 on the table. Determine the
amount of change (subtract) for each measurement and record on the chart. Data: Day Gummy
Bear Color
Length (cm)
Width (cm)
Height (cm)
Volume (cm)
Mass (g)
Density (g/cm3)
1 2 Amount of Change
Conclusion: Have students answer the conclusion questions on the student lab worksheet. Extension: Students may construct a bar graph of their results.
Scientist : ______________________ Date:___________
Density g/cm3
Days

Title: Gummy Bear Lab
Benchmarks: SC.4.N.1.2 – Compare observations made by different groups using multiple tools and seek reasons to explain the differences across groups. Problem Statement (10 POINTS): How does __________________________________________________________ affect____________________________________________________________?
Hypothesis (15 POINTS):
If , then
Materials:
• 1 gummy bear per student • 1 small cup or beaker of water (4 oz.) • Measuring tools- metric ruler and scale /triple-beam balance • 1 student lab report sheet • graduated cylinder
Procedures: 12. Distribute one (1) gummy bear to each student. Use the metric ruler to measure your gummy bear and
record the data in the table for Day 1. 13. The length of your gummy bear should be measured from the top of its head to the bottom of its feet and
round to the nearest tenth of a centimeter. 14. Measure the width at the widest point across the back of the gummy bear to the nearest tenth of a
centimeter. 15. Measure the thickness from the front to the back at the thickest point to the nearest tenth of a centimeter. 16. Calculate the volume by multiplying the length, width, and height. Round to the nearest hundredth.
(Volume= L X W X H) 17. Measure the mass using a scale or triple beam balance to the nearest tenth of a gram. (Note: An
electronic scale may be easier and more time efficient that using the triple beam balance.) 18. Calculate the density by dividing the mass by the volume. Round the answer to the nearest hundredth.
(D= M ÷ V) 19. Place the gummy bear in a cup labeled with your name and class period. 20. Using a beaker add 50 mL of water to the cup with the gummy bar and allow it to sit for 1 day. 21. On Day 2, remove the gummy bear the cup of water and use a paper towel to dry it removing excess
water and preventing it from dripping over your lab work station. 22. Repeat steps 1 through 8 and record your data in the area marked Day 2 on the table. Determine the
amount of change (subtract) for each measurement and record on the chart.
Control (5 POINTS) Variable (5 POINTS)

Data (20 POINTS):
Day Gummy Bear Color
Length
(cm)
Width
(cm)
Height
(cm)
Volume
(cm)
Mass
(g)
Density
(g/cm3)
1 2 Amount of Change
Conclusion (35 POINTS):
1. Was your hypothesis correct? Why or why not? Explain in detail. _______________________________________________________________________________________________________________________________________________________________________________________
2. Which change is greater- volume or mass? Explain according to your data.
__________________________________________________________________________________________________________________________
3. Was there a change in density? Why or why not?
__________________________________________________________________________________________________________________________
Extension: Construct a graph below of your results from your data table.
TOTAL POINTS:___________
Density
Days

Rainbow Measuring Fun Lab – Teacher Reference Form
Benchmark: SC.4.N.1.3 – Explain that science does not always follow a rigid defined method (“the scientific method”), but that science does involve the use of observations and empirical evidence.
Purpose: To practice using the metric system, test precision and student ability to follow instructions.
Essential Question: Is it possible for students to carry out the same procedures and get different results? Yes, it is possible if the group members did not collect accurate or precise measurements for their data while conducting the experiment. Problem Statement: How does the amount of liquid affect the color? Materials:
• 6 test tubes (label the test tubes with the letters A-E) • test tube rack • 1 pipette or medicine dropper for stirring (optional) • 1 empty cup (for contaminated waste) • 1 cup of clean water (for rinsing your graduated cylinder) • 1 graduated cylinder
Procedures: Part 1:
1. Fill a cup or beaker half way full with water. Use this to rinse your graduated cylinder and test tubes. 2. The second beaker is for contaminated waste water. 3. Into test tube A, measure 25 mL of RED liquid. 4. Into test tube C, measure 17 mL of YELLOW liquid. 5. Into test tube E, measure 21 mL of BLUE liquid.
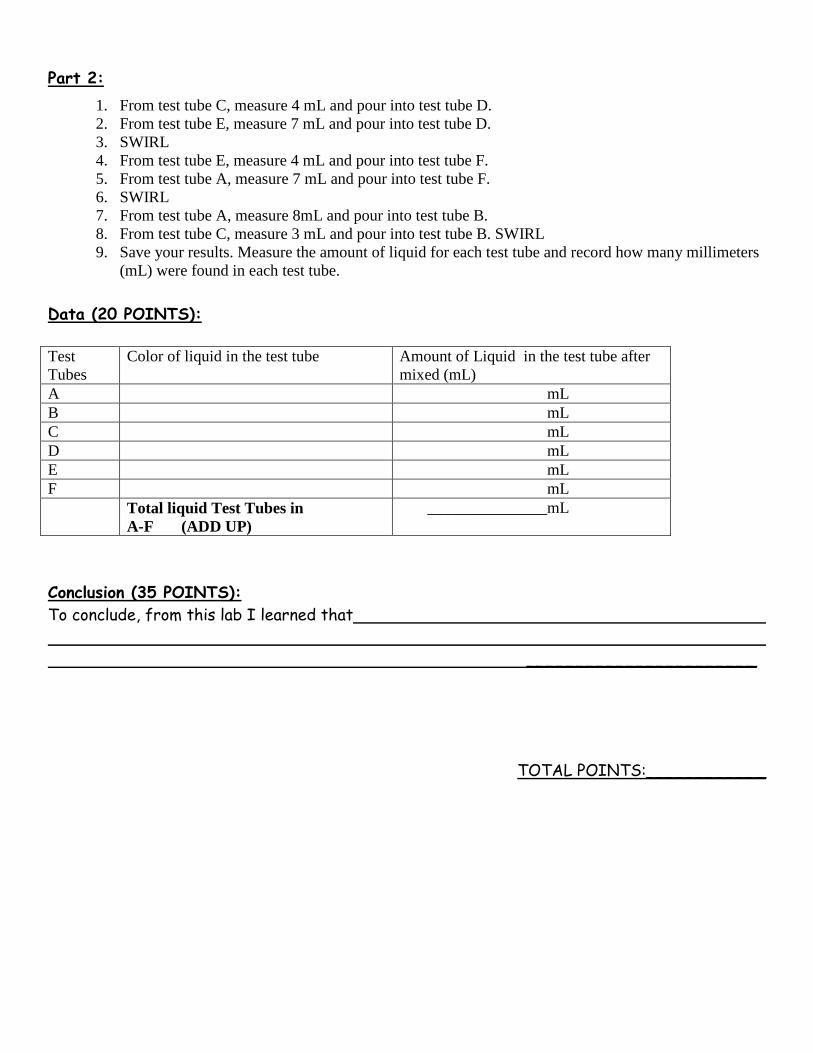
Part 2: 1. From test tube C, measure 4 mL and pour into test tube D. 2. From test tube E, measure 7 mL and pour into test tube D. SWIRL 3. From test tube E, measure 4 mL and pour into test tube F. 4. From test tube A, measure 7 mL and pour into test tube F. SWIRL 5. From test tube A, measure 8mL and pour into test tube B. 6. From test tube C, measure 3 mL and pour into test tube B. SWIRL 7. Save your results. Measure the amount of liquid for each test tube and record how many mL were found in each test tube.
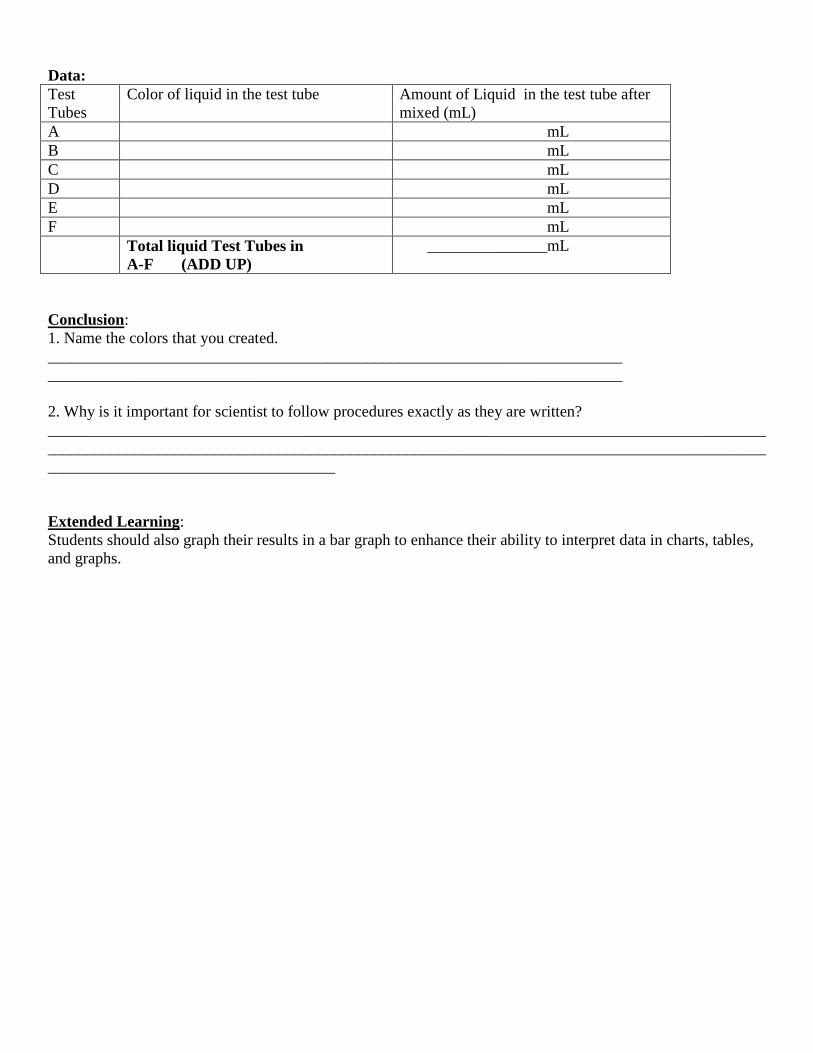
Data: Test Tubes
Color of liquid in the test tube Amount of Liquid in the test tube after mixed (mL)
A mL B mL C mL D mL E mL F mL Total liquid Test Tubes in
A-F (ADD UP) _______________mL
Conclusion: 1. Name the colors that you created. ________________________________________________________________________ ________________________________________________________________________ 2. Why is it important for scientist to follow procedures exactly as they are written? ________________________________________________________________________________________________________________________________________________________________________________________________________________________ Extended Learning: Students should also graph their results in a bar graph to enhance their ability to interpret data in charts, tables, and graphs.

Scientist : ______________________ Date:___________
Title: Rainbow Measuring Fun Lab –Fourth Grade
Benchmarks: SC.4.N.1.3- Explain that science does not always follow a rigidly defined method (“the scientific method”), but that science does involve the use of observations and empirical evidence. Problem Statement (10 POINTS): How does ___________________________________________________________ affect______________________________________________________________?
Hypothesis (15 POINTS):
If , then ________
Materials:
• 6 test tubes (label the test tubes with the letters A-E) • test tube rack • 1 pipette or medicine dropper for stirring (optional) • 1 empty cup (for contaminated waste) • 1 cup of clean water (for rinsing your graduated cylinder) • 1 graduated cylinder
Procedures: Part 1:
6. Fill a cup or beaker half way full with water. Use this to rinse your graduated cylinder and test tubes. 7. The second beaker is for contaminated waste water. 8. Into test tube A, measure 25 mL of RED liquid. 9. Into test tube C, measure 17 mL of YELLOW liquid. 10. Into test tube E, measure 21 mL of BLUE liquid.
Control (5 POINTS) Variable (5 POINTS)
Part 2:
1. From test tube C, measure 4 mL and pour into test tube D. 2. From test tube E, measure 7 mL and pour into test tube D. 3. SWIRL 4. From test tube E, measure 4 mL and pour into test tube F. 5. From test tube A, measure 7 mL and pour into test tube F. 6. SWIRL 7. From test tube A, measure 8mL and pour into test tube B. 8. From test tube C, measure 3 mL and pour into test tube B. SWIRL 9. Save your results. Measure the amount of liquid for each test tube and record how many millimeters
(mL) were found in each test tube. Data (20 POINTS): Test Tubes
Color of liquid in the test tube Amount of Liquid in the test tube after mixed (mL)
A mL B mL C mL D mL E mL F mL Total liquid Test Tubes in
A-F (ADD UP) _______________mL
Conclusion (35 POINTS): To conclude, from this lab I learned that _______________________
TOTAL POINTS:____________

CONSTELLATIONS
BIG IDEA 5: EARTH IN SPACE AND TIME
BENCHMARKS AND TASK ANALYSES SC.4.E.5.1 Observe that the patterns of stars in the sky stay the same although they appear to shift across the sky nightly, and different stars can be seen in different seasons. The student:
• identifies and labels well-known constellations. • observes the sky nightly for one week during each season, recording the location of well-known
constellations in a science notebook. SC.4.E.5.4 Relate that the rotation of Earth (day and night) and apparent movements of the Sun, Moon, and stars are connected. The student:
• creates a model to simulate the relative positions of the Moon, Sun, and constellations as the Earth rotates day and night.
SC.4.E.6.5 Investigate how technology and tools help to extend the ability of humans to observe very small things and very large things. The student:
• observes and studies details of objects using a variety of tools (hand lens, microscope, telescope, binoculars).
• selects the appropriate observation tool for a given task. SC.4.N.1.1 Raise questions about the natural world, use appropriate reference materials that support understanding to obtain information (identifying the source), conduct both individual and team investigations through free exploration and systematic investigations, and generate appropriate explanations based on those explorations. SC.4.N.1.4 Attempt reasonable answers to scientific questions and cite evidence in support. SC.4.N.1.6 Keep records that describe observations made, carefully distinguishing actual observations from ideas and inferences about the observations. SC.4.N.2.1 Explain that science focuses solely on the natural world. SC.4.N.3.1 Explain that models can be three dimensional, two dimensional, an explanation in your mind, or a computer model.
KEY QUESTION What is a constellation?
BACKGROUND INFORMATION Astronomers estimate that there are about 1,000 million galaxies (swirling, massive clusters of solar systems) in the universe and that each galaxy contains about 100,000 million stars! A star is a huge, hot ball of burning gas that radiates light and heat. Our Sun is just one of those stars, located near the edge of our galaxy, the Milky Way.
Stars have been a great source of wonder for thousands of years. Some of the best stories ever told came from the heavens. Ancient people would imagine lines between various stars so that groups of stars took on different shapes, such as animals, people and objects. Stories about the stars were passed from generation to generation. Over time the stories may have changed, but the star groupings are generally the same.
A constellation is a particular area of the sky that contains a particular set of stars. There are 88 recognized constellations. Most of the constellations can be seen from Earth’s equator, although even at that location, not all of them can be seen. This occurs because the Earth blocks the view of part of the sky. Constellations always form the same shape, but from our view on Earth their

positions in the night sky change throughout the year because of the Earth’s rotation on its axis and its revolution around the Sun. Some of the familiar constellations are: the Big Dipper (Ursa Major), Cassiopeia, the Little Dipper (Ursa Minor), Aquarius, and Orion (The Hunter).
The star known as the North Star or Pole Star is perhaps the best-known star in the northern sky. Because in the current era it lies nearly in a direct line with the axis of the Earth's rotation "above" the North Pole — the north celestial pole — Polaris stands almost motionless on the sky, and all the stars of the Northern sky appear to rotate around it. Therefore, it makes an excellent reference point for navigation.
MATERIALS Teacher reference materials on stars and constellations pre-made constellation viewer (see Teaching Tips) light source
scissors
Per group 1 cardboard toilet tissue tube 1 black marker 1 flashlight 1 push pin masking tape
glue 1 circle of black construction paper – the size of the tube opening
1 cardboard circle – the size of the tube opening 1 constellation pattern (black dots on white copy paper the size of the tube opening)
SAFETY Always follow science safety guidelines. Use proper caution with scissors and push pins. Inform students not to look directly into the light source with their naked eyes.
TEACHING TIPS
Set a time for students to visit the media center and also have resource material on constellations available in the classroom. You can download monthly guides to the night sky, including a sky map, free of charge, at: http://www.skymaps.com/downloads.html. The mythology of the constellations can be found at this website: http://www.comfychair.org/~cmbell/myth/myth.html. Prepare ahead of time:
• Make your own constellation viewer to use as a model. • Cut one small circle of black construction paper for each group – the size of the toilet tissue tube
opening. • Cut one cardboard circle for each group – the size of the toilet tissue tube opening. • Cut one small piece of white copy paper for each group – the size of the toilet tissue tube opening.
Make sure every student has the opportunity to participate in the Explore part of the activity. Inform parents where in the sky to look and approximate times for the best viewing. Explain that the goal is for students to gain as much information as possible through direct observations. Encourage use of binoculars or telescopes for viewing stars.
ENGAGE (Part 1)
Draw a constellation on the board where it will not be erased, or put up a picture of one. Label it, "Mystery Constellation." Choose an easily identifiable one from the Northern Hemisphere during the season you are currently in. Leave it up for a couple of days to create interest, then review what

students already know about constellations. Ask: What is a constellation? Can you name some constellations? Which ones have you seen? What is a myth? (A myth is a story or belief that tries to explain something. A constellation myth tries to explain why that particular constellation is in the sky and usually contains a moral with a hero or heroine.) Does anyone know any myths attached to these constellations? Have students guess the name of the constellation, writing the names on the board as they are given. Finally, give them the real name of the constellation and tell them the myth of how it came to be. Discuss the difference between the creation of myths to explain something and the use of science to explain something. (Science focuses solely on the natural world. Scientific explanations are based on observable evidence.)
ENGAGE (Part 2)
1. Instruct students to make a constellation viewer of their own chosen constellation: 2. Show students your constellation viewer model. 3. Have students create their constellation pattern by making black dots on the small piece of white paper
the size of the cardboard tube opening. 4. Have students place the constellation pattern over a circle of black construction paper and tape it in
place temporarily with transparent tape. Place this over the cardboard circle and use a push pin to carefully punch out the constellation pattern.
5. Remove the tape and the constellation pattern. 6. Put some glue around one end of the cardboard tube and then place the circle of black construction
paper over the glue, patterned side up. Stand the tube on this end until the glue dries. 7. Use masking tape and a marker to label the tube with the name of the constellation. 8. Have students use the viewers by holding the tube with the patterned end toward the light source while
looking through the open end. Then encourage them to swap viewers and view other constellations. EXPLORE
Ask: What does an astronomer do? (An astronomer conducts scientific investigations of objects in space.) Tell students that they will become astronomers as they study stars and constellations. For one week, during each season of the school year, have students use journals to record the location of some well-known constellations in the night sky. After each week, bring in journals to discuss observations students made about the locations and any patterns or changes they noticed. Challenge students to develop explanations about their observations based on evidence.
EXPLAIN
What is a star? (A star is a huge, hot ball of burning gas that radiates light and heat.) What is a constellation? (A constellation is a particular area of the sky that contains a particular set of stars.) Why do constellations appear to move? (Constellations always form the same shape, but from our view on Earth their positions in the night sky change throughout the year because of the Earth’s rotation on its axis and its revolution around the Sun.) To demonstrate this, have students stand up and pretend they are the Earth. Tape a piece of paper with the North Star drawn on it to the ceiling. The teacher should pretend to be the Earth and tilt on the axis. Tell students that a spot in the middle of the room is the Sun and the paper hanging from the ceiling is the constellation. Make a revolution around the room stopping at each season (keep your tilt consistent for each season) and keep your head facing forward. Ask students if the people on Earth (teacher) can see the constellation clearly from the position the Earth is in for that particular season. Ask if the constellation moved or if the Earth move. Allow students to mimic the procedure. Ask students to explain why constellations appear to move across the night sky. (the revolution of Earth around Sun makes the constellations appear to move because the Earth is in different

positions)
EXTEND AND APPLY Create Your Own Constellation - Using white chalk and black construction paper, have students draw random dots on the paper. Switch papers with a partner. Do they see a pattern or shape appear? Have the students connect the dots that create the pattern they see. They will name their constellation and write a myth about how their constellation came to be.
ASSESSMENT On a starry evening, you go outside and stand in a spot so that a bright star is just above the roof across the street. You return to the exact spot in an hour and the star has moved quite a distance. Explain why this happened.

SCIENTIST:_________________ Date:____________
Title: Constellations
Benchmarks: SC.4.E.5.1 Observe that the patterns of stars in the sky stay the same although they appear to shift across the sky nightly, and different stars can be seen in different seasons. The student: SC.4.E.5.4 Relate that the rotation of Earth (day and night) and apparent movements of the Sun, Moon, and stars are connected. The student: SC.4.E.6.5 Investigate how technology and tools help to extend the ability of humans to observe very small things and very large things. The student: SC.4.N.1.1 Raise questions about the natural world, use appropriate reference materials that support understanding to obtain information (identifying the source), conduct both individual and team investigations through free exploration and systematic investigations, and generate appropriate explanations based on those explorations. SC.4.N.1.4 Attempt reasonable answers to scientific questions and cite evidence in support. SC.4.N.1.6 Keep records that describe observations made, carefully distinguishing actual observations from ideas and inferences about the observations. SC.4.N.2.1 Explain that science focuses solely on the natural world. SC.4.N.3.1 Explain that models can be three dimensional, two dimensional, an explanation in your mind, or a computer model. Problem Statement (10 POINTS): How does ___________________________________________________________ affect______________________________________________________________? Materials:
1 cardboard toilet tissue tube 1 black marker 1 flashlight 1 push pin masking tape
glue 1 circle of black construction paper – the size of the tube opening
1 cardboard circle – the size of the tube opening 1 constellation pattern (black dots on white copy paper the size of the tube opening)
Procedure: 1. Make a constellation viewer with your own chosen constellation: 2. Create their constellation pattern by making black dots on the small piece of white paper the size of the
cardboard tube opening. 3. Place the constellation pattern over a circle of black construction paper and tape it in place temporarily
with transparent tape. Place this over the cardboard circle and use a push pin to carefully punch out the constellation pattern.
4. Remove the tape and the constellation pattern. 5. Put some glue around one end of the cardboard tube and then place the circle of black construction
paper over the glue, patterned side up. Stand the tube on this end until the glue dries. 6. Use masking tape and a marker to label the tube with the name of the constellation.

7. Use the viewers by holding the tube with the patterned end toward the light source while looking
through the open end. Then encourage them to swap viewers and view other constellations.
Observations (30 points):
• What is a star?
• What is a constellation?
• Why do constellations appear to move?
Data (30 points): MAKE A REVOLUTION WITH YOUR VIEWER AND DRAW WHAT YOU SEE
CONSTELLATION NAME:
BEFORE REVOLUTION AFTER REVOLUTION
Analysis (30 points): On a starry evening, you go outside and stand in a spot so that a bright star is just above the roof across the street. You return to the exact spot in an hour and the star has moved quite a distance. Explain why this happened
TOTAL POINTS:_______________

PHASES OF THE MOON BIG IDEA 5: EARTH IN SPACE AND TIME BENCHMARKS AND TASK ANALYSES SC.4.E.5.2 Describe the changes in the observable shape of the moon over the course of about a month. The student:
• observes and records how the Moon changes from day to day in a cycle that lasts approximately 28 days.
SC.4.E.5.4 Relate that the rotation of Earth (day and night) and apparent movements of the Sun, Moon, and stars are connected. The student:
• creates a model to simulate the relative positions of the Moon, Sun, and constellations as the Earth rotates day and night.
SC.4.E.6.5 Investigate how technology and tools help to extend the ability of humans to observe very small things and very large things. The student:
• observes and studies details of objects using a variety of tools (hand lens, microscope, telescope, binoculars).
• selects the appropriate observation tool for a given task. SC.4.N.1.1 Raise questions about the natural world, use appropriate reference materials that support understanding to obtain information (identifying the source), conduct both individual and team investigations through free exploration and systematic investigations, and generate appropriate explanations based on those explorations. SC.4.N.1.6 Keep records that describe observations made, carefully distinguishing actual observations from ideas and inferences about the observations. SC.4.N.3.1 Explain that models can be three dimensional, two dimensional, an explanation in your mind, or a computer model.
KEY QUESTION Why does the Moon seem to change shape?
BACKGROUND INFORMATION The Moon is the Earth’s only natural satellite. It takes the Moon approximately 28 days to complete all of its phases. During the same time, the Moon also rotates once on its axis; that is why we always see the same side of the Moon from Earth. Half of the Moon’s surface faces the Sun and reflects the Sun’s light; the Moon does not generate its own light. The other half of the Moon faces away from the Sun. As the Moon revolves around the Earth and the Earth and Moon revolve together around the Sun, the relative positions of the Earth, Moon, and Sun constantly change. The Moon appears to rise in the east and set in the west, due to the Earth’s rotation from west to east. We see different amounts of the Moon’s lit surface at different times of the month. This causes the Moon to seem to have different shapes, called Moon phases. There is no exact starting point for the lunar cycle, but the phases do follow each other in an exact order. The first phase is known as the First Quarter Moon, during which we see half of the side of the Moon that is reflecting sunlight. The First Quarter Moon occurs when the Moon has completed the First Quarter of its trip around the Earth – about six to eight days after the New Moon. The second phase is the Full Moon, during which we see the full face of the Moon that is reflecting sunlight because the Earth is between the Sun and the Moon. The third phase is the third quarter Moon, which occurs about three weeks after the New Moon. The next phase of the Moon is the New Moon. When the New Moon occurs, we seldom see any part of the Moon from the Earth. As the Moon moves from new to full, it is said to be waxing. As it moves back to New Moon again, it is said to be waning.

MATERIALS Teacher overhead projector The Moon Book by Gail Gibbons
Per group
one 4-inch foam ball
Per student science notebook SAFETY
Always follow science safety guidelines. Caution students not to look directly into the light from the overhead projector.
TEACHING TIPS
1. Make sure every student has the opportunity to participate in the Explore part of the activity. Inform parents where in the sky to look and approximate times for the best viewing. Explain that the goal is for students to gain as much information as possible through direct observations.
2. Moonrise and Moonset information can be found online at the U.S. Naval Observatory website: http://aa.usno.navy.mil/data/docs/RS_OneDay.php
3. Encourage students to observe the Moon using tools such as binoculars and telescopes at home or at a place like the Orlando Science Center.
ENGAGE Say: I am thinking of a certain celestial body. I will give you some clues to help you guess what it is. (When a student thinks he has the answer, have him give the next clue rather than the answer.)
• It is relatively small. • It could fit inside the country of Canada. • It is the brightest and most easily seen object in the night sky. • Neil Armstrong was the first human being to walk there. • It looks different at different times of the month. • It is the Earth’s only natural satellite.
Have you guessed what it is? We’re going to find out more about the Moon during the next activity.
EXPLORE (Part 1) 1. Students should ask their families to join them on a Moon watch. Families can share a pair of
binoculars outside in the evening when the Moon is visible, using the binoculars to closely observe the Moon’s surface. Inform parents where in the sky to look and approximate times for the best viewing. Explain that the goal is for students to gain as much information as possible through direct observations.
2. Have students observe the Moon during a one-month period and encourage them to keep a record of their observations and sketches in their notebooks. They should include the date, time, Moon's appearance, and position in the sky.
EXPLAIN (Part 1) Use the notebooks to discuss how the observable shape of the Moon changes from day to day in a cycle that lasts approximately 28 days. Ask: What did you notice about the changes in the Moon phases from night to night?
EXPLORE (Part 2)
1.Instruct students to carefully poke the sharpened end of their pencil into the Styrofoam ball to create
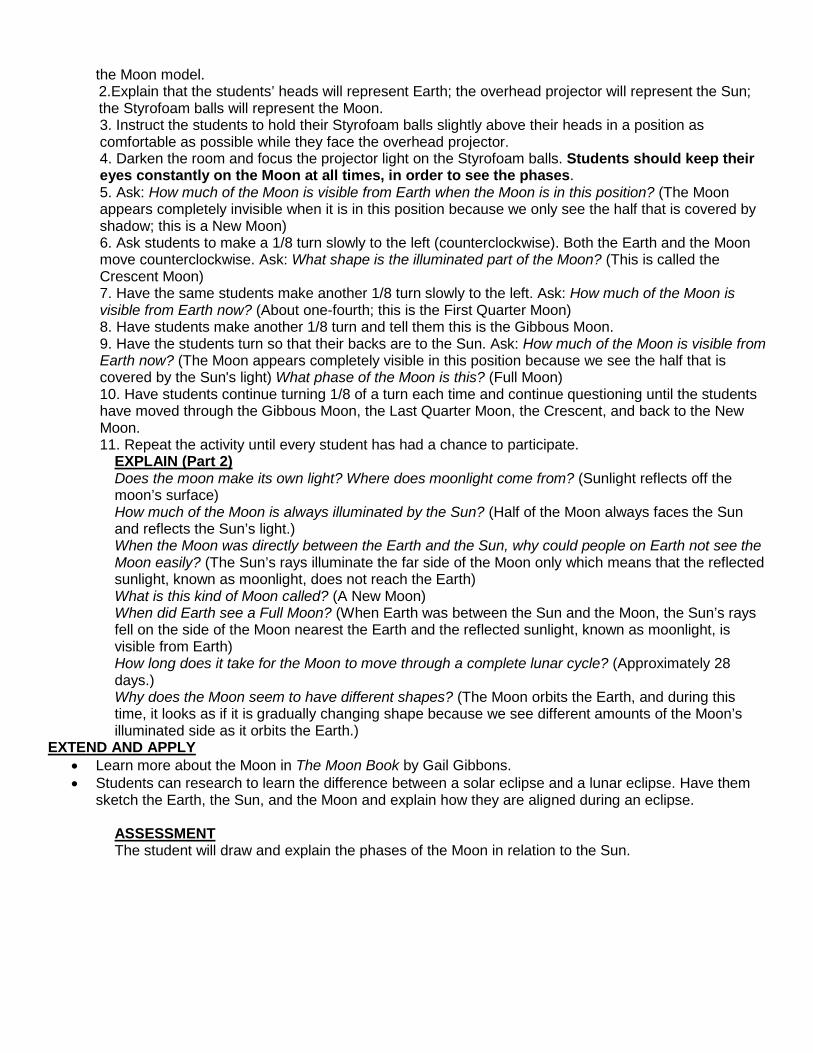
the Moon model. 2.Explain that the students’ heads will represent Earth; the overhead projector will represent the Sun; the Styrofoam balls will represent the Moon. 3. Instruct the students to hold their Styrofoam balls slightly above their heads in a position as comfortable as possible while they face the overhead projector. 4. Darken the room and focus the projector light on the Styrofoam balls. Students should keep their eyes constantly on the Moon at all times, in order to see the phases. 5. Ask: How much of the Moon is visible from Earth when the Moon is in this position? (The Moon appears completely invisible when it is in this position because we only see the half that is covered by shadow; this is a New Moon) 6. Ask students to make a 1/8 turn slowly to the left (counterclockwise). Both the Earth and the Moon move counterclockwise. Ask: What shape is the illuminated part of the Moon? (This is called the Crescent Moon) 7. Have the same students make another 1/8 turn slowly to the left. Ask: How much of the Moon is visible from Earth now? (About one-fourth; this is the First Quarter Moon) 8. Have students make another 1/8 turn and tell them this is the Gibbous Moon. 9. Have the students turn so that their backs are to the Sun. Ask: How much of the Moon is visible from Earth now? (The Moon appears completely visible in this position because we see the half that is covered by the Sun's light) What phase of the Moon is this? (Full Moon) 10. Have students continue turning 1/8 of a turn each time and continue questioning until the students have moved through the Gibbous Moon, the Last Quarter Moon, the Crescent, and back to the New Moon. 11. Repeat the activity until every student has had a chance to participate.
EXPLAIN (Part 2) Does the moon make its own light? Where does moonlight come from? (Sunlight reflects off the moon’s surface) How much of the Moon is always illuminated by the Sun? (Half of the Moon always faces the Sun and reflects the Sun’s light.) When the Moon was directly between the Earth and the Sun, why could people on Earth not see the Moon easily? (The Sun’s rays illuminate the far side of the Moon only which means that the reflected sunlight, known as moonlight, does not reach the Earth) What is this kind of Moon called? (A New Moon) When did Earth see a Full Moon? (When Earth was between the Sun and the Moon, the Sun’s rays fell on the side of the Moon nearest the Earth and the reflected sunlight, known as moonlight, is visible from Earth) How long does it take for the Moon to move through a complete lunar cycle? (Approximately 28 days.) Why does the Moon seem to have different shapes? (The Moon orbits the Earth, and during this time, it looks as if it is gradually changing shape because we see different amounts of the Moon’s illuminated side as it orbits the Earth.)
EXTEND AND APPLY • Learn more about the Moon in The Moon Book by Gail Gibbons. • Students can research to learn the difference between a solar eclipse and a lunar eclipse. Have them
sketch the Earth, the Sun, and the Moon and explain how they are aligned during an eclipse.
ASSESSMENT The student will draw and explain the phases of the Moon in relation to the Sun.

SCIENTIST:_________________ Date:____________
Title: Phases of the Moon
Benchmarks: SC.4.E.5.2 Describe the changes in the observable shape of the moon over the course of about a month. The student: SC.4.E.5.4 Relate that the rotation of Earth (day and night) and apparent movements of the Sun, Moon, and stars are connected. The student: . SC.4.E.6.5 Investigate how technology and tools help to extend the ability of humans to observe very small things and very large things. The student: SC.4.N.1.1 Raise questions about the natural world, use appropriate reference materials that support understanding to obtain information (identifying the source), conduct both individual and team investigations through free exploration and systematic investigations, and generate appropriate explanations based on those explorations. SC.4.N.1.6 Keep records that describe observations made, carefully distinguishing actual observations from ideas and inferences about the observations. SC.4.N.3.1 Explain that models can be three dimensional, two dimensional, an explanation in your mind, or a computer model. Problem Statement (10 POINTS): How does ___________________________________________________________ affect______________________________________________________________? Materials:
Per group one 4-inch foam ball
Per student science notebook Procedure:
1. Carefully poke the sharpened end of their pencil into the Styrofoam ball to create the Moon model. 2. Your head will represent Earth; the overhead projector will represent the Sun; the Styrofoam balls will represent the Moon. 3. Hold their Styrofoam balls slightly above their heads in a position as comfortable as possible while they face the overhead projector. 4. Keep their eyes constantly on the Moon at all times, in order to see the phases. 5. Answer: How much of the Moon is visible from Earth when the Moon is in this position? 6. Make a 1/8 turn slowly to the left (counterclockwise). Both the Earth and the Moon move counterclockwise. Answer: What shape is the illuminated part of the Moon? 7. Make another 1/8 turn slowly to the left. Answer: How much of the Moon is visible from Earth now? 8. Have students make another 1/8 turn What phase of the Moon is this?. 9. Have the students turn so that their backs are to the Sun. Answer: How much of the Moon is visible from Earth now? What phase of the Moon is this? 10. Continue turning 1/8 of a turn each time and label each phase.

Observations (30 points):
Position 1: How much of the Moon is visible from Earth when the Moon is in this position?
Position 2: What shape is the illuminated part of the Moon?
Position 3: Gibbous Moon
Position 4: What phase of the Moon is this?
Data (30 points): Illustrate your observations
Position 1: Position 2: Position 3: Position 4
Analysis (30 points): 1. Does the moon make its own light? 2. Where does moonlight come from? 3. How much of the Moon is always illuminated by the Sun? 4. When the Moon was directly between the Earth and the Sun, why could people on Earth not see the Moon
easily? 5. What is this kind of Moon called? 6. When did Earth see a Full Moon? 7. How long does it take for the Moon to move through a complete lunar cycle? 8. Why does the Moon seem to have different shapes?
TOTAL POINTS:_______________

Shadows
BIG IDEA 5: EARTH IN SPACE AND TIME
BENCHMARKS AND TASK ANALYSES SC.4.E.5.3 Recognize that Earth revolves around the Sun in a year and rotates on its axis in a 24-hour day. The student:
• simulates the rotation of the Earth on its axis every 24 hours to produce the night and day cycle. • simulates the revolution of the Earth around the Sun in a year.
SC.4.E.5.4 Relate that the rotation of Earth (day and night) and apparent movements of the Sun, Moon, and stars are connected. The student:
• creates a model to simulate the relative positions of the Moon, Sun, and constellations as the Earth rotates day and night.
SC.4.N.1.1 Raise questions about the natural world, use appropriate reference materials that support understanding to obtain information (identifying the source), conduct both individual and team investigations through free exploration and systematic investigations, and generate appropriate explanations based on those explorations. SC.4.N.1.4 Attempt reasonable answers to scientific questions and cite evidence in support. Keep records that describe observations made, carefully distinguishing actual observations from ideas and inferences about the observations. KEY QUESTION
How can a shadow demonstrate Earth’s rotation?
BACKGROUND INFORMATION Shadows are created from indirect light from the Sun and the Earth’s movement. When an object blocks light, a shadow is created based on the shape of the object. Indirect light occurs best in the morning and afternoon. The shadow cast by an object changes over time. Over the period of several months, the shadow changes in length. A short shadow indicates that the Sun is high in the sky. A longer shadow indicates that the Sun is lower in the sky. During the day, the shadow changes in length and position, allowing the Sun to be used as a clock, which demonstrates the movement of the Earth on its axis.
MATERIALS Teacher overhead projector
Per group 1 large sheet of white poster board 1 sharpened pencil or a craft stick 1 clock or watch 1 compass 1 colored pencil or crayon 1 metric ruler 1 small lump of clay
SAFETY
Always follow science safety guidelines. Caution students never to look directly at the Sun!
TEACHING TIPS
1. Select an appropriate outdoor area prior to the activity.
2. Begin this activity as early in the morning as possible. Students will need to observe shadows every hour throughout the day.
ENGAGE
1. Use the overhead projector as a light source to trace a child’s profile on the board. 2. Ask: What do you see? What caused the shadow to appear? Where do we find shadows?
EXPLORE
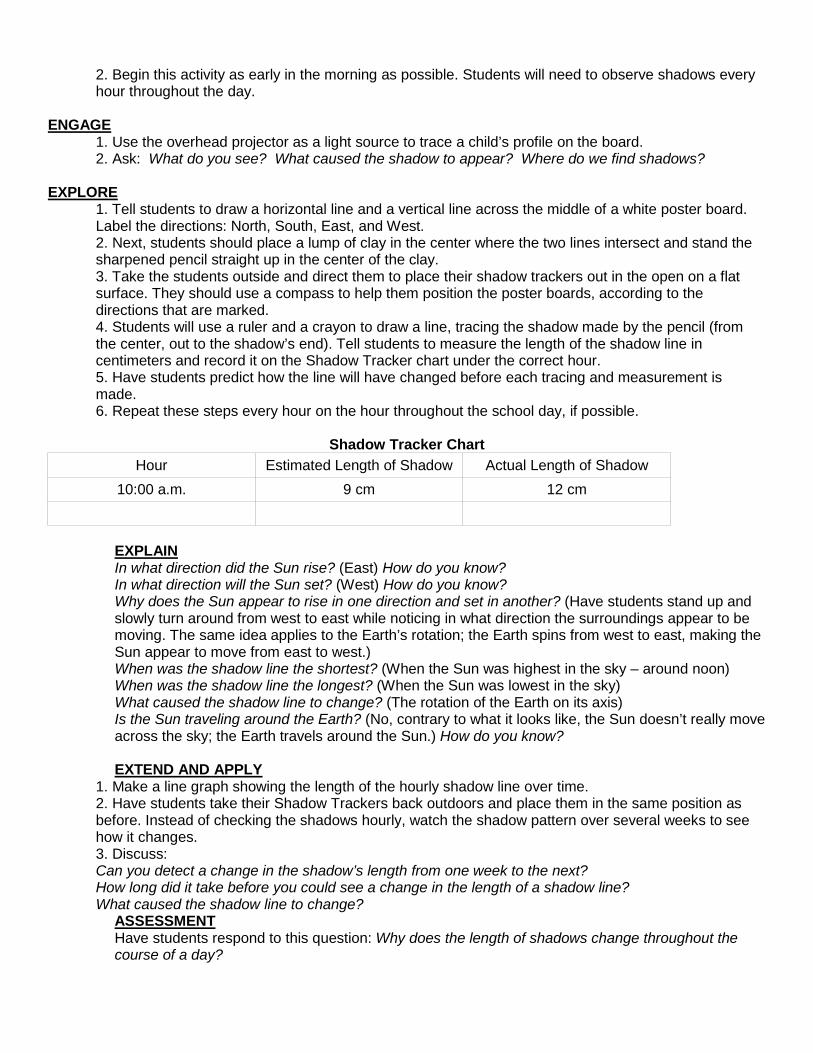
1. Tell students to draw a horizontal line and a vertical line across the middle of a white poster board. Label the directions: North, South, East, and West. 2. Next, students should place a lump of clay in the center where the two lines intersect and stand the sharpened pencil straight up in the center of the clay. 3. Take the students outside and direct them to place their shadow trackers out in the open on a flat surface. They should use a compass to help them position the poster boards, according to the directions that are marked. 4. Students will use a ruler and a crayon to draw a line, tracing the shadow made by the pencil (from the center, out to the shadow’s end). Tell students to measure the length of the shadow line in centimeters and record it on the Shadow Tracker chart under the correct hour. 5. Have students predict how the line will have changed before each tracing and measurement is made. 6. Repeat these steps every hour on the hour throughout the school day, if possible.
Shadow Tracker Chart Hour Estimated Length of Shadow Actual Length of Shadow
10:00 a.m. 9 cm 12 cm
EXPLAIN In what direction did the Sun rise? (East) How do you know? In what direction will the Sun set? (West) How do you know? Why does the Sun appear to rise in one direction and set in another? (Have students stand up and slowly turn around from west to east while noticing in what direction the surroundings appear to be moving. The same idea applies to the Earth’s rotation; the Earth spins from west to east, making the Sun appear to move from east to west.) When was the shadow line the shortest? (When the Sun was highest in the sky – around noon) When was the shadow line the longest? (When the Sun was lowest in the sky) What caused the shadow line to change? (The rotation of the Earth on its axis) Is the Sun traveling around the Earth? (No, contrary to what it looks like, the Sun doesn’t really move across the sky; the Earth travels around the Sun.) How do you know?
EXTEND AND APPLY
1. Make a line graph showing the length of the hourly shadow line over time. 2. Have students take their Shadow Trackers back outdoors and place them in the same position as before. Instead of checking the shadows hourly, watch the shadow pattern over several weeks to see how it changes. 3. Discuss: Can you detect a change in the shadow’s length from one week to the next? How long did it take before you could see a change in the length of a shadow line? What caused the shadow line to change?
ASSESSMENT Have students respond to this question: Why does the length of shadows change throughout the course of a day?

SCIENTIST:_________________ Date:____________
Title: Shadows
Benchmarks: SC.4.E.5.3 Recognize that Earth revolves around the Sun in a year and rotates on its axis in a 24-hour day. The student: SC.4.E.5.4 Relate that the rotation of Earth (day and night) and apparent movements of the Sun, Moon, and stars are connected. The student: SC.4.N.1.1 Raise questions about the natural world, use appropriate reference materials that support understanding to obtain information (identifying the source), conduct both individual and team investigations through free exploration and systematic investigations, and generate appropriate explanations based on those explorations. SC.4.N.1.4 Attempt reasonable answers to scientific questions and cite evidence in support. Keep records that describe observations made, carefully distinguishing actual observations from ideas and inferences about the observations. Problem Statement (10 POINTS): How does ___________________________________________________________ affect______________________________________________________________? Materials:
1 large sheet of white poster board 1 sharpened pencil or a craft stick 1 clock or watch 1 compass 1 colored pencil or crayon 1 metric ruler 1 small lump of clay
Procedure:
1. Draw a horizontal line and a vertical line across the middle of a white poster board. Label the directions: North, South, East, and West. 2. Place a lump of clay in the center where the two lines intersect and stand the sharpened pencil straight up in the center of the clay. 3. Go outside and place shadow trackers out in the open on a flat surface. Use a compass to help them position the poster boards, according to the directions that are marked. 4. Use a ruler and a crayon to draw a line, tracing the shadow made by the pencil (from the center, out to the shadow’s end). Measure the length of the shadow line in centimeters and record it on the Shadow Tracker chart under the correct hour. 5. Predict how the line will have changed before each tracing and measurement is made. 6. Repeat these steps every hour on the hour throughout the school day, if possible.
Observations (30 points): Draw how the shadow changed over time

Beginning End
Data (30 points): Illustrate your observations
Shadow Tracker Chart
Hour Estimated Length of Shadow Actual Length of Shadow 10:00 a.m. 9 cm 12 cm
Analysis (30 points): 1. In what direction did the Sun rise? How do you know?
2. In what direction will the Sun set? How do you know?
3. Why does the Sun appear to rise in one direction and set in another?
4. When was the shadow line the shortest?
5. When was the shadow line the longest?
6. What caused the shadow line to change?
7. Is the Sun traveling around the Earth? How do you know?
TOTAL POINTS:_______________

Teacher Plans
ROCKS AND MINERALS BIG IDEA 6: EARTH STRUCTURES BENCHMARKS AND TASK ANALYSES SC.4.E.6.2 Identify the physical properties of common earth-forming minerals, including hardness, color, luster, cleavage, and streak color, and recognize the role of minerals in the formation of rocks. The student:
examines the physical properties of common earth-forming minerals, including hardness, color, luster, cleavage, and streak color.
identifies the role of minerals in the formation of rocks. SC.4.N.1.1 Raise questions about the natural world, use appropriate reference materials that support understanding to obtain information (identifying the source), conduct both individual and team investigations through free exploration and systematic investigations, and generate appropriate explanations based on those explorations. SC.4.N.1.2 Compare the observations made by different groups using multiple tools and seek reasons to explain the differences across groups. SC.4.N.1.4 Attempt reasonable answers to scientific questions and cite evidence in support. KEY QUESTIONS What are rocks made of? What are some physical properties of rocks? TEACHER BACKGROUND INFORMATION Rocks are solid earth materials formed from a mixture of minerals and sometimes other materials. Minerals are naturally formed solid substances with crystal structures, which were not formed from living things. There are more than 3,000 kinds of minerals. Each kind of mineral has certain properties that can be used to identify it: hardness, color, luster, streak, crystal shape, etc. Knowing what kind of minerals a rock contains is the best way to identify it. MATERIALS Per class various items (jewelry, clay, chalk, penny, sand, etc.)
Per group rock samples mineral samples: quartz, pyrite, hematite halite (rock salt) Per student hand lens science notebook and pencil iron nail streak plate

SAFETY Always follow DCPS science safety guidelines. Use caution with the iron nails and streak plates. Warn children that the halite (rock salt) is not safe to eat. TEACHING TIPS Try to focus on letting students come up with their own observations and explanations before you introduce the technical vocabulary. ENGAGE Show jewelry, clay pot, chalk, penny, sand, pencil. What do these items have in common? They all contain materials that come from the Earth/rocks/minerals. Ask: Have you ever looked closely at a rock? What is it made of? Provide rock samples for the students to examine. Touch each rock. How does it feel? Look at each rock. What colors do you see? Are there any lines or patterns? Did any of the rocks feel the same? Did any have the same color? When you looked at the rocks with the hand lens, what did you see? What do you think rocks are made of? Rocks are made of minerals. Today we are going to look more closely at what rocks are made of. Ask students to write the key question in their science notebook and to discuss the question with their group. Then, have students write their preliminary thoughts in the notebook. EXPLORE Look at the mineral halite (rock salt) and quartz. Compare/contrast. Take the nail and carefully try to scratch each one. Which mineral was harder? How do you know? One of the properties of a mineral is its hardness. Even when minerals look the same, you can tell them apart by how hard they are. During the gold rush in California in the 1800s, miners searched for gold. They needed to be able to tell real gold from another mineral, pyrite, or “fool’s gold.” To tell them apart, the miners would bite the mineral they found. If they saw a bite mark in the mineral, they knew it was real gold. What property were they testing? (hardness) Minerals can also look very different, especially by their color. You can’t always trust what you see because water and air can change the color of some minerals. What color is the Statue of Liberty? (green) What is it made from? (copper) What color is copper normally? (orange/brown) Explain that the statue used to look the same color as a penny, but over time as it was exposed to the air and water, a chemical reaction happened and turned the statue green—just like when you find a really old penny that has tarnished. The way that you can test the true color of a mineral is by doing a “streak test.” Rub each mineral sample once across the tile and blow off the extra powder. Was the streak color always the same as the color of the mineral? Did all the minerals have the same streak colors? What property were we testing? (color and streak) You may have noticed as you’ve looked at minerals that they have different shapes. This is because minerals break in different ways or shapes, this is called “cleavage.” Examine the mineral samples and describe the shape of the crystals. What property are we observing? (cleavage) Hold the mineral samples up to the light. Other than color, what do you notice about how they look? Luster refers to how the minerals reflect light. Minerals can have a shiny, dull, earthy, metallic, glassy, or waxy luster. What property are we observing? (luster)
EXPLAIN In science notebooks, record the definition of a mineral (a natural, nonliving, solid crystal that makes up rocks) and list the properties of minerals (hardness, color, streak, cleavage, luster). Have students choose one mineral to draw and record its properties. Go back to the rock samples from the beginning of the lesson. Challenge the students to identify pieces of the minerals they observed in the rocks. Ask: Based on your observations, what can you tell about rocks? (Rocks are made of different minerals.) What can you tell about minerals? (Minerals have different properties.) What is the difference between a rock and a mineral? (A rock is a mixture of minerals and other things. A mineral is one substance.) Why don't all rocks look the same? (It depends on the minerals in the rock. Rocks are different because of the minerals they have in them.) Have students add responses to their science notebook focused on the key question. Remind them to provide evidence from the labs or from research to support their claims. EXTEND AND APPLY
1. Make a Bridge Map to make an analogy to rocks and minerals. Use the relating factor of “are made of different.” For example, rocks are made of different minerals, as salads are made of different vegetables. Challenge students to come up with other analogies.
2. Share the video Rock Odyssey with students. It is available at: http://www.mii.org/RockOdyssey.html .
ASSESSMENT Teacher observation and completion of student notebook entries. Evaluate science notebooks using the rubric.

SCIENTIST:______________ Date:____________ Title: Rocks and Minerals
Benchmarks: SC.4.E.6.2 Identify the physical properties of common earth-forming minerals, including hardness, color, luster, cleavage, and streak color, and recognize the role of minerals in the formation of rocks. SC.4.N.1.1 Raise questions about the natural world, use appropriate reference materials that support understanding to obtain information (identifying the source), conduct both individual and team investigations through free exploration and systematic investigations, and generate appropriate explanations based on those explorations. SC.4.N.1.2 Compare the observations made by different groups using multiple tools and seek reasons to explain the differences across groups. SC.4.N.1.4 Attempt reasonable answers to scientific questions and cite evidence in support. Problem Statement (10 POINTS): How does __________________________________________________________ affect____________________________________________________________? Materials: Per group rock samples mineral samples: quartz, pyrite, hematite halite (rock salt) Per student hand lens science notebook and pencil iron nail streak plate Procedure: 1. Look at the mineral halite (rock salt) and quartz. Compare/contrast.
One of the properties of a mineral is its hardness. Even when minerals look the same, you can tell them apart by how hard they are. During the gold rush in California in the 1800s, miners searched for gold. They needed to be able to tell real gold from another mineral, pyrite, or “fool’s gold.” To tell them apart, the miners would bite the mineral they found. If they saw a bite mark in the mineral, they knew it was real gold.
2. Take the nail and carefully try to scratch each one. Minerals can also look very different, especially by their color. You can’t always trust what you see because water and air can change the color of some minerals. What color is the Statue of Liberty? What is it made from?

What color is copper normally? The way that you can test the true color of a mineral is by doing a “streak test.” 3. Rub each mineral sample once across the tile and blow off the extra powder. You may have noticed as you’ve looked at minerals that they have different shapes. This is because minerals break in different ways or shapes, this is called “cleavage.” 4. Examine the mineral samples and describe the shape of the crystals. Hold the mineral samples
up to the light. Other than color, what do you notice about how they look? Luster refers to how the minerals reflect light. Minerals can have a shiny, dull, earthy, metallic, glassy, or waxy luster.
Observations (30 points): Draw how the shadow changed over time
1. Which mineral was harder? How do you know? 2. What property were they testing?
3. Was the streak color always the same as the color of the mineral? 4. Did all the minerals have the same streak colors? 5. What property were we testing with the tile?
6. When looking at the shapes of the minerals, what property were you observing?
7. What does luster refer to?
Data (30 points): Choose one mineral and describe its properties
Mineral:_________________
Hardness
Color
Streak
Cleavage
Luster
Analysis (30 points): 1. Based on your observation:, 2. What can you tell about rocks? 3. What can you tell about minerals? 4. What is the difference between a rock and a mineral? 5. Why don't all rocks look the same?
TOTAL POINTS:_______________
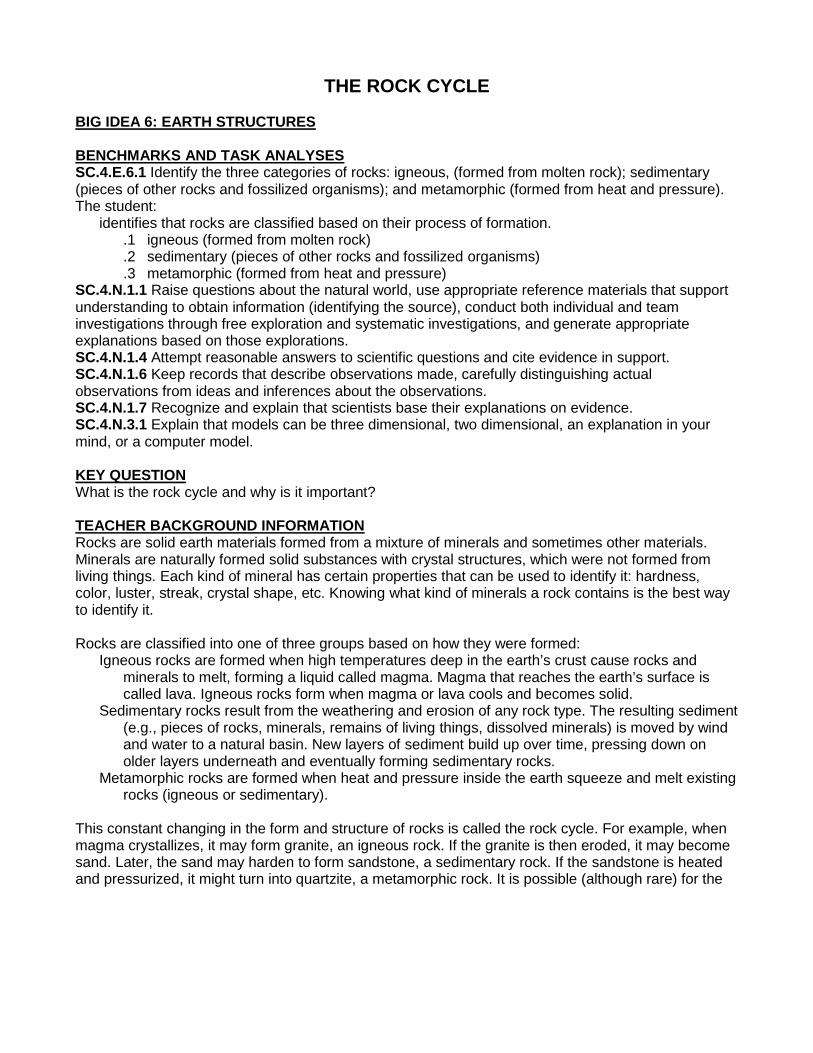
THE ROCK CYCLE BIG IDEA 6: EARTH STRUCTURES BENCHMARKS AND TASK ANALYSES SC.4.E.6.1 Identify the three categories of rocks: igneous, (formed from molten rock); sedimentary (pieces of other rocks and fossilized organisms); and metamorphic (formed from heat and pressure). The student:
identifies that rocks are classified based on their process of formation. .1 igneous (formed from molten rock) .2 sedimentary (pieces of other rocks and fossilized organisms) .3 metamorphic (formed from heat and pressure)
SC.4.N.1.1 Raise questions about the natural world, use appropriate reference materials that support understanding to obtain information (identifying the source), conduct both individual and team investigations through free exploration and systematic investigations, and generate appropriate explanations based on those explorations. SC.4.N.1.4 Attempt reasonable answers to scientific questions and cite evidence in support. SC.4.N.1.6 Keep records that describe observations made, carefully distinguishing actual observations from ideas and inferences about the observations. SC.4.N.1.7 Recognize and explain that scientists base their explanations on evidence. SC.4.N.3.1 Explain that models can be three dimensional, two dimensional, an explanation in your mind, or a computer model. KEY QUESTION What is the rock cycle and why is it important? TEACHER BACKGROUND INFORMATION Rocks are solid earth materials formed from a mixture of minerals and sometimes other materials. Minerals are naturally formed solid substances with crystal structures, which were not formed from living things. Each kind of mineral has certain properties that can be used to identify it: hardness, color, luster, streak, crystal shape, etc. Knowing what kind of minerals a rock contains is the best way to identify it. Rocks are classified into one of three groups based on how they were formed:
Igneous rocks are formed when high temperatures deep in the earth’s crust cause rocks and minerals to melt, forming a liquid called magma. Magma that reaches the earth’s surface is called lava. Igneous rocks form when magma or lava cools and becomes solid.
Sedimentary rocks result from the weathering and erosion of any rock type. The resulting sediment (e.g., pieces of rocks, minerals, remains of living things, dissolved minerals) is moved by wind and water to a natural basin. New layers of sediment build up over time, pressing down on older layers underneath and eventually forming sedimentary rocks.
Metamorphic rocks are formed when heat and pressure inside the earth squeeze and melt existing rocks (igneous or sedimentary).
This constant changing in the form and structure of rocks is called the rock cycle. For example, when magma crystallizes, it may form granite, an igneous rock. If the granite is then eroded, it may become sand. Later, the sand may harden to form sandstone, a sedimentary rock. If the sandstone is heated and pressurized, it might turn into quartzite, a metamorphic rock. It is possible (although rare) for the
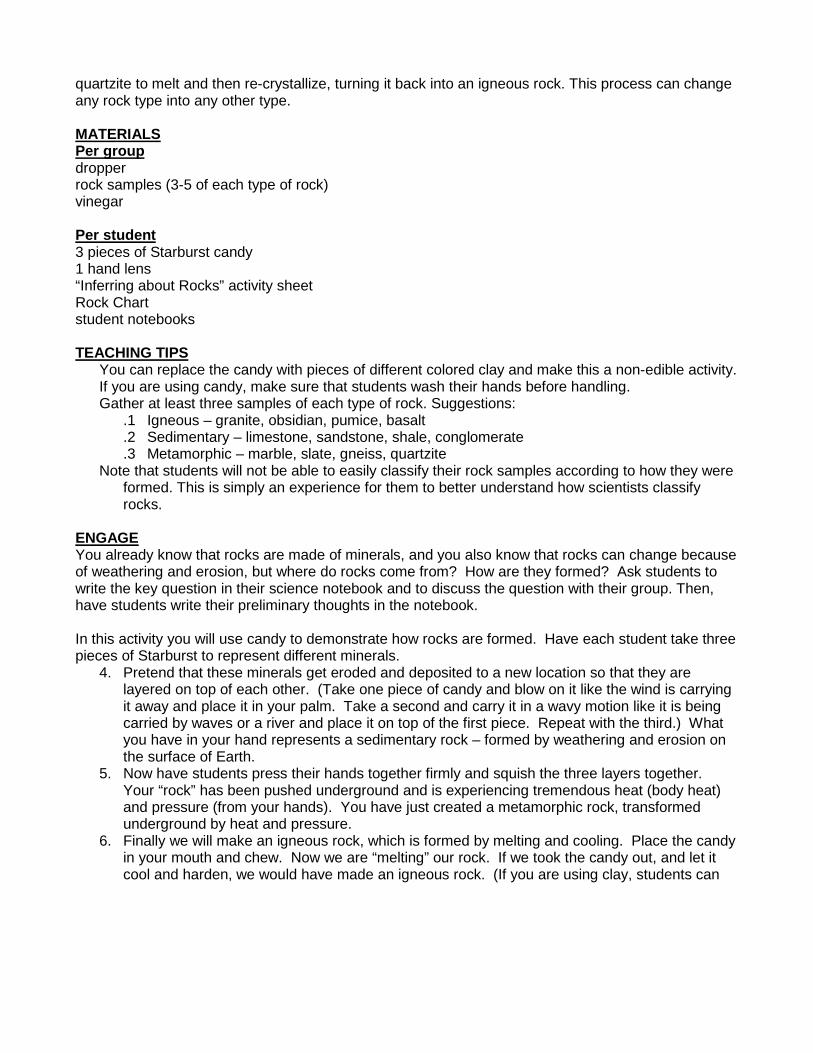
quartzite to melt and then re-crystallize, turning it back into an igneous rock. This process can change any rock type into any other type. MATERIALS Per group dropper rock samples (3-5 of each type of rock) vinegar Per student 3 pieces of Starburst candy 1 hand lens “Inferring about Rocks” activity sheet Rock Chart student notebooks TEACHING TIPS
You can replace the candy with pieces of different colored clay and make this a non-edible activity. If you are using candy, make sure that students wash their hands before handling. Gather at least three samples of each type of rock. Suggestions:
.1 Igneous – granite, obsidian, pumice, basalt
.2 Sedimentary – limestone, sandstone, shale, conglomerate
.3 Metamorphic – marble, slate, gneiss, quartzite Note that students will not be able to easily classify their rock samples according to how they were
formed. This is simply an experience for them to better understand how scientists classify rocks.
ENGAGE You already know that rocks are made of minerals, and you also know that rocks can change because of weathering and erosion, but where do rocks come from? How are they formed? Ask students to write the key question in their science notebook and to discuss the question with their group. Then, have students write their preliminary thoughts in the notebook. In this activity you will use candy to demonstrate how rocks are formed. Have each student take three pieces of Starburst to represent different minerals.
4. Pretend that these minerals get eroded and deposited to a new location so that they are layered on top of each other. (Take one piece of candy and blow on it like the wind is carrying it away and place it in your palm. Take a second and carry it in a wavy motion like it is being carried by waves or a river and place it on top of the first piece. Repeat with the third.) What you have in your hand represents a sedimentary rock – formed by weathering and erosion on the surface of Earth.
5. Now have students press their hands together firmly and squish the three layers together. Your “rock” has been pushed underground and is experiencing tremendous heat (body heat) and pressure (from your hands). You have just created a metamorphic rock, transformed underground by heat and pressure.
6. Finally we will make an igneous rock, which is formed by melting and cooling. Place the candy in your mouth and chew. Now we are “melting” our rock. If we took the candy out, and let it cool and harden, we would have made an igneous rock. (If you are using clay, students can

roll the clay vigorously in their hands to simulate the melting and then set it out to let it to cool and harden.)
EXPLORE 1.Instruct students to look at the Rock Chart. Read and discuss each description. 2.Have each student select one rock from the samples. They should observe the rock with the hand lens to complete the activity sheet. 3.Students will need to place a few drops of vinegar on the rock with a dropper to test for an acid reaction. 4.Have students discuss their observations and conclusions. EXPLAIN Ask: How are igneous and metamorphic rocks alike? (may be formed from rocks that have been melted; rarely contain fossils) What forces can cause changes in rocks? (Rocks may be heated which causes them to melt; they may change under pressure; they may be transformed by wind and water.) How are igneous rocks formed? (They are formed when sedimentary, metamorphic, or other igneous rocks are melted.) How can igneous rocks become sedimentary rocks? (When igneous rocks are broken up by wind and/or water, they may eventually form sedimentary rocks.) How can metamorphic rocks become igneous rocks? (When metamorphic rocks are exposed to heat, they melt and harden into igneous rocks.) What causes a metamorphic rock to change into a sedimentary rock? (The sediment that forms when metamorphic rock is exposed to wind and/or water may over time become sedimentary rock.) How do igneous rocks change into metamorphic rocks? (Igneous rocks exposed to heat and pressure may eventually change into metamorphic rocks.) Have students add responses to their science notebook focused on the key question. Remind them to provide evidence from the labs or from research to support their claims. EXTEND AND APPLY Share books about rocks and discuss how people use rocks. Suggestions: Everybody Needs a Rock by Byrd Baylor Remarkable Rocks by Ron Cole, Ranger Rick ASSESSMENT Teacher observation and completion of student notebook entries. Evaluate science notebooks using the rubric.
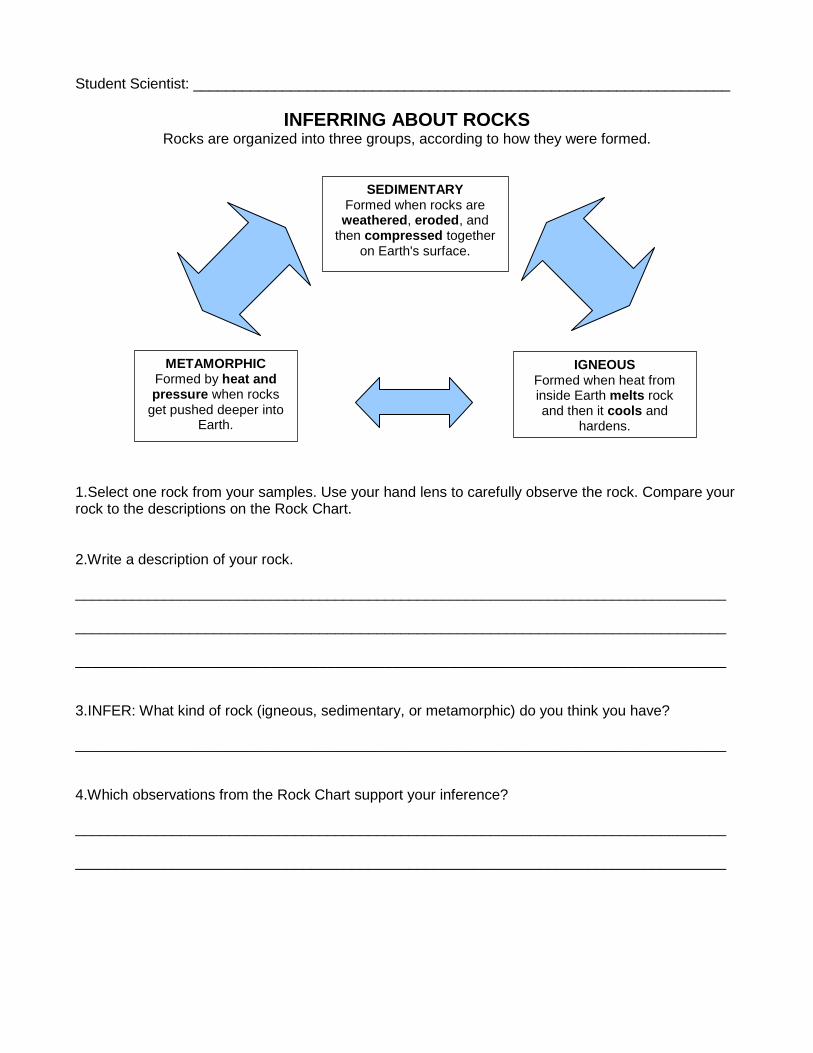
Student Scientist: __________________________________________________________________
INFERRING ABOUT ROCKS Rocks are organized into three groups, according to how they were formed.
1.Select one rock from your samples. Use your hand lens to carefully observe the rock. Compare your rock to the descriptions on the Rock Chart. 2.Write a description of your rock. ________________________________________________________________________________ ________________________________________________________________________________ ________________________________________________________________________________ 3.INFER: What kind of rock (igneous, sedimentary, or metamorphic) do you think you have? ________________________________________________________________________________ 4.Which observations from the Rock Chart support your inference? ________________________________________________________________________________ ________________________________________________________________________________
IGNEOUS Formed when heat from inside Earth melts rock and then it cools and
hardens.
METAMORPHIC Formed by heat and pressure when rocks
get pushed deeper into Earth.
SEDIMENTARY Formed when rocks are weathered, eroded, and
then compressed together on Earth's surface.

SCIENTIST:_________________ Date:____________ Title: The Rock Cycle
SC.4.E.6.1 Identify the three categories of rocks: igneous, (formed from molten rock); sedimentary (pieces of other rocks and fossilized organisms); and metamorphic (formed from heat and pressure). SC.4.N.1.1 Raise questions about the natural world, use appropriate reference materials that support understanding to obtain information (identifying the source), conduct both individual and team investigations through free exploration and systematic investigations, and generate appropriate explanations based on those explorations. SC.4.N.1.4 Attempt reasonable answers to scientific questions and cite evidence in support. SC.4.N.1.6 Keep records that describe observations made, carefully distinguishing actual observations from ideas and inferences about the observations. SC.4.N.1.7 Recognize and explain that scientists base their explanations on evidence. SC.4.N.3.1 Explain that models can be three dimensional, two dimensional, an explanation in your mind, or a computer model. . Problem Statement (10 POINTS): How does __________________________________________________________ affect____________________________________________________________? Materials: Per group dropper rock samples (3-5 of each type of rock) vinegar Per student 3 pieces of Starburst candy 1 hand lens “Inferring about Rocks” activity sheet Rock Chart student notebooks Procedure: In this activity you will use candy to demonstrate how rocks are formed.
1. Take three pieces of Starburst to represent different minerals. 2. Pretend that these minerals get eroded and deposited to a new location so that they are
layered on top of each other. What you have in your hand represents a sedimentary rock – formed by weathering and erosion on the surface of Earth.
3. Press your hands together firmly and squish the three layers together. Your “rock” has been pushed underground and is experiencing tremendous heat (body heat) and pressure (from your hands). You have just created a metamorphic rock, transformed underground by heat and pressure.
4. Make an igneous rock, which is formed by melting and cooling.

5. Place the candy in your mouth and chew. Now we are “melting” our rock. If we took the candy out, and let it cool and harden, we would have made an igneous rock.
6. Instruct students to look at the Rock Chart. Read and discuss each description. 7. Select one rock from the samples. They should observe the rock with the hand lens to
complete the activity sheet. 8. Students will need to place a few drops of vinegar on the rock with a dropper to test for an acid
reaction. 9. Have students discuss their observations and conclusions.
Observations (30 points): Draw how your minerals changed over time
Data (30 points): Inferring About Rocks Data Sheet
Analysis (30 points): 1. How are igneous and metamorphic rocks alike?
2. What forces can cause changes in rocks?
3. How are igneous rocks formed?
4. How can igneous rocks become sedimentary rocks?
5. How can metamorphic rocks become igneous rocks?
6. What causes a metamorphic rock to change into a sedimentary rock?
7. How do igneous rocks change into metamorphic rocks?
TOTAL POINTS:_______________
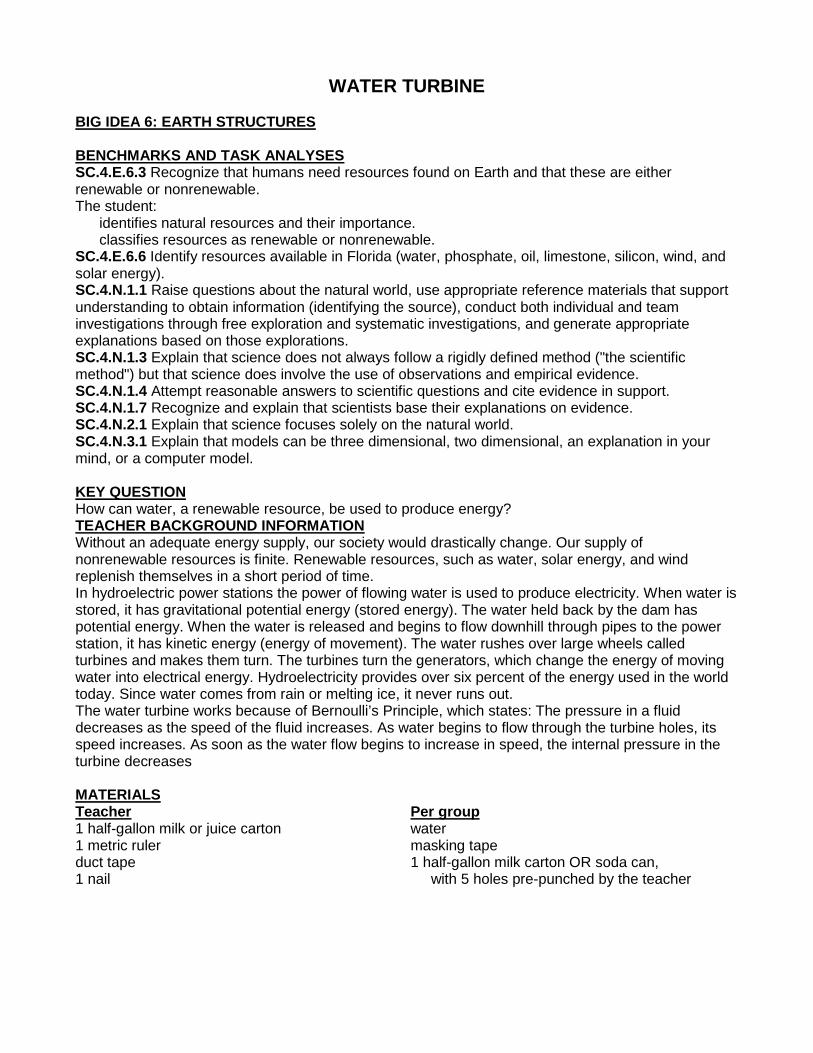
WATER TURBINE BIG IDEA 6: EARTH STRUCTURES BENCHMARKS AND TASK ANALYSES SC.4.E.6.3 Recognize that humans need resources found on Earth and that these are either renewable or nonrenewable. The student:
identifies natural resources and their importance. classifies resources as renewable or nonrenewable.
SC.4.E.6.6 Identify resources available in Florida (water, phosphate, oil, limestone, silicon, wind, and solar energy). SC.4.N.1.1 Raise questions about the natural world, use appropriate reference materials that support understanding to obtain information (identifying the source), conduct both individual and team investigations through free exploration and systematic investigations, and generate appropriate explanations based on those explorations. SC.4.N.1.3 Explain that science does not always follow a rigidly defined method ("the scientific method") but that science does involve the use of observations and empirical evidence. SC.4.N.1.4 Attempt reasonable answers to scientific questions and cite evidence in support. SC.4.N.1.7 Recognize and explain that scientists base their explanations on evidence. SC.4.N.2.1 Explain that science focuses solely on the natural world. SC.4.N.3.1 Explain that models can be three dimensional, two dimensional, an explanation in your mind, or a computer model. KEY QUESTION How can water, a renewable resource, be used to produce energy? TEACHER BACKGROUND INFORMATION Without an adequate energy supply, our society would drastically change. Our supply of nonrenewable resources is finite. Renewable resources, such as water, solar energy, and wind replenish themselves in a short period of time. In hydroelectric power stations the power of flowing water is used to produce electricity. When water is stored, it has gravitational potential energy (stored energy). The water held back by the dam has potential energy. When the water is released and begins to flow downhill through pipes to the power station, it has kinetic energy (energy of movement). The water rushes over large wheels called turbines and makes them turn. The turbines turn the generators, which change the energy of moving water into electrical energy. Hydroelectricity provides over six percent of the energy used in the world today. Since water comes from rain or melting ice, it never runs out. The water turbine works because of Bernoulli’s Principle, which states: The pressure in a fluid decreases as the speed of the fluid increases. As water begins to flow through the turbine holes, its speed increases. As soon as the water flow begins to increase in speed, the internal pressure in the turbine decreases MATERIALS Teacher Per group 1 half-gallon milk or juice carton water 1 metric ruler masking tape duct tape 1 half-gallon milk carton OR soda can, 1 nail with 5 holes pre-punched by the teacher

string scissors SAFETY Always follow DCPS science safety guidelines. Remind students to handle scissors with care. Students should not handle the nail. TEACHING TIPS 1.In advance, use a nail to punch three holes of the same size in a milk carton in a vertical line about 4 cm apart from the bottom of the container up the side to the top. Cover the holes with one long strip of tape. (See illustration in the Engage section.) 2.In advance, complete the first two steps of the milk carton preparation for each group:
8. Using the nail, punch a hole in the bottom right corner of each side of the milk carton. 9. Another hole should be punched in the middle of the top section of the carton.
ENGAGE 1.Take the class outdoors. Fill the milk carton with water, but keep the holes covered. Ask: After I remove the tape, from which hole will the water flow the farthest? 2.Discuss the students’ ideas. 3.Remove the tape and observe what happens. 4.Discuss: Which stream of water is shooting out the least? (the hole near the top of the can) Which stream of water is shooting out the farthest? (the hole on the bottom) Why does the water shoot out the farthest from the bottom hole? (The weight of the water and air above the opening is pressing down and making the water flow out the farthest. Water pressure increases with depth.) Ask students to write the key question in their science notebook and to discuss the question with their group. Then, have students write their preliminary thoughts in the notebook.

EXPLORE 1.Distribute the prepared milk cartons (see Teaching Tips) and string to the groups. 2.Fill the milk carton with water. 3.Have students thread the string through the top hole of the carton and tie it securely so the carton will hang from the string. 4.Tape over each hole with duct tape. 5.Go outside and hang the milk carton from a branch or other sturdy structure. 6.Remove the tape from one corner and watch what happens. 7.Remove the tape from all the corners and watch what happens! EXPLAIN What happened when you removed the tape from one hole? (The water poured out of the hole and pushed the carton in the opposite direction, making it turn.) What happened when you removed the tape from all the holes? (The more holes there were, the faster the carton turned.) How is this like a turbine? (Some turbines use water or steam that is forced at a high speed through many small holes to turn them around.) Is water a renewable or nonrenewable resource? Why? (Water is renewable because of the continuous water cycle.) Why is it more beneficial to use water rather than coal or oil to produce energy? (Many of our energy sources are nonrenewable [e.g., fossil fuels like coal and oil]. They cannot be replaced by nature as quickly as they are used so it is important that we use renewable energy sources when possible.) Why is it important to develop and use alternative energy sources, like water? (We are exhausting our energy resources at an alarming rate, so scientists must continue exploring alternative fuel sources that are efficient and affordable. Also, alternative energy sources are far less polluting than traditional fuels.) If energy is defined as the ability to do work and work is done every time a force is used to move something, was any work done? (The water was a force that caused the turbine to move, so work was done.) Have students add responses to their science notebook focused on the key question. Remind them to provide evidence from the labs or from research to support their claims. EXTEND AND APPLY
1. Explain to students that hydroelectricity provides over six percent of the energy used in the world today. Water is a renewable resource, because of the continuous water cycle and it never runs out.
2. Ask: Why is it important for our country to further develop alternative sources of energy? What renewable resources are readily available in Florida? Students should research to find out more about how alternative energy sources are being explored.
3. Give students picture cards of renewable and nonrenewable energy sources. Allow time to complete a picture sort. Require students to explain how they know why each picture is an example of a renewable or nonrenewable resource.
ASSESSMENT Teacher observation and completion of student notebook entries. Evaluate science notebooks using the rubric.

SCIENTIST:_________________ Date:____________ Title: Water Turbine
SC.4.E.6.3 Recognize that humans need resources found on Earth and that these are either renewable or nonrenewable. SC.4.E.6.6 Identify resources available in Florida (water, phosphate, oil, limestone, silicon, wind, and solar energy). SC.4.N.1.1 Raise questions about the natural world, use appropriate reference materials that support understanding to obtain information (identifying the source), conduct both individual and team investigations through free exploration and systematic investigations, and generate appropriate explanations based on those explorations. SC.4.N.1.3 Explain that science does not always follow a rigidly defined method ("the scientific method") but that science does involve the use of observations and empirical evidence. SC.4.N.1.4 Attempt reasonable answers to scientific questions and cite evidence in support. SC.4.N.1.7 Recognize and explain that scientists base their explanations on evidence. SC.4.N.2.1 Explain that science focuses solely on the natural world. SC.4.N.3.1 Explain that models can be three dimensional, two dimensional, an explanation in your mind, or a computer model. . Problem Statement (10 POINTS): How does __________________________________________________________ affect____________________________________________________________? Materials: Per group water masking tape 1 half-gallon milk carton OR soda can,with 5 holes pre-punched by the teacher string scissors Procedure: 1. Fill the milk carton with water. 2. Have students thread the string through the top hole of the carton and tie it securely so the carton will hang from the string. 3. Tape over each hole with duct tape. 4. Go outside and hang the milk carton from a branch or other sturdy structure. 5. Remove the tape from one corner and watch what happens. 6. Remove the tape from all the corners and watch what happens!
Observations (30 points): After I remove the tape, from which hole will the water flow the farthest? Shortest? Number diagram.
Data (30 points):

1. Which stream of water is shooting out the least?
2. Which stream of water is shooting out the farthest?
3. Why does the water shoot out the farthest from the bottom hole?
Analysis (30 points): 1. What happened when you removed the tape from one hole? All the holes?
2. How is this like a turbine?
3. Is water a renewable or nonrenewable resource? Why? 4. Why is it more beneficial to use water rather than coal or oil to produce energy?
5. Why is it important to develop and use alternative energy sources, like water? 6. If energy is defined as the ability to do work and work is done every time a force is used to move
something, was any work done?
7. How can water, a renewable resource, be used to produce energy
TOTAL POINTS:_______________

SOLAR POWER BIG IDEA 6: EARTH STRUCTURES
BENCHMARKS AND TASK ANALYSES SC.4.E.6.3 Recognize that humans need resources found on Earth and that these are either renewable or nonrenewable. The student:
identifies natural resources and their importance. classifies resources as renewable or nonrenewable.
SC.4.E.6.6 Identify resources available in Florida (water, phosphate, oil, limestone, silicon, wind, and solar energy). SC.4.N.1.1 Raise questions about the natural world, use appropriate reference materials that support understanding to obtain information (identifying the source), conduct both individual and team investigations through free exploration and systematic investigations, and generate appropriate explanations based on those explorations. SC.4.N.1.2 Compare the observations made by different groups using multiple tools and seek reasons to explain the differences across groups. SC.4.N.1.4 Attempt reasonable answers to scientific questions and cite evidence in support. SC.4.N.1.5 Compare the methods and results of investigations done by other classmates. SC.4.N.2.1 Explain that science focuses solely on the natural world. SC.4.N.3.1 Explain that models can be three dimensional, two dimensional, an explanation in your mind, or a computer model. KEY QUESTION How can we use the Sun as a renewable energy source? TEACHER BACKGROUND INFORMATION Natural resources are the raw materials we use for housing, clothing, transporting, heating, cooking, etc. They include the air we breathe, the water we drink, the land we farm, and the space we use for living. They are all the things we use in our physical environment to meet our needs and wants. Natural resources can be classified as renewable or nonrenewable. Renewable resources (e.g., water, solar energy, wind) are materials that can be replenished through natural and/or human processes. However, people sometimes use renewable resources in such a way that they disappear completely. Nonrenewable resources (e.g., fossil fuels) cannot be replenished. All fossil fuels, the energy source most commonly used today, started out as plants that got their energy from the sun. It took millions of years for the stored energy to be chemically changed to coal, petroleum, and natural gas, so fossil fuels are classified as nonrenewable. Solar energy will most likely be available far into the future, so we can think of it as being unending, a form of renewable energy. Solar energy doesn’t cause air pollution or involve damaging the earth’s surface, and it requires no difficult and expensive extraction procedures. Since we are exhausting our energy sources at such an alarming rate, solar energy is a source we need to explore and develop. Direct conversion of solar energy is being used in many parts of the world to heat water, dry crops, and to distill fresh water from impure water sources. The main problem with solar energy is what to do when the sun doesn’t shine. By careful design and positioning of houses, sunlight can be used to warm homes and domestic water. This will help to reduce fossil fuel use, but at this time, it’s not

enough to replace traditional fuels entirely. Sunlight can be concentrated by solar collectors. The collectors can focus sunlight from a large area onto a central vessel in which water is heated to become very high temperature steam. The expanding steam can power a turbine and generate electricity on a large scale. This activity gives students a chance to see how the direct heating of water by radiant heat from the sun is accomplished. The plastic trays act as solar collectors and are designed to increase the direct collection of energy from the sun. The ridge system in the tray helps to increase the surface area in the tray and keep the water closer to the top. The plastic lid prevents air flow, which would cool the water. The black trays increase the intensity of the energy collected. Students can explore the effect that two variables have on the amount of solar energy transferred to the water. A good absorber of radiant energy appears black because it absorbs rather than reflects light. A good absorber of radiant energy is also a good emitter (thermal equilibrium – all objects absorb as much energy as they emit.) A black pot of tea cools faster than a silver pot. Heat energy is transferred by: conduction (the transfer of energy from molecule to molecule – collisions between atoms or molecules), convection (movement of a hotter substance such as water heated in a boiler in a basement rising to warm the radiators upstairs), and radiation (the transmission of energy by electromagnetic waves). MATERIALSPer pair of students 1 black and 1 white t-shirt 2 thermometers Per group 2 black solar trays 2 white solar trays 2 solar tray covers 4 thermometers large container of water (a gallon milk jug works well) Solar Energy data sheet

SAFETY Always follow DCPS science safety guidelines. TEACHING TIPS 1.Locate an area outside in full sunlight for setting up the solar trays. 2.The trays will need to be left outside undisturbed on grass or soil (rather than concrete) for a period of time. 3.Set the jugs of water outside in the sun ahead of time so the water will be the same temperature as the outside air. ENGAGE 1.Have students pair with a partner. One should bring a light-colored t-shirt and one should bring a dark-colored t-shirt to class. 2.Tell the students to lay their shirts in a sunny area and to place a thermometer inside each shirt. 3.At set intervals, have students read the thermometer and record the temperature. 4.Discuss the results. Ask students to write the key question in their science notebook and to discuss the question with their group. Then, have students write their preliminary thoughts in the notebook. EXPLORE 1.Show the class the black and white solar trays and covers. Demonstrate pouring water into the trays only up to the fill line of the tray. 2.Pass the data sheets and have students predict the order of the solar collectors from most efficient to least efficient (to be determined by the final temperature of the water). 3.Distribute materials to students and move outside to the designated area. 4.Place the four thermometers in the bucket of water and record the temperatures after three minutes. (The thermometers should register approximately the same temperature.) Tell students that this will be the starting temperature for all the trays. Have students record the starting temperatures on the data sheets. 5.Direct each group to set out all four trays and pour water into them. Have students place a thermometer face up in each tray in such a way that it can be easily read. 6.Tell students to place a tray cover on one white tray and one black tray. Make sure the lids are securely sealed or this will affect the results. The other two trays should be left uncovered. 7.On the data sheets, have students record the time the trays were set up. 8.Return to the classroom and discuss the use of solar energy. 9.Return to the site approximately ½ hour later and have students record the time on the date sheet. 10.Have students record the temperature of the water in the two open trays first, followed by the two covered trays. 11.Students should pour out the water and return to the classroom with all materials. EXPLAIN 1.Have students order the four trays according to the temperature of the water. 2.Discuss: Which of the four trays resulted in the warmest water? Why do you think so? Which of the four trays resulted in the coolest water? Why do you think so? What factors may have influenced the temperature readings?
Grade 4, Big Idea 6 57 Dade County ETO Public Schools June 2011
How did the results compare with your predictions? What effect did the lid have on the temperature? (The lid prevents air flow and prevents the solar energy from escaping.) What effect did color have on the temperature? (Dark colors absorb radiant energy which causes an increase in temperature. Light colors act as reflectors and bounce light off.) How was the heat energy transferred? (The sun is a star and its energy was used to generate heat by radiation, the transmission of energy by electromagnetic waves.) How does this experiment relate to the t-shirt experiment you did earlier? What are the risks of continuing to rely on fossil fuels as our main energy sources? (Fossil fuels, such as coal and oil, are nonrenewable and in limited supply. It took millions of years for the fossil fuels to be formed, so they cannot be replaced by nature as quickly as they are used. Extracting fossil fuels requires difficult and expensive extraction procedures. Burning fossil fuels causes air pollution.) Why is it important to develop alternative energy sources, like solar energy? (We are exhausting our energy resources at an alarming rate, so scientists must continue exploring alternative fuel sources that are efficient and affordable. Also, alternative energy sources are far less polluting than traditional fuels.) What are some things we can do to help preserve our supply of energy? (car pool, develop alternative energy sources, reduce, reuse, recycle) Have students add responses to their science notebook focused on the key question. Remind them to provide evidence from the labs or from research to support their claims. EXTEND AND APPLY 1.Have students brainstorm about how their lives would be impacted if our nonrenewable energy sources were unavailable for use. How would life as they know it change? 2.Discuss why people choose light-colored cars as opposed to dark-colored cars. Which cars do you think would be cooler in the summer? (You might arrange ahead of time to take the students to the faculty parking lot and measure the inside temperatures of a light and dark-colored car at intervals throughout the school day. Caution students that this should only be done with adult supervision.) 3.Why are the tops of school buses in Florida painted white? Why did the Secretary of Energy state that Americans should paint their roofs white? 4. Give students a small solar panel, a fan, and an electric motor. Allow them time to decide how to make the motor work to make the fan blade turn by using the materials. ASSESSMENT Teacher observation and completion of student notebook entries. Evaluate science notebooks using the rubric.
Grade 4, Big Idea 6 58 Dade County ETO Public Schools June 2011

Student Scientist: ________________________________________________________________
SOLAR POWER
Beginning Time: Ending Time:
Solar Collector Beginning Temperature
Ending Temperature
Difference in Temperatures
White tray, uncovered
White tray, covered
Black tray, uncovered
Black tray, covered
In the first column, list the solar collectors from most effective to least effective, according to your prediction. In the second column, list the solar collectors in order of effectiveness based on the actual results.
Prediction Actual Results
Grade 4, Big Idea 6 59 Dade County ETO Public Schools June 2011
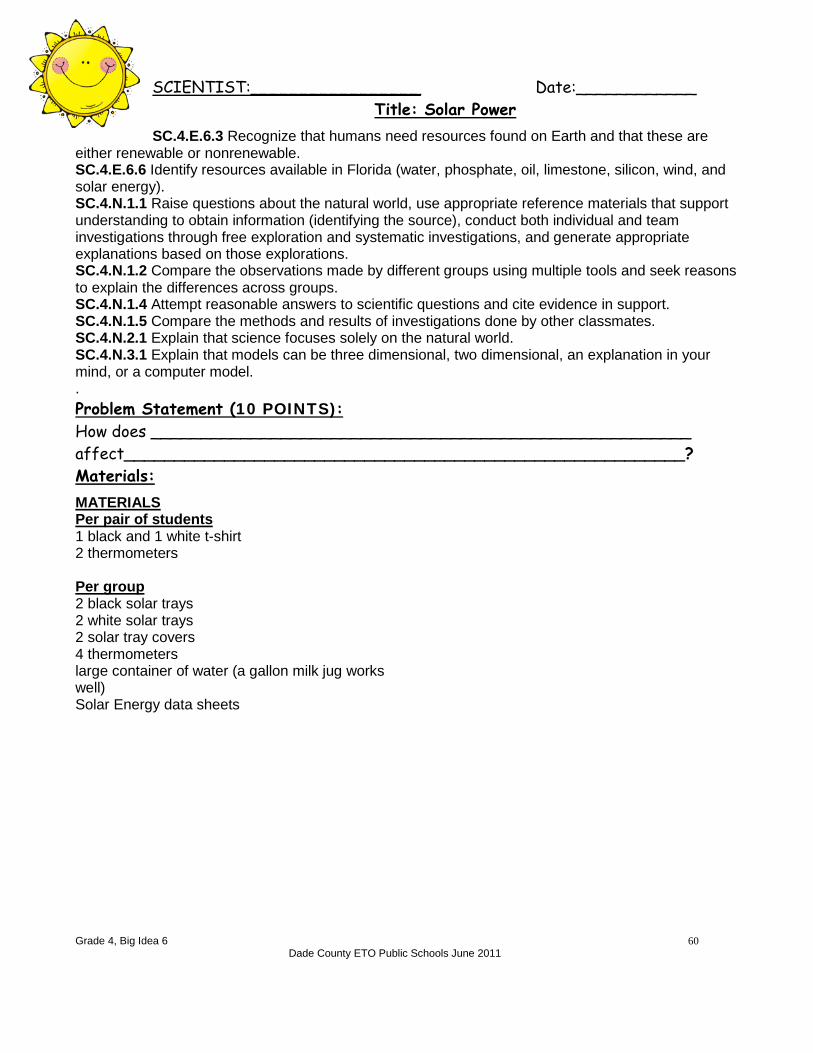
SCIENTIST:_________________ Date:____________ Title: Solar Power
SC.4.E.6.3 Recognize that humans need resources found on Earth and that these are either renewable or nonrenewable. SC.4.E.6.6 Identify resources available in Florida (water, phosphate, oil, limestone, silicon, wind, and solar energy). SC.4.N.1.1 Raise questions about the natural world, use appropriate reference materials that support understanding to obtain information (identifying the source), conduct both individual and team investigations through free exploration and systematic investigations, and generate appropriate explanations based on those explorations. SC.4.N.1.2 Compare the observations made by different groups using multiple tools and seek reasons to explain the differences across groups. SC.4.N.1.4 Attempt reasonable answers to scientific questions and cite evidence in support. SC.4.N.1.5 Compare the methods and results of investigations done by other classmates. SC.4.N.2.1 Explain that science focuses solely on the natural world. SC.4.N.3.1 Explain that models can be three dimensional, two dimensional, an explanation in your mind, or a computer model. . Problem Statement (10 POINTS): How does ______________________________________________________ affect________________________________________________________? Materials: MATERIALSPer pair of students 1 black and 1 white t-shirt 2 thermometers Per group 2 black solar trays 2 white solar trays 2 solar tray covers 4 thermometers large container of water (a gallon milk jug works well) Solar Energy data sheets
Grade 4, Big Idea 6 60 Dade County ETO Public Schools June 2011

Procedure: 1. Predict the order of the solar collectors from most efficient to least efficient (to be determined by the final temperature of the water). 2. Place the four thermometers in the bucket of water and record the temperatures after three minutes. (The thermometers should register approximately the same temperature.) 3. Have students record the starting temperatures on the data sheets. 4. Set out all four trays and pour water into them. 5. Place a thermometer face up in each tray in such a way that it can be easily read. 6.Place a tray cover on one white tray and one black tray. Make sure the lids are securely sealed or this will affect the results. The other two trays should be left uncovered. 7. On the data sheets, record the time the trays were set up. 8. Return to the classroom and discuss the use of solar energy. 9. Return to the site approximately ½ hour later record the time on the date sheet. 10. Record the temperature of the water in the two open trays first, followed by the two covered trays. 11.Pour out the water and return to the classroom with all materials. Observations (30 points): See Solar Power Data Sheet
Data (30 points): See Solar Power Data Sheet
Analysis (30 points):
• Which of the four trays resulted in the warmest water? Why do you think so?
• Which of the four trays resulted in the coolest water? Why do you think so?
• What factors may have influenced the temperature readings?
• How did the results compare with your predictions?
• What effect did the lid have on the temperature? What effect did color have on the temperature? How was the heat energy transferred?
• How does this experiment relate to the t-shirt experiment you did earlier?
• What are the risks of continuing to rely on fossil fuels as our main energy sources?
• Why is it important to develop alternative energy sources, like solar energy?
• What are some things we can do to help preserve our supply of energy?
• How can we use the Sun as a renewable energy source?
TOTAL POINTS:_______________

Weathering and Erosion BENCHMARKS AND TASK ANALYSES SC.4.E.6.4 Describe the basic differences between physical weathering (breaking down of rock by wind, water, ice, temperature change, and plants) and erosion (movement of rock by gravity, wind, water, and ice). The student:
investigates how physical weathering breaks down rock by wind, water, ice, temperature change, and plants to reshape the Earth’s surface.
investigates how erosion reshapes Earth’s surface by moving rock and soil from some areas and depositing them in other areas.
compares and contrasts physical weathering and erosion. SC.4.N.1.1 Raise questions about the natural world, use appropriate reference materials that support understanding to obtain information (identifying the source), conduct both individual and team investigations through free exploration and systematic investigations, and generate appropriate explanations based on those explorations. SC.4.N.1.2 Compare the observations made by different groups using multiple tools and seek reasons to explain the differences across groups. SC.4.N.1.4 Attempt reasonable answers to scientific questions and cite evidence in support. SC.4.N.1.7 Recognize and explain that scientists base their explanations on evidence. SC.4.N.3.1 Explain that models can be three dimensional, two dimensional, an explanation in your mind, or a computer model. Materials: Sand Water Large pans (i.e. lasagna) Small beakers Rulers Eye droppers Rain cup Safety goggles Popsicle sticks Drinking straws Baking soda Pebbles Vinegar Engage: Begin the lesson with a discussion about what the students have learned in Class regarding weathering and erosion. Do they have an understanding of the difference between the two processes? What examples can they think of for each, and what are some consequences of weathering and erosion? Exploration: In this laboratory, students rotate through three stations: Water Erosion, Chemical Weathering, and Wind Erosion. At the Water Erosion station, students investigate the effects of rainwater on an unsupported “sand mountain” vs. one supported by Popsicle sticks. At the Chemical Weathering station, students examine the weathering of “limestone rocks” (baking soda) by pure water followed by vinegar, representing acid rain. The relative stability of unprotected vs. protected substrate is tested at the Wind Erosion station, where students gently blow across “sand dunes” that are either bare or covered by pebbles. At each station, students are required to formulate a hypothesis prior to completing the activity. The specifics of each station are described in the attached worksheets. Explanation: Following the completion of all three stations, encourage the students to

participate in a discussion of their hypotheses and results. For each activity, what were they expecting to happen, and why? What were the results of their experiments? Can students identify the natural processes modeled at each station? Explain what the Popsicle sticks and pebbles represent—vegetation, rocks, man-made structures, etc.—and their importance in the natural environment. Elaboration: Encourage students to focus on the real-world applications of their laboratory experiments. What are the consequences of pollution, deforestation and development on the environment with regards to weathering and erosion? In their local environment, what are some examples of these processes or areas (i.e. sand dunes) that may be susceptible in the future? Conclude the laboratory by determining what actions may be taken to alleviate or prevent weathering and erosion. Evaluation: Students should be evaluated regarding their participation in classroom discussions, ability to work well with other members of their group, and by the completion of the laboratory handout. Specifically, students should be able to properly state and test a hypothesis, as well as draw conclusions for their results. Special Directions: “Limestone rocks” for the Chemical Weathering station should be made one day prior to teaching this lesson. To make these rocks, tightly pack baking soda into lumps using a minimal amount of water and dry overnight. The “rain cup” required for the Water Erosion station may be constructed by poking 5 small holes in the bottom of an eight-ounce Styrofoam cup.

Water Erosion Station Water erosion is the process by which water moves sand or soil from one location to another. Water erosion may greatly change the environment, especially if there is nothing to support the sand or soil. Procedures: 1. Make a “sand mountain” by piling sand up on one side of pan #1. This mountain should be 10 centimeters high (use the ruler). 2. Hold the ruler in the mountain so that the sand covers up to the 10 centimeter mark. 3. Hold the “rain cup” over your mountain and fill the cup with 250 mL of water. The water will now “rain” on your mountain. 4. After the rain has stopped, measure the height of the remaining sand and record that number below: _____________________ 5. Make a second mountain in pan #2 exactly like the first. 6. Using the Popsicle sticks, build a dam on the open side of the mountain. 7. Hypothesize what will happen when this new mountain is “rained” on by completing the following sentence. If the mountain is supported by a dam, then there will be (more / less) water erosion. (circle one) 8. Now “rain” on your new mountain and record the height below: ______________________ Was your hypothesis correct? _______________________

Chemical Weathering Station Chemical weathering is the process by which chemicals in water wear away the surface of the earth by reacting with rocks and minerals. At this station, you will test the effects of pure water and acidic water (vinegar) on limestone “rocks” (baking soda). Procedures: 1. Using a pipette, slowly add twenty (20) drops of water to the limestone rock in dish #1. Write down what you observe. ______________________________________________ ______________________________________________ ______________________________________________ 2. Hypothesize what will happen when you drop vinegar (“acid rain”) on the second limestone rock by completing the sentence below: If vinegar is added to the limestone, then the limestone will weather (more/ less) than when pure water was added. (circle one) because ______________________________________________ ______________________________________________ ______________________________________________ 3. Using a second pipette, slowly add twenty (20) drops of vinegar to the limestone rock in dish #2. Write down what you observe. ______________________________________________ ______________________________________________ ______________________________________________ Was your hypothesis correct? _______________________

Wind Erosion Station Wind erosion is the process by which wind moves sand or soil from one location to another. Wind erosion may greatly change the environment, especially if there is nothing to block its effects. Procedures: 1. Put on safety goggles. 2. Make a small pile of sand in the middle of the pan. 3. Using a straw, lightly blow over the sand. DO NOT blow so hard that sand leaves the pan! 4. Write down what you observe below: ______________________________________________ ______________________________________________ ______________________________________________ 5. Make a new pile of sand in the middle of the pan. 6. Place pebbles on the surface of the new hill, and hypothesize what will happen when you blow on the sand and pebbles by completing the following sentence: If pebbles are added to the surface of the sand, then (more / less) sand will blow away. (circle one) 7. Now lightly blow across the sand and pebbles. Write down what you observe below: ______________________________________________ ______________________________________________ ______________________________________________ Was your hypothesis correct? _______________________
TOTAL POINTS:___________

EROSION BIG IDEA 6: EARTH STRUCTURES BENCHMARKS AND TASK ANALYSES SC.4.E.6.4 Describe the basic differences between physical weathering (breaking down of rock by wind, water, ice, temperature change, and plants) and erosion (movement of rock by gravity, wind, water, and ice). The student:
investigates how physical weathering breaks down rock by wind, water, ice, temperature change, and plants to reshape the Earth’s surface.
investigates how erosion reshapes Earth’s surface by moving rock and soil from some areas and depositing them in other areas.
compares and contrasts physical weathering and erosion. SC.4.N.1.1 Raise questions about the natural world, use appropriate reference materials that support understanding to obtain information (identifying the source), conduct both individual and team investigations through free exploration and systematic investigations, and generate appropriate explanations based on those explorations. SC.4.N.1.2 Compare the observations made by different groups using multiple tools and seek reasons to explain the differences across groups. SC.4.N.1.4 Attempt reasonable answers to scientific questions and cite evidence in support. SC.4.N.1.7 Recognize and explain that scientists base their explanations on evidence. SC.4.N.3.1 Explain that models can be three dimensional, two dimensional, an explanation in your mind, or a computer model. KEY QUESTION How can water change the surface of Earth? TEACHER BACKGROUND INFORMATION Weathering and erosion are constantly changing the Earth’s surface. Weathering breaks rocks into smaller pieces which can be carried away through erosion. Erosion is the movement of small fragments of earth by moving water, wind, and glaciers. When moving water, ice, wind, or gravity drops a load of sediment in a new place, the process is called deposition. Running water is one of the main causes of erosion. It continually changes the Earth’s surfaces. One-fourth of the annual precipitation falling on the continents runs off into the ocean. Rivers carry rocks and soils, eroding the hills and mountains and carving out valley and canyons. MATERIALS Per group 1 cookie sheet/shallow pan/erosion table several craft sticks 1 Styrofoam cup grass or other vegetation (optional) masking tape markers or crayons 1 metric ruler mixture of dirt, clay, gravel, sand, and water in a 10 oz. cup 1 book (approx. 1-2 inches thick, covered to avoid damage) 1 metric measuring cup 200 mL water Teacher 1 sharp pencil or a pin for punching holes pictures of the Grand Canyon newspaper Erosion, Lola M. Schaefer, construction paper (1 sheet per student) Benchmark Education Co.

SAFETY Always follow DCPS science safety guidelines. TEACHING TIPS 1.Prepare a mixture of dirt, clay, gravel, sand, and water – enough so each group can have 10 oz. of the mixture. (The clay sticks together and is heavier than the other materials but eventually breaks up and will become part of the mixture.) 2.Each group should have 10 oz. of the mixture, moist enough to be molded easily. 3.Cover the work area with newspapers and/or work outside. ENGAGE Choose students to pick up certain items (e.g., books, chairs) in the classroom, carry them somewhere else in the room, and deposit them. Call on different students to do this several times. Use the terms, “pick up, carry, and deposit (put down),” since this is the terminology you will use when discussing how the earth is constantly changed by the movement of rocks and soil. Ask: How did we change the way our classroom looked? How is this similar to the way nature changes the way the earth looks? Have you ever built a sand castle at the beach? What happened to the sand castle after you built it? How did the sand castle change? What caused it to change? Ask students to write the key question in their science notebook and to discuss the question with their group. Then, have students write their preliminary thoughts in the notebook. EXPLORE 1.Cover tables with newspaper. Distribute materials to small groups. 2.Have each group turn the 10 oz. cup of soil mixture upside down in one end of the shallow pan and mold it to form a hill. Have students use the covered book to elevate the pan by placing it under the same end. 3.Show students how to fold a sheet of construction paper into three sections and label them Before Rain, First Rain, and Second Rain. Have students draw a “before” picture to illustrate the molded hill setup before continuing the activity. 4.Have students use a pin or a sharp pencil point to poke three holes in the bottom of a Styrofoam cup. (Caution them to use only the point, so that the holes are not too large.) Have students cover the holes with tape. 5.Instruct each group to fill the Styrofoam cup with 200 mL of water. Ask students to predict what will happen to the dirt when they hold the cup of water over the hill and remove the tape. 6.Tell students to hold the cup of water about 30 cm above the hill and pull the tape off so it rains on the hill. 7.In the second section of the construction paper, have students draw what the pan and the hill looked like after the “first rain.” 8.Tell students not to rebuild the hill, but to predict what will happen to the hill if there is a second rain. Once they have predicted, they should make it rain again. Ask students to draw the results in the third section of the construction paper. 9.Rebuild the hill, but this time cover the hill with grass, moss, or other vegetation and/or craft sticks to see how this affects erosion. Then repeat the same process as above. EXPLAIN Discuss erosion by asking:

What happened to the hill when it rained? Which particles were carried the farthest down stream? What is the process called when moving water, wind, or gravity drops a load of eroded sediment in a new place? (Explain to students that scientists call this process deposition.) What might help the dirt stay on the hill during the rain? How did vegetation affect the erosion? What would happen if it rained harder or for a longer period of time? What, besides moving water, might cause erosion? (wind, ice, gravity) Make a graphic organizer (T-chart) to compare and contrast weathering and erosion. Draw an illustration for each. Have students add responses to their science notebook focused on the key question. Remind them to provide evidence from the labs or from research to support their claims. EXTEND AND APPLY 1.Take students for a walk outside. Ask them to look for places where the results of water erosion can be seen (e.g., rain spouts, outdoor water faucets). Ask students what they think might have caused the erosion they observe and if anyone has any ideas how more erosion in that location might be avoided in the future. 2.Show pictures of the Grand Canyon and discuss how the Colorado River formed the canyon over a long period of time. 3.Share the book, Erosion. ASSESSMENT Teacher observation and completion of student notebook entries. Evaluate science notebooks using the rubric.

SCIENTIST:_________________ Date:____________ Title: Erosion
SC.4.E.6.4 Describe the basic differences between physical weathering (breaking down of rock by wind, water, ice, temperature change, and plants) and erosion (movement of rock by gravity, wind, water, and ice). SC.4.N.1.1 Raise questions about the natural world, use appropriate reference materials that support understanding to obtain information (identifying the source), conduct both individual and team investigations through free exploration and systematic investigations, and generate appropriate explanations based on those explorations. SC.4.N.1.2 Compare the observations made by different groups using multiple tools and seek reasons to explain the differences across groups. SC.4.N.1.4 Attempt reasonable answers to scientific questions and cite evidence in support. SC.4.N.1.7 Recognize and explain that scientists base their explanations on evidence. SC.4.N.3.1 Explain that models can be three dimensional, two dimensional, an explanation in your mind, or a computer model. . Problem Statement (10 POINTS): How does ______________________________________________________ affect________________________________________________________? Materials: Per group 1 cookie sheet/shallow pan/erosion table several craft sticks 1 Styrofoam cup grass or other vegetation (optional) masking tape markers or crayons 1 metric ruler mixture of dirt, clay, gravel, sand, and water in a 10 oz. cup 1 book (approx. 1-2 inches thick, covered to avoid damage) 1 metric measuring cup 200 mL water 1 sharp pencil or a pin for punching holes newspaper Procedure: 1. Cover tables with newspaper. Distribute materials to small groups. 2.Turn the 10 oz. cup of soil mixture upside down in one end of the shallow pan and mold it to form a hill. Have students use the covered book to elevate the pan by placing it under the same end. 3. Poke three holes in the bottom of a Styrofoam cup with pencil tip (Caution them to use only the point, so that the holes are not too large.) 4. Cover the holes with tape. 5. Fill the Styrofoam cup with 200 mL of water. 6. Predict what will happen to the dirt when they hold the cup of water over the hill and remove the tape. 7.Hold the cup of water about 30 cm above the hill and pull the tape off so it rains on the hill. 8. Illustrate what the pan and the hill looked like after the “first rain.” 9. Do not to rebuild the hill, but to predict what will happen to the hill if there is a second rain. 10. Make it rain again.

11. Draw the results in the third section.. 12. Rebuild the hill, but this time cover the hill with grass, moss, or other vegetation and/or craft sticks to see how this affects erosion. Then repeat the same process as above. Observations (30 points): What happened to the hill when it rained? Which particles were carried the farthest down stream? What is the process called when moving water, wind, or gravity drops a load of eroded sediment in a new place? What might help the dirt stay on the hill during the rain? How did vegetation affect the erosion? What would happen if it rained harder or for a longer period of time? What, besides moving water, might cause erosion?
Data (30 points):
W/out vegetation Before Rain First Rain Second Rain
W/vegetation
Before Rain First Rain Second Rain
Analysis (30 points): Make a graphic organizer (T-chart) to compare and contrast weathering and erosion. Draw an illustration for each.
TOTAL POINTS:_______________
TYPES OF PLANT REPRODUCTION (Teacher)
BIG IDEA 16: HEREDITY AND REPRODUCTION BENCHMARKS AND TASK ANALYSES SC.4.L.16.1 Identify processes of sexual reproduction in flowering plants, including pollination, fertilization (seed production), seed dispersal, and germination. The student:
• Observes parts of flowering plants. • Observes the process of germination.
SC.4.L.16.4 Compare and contrast the major stages in the life cycles of Florida plants and animals, such as those that undergo incomplete and complete metamorphosis, and flowering and non-flowering seed-bearing plants. The student: • Recognizes the difference between flowering and non-flowering, seed-bearing plants. • Compares and contrasts Florida’s flowering (Loblolly Bay, hibiscus, azalea, sunflower) and
non-flowering, seed-bearing plants (pine tree). SC.4.N.1.1 Raise questions about the natural world, use appropriate reference materials that support understanding to obtain information (identifying the source), conduct both individual and team investigations through free exploration and systematic investigations, and generate appropriate explanations based on those explorations. SC.4.N.1.4 Attempt reasonable answers to scientific questions and cite evidence in support. KEY QUESTION How are various plants similar and how are they different? TEACHER BACKGROUND INFORMATION The flower is the reproductive part of a flowering plant. Most flowers have four main parts: the sepals, stamen, petals, and pistil. All flowers have the same basic function – to produce seeds in order to preserve the species. The colors, shapes, and scents of flowers all help the plant to reproduce itself. Plants need pollen for fertilization so flowers can make more seeds. Bees, wasps, birds, water, humans, and the wind carry the pollen from flower to flower. When an animal touches the pollen in a flower, it sticks to the animal. The next time the animal touches a flower, the pollen sticks to that flower. This is pollination. Other ways that plants reproduce: Some plants don't produce flowers and seeds. Plants such as ferns and mosses are called nonflowering plants and produce spores instead of seeds. Spores are microscopic specks of living material. Ferns produce their spores on the undersides of the leaves (fronds). They are the brown "spots" or "pads" on the bottom of the leaves. Some plants can grow from parts--a form of asexual or vegetative propagation. This process is sometimes called cloning because every new plant is exactly like the parent. One type of cloning uses cuttings--parts of plants that grow into new plants. Both stems and leaves can be used as cuttings. Another kind of cloning is grafting--the joining together of two plants into one. Other kinds of cloning use bulbs or tubers--underground parts that make new plants.

Additional information about Florida plants can be found at http://www.floridaplants.com/ and http://www.nsis.org/garden/ (This one has a fantastic list of plants to use for butterflies, caterpillars, and more.). MATERIALS Teacher/Class Per student Photographs of plants, if needed (see Teaching Tips) science notebook and pencil Access to plants (such as a school garden)
SAFETY Always follow science safety guidelines. Be aware of student allergies to pollen and insects. TEACHING TIPS
Create a garden on your school grounds so students can see plants growing both in the classroom and in a more natural environment. This garden can also be used for exploration of animal life cycles such as butterflies, dragonflies, and grasshoppers. Be sure to plant the following in your garden:
1. Various flowering plants (seed-producing), such as azalea, hibiscus, sunflower, and other native plants (these should help attract butterflies and provide for food for caterpillars).
2. Various non-flowering plants. (These are spore-producing plants, such as mosses and ferns. If these non-flowering plants are unavailable, you may want to show photographs.)
3. Various vegetables, if possible. These can be harvested and donated to a wild animal refuge or food kitchen.
Even though this unit is taught toward the end of the year, this lesson can be started earlier so students can observe changes in the garden throughout the year. The Florida Department of Agriculture has a “Florida Wildflower Coloring Book” that you can print and provide to students. The coloring book has clear pictures of flowers and their parts. http://www.florida-agriculture.com/pubs/pubform/pdf/Florida_Wildflower_Coloring_Book.pdf ENGAGE • Ask students to write the key question in their science notebook and to discuss the question
with their group. Then, have students write their preliminary thoughts in the notebook. • Allow students time to report out their thoughts in order to identify misconceptions and prior
knowledge to help guide the lesson. • Take students to the school garden and walk around observing plants. • Ask: What are similarities you notice between the plants? What are some differences? • Allow students to select two plants to draw in their science notebook. One of the plants
should be a flowering plant and one should be non-flowering. Students can use their writing skills to describe their plants.
• While in the garden, lead a discussion of the differences between flowering and non-flowering plants.
• Throughout the year, at various intervals, take the students back to the garden and make updated observations.

EXPLORE
• Back in the classroom, ask: What do you know about plants? Create a thinking map similar to the example below to help organize information.
• Allow students to give many details about what they know about plants.
EXPLAIN Ask: Are all plants the same? (no)
What is a flowering plant? (a plant that has produces seeds through flowers) What is a non-flowering plant? (a plant that produces spores) What are some characteristics of plants? How do plants make more plants, or reproduce? (usually with seeds or spores) When plants reproduce, do the new plants look like the original plant? (usually, but there may be differences in flower color)
Have students add responses to their science notebook focused on the key question. Remind them to provide evidence from the labs or from research to support their claims. EXTEND AND APPLY
• Another option is for students to use a digital camera and take photographs of their plants as the year progresses. They can organize them in sequential order and write detailed descriptions of the plants in a student-created class book or in their science notebooks.
• Provide students with various seeds, but do not tell them what type of seeds. Allow them to plant the seeds in cups and watch them grow in the classroom. Students can compare and contrast their plants as they grow as well as keep observations in their science notebooks. Be sure to use the word germination to describe when the plants begin to grow.
ASSESSMENT
• Teacher observation and completion of student notebook entries. • Evaluate science notebooks using the rubric.

SCIENTIST: _________________ Date: ____________ Title: TYPES OF PLANT REPRODUCTION
Benchmarks: SC.4.L.16.1 Identify processes of sexual reproduction in flowering plants, including pollination, fertilization (seed production), seed dispersal, and germination. The student:
• Observes parts of flowering plants. • Observes the process of germination.
SC.4.L.16.4 Compare and contrast the major stages in the life cycles of Florida plants and animals, such as those that undergo incomplete and complete metamorphosis, and flowering and non-flowering seed-bearing plants. The student:
• Recognizes the difference between flowering and non-flowering, seed-bearing plants.
• Compares and contrasts Florida’s flowering (Loblolly Bay, hibiscus, azalea, sunflower) and non-flowering, seed-bearing plants (pine tree).
SC.4.N.1.1 Raise questions about the natural world, use appropriate reference materials that support understanding to obtain information (identifying the source), conduct both individual and team investigations through free exploration and systematic investigations, and generate appropriate explanations based on those explorations. SC.4.N.1.4 Attempt reasonable answers to scientific questions and cite evidence in support Problem Statement (10 POINTS): How does ___________________________________________________________ affect_______________________________________________________________? Materials: Teacher/Class
1. photographs of plants, if needed 2. access to plants (such as a school garden)
Per student 1. science notebook and pencil
Procedure:
1. observe various plants around the school yard 2. draw your observations in your journal

3. using pictures given to you by your teacher identify which plants produce flowers; cones; spores
4. compare how these plants are similar and different Observations (30 points): Compare and contrast flowering and non-flowering plants How are various plants similar and how are they different?
Data (30 points): Illustrate your observations

Analysis (30 points):
1. Are all plants the same?
2. What is a flowering plant?
3. What is a non-flowering plant?
4. What are some characteristics of plants?
5. How do plants make more plants, or reproduce?
6. When plants reproduce, do the new plants look like the original plant?
TOTAL POINTS: _______________

Life Cycles: (Teacher Reference)
BIG IDEA 16: HEREDITY AND REPRODUCTION BENCHMARKS AND TASK ANALYSES SC.4.L.16.4 Compare and contrast the major stages in the life cycles of Florida plants and animals, such as those that undergo incomplete and complete metamorphosis, and flowering and non-flowering seed-bearing plants. The student:
• Recognizes the difference between complete and incomplete metamorphosis. • Compares and contrasts the life cycles of Florida animals that undergo complete
(butterfly and frog) and incomplete metamorphosis (dragonfly and grasshopper). SC.4.N.1.1 Raise questions about the natural world, use appropriate reference materials that support understanding to obtain information (identifying the source), conduct both individual and team investigations through free exploration and systematic investigations, and generate appropriate explanations based on those explorations. SC.4.N.1.4 Attempt reasonable answers to scientific questions and cite evidence in support. SC.4.N.3.1 Explain that models can be three dimensional, two dimensional, an explanation in your mind, or a computer model. KEY QUESTION How are the life cycles of various Florida organisms similar and different? TEACHER BACKGROUND INFORMATION
Some organisms have life cycles where the young do not look like the adults. These organisms go through changes, called metamorphosis. Some organisms go through complete metamorphosis, where the organism often changes so much at each stage that they look like different animals. Many organisms that go though complete metamorphosis have four stages: egg, larvae, pupa, and adult. Amphibians go through complete metamorphosis that may not be similar to insects.
Other organisms go through incomplete metamorphosis. During incomplete metamorphosis, organisms go through three different life stages: egg, nymph, and adult. In most cases, the nymphs look similar to the adult, just smaller. As the nymph grows, it changes and then often grows wings when it changes into the adult. Some organisms that live in the water for the nymph stage of their life are dragonflies and caddisflies. Scientifically, nymphs that live in the water are called naiads.
MATERIALS Class Per student Poster of butterfly life cycle science notebook SAFETY Always follow science safety guidelines. TEACHING TIPS Students should have previously had experiences with butterflies and already partially understand metamorphosis. If not, you may want to complete a review lesson.
ENGAGE
1. Ask students to write the key question in their science notebook and to discuss the question with their group. Then, have students write their preliminary thoughts in the notebook.
2. Allow students time to report out their thoughts in order to identify misconceptions and prior knowledge to help guide the lesson.
3. Show the poster of the butterfly life cycle. Ask: What do you know about butterfly life cycles?
4. Tell students that butterflies go through metamorphosis, they change as they grow. 5. Ask: Do you know any other organisms that go through metamorphosis? What do you
know about them? 6. Tell students, butterflies go through complete metamorphosis. This means that they go
through four separate stages and they look different at each stage. 7. Ask: What are the life stages of the butterfly? (egg, larva, pupa, adult) 8. Tell students that in complete metamorphosis, organisms go through those four stages:
egg, larva, pupa, adult. EXPLORE
1. Give each student a card. Tell students that they are going to find all of the cards of the same organism and: a. Observe the stages of life. b. Decide if the organism goes through complete metamorphosis or not. c. Discuss with their group the similarities and differences between the stages of the
organism. 2. Allow each group to share their cards and the answer to the questions above with the
class.
EXPLAIN 1. Ask: What did you notice about the organisms? 2. Ask: Did all of them go through complete metamorphosis? (no, some only had 3 stages) 3. Tell students that those organisms that do not go through complete metamorphosis go
through incomplete metamorphosis. Ask: Which organisms go through incomplete metamorphosis? (newt, grasshopper, frog, dragonfly)
4. Ask: What were some of the other names of stages that these organisms go through? (nymph, tadpole)
5. Have students add responses to their science notebook focused on the key question. Remind them to provide evidence from the labs or from research to support their claims.
EXTEND AND APPLY Students should select two of the organisms and create a Venn Diagram comparing and contrasting the life cycles. ASSESSMENT: Teacher observation and completion of student notebook entries. Evaluate science notebooks using the rubric.

Scientist: ________________________ Date___________________ Title: LIFE CYCLES
Benchmarks: SC.4.L.16.4 Compare and contrast the major stages in the life cycles of Florida plants and animals, such as those that undergo incomplete and complete metamorphosis, and flowering and non-flowering seed-bearing plants. The student:
• Recognizes the difference between complete and incomplete metamorphosis. • Compares and contrasts the life cycles of Florida animals that undergo
complete (butterfly and frog) and incomplete metamorphosis (dragonfly and grasshopper).
SC.4.N.1.1 Raise questions about the natural world, use appropriate reference materials that support understanding to obtain information (identifying the source), conduct both individual and team investigations through free exploration and systematic investigations, and generate appropriate explanations based on those explorations. SC.4.N.1.4 Attempt reasonable answers to scientific questions and cite evidence in support. SC.4.N.3.1 Explain that models can be three dimensional, two dimensional, an explanation in your mind, or a computer model. Problem Statement (10 POINTS): How does____________________________________________________ affect________________________________________________________? Materials: Class Poster of butterfly life cycle Per student Science notebook Procedure:
1. Each student receives a card. 2. Find all of the cards of the same organism and:
a. Observe the stages of life. b. Decide if the organism goes through complete metamorphosis or not. c. Discuss with their group the similarities and differences between the
stages of the organism. 3. Share your cards and the answer the questions with the class.

Observations (30 points):
1. What did you notice about the organisms?
2. Did all of them go through complete metamorphosis?
3. Which organisms go through incomplete metamorphosis?
4. What were some of the other names of stages that these organisms go through?
Data (30 points): Compare and contrast complete and incomplete metamorphous How are the life cycles of various Florida organisms similar and different?

Analysis (30 points): Explain the difference in complete and incomplete metamorphous
TOTAL POINTS:_______________

ENERGY FLOW THROUGH FOOD CHAINS (Teacher Reference)
BIG IDEA 17: INTERDEPENDENCE BENCHMARKS AND TASK ANALYSES SC.4.L.17.2 Explain that animals, including humans, cannot make their own food and that when animals eat plants or other animals, the energy stored in the food source is passed to them. The student:
• Explains that some source of energy is needed for all organisms to stay alive and grow. • Explains that energy stored in food is transferred to the animals (including humans) that
eat the food. SC.4.L.17.3 Trace the flow of energy from the Sun as it is transferred along the food chain through the producers to the consumers. The student:
• Recognizes the difference between consumers and producers. • Creates a model of a food chain to trace the flow of the energy from the Sun along the
food chain through the producers to the consumers. SC.4.N.1.1 Raise questions about the natural world, use appropriate reference materials that support understanding to obtain information (identifying the source), conduct both individual and team investigations through free exploration and systematic investigations, and generate appropriate explanations based on those explorations. SC.4.N.1.4 Attempt reasonable answers to scientific questions and cite evidence in support. SC.4.N.3.1 Explain that models can be three dimensional, two dimensional, an explanation in your mind, or a computer model. KEY QUESTION Where do we get the food that we eat? TEACHER BACKGROUND INFORMATION Living things need food to give them energy. Energy passes from one living thing to another through food chains. A food chain is a simple way to look at how animals depend upon their habitats and other animals to survive. Every food chain begins with the Sun. Green plants (producers) are responsible for making food that animals (consumers) eat. An animal that eats the plants is a primary consumer. A secondary consumer eats the primary consumer. This relationship is often referred to as a predator/prey relationship, where the predator is the hunter and the prey is the victim. Herbivores are animals, such as deer, that feed only on plants. Carnivores are animals, such as wolves, that feed on other animals. Omnivores are animals, such as raccoons, that feed on both plants and other animals. Decomposers are organisms, such as bacteria, which break down dead organisms and waste, returning important nutrients to the earth. Food is just one of the things that living creatures need in order to survive. There are other necessities, called components of habitat that animals require for survival. These other components include water, shelter, and space. Without a sufficient amount of each of the four components, an animal may not survive long enough to reproduce and maintain the population.

MATERIALS Teacher Per pair of students Reference material on animals 1 paper plate (Sun) 25-40 pictures of various animals pictured string in their habitats in a paper bag index cards hole punch crayons or markers
glue or tape SAFETY Always follow science safety guidelines. TEACHING TIPS
• Find 25-40 pictures of various animals (e.g., insects, carnivores, herbivores). Use your personal picture file, computer clip art, magazine pictures, etc. Place the pictures in a paper bag.
• Display books and magazines about the animals represented in the pictures.
ENGAGE
1. Ask students to write the key questions in their science notebook, to write any preliminary thoughts, and to discuss the key questions with a partner or their group.
2. Regroup and host a brief discussion on student current ideas to help identify misconceptions and preliminary knowledge.
EXPLORE
Initiate a grab bag activity. One student from each pair draws a picture of an animal out of the bag.
Student pairs should then work together to learn what kinds of foods the animal eats and whether or not it is prey for another animal.
Next, students should construct a food chain using the paper plate as the sun. Students should glue a plant/animal picture on each index card OR draw organisms if
needed for the food chain. The names of the animals or plants in the food chain should be written on the card as well as if the organism is a producer or consumer.
Once all cards are done, students should punch holes in the top and bottom of the cards and attach them together with the string showing their connection to the original energy source (Sun). An example would be: sun-grass-grasshopper-frog-snake. One link in the food chain needs to be the original picture drawn from the bag.
Allow time for each group to share the food chain they created. EXPLAIN
1. Ask: What is the primary source for all food chains? (Sun) 2. Ask: What might happen if sunlight couldn’t reach the Earth’s surface? 3. Ask: What might happen if all plant life were removed from Earth. (Organisms that eat
plants would slowly die off from starvation and from lack of oxygen.) 4. Ask: Were you able to discover a food chain that did not begin with a plant? Why? 5. Ask: Were there any animals in the food chains that eat only plants? (Explain that
animals that eat only plants are called herbivores.) 6. Ask: Were there any animals in the food chains that eat only other animals? (Explain
that animals that eat only other animals are called carnivores.)
SUN
PLANT
Grasshopper

7. Ask: Were there any animals in the food chains that eat both plants and animals? (Explain that animals that eat both plants and animals are called omnivores.)
8. Ask: What happens to dead organisms (plants and animals) that are not eaten? (Decomposers, such as bacteria, break them down and the nutrients are returned to the earth.)
9. Have students respond to the key questions in their notebook. Remind them to provide evidence for their conclusions.
EXTEND AND APPLY Have students try to combine several of their food chains to create a food web. ASSESSMENT Review notebook entries using the rubric.
Scientist: ________________________ Date________________ Title: ENERGY FLOW THROUGH FOOD CHAINS
Benchmarks: SC.4.L.17.2 Explain that animals, including humans, cannot make their own food and that when animals eat plants or other animals, the energy stored in the food source is passed to them. The student:
• Explains that some source of energy is needed for all organisms to stay alive and grow.
• Explains that energy stored in food is transferred to the animals (including humans) that eat the food.
SC.4.L.17.3 Trace the flow of energy from the Sun as it is transferred along the food chain through the producers to the consumers. The student:
• Recognizes the difference between consumers and producers. • Creates a model of a food chain to trace the flow of the energy from the Sun
along the food chain through the producers to the consumers. SC.4.N.1.1 Raise questions about the natural world, use appropriate reference materials that support understanding to obtain information (identifying the source), conduct both individual and team investigations through free exploration and systematic investigations, and generate appropriate explanations based on those explorations. SC.4.N.1.4 Attempt reasonable answers to scientific questions and cite evidence in support. SC.4.N.3.1 Explain that models can be three dimensional, two dimensional, an explanation in your mind, or a computer model. Problem Statement (10 POINTS): How does _____________________________________________________ affect________________________________________________________? Materials: Teacher
1. Reference material on animals 2. 25-40 pictures of various animals pictures in their habitats in a paper bag 3. Hole punch
Per pair of students
1. 1 paper plate (Sun) 2. String 3. Glue or tape 4. Crayons or markers 5. Index cards

Procedure: 1. One student from each pair draws a picture of an animal out of the bag. 2. Student pairs work together to learn what kinds of foods the animal eats and
whether or not it is prey for another animal. 3. Students construct a food chain using the paper plate as the sun. 4. Students glue a plant/animal picture on each index card OR draw organisms if
needed for the food chain. The names of the animals or plants in the food chain should be written on the card as well as if the organism is a producer or consumer.
5. Once all cards are done, punch holes in the top and bottom of the cards and attach them together with the string showing their connection to the original energy source (Sun). One link in the food chain needs to be the original picture drawn from the bag.
6. Each group to share the food chain they created. Observations (30 points): Draw a picture of your food chain

Data (30 points): Identify the following: Producers Consumers Analysis (30 points):
1. What is the primary source for all food chains?
2. What might happen if sunlight couldn’t reach the Earth’s surface?
3. What might happen if all plant life were removed from Earth?
4. Were you able to discover a food chain that did not begin with a plant? Why?
5. Were there any animals in the food chains that eat only plants?
6. Were there any animals in the food chains that eat only other animals?
7. Were there any animals in the food chains that eat both plants and animals?
8. What happens to dead organisms (plants and animals) that are not eaten?
TOTAL POINTS:_______________

PLANT AND ANIMAL INTERDEPENDENCE (Teacher Reference)
BIG IDEA 17: INTERDEPENDENCE BENCHMARKS AND TASK ANALYSES SC.4.L.17.2 Explain that animals, including humans, cannot make their own food and that when animals eat plants or other animals, the energy stored in the food source is passed to them. The student:
• Explains that some source of energy is needed for all organisms to stay alive and grow. • Explains that energy stored in food is transferred to the animals (including humans) that
eat the food. SC.4.L.17.3 Trace the flow of energy from the Sun as it is transferred along the food chain through the producers to the consumers. The student:
• Recognizes the difference between consumers and producers. • Creates a model of a food chain to trace the flow of the energy from the Sun along the
food chain through the producers to the consumers. SC.4.N.1.1 Raise questions about the natural world, use appropriate reference materials that support understanding to obtain information (identifying the source), conduct both individual and team investigations through free exploration and systematic investigations, and generate appropriate explanations based on those explorations. SC.4.N.1.4 Attempt reasonable answers to scientific questions and cite evidence in support. SC.4.N.3.1 Explain that models can be three dimensional, two dimensional, an explanation in your mind, or a computer model.
KEY QUESTION How are plants and animals dependent on each other? TEACHER BACKGROUND INFORMATION Food webs illustrate the interdependence of life forms in a community. The arrows in a food web always show the direction in which the energy flows. The Sun is also an important part of all food webs. Without the Sun, there would be no photosynthesis and no plants. The difference between a food web and a food chain is that food chains follow a single path as animals eat, whereas a food web follow multiple paths and show how plants and animals are interconnected by these paths. Animals are classified according to how they get their food. All green plants are producers because they manufacture their own food through the process of photosynthesis. Animals that eat plants are called primary consumers (or herbivores). Animals that eat primary consumers are called secondary consumers (or carnivores). Animals, including humans, that eat both producers and consumers, are called omnivores. The waste products and remains of dead animals and plants are returned to the soil, where the scavengers and decomposers complete the cycle so that it can begin again. Organisms that feed on the remains or wastes of other organisms are known as decomposers. Decomposers are always the final link in a food web. Food energy transfers in the food web but so do many poisonous substances. Poisons are not used for life processes, so most of the poison consumed is passed along to the next level consumer. All animals are bound together in a web of interdependency.

WHO'S WHO IN A FOOD CHAIN
MATERIALS Teacher/Class Pass the Energy, Please! Barbara Shaw McKinney, 1999, Dawn Publications SAFETY Always follow science safety guidelines. TEACHING TIPS This lesson focuses on food webs, which show how plants and animals are interdependent. The previous lesson on food chains helps introduce the concept of producers and consumers. Having pictures of the organisms available may also be helpful during the game. ENGAGE
• Ask students to write the key question in their science notebook, to write any preliminary thoughts, and to discuss the key question with a partner or their group.
• Regroup and host a brief discussion on student current ideas to help identify misconceptions and preliminary knowledge.
• Use a circle map to assess students’ prior knowledge about food webs. Ask students to share what they know about food webs.
• Write the words “producer” and “consumer” on the board.
SUN (the primary source of energy)
PRIMARY CONSUMER (Animal that eats plants)
SECONDARY CONSUMER (Animal that eats animals)
PRODUCER (Green plant)

• Ask: If a producer is an organism that makes its own food, what is an example of a producer? (Help students understand that cooking food is not what we consider “making” food and instead the term refers to green plants that make their own food using the Sun's energy.)
• Ask: If a consumer is an organism that has to eat other organisms in order to survive, what is an example of a consumer? (everything except green plants)
• Tell students that they are going to explore the relationships between organisms in a food web and identify organisms as either consumers or producers.
EXPLORE
• On the board, write the names of various plants and animals, such as mouse, corn, fox, hawk, cow, grass, insects, apples, humans, and Sun. Leave plenty of room for students to come to the board and draw arrows from organisms to others.
• Divide the class into two groups, A and B. • Have one member from group A draw a line from something that provides energy to
the plant or animal that uses the energy (e.g., from Sun to corn; corn uses the Sun’s energy for photosynthesis). Have them orally identify the organisms as producers or consumers.
• Have a member of Group B do the same. Each time a line is drawn, discuss the relationship briefly with the class.
• Continue letting members of each team alternate drawing lines until they cannot draw a line they can justify. The group that draws the last line wins. Each group may challenge the opposing group’s line. If the group can justify their reason, the line can stay.
• The game can be repeated for several rounds using other communities. EXPLAIN
1. When a round of the game is over, ask students to examine the food web they have constructed.
2. Ask: How is energy transferred from one component to another in a food web? 3. Ask: Where does the energy originate? (with the Sun) 4. Ask: What is the role of green plants in a food web? (Green plants use carbon
dioxide, water, and energy from the Sun to produce their own food for growth and maintenance.)
5. Ask: What would happen if one component of the web were to become extinct? 6. Ask: What other developments would occur if certain components in food webs
disappeared? 7. Ask: What are some factors that are harmful to food webs and possibly to humans? 8. Ask: What happens when a poisonous substance becomes part of the food web?
(Poisons are not used for life processes, so most of the poison consumed is passed along to the next level consumer.)
9. Have students respond to the key question in their science notebook.
EXTEND AND APPLY 1. Read Pass the Energy, Please! by Barbara Shaw McKinney. 2. Have each student draw a food chain or web, including humans, other animals, and
plants in their science notebook. Ask them to include labels of “producer” or “consumer.”
ASSESSMENT Review notebook entries according to the rubric.

SCIENTIST: _________________ Date: ____________ Title: PLANT AND ANIMAL INTERDEPENDENCE
Benchmarks: SC.4.L.17.2 Explain that animals, including humans, cannot make their own food and that when animals eat plants or other animals, the energy stored in the food source is passed to them. The student:
• Explains that some source of energy is needed for all organisms to stay alive and grow.
• Explains that energy stored in food is transferred to the animals (including humans) that eat the food.
SC.4.L.17.3 Trace the flow of energy from the Sun as it is transferred along the food chain through the producers to the consumers. The student:
• Recognizes the difference between consumers and producers. • Creates a model of a food chain to trace the flow of the energy from the Sun
along the food chain through the producers to the consumers. SC.4.N.1.1 Raise questions about the natural world, use appropriate reference materials that support understanding to obtain information (identifying the source), conduct both individual and team investigations through free exploration and systematic investigations, and generate appropriate explanations based on those explorations. SC.4.N.1.4 Attempt reasonable answers to scientific questions and cite evidence in support. SC.4.N.3.1 Explain that models can be three dimensional, two dimensional, an explanation in your mind, or a computer model.
Problem Statement (10 POINTS): How does _____________________________________________________ affect________________________________________________________? Materials: Pass the Energy, Please! Barbara Shaw McKinney, 1999, Dawn Publications Procedure:
1. Teacher, write the names of various plants and animals on the board, such as mouse, corn, fox, hawk, cow, grass, insects, apples, humans, and Sun.
2. Divide the class into two groups, A and B. 3. One member from group A draws a line from something that provides energy to
the plant or animal that uses the energy (e.g., from Sun to corn; corn uses the Sun’s energy for photosynthesis).
4. Student orally identifies the organisms as producers or consumers.

5. One member of Group B does the same. 6. Each time a line is drawn, class briefly discusses the relationship between the
organisms 7. Members of each team alternate drawing lines until they cannot draw a line they
can justify. 8. The group that draws the last line wins. 9. Each group may challenge the opposing group’s line. If the group can justify their
reason, the line can stay. 10. The game can be repeated for several rounds using other communities.
Observations (30 points): Describe how the energy was transferred in this food web Data (30 points): Draw a diagram showing how the energy was transferred.

Analysis (30 points):
1. How are plants and animals dependent on each other?
2. How is energy transferred from one component to another in a food web?
3. Where does the energy originate?
4. What is the role of green plants in a food web?
5. What would happen if one component of the web were to become extinct?
6. What other developments would occur if certain components in food webs disappeared?
7. What are some factors that are harmful to food webs and possibly to humans?
8. What happens when a poisonous substance becomes part of the food web?
TOTAL POINTS:_______________

PREDATOR AND PREY
(Teacher) BIG IDEA 17: INTERDEPENDENCE BENCHMARKS AND TASK ANALYSES SC.4.L.17.2 Explain that animals, including humans, cannot make their own food and that when animals eat plants or other animals, the energy stored in the food source is passed to them. The student:
• Explains that some source of energy is needed for all organisms to stay alive and grow. • Explains that energy stored in food is transferred to the animals (including humans) that
eat the food. SC.4.L.17.3 Trace the flow of energy from the Sun as it is transferred along the food chain through the producers to the consumers. The student:
• Recognizes the difference between consumers and producers. • Creates a model of a food chain to trace the flow of the energy from the Sun along the
food chain through the producers to the consumers. SC.4.L.16.3 Recognize that animal behaviors may be shaped by heredity and learning. SC.4.N.1.1 Raise questions about the natural world, use appropriate reference materials that support understanding to obtain information (identifying the source), conduct both individual and team investigations through free exploration and systematic investigations, and generate appropriate explanations based on those explorations. SC.4.N.1.4 Attempt reasonable answers to scientific questions and cite evidence in support. SC.4.N.3.1 Explain that models can be three dimensional, two dimensional, an explanation in your mind, or a computer model.
KEY QUESTION How does the relationship between predator and prey affect wildlife populations? BACKGROUND INFORMATION Living things need food to give them energy. Energy passes from one living thing to another through food chains. A food chain is a simple way to look at how animals depend upon their habitats and other animals to survive. Every food chain begins with the sun. Green plants (producers) are responsible for making food that animals (consumers) eat. An animal that eats the plants is a primary consumer. (A grasshopper is a good example.) A secondary consumer (such as a lizard) eats the primary consumer. This relationship is often referred to as a predator/prey relationship, where the predator is the hunter and the prey is the victim. Food is just one of the things that living creatures need in order to survive. There are other necessities, components of habitat, which animals require for survival. These other components include water, shelter, and space. Without a sufficient amount of each of the four components, an animal may not survive long enough to reproduce and maintain the population. An animal’s environment is often called its habitat. A habitat is the place where an animal finds its food, water, shelter, and space. Each habitat is capable of supporting a limited population of animals. The limit is set by the food, water, shelter, and space available. This limit is called the carrying capacity.
MATERIALS Per class
1. Flagging tape, ribbon strips, or construction paper strips (2 colors enough for the whole class)
2. 4 hula hoops (or yarn circles) placed on the field to mark temporary shelters 3. 3 chips per student for food tokens (or use paper squares) scattered on the field 4. Blue chips for water tokens (see Extend and Apply)
SAFETY Always follow science safety guidelines. Advise that students use caution and consideration when moving about during this activity. TEACHING TIP Locate a playing area for the activity and prepare the area before class. ENGAGE
• Ask students to write the key question in their science notebook, to write any preliminary thoughts, and to discuss the key question with a partner or their group.
• Regroup and host a brief discussion on student current ideas to help identify misconceptions and preliminary knowledge.
• Have students listen to this story and then write a response in their science notebooks:
o “You are a field mouse creeping around in the meadow. Your stomach is getting empty, so you start looking under leaves, crawling between branches and twigs, looking for food. Finally, you see a few good seeds a couple of feet away. Mmm! Do they look tasty! You look around to make sure there isn’t anything waiting to grab you and then you dash over to the seeds. You know better than to eat them right then and there, so you pick them up and start back home. Suddenly, a fox comes out of nowhere and the chase is on! You wonder, “What do I do now?” You need to decide quickly! What should you do?”
• Have students share some of their responses. Discuss the merits of different decisions.
EXPLORE
• Identify students as foxes or field mice. (There should be 1 fox for every 4-6 mice).
• Distribute flagging tape (1 color for foxes, a different color for mice). Have students tie the tape around their arms or heads (somewhere easily seen) to identify which animal they represent.
• Set up the playing field as follows:
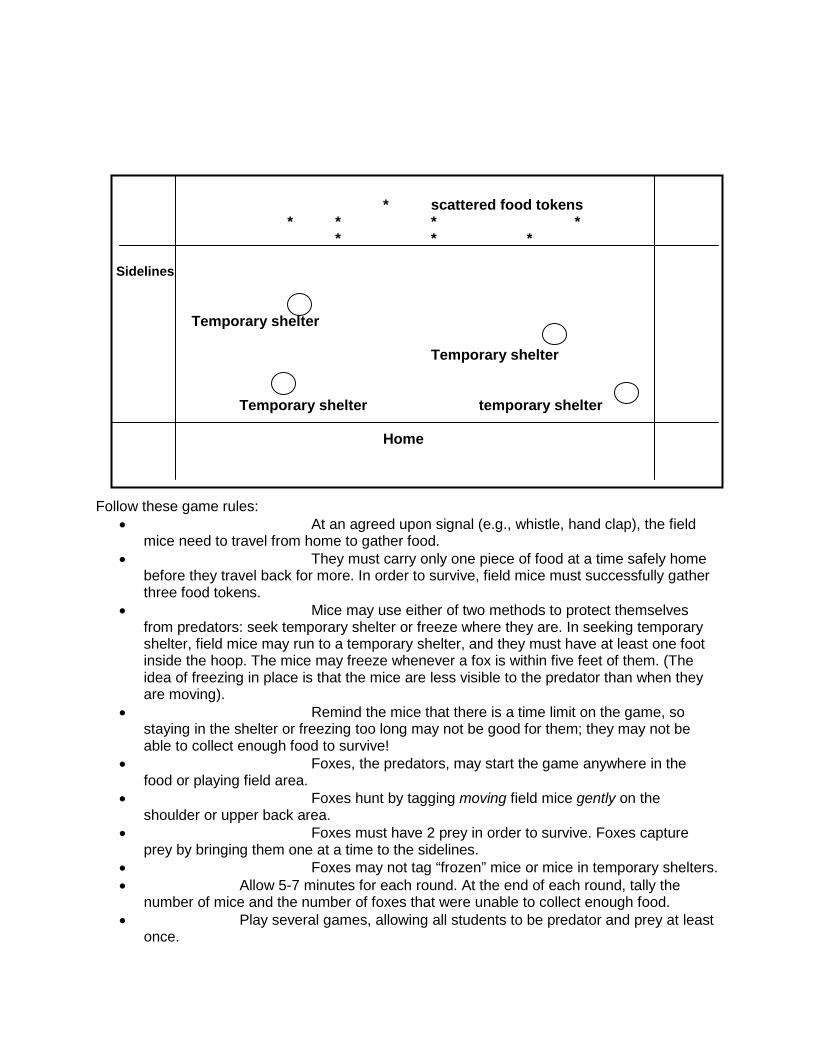
* scattered food tokens * * * *
* * *
Sidelines
Temporary shelter
Temporary shelter Temporary shelter temporary shelter
Home Follow these game rules:
• At an agreed upon signal (e.g., whistle, hand clap), the field mice need to travel from home to gather food.
• They must carry only one piece of food at a time safely home before they travel back for more. In order to survive, field mice must successfully gather three food tokens.
• Mice may use either of two methods to protect themselves from predators: seek temporary shelter or freeze where they are. In seeking temporary shelter, field mice may run to a temporary shelter, and they must have at least one foot inside the hoop. The mice may freeze whenever a fox is within five feet of them. (The idea of freezing in place is that the mice are less visible to the predator than when they are moving).
• Remind the mice that there is a time limit on the game, so staying in the shelter or freezing too long may not be good for them; they may not be able to collect enough food to survive!
• Foxes, the predators, may start the game anywhere in the food or playing field area.
• Foxes hunt by tagging moving field mice gently on the shoulder or upper back area.
• Foxes must have 2 prey in order to survive. Foxes capture prey by bringing them one at a time to the sidelines.
• Foxes may not tag “frozen” mice or mice in temporary shelters. • Allow 5-7 minutes for each round. At the end of each round, tally the
number of mice and the number of foxes that were unable to collect enough food. • Play several games, allowing all students to be predator and prey at least
once.

EXPLAIN
1. Lead a discussion of the simulation by asking questions such as: a. What is the difference between predators and prey? (The predator is the hunter
and the prey is the victim.) b. Can an animal be both predator and prey? (yes) c. Which animals were the preys in this game? (mice) d. Are mice ever predators? (Yes, they might eat ants or caterpillars.) e. Which animals were the predators in this game? (foxes) f. What other animals might be predators to mice? (snakes) g. Are foxes ever prey? (yes) What animals could we introduce to the game that
would be predators to the fox? (cougars or panthers) h. What methods did predators use to capture prey? i. Which escape methods were the most effective for the mice? j. Why do animals eat each other? (They need food for energy in order to survive.) k. How does this game simulate real life? l. What might eventually happen to the foxes and mice that did not get enough
food? (They might die or move to a new habitat where food was more plentiful.) 2. In their science notebook, have students draw a food chain including fox and mice. Ask
them to label consumers and producers. 3. Have students respond to the key question in their notebook. Remind them to provide
evidence for claims. EXTEND AND APPLY
1. Have students think of another predator/prey relationship. Ask students to describe the race for survival between the two animals in their science notebook. What behaviors could the prey use to survive? What behaviors would enable the predator to be successful?
2. Have students explain what would happen if we had an unexpected decrease in predators in a habitat. Use the fox and mice habitat as an example. If the foxes were not around to eat the mice, what results could you expect?
ASSESSMENT Assess science notebooks using the rubric.

Scientist: ______________________ Date:___________
Predator and Prey
BIG IDEA 17: INTERDEPENDENCE BENCHMARKS SC.4.L.17.2 Explain that animals, including humans, cannot make their own food and that when animals eat plants or other animals, the energy stored in the food source is passed to them. The student:
• Explains that some source of energy is needed for all organisms to stay alive and grow.
• Explains that energy stored in food is transferred to the animals (including humans) that eat the food.
SC.4.L.17.3 Trace the flow of energy from the Sun as it is transferred along the food chain through the producers to the consumers. The student:
• Recognizes the difference between consumers and producers. • Creates a model of a food chain to trace the flow of the energy from the Sun
along the food chain through the producers to the consumers. SC.4.L.16.3 Recognize that animal behaviors may be shaped by heredity and learning. SC.4.N.1.1 Raise questions about the natural world, use appropriate reference materials that support understanding to obtain information (identifying the source), conduct both individual and team investigations through free exploration and systematic investigations, and generate appropriate explanations based on those explorations. SC.4.N.1.4 Attempt reasonable answers to scientific questions and cite evidence in support. SC.4.N.3.1 Explain that models can be three dimensional, two dimensional, an explanation in your mind, or a computer model.
Problem Statement (10 POINTS): How does ___________________________________________________________ affect________________________________________________________?
Hypothesis (15 POINTS): If , then ____________________________________________________
Control (5 POINTS) Variable (5 POINTS)

Materials:
• flagging tape • ribbon strips • construction paper strips (2 colors enough for the whole class) • 4 hula hoops (or yarn circles) placed on the field to mark temporary shelters • 3 chips per student for food tokens (or use paper squares) scattered on the field • blue chips for water tokens
SAFETY Always follow science safety guidelines. Advise that students use caution and consideration when moving about during this activity. Procedures:
Follow these game rules: 1. At an agreed upon signal (e.g., whistle, hand clap), the field mice need to travel
from home to gather food. 2. Mice must carry only one piece of food at a time safely home before they travel
back for more. In order to survive, field mice must successfully gather three food tokens.
3. Mice may use either of two methods to protect themselves from predators: seek temporary shelter or freeze where they are. In seeking temporary shelter, field mice may run to a temporary shelter, and they must have at least one foot inside the hoop. The mice may freeze whenever a fox is within five feet of them.
4. Foxes, the predators, may start the game anywhere in the food or playing field area.
5. Foxes hunt by tagging moving field mice gently on the shoulder or upper back area.
6. Foxes must have 2 preys in order to survive. Foxes capture prey by bringing them one at a time to the sidelines.
7. Foxes may not tag “frozen” mice or mice in temporary shelters. 8. Allow 5-7 minutes for each round. At the end of each round, tally the number of
mice and the number of foxes that were unable to collect enough food. 9. Play several games, allowing all students to be predator and prey at least once.
Data (20 POINTS): Predators
beginning # Predators # surviving
Prey Beginning #
Prey # surviving
Game1 Game 2 Game 3

Observations (30 points):Describe what happened in the Game:
1. What is the difference between predators and prey?
2. Can an animal be both predator and prey?
3. Which animals were the preys in this game?
4. Are mice ever predators?
5. Which animals were the predators in this game?
6. What other animals might be predators to mice?
7. Are foxes ever the prey?
8. What animals could we introduce to the game that would be predators to the fox?
9. What methods did predators use to capture prey?
10. Which escape methods were the most effective for the mice?
11. Why do animals eat each other?
12. How does this game simulate real life?
13. What might eventually happen to the foxes and mice that did not get enough food?
Conclusion (15 POINTS): To conclude, from this lab I learned that _____
TOTAL POINTS: ____________

APPENDIX

Student Name: ___________________________ Date: ________________
Grade 4 Essential Lab Quiz: What’s your Reaction time/ Gummy Bear La/ Rainbow Measuring Fun
Big Idea 1: The Practice of Science
1. Mr. Brown’s class did an experiment to see how fast bean seeds would sprout. Three groups planted seeds. After five days, the seeds planted by Groups 1 and 2 had sprouted. The seeds planted by
Group 3 had not. The table shows what each group did.
Group 1 Group 2 Group 3 Day 1 2 3 4 5 1 2 3 4 5 1 2 3 4 5 Water (5mL)
x x x x x x x x x x
Temperature (18C)
x x x x x x x x x x x x x x x
Light (8hrs)
x x x x x x x x x x x x x x x
What does the data show? A. Each group did the experiment in the same way. B. Each group did the experiment in a different way. C. Groups 1 and 2 watered their seeds; Group 3 did not. D. Groups 1 and 2 had better seeds than Group 3.
2. Correctly recording data is important. Which is the best reason for keeping careful records?
A. Recording data is part of the scientific method. B. The data prove to your teacher that you did the experiment. C. Recorded data can help you figure out why different students got different
results. D. The data can be changed if the experiment does not work out the way you
thought it would.

3. Shawna wanted to see if different objects fall at different speeds. She repeated his experiment three times. Her results were different each time. What should Shawna do?
A. Ask other students for advice. B. Throw out her data and use another student’s results. C. Redesign the experiment. D. Do the experiment several more times and carefully record her data.
4. Peter designed an experiment to grow bread mold at different temperatures. He repeated the experiment six times. Four of his six experiments had the same results. What can Peter do to figure out why his results were not all the same?
A. Review his data and notes for clues. B. Ask his teacher to explain why his results were different. C. Throw out the results that were different. D. Choose another experiment to do
5. Which correctly lists the order of steps scientists use to conduct investigations? A. observe, record, analyze, communicate B. record, communicate, observe, analyze C. analyze, observe, record, communicate D. analyze, communicate, observe, record
6. Dennis tested how fertilizer affects the growth of three different kinds of plants. He
used two of each kind of plant. One plant received fertilizer; the other did not. Each day he watered all of the plants but fertilized only half of them. He kept all of the plants in a sunny spot. After one month, all of the plants had grown. But Dennis could not remember which plants he had fertilized and which he had not.
What was missing from Dennis’s test? A. a conclusion B. the same kind of plant in each group C. carefully recorded data D. a sunny place for the plants to grow

7. The fastening material on sneakers, coats, and backpacks is made of strips of tiny hooks and loops. A magnified picture of this material is shown here.
The scientist who invented this fastener got his idea from something he saw in the woods. Which of these objects most likely gave him his idea? A. pebbles scattered along a trail B. the rough bark of a tree C. a squirrel’s bushy tail D. weed seeds that stuck to his socks
8. Shape memory metals “remember” their shape even after being bent out of shape. These materials were discovered by accident by a scientist studying different types of metal mixtures. What would be a useful application of such a material?
A. railroad tracks B. support beams in buildings C. eyeglass frames D. Doorknobs

Answers: 1. C 2. C 3. D 4. A 5. A 6. C 7. D 8. C

Student Name: ___________________________ Date: ________________ Grade 4 Essential Lab Quiz: Constellations/ Phases of the Moon/Shadows
SC.4.E.5.1- 4
1. Jose looked up at the night sky at 6pm and saw the Big Dipper low in the eastern sky. Three hours later, Jose looked up and noticed that the Big Dipper was almost directly over head. What caused the Big Dipper to appear to move across the sky? A. solar eclipse B. earth’s revolution around the Sun C. earth’s rotation on its axis D. stars rotation on its axis 2. Karen admired the beautiful full moon. Each night she looked at the night sky and was dismayed to see that the moon was getting smaller until it finally disappeared over the course of two weeks. How long will it be before Karen sees a full moon again? A. two weeks B. a month C. it will not reappear D. 28 days 3. A year on Earth is 365 days. Why is 365 days considered a year? A. Socratics decided this in B. The president decided this was Ancient Greece supposed to be a year C. This is the amount of time it D. This is the amount of time it takes the Earth to rotate on its axis takes Earth to revolve around the Sun 4. In the morning the Sun appears to rise in the eastern sky, and then travels across the sky to set in the west and disappear for the night. Why is this so? A. the earth is revolving around the sun B. the sun is revolving around the earth C. the sun is rotating on its axis D. the earth is rotating on its axis 5. What causes day and night? A. the earth’s tilt on its axis B. the earth’s rotation on its axis C. the sun’s rotation around the earth D. the moon’s rotation around the earth

Answers: 1. C 2. A 3. D 4. D 5. B

Student Name: ___________________________ Date: ________________ Grade 4 Essential Lab Quiz: Rocks and Minerals/ Rock Cycle
SC.4.E.6.2 / E.6.1 1. Sedimentary rocks are formed by: A. molten rocks erupting out of a volcano B. heat and pressure inside the earth C. layers of silt and fossils cemented together D. by the decomposing bodies of over time dinosaurs 2. Jamal collected some rocks on his vacation. He noticed that some of the rocks were very shiny and others were dull. What quality of rocks was he observing? A. cleavage B. luster C. hardness D. color 3. Rocks formed from molten rocks are called: A. Sedimentary B. Igneous C. metamorphic d. lava 4. Fossils are most often found in what kind of rocks? A. Sedimentary B. Igneous C. metamorphic D. lava 5. Jorge sat at his table with a collection of rocks. He decided to sort them by size. What are three other properties of rocks that Jorge can use to sort his rocks? A. color, luster, cleavage B. color, favorite shape, cleavage C. luster, favorite color, cleavage D. rockiness, color, luster

Answers: 1. C 2. B 3. D 4. A 5. A

Student Name: ___________________________ Date: ________________
Grade 4 Essential Lab Quiz: Water Turbine/ Solar Power SC.4.E.6.3
1. Fossil fuels are an example of: A. renewable resources B. Nonrenewable resource C. automobile resource D. Heavy metal resource 2. Solar energy is considered renewable energy because: A. we will never run out of sunlight B. we can run out of sunlight C. we will never run out of wind D. we will always have rain 3. There are many different natural resources found in Florida. Which of the following can be described as renewable? A. limestone B. Oil C. phosphate D. Water 4. A renewable resource is a resource that we will not run out of. Examples of Florida’s renewable resources are: A. Wind, solar, phosphate B. Oil, solar, water C. Wind, solar, water D. Oil, gas, water 5. Nonrenewable resources: A. will never run out B. have already run out C. are solar, water and land D. are limited and will eventually run out

Answers: 1. B 2. A 3. D 4. C 5. D
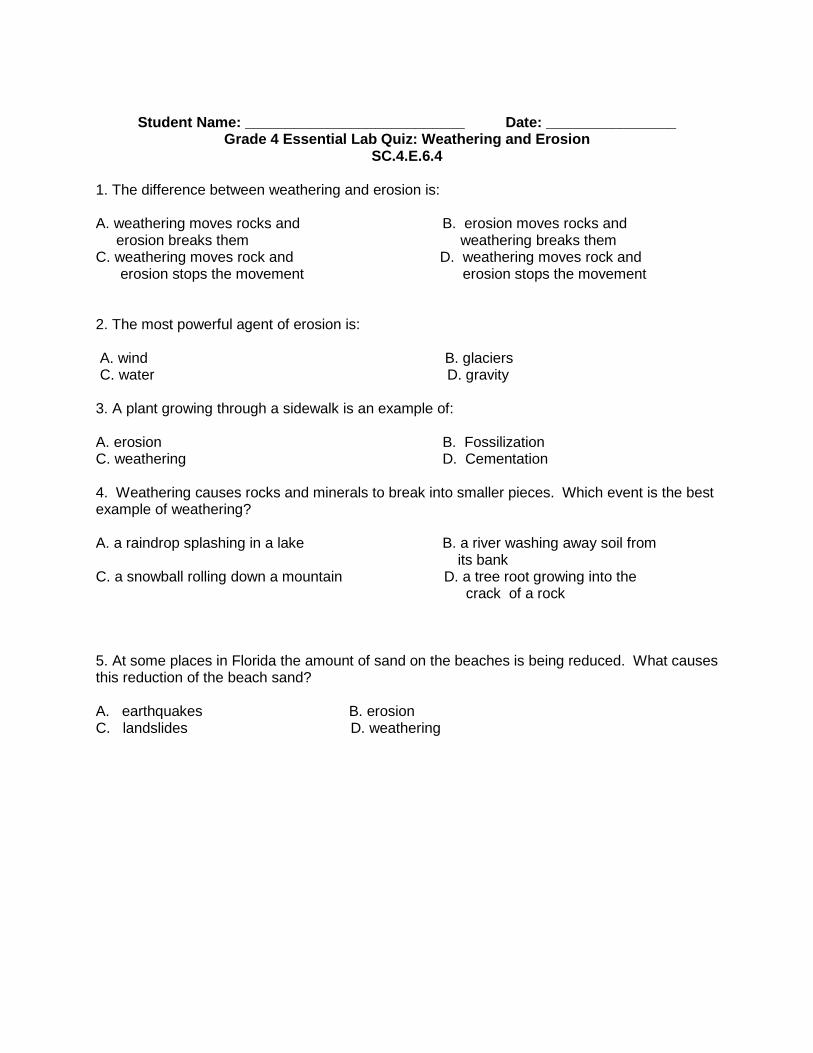
Student Name: ___________________________ Date: ________________
Grade 4 Essential Lab Quiz: Weathering and Erosion SC.4.E.6.4
1. The difference between weathering and erosion is: A. weathering moves rocks and B. erosion moves rocks and erosion breaks them weathering breaks them C. weathering moves rock and D. weathering moves rock and erosion stops the movement erosion stops the movement 2. The most powerful agent of erosion is: A. wind B. glaciers C. water D. gravity 3. A plant growing through a sidewalk is an example of: A. erosion B. Fossilization C. weathering D. Cementation 4. Weathering causes rocks and minerals to break into smaller pieces. Which event is the best example of weathering? A. a raindrop splashing in a lake B. a river washing away soil from its bank C. a snowball rolling down a mountain D. a tree root growing into the crack of a rock 5. At some places in Florida the amount of sand on the beaches is being reduced. What causes this reduction of the beach sand? A. earthquakes B. erosion C. landslides D. weathering

Answers: 1. B 2. C 3. C 4. D 5. B

Student Name: ___________________________ Date: ________________ Grade 4 Essential Lab Quiz: Types of Plant Reproduction/ Life Cycles
SC.4.L.16.4
1. The life cycle of a frog is: A. frog- tadpole- egg B. tadpole- egg- frog C. embryo-frog-egg D. egg- tadpole-frog 2. The life cycle of both butterflies and grasshoppers starts at the same stage. The pictures below show the life cycle of both organisms. Butterfly Life Cycle Grasshopper Life Cycle
Which of the following is the beginning stage of the life cycle for both the butterfly and the grasshopper?
A. egg B. larva C. nymph D. pupa 3. An example of a plant which does not reproduce by seeds is a: A. daisy B. apple tree C. fern D. pine tree 4. Plants that do not reproduce by seeds reproduce by A. spores B. pine cones C. fruit D. flowers 5. In the life cycle of a flowering plant , once the seed germinates it becomes a A. fruit B. seedling C. pine cone D. adult plant

Answers: 1. D 2. A 3. C 4. A 5. B

Student Name: ___________________________ Date: ________________ Grade 4 Essential Lab Quiz : Energy Flow through Food Chains/Plant and Animal
interdependence/ Predator and Prey SC.4.L.17.3
1. Plants get their energy from: A. the sun B. the soil C. fruit D. eating 2. In this food chain: Sun-Grass- mouse-snake- hawk Which organism is the producer? A. grass B. mouse C. snake D. hawk 3. A herbivore is an animal that: A. gets its energy from eating other animals B. gets its energy directly from the sun C. gets its energy from eating plants D. gets its energy from the soil 4. A carnivore is an animal that: A. gets its energy from eating other animals B. gets its energy directly from the sun C. gets its energy from eating plants D. gets its energy from the soil 5. An Omnivore is an animal that: A. eats only plants B. eats only animals C. does not need to eat because it D. eats both plants and animals produces its own food

Answers: 1. A 2. A 3. C 4. A 5. D