establish revenue increases or expenditure
TRANSCRIPT
NO
YES
NO
YES
NO
YES
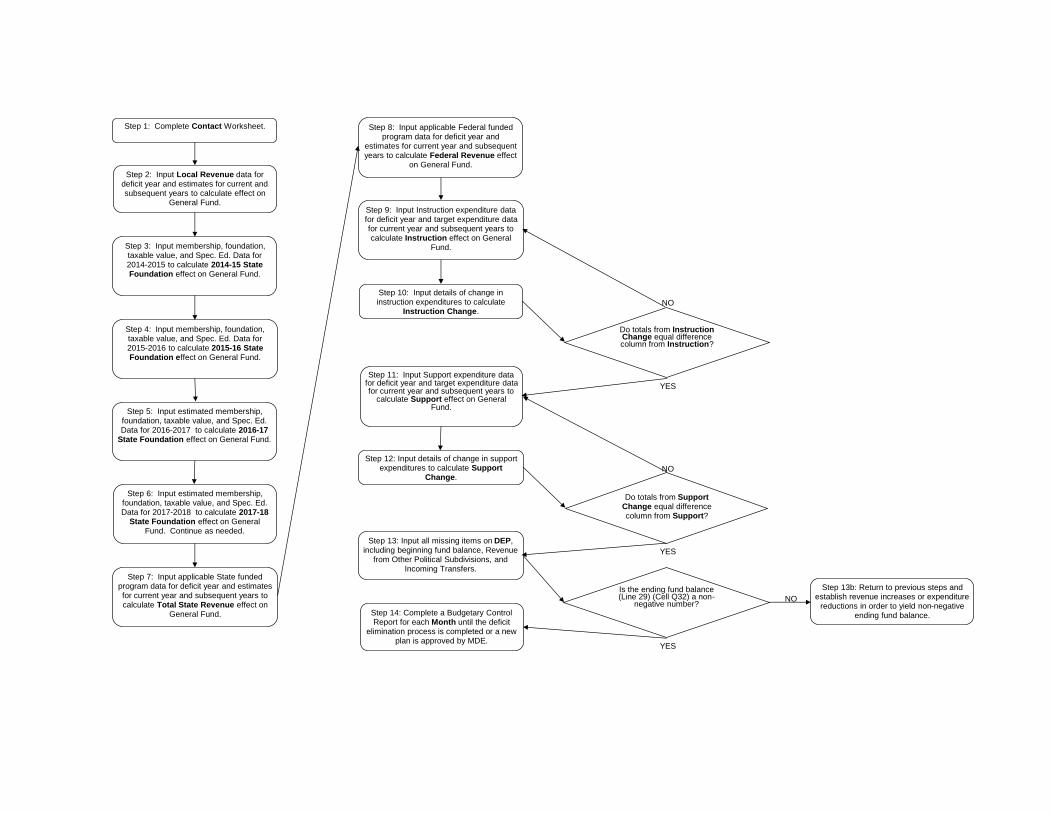
Step 1: Complete Contact Worksheet.
Step 2: Input Local Revenue data for deficit year and estimates for current and subsequent years to calculate effect on
General Fund.
Step 4: Input membership, foundation, taxable value, and Spec. Ed. Data for 2015-2016 to calculate 2015-16 State Foundation effect on General Fund.
Step 7: Input applicable State funded program data for deficit year and estimates for current year and subsequent years to calculate Total State Revenue effect on
General Fund.
Step 8: Input applicable Federal funded program data for deficit year and
estimates for current year and subsequent years to calculate Federal Revenue effect
on General Fund.
Step 9: Input Instruction expenditure data for deficit year and target expenditure data for current year and subsequent years to calculate Instruction effect on General
Fund.
Step 11: Input Support expenditure data for deficit year and target expenditure data for current year and subsequent years to
calculate Support effect on General Fund.
Step 10: Input details of change in instruction expenditures to calculate
Instruction Change.
Do totals from Instruction Change equal difference column from Instruction?
Step 12: Input details of change in support expenditures to calculate Support
Change.
Do totals from Support Change equal difference column from Support?
Step 13: Input all missing items on DEP, including beginning fund balance, Revenue
from Other Political Subdivisions, and Incoming Transfers.
Step 5: Input estimated membership, foundation, taxable value, and Spec. Ed. Data for 2016-2017 to calculate 2016-17
State Foundation effect on General Fund.
Is the ending fund balance (Line 29) (Cell Q32) a non-
negative number?
Step 13b: Return to previous steps and establish revenue increases or expenditure
reductions in order to yield non-negative ending fund balance.Step 14: Complete a Budgetary Control
Report for each Month until the deficit elimination process is completed or a new
plan is approved by MDE.
Step 3: Input membership, foundation, taxable value, and Spec. Ed. Data for 2014-2015 to calculate 2014-15 State Foundation effect on General Fund.
Step 6: Input estimated membership, foundation, taxable value, and Spec. Ed. Data for 2017-2018 to calculate 2017-18
State Foundation effect on General Fund. Continue as needed.

establish revenue increases or expenditure
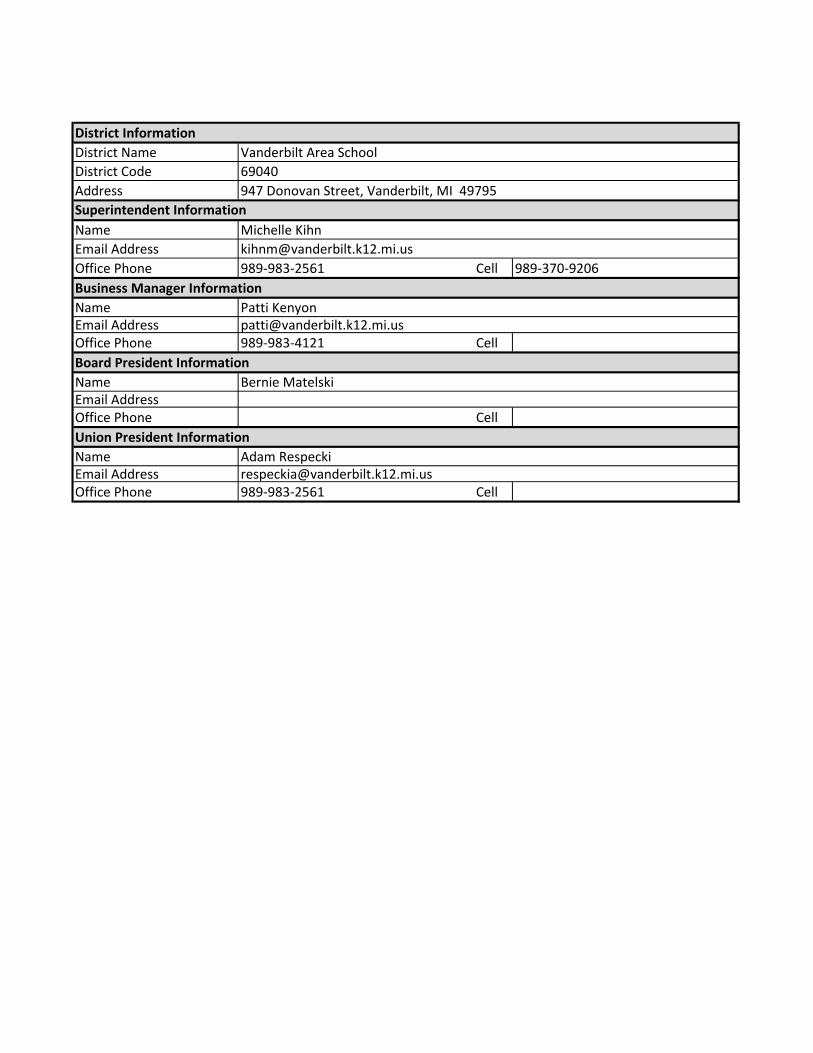
District Information
District Name Vanderbilt Area School
District Code 69040
Address 947 Donovan Street, Vanderbilt, MI 49795
Superintendent Information
Name Michelle Kihn
Email Address [email protected]
Office Phone 989-983-2561 Cell 989-370-9206
Business Manager Information
Name Patti KenyonEmail Address [email protected] Phone 989-983-4121 Cell
Board President Information
Name Bernie MatelskiEmail AddressOffice Phone Cell
Union President Information
Name Adam RespeckiEmail Address [email protected] Phone 989-983-2561 Cell
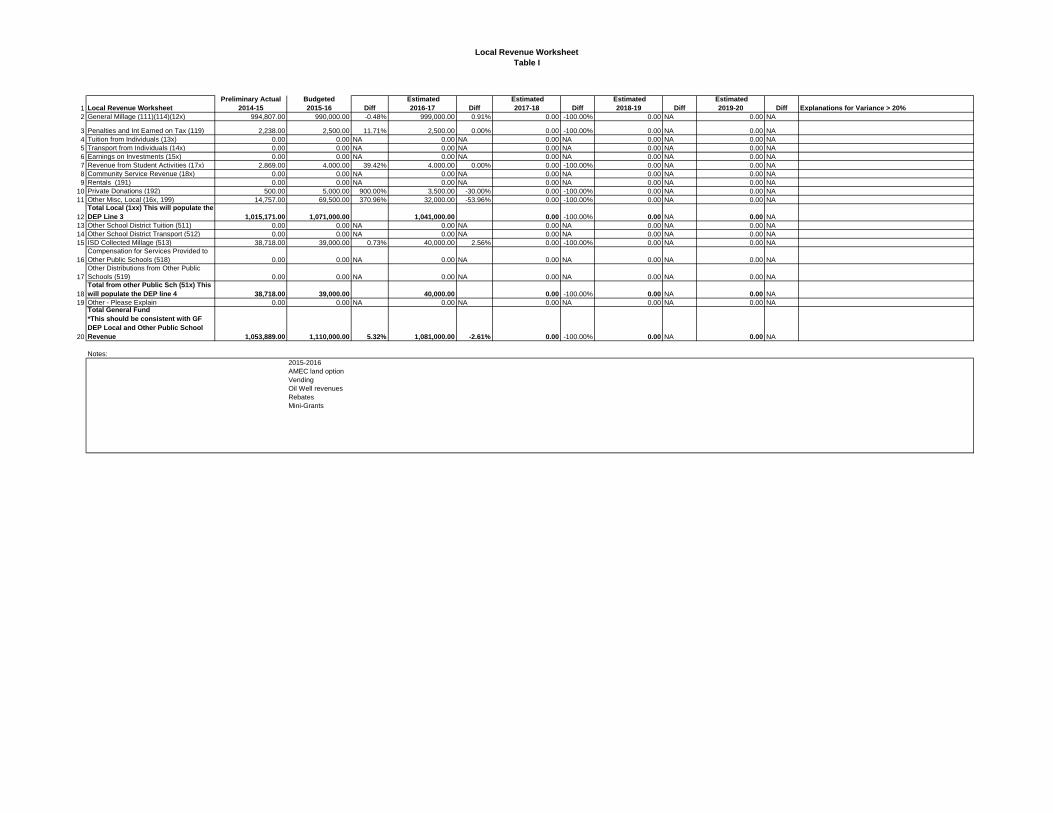
Local Revenue Worksheet
Table I
1 Local Revenue Worksheet
Preliminary Actual
2014-15
Budgeted
2015-16 Diff
Estimated
2016-17 Diff
Estimated
2017-18 Diff
Estimated
2018-19 Diff
Estimated
2019-20 Diff Explanations for Variance > 20%
2 General Millage (111)(114)(12x) 994,807.00 990,000.00 -0.48% 999,000.00 0.91% 0.00 -100.00% 0.00 NA 0.00 NA
3 Penalties and Int Earned on Tax (119) 2,238.00 2,500.00 11.71% 2,500.00 0.00% 0.00 -100.00% 0.00 NA 0.00 NA
4 Tuition from Individuals (13x) 0.00 0.00 NA 0.00 NA 0.00 NA 0.00 NA 0.00 NA
5 Transport from Individuals (14x) 0.00 0.00 NA 0.00 NA 0.00 NA 0.00 NA 0.00 NA
6 Earnings on Investments (15x) 0.00 0.00 NA 0.00 NA 0.00 NA 0.00 NA 0.00 NA
7 Revenue from Student Activities (17x) 2,869.00 4,000.00 39.42% 4,000.00 0.00% 0.00 -100.00% 0.00 NA 0.00 NA
8 Community Service Revenue (18x) 0.00 0.00 NA 0.00 NA 0.00 NA 0.00 NA 0.00 NA
9 Rentals (191) 0.00 0.00 NA 0.00 NA 0.00 NA 0.00 NA 0.00 NA
10 Private Donations (192) 500.00 5,000.00 900.00% 3,500.00 -30.00% 0.00 -100.00% 0.00 NA 0.00 NA
11 Other Misc, Local (16x, 199) 14,757.00 69,500.00 370.96% 32,000.00 -53.96% 0.00 -100.00% 0.00 NA 0.00 NA
12
Total Local (1xx) This will populate the
DEP Line 3 1,015,171.00 1,071,000.00 1,041,000.00 0.00 -100.00% 0.00 NA 0.00 NA
13 Other School District Tuition (511) 0.00 0.00 NA 0.00 NA 0.00 NA 0.00 NA 0.00 NA
14 Other School District Transport (512) 0.00 0.00 NA 0.00 NA 0.00 NA 0.00 NA 0.00 NA
15 ISD Collected Millage (513) 38,718.00 39,000.00 0.73% 40,000.00 2.56% 0.00 -100.00% 0.00 NA 0.00 NA
16
Compensation for Services Provided to
Other Public Schools (518) 0.00 0.00 NA 0.00 NA 0.00 NA 0.00 NA 0.00 NA
17
Other Distributions from Other Public
Schools (519) 0.00 0.00 NA 0.00 NA 0.00 NA 0.00 NA 0.00 NA
18
Total from other Public Sch (51x) This
will populate the DEP line 4 38,718.00 39,000.00 40,000.00 0.00 -100.00% 0.00 NA 0.00 NA
19 Other - Please Explain 0.00 0.00 NA 0.00 NA 0.00 NA 0.00 NA 0.00 NA
20
Total General Fund
*This should be consistent with GF
DEP Local and Other Public School
Revenue 1,053,889.00 1,110,000.00 5.32% 1,081,000.00 -2.61% 0.00 -100.00% 0.00 NA 0.00 NA
Notes:
2015-2016
AMEC land option
Vending
Oil Well revenues
Rebates
Mini-Grants
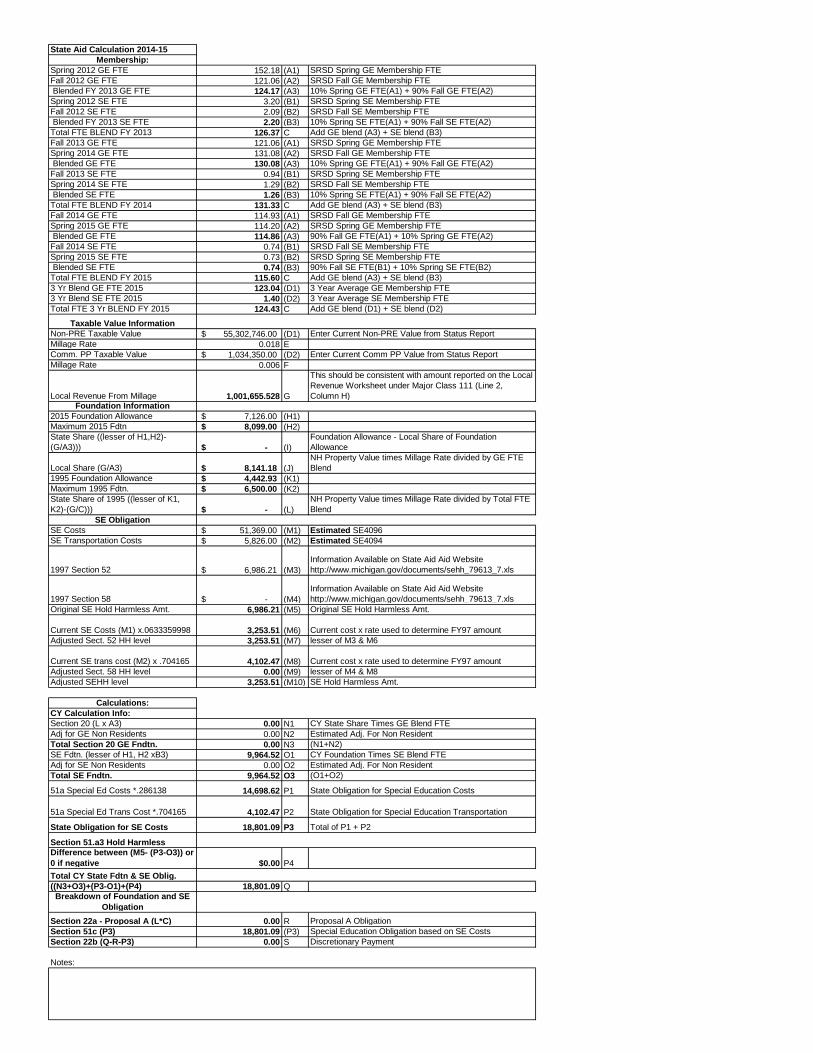
State Aid Calculation 2014-15
Membership:
Spring 2012 GE FTE 152.18 (A1) SRSD Spring GE Membership FTE
Fall 2012 GE FTE 121.06 (A2) SRSD Fall GE Membership FTE
Blended FY 2013 GE FTE 124.17 (A3) 10% Spring GE FTE(A1) + 90% Fall GE FTE(A2)
Spring 2012 SE FTE 3.20 (B1) SRSD Spring SE Membership FTE
Fall 2012 SE FTE 2.09 (B2) SRSD Fall SE Membership FTE
Blended FY 2013 SE FTE 2.20 (B3) 10% Spring SE FTE(A1) + 90% Fall SE FTE(A2)
Total FTE BLEND FY 2013 126.37 C Add GE blend (A3) + SE blend (B3)
Fall 2013 GE FTE 121.06 (A1) SRSD Spring GE Membership FTE
Spring 2014 GE FTE 131.08 (A2) SRSD Fall GE Membership FTE
Blended GE FTE 130.08 (A3) 10% Spring GE FTE(A1) + 90% Fall GE FTE(A2)
Fall 2013 SE FTE 0.94 (B1) SRSD Spring SE Membership FTE
Spring 2014 SE FTE 1.29 (B2) SRSD Fall SE Membership FTE
Blended SE FTE 1.26 (B3) 10% Spring SE FTE(A1) + 90% Fall SE FTE(A2)
Total FTE BLEND FY 2014 131.33 C Add GE blend (A3) + SE blend (B3)
Fall 2014 GE FTE 114.93 (A1) SRSD Fall GE Membership FTE
Spring 2015 GE FTE 114.20 (A2) SRSD Spring GE Membership FTE
Blended GE FTE 114.86 (A3) 90% Fall GE FTE(A1) + 10% Spring GE FTE(A2)
Fall 2014 SE FTE 0.74 (B1) SRSD Fall SE Membership FTE
Spring 2015 SE FTE 0.73 (B2) SRSD Spring SE Membership FTE
Blended SE FTE 0.74 (B3) 90% Fall SE FTE(B1) + 10% Spring SE FTE(B2)
Total FTE BLEND FY 2015 115.60 C Add GE blend (A3) + SE blend (B3)
3 Yr Blend GE FTE 2015 123.04 (D1) 3 Year Average GE Membership FTE
3 Yr Blend SE FTE 2015 1.40 (D2) 3 Year Average SE Membership FTE
Total FTE 3 Yr BLEND FY 2015 124.43 C Add GE blend (D1) + SE blend (D2)
Taxable Value Information
Non-PRE Taxable Value 55,302,746.00$ (D1) Enter Current Non-PRE Value from Status Report
Millage Rate 0.018 E
Comm. PP Taxable Value 1,034,350.00$ (D2) Enter Current Comm PP Value from Status Report
Millage Rate 0.006 F
Local Revenue From Millage 1,001,655.528 G
This should be consistent with amount reported on the Local
Revenue Worksheet under Major Class 111 (Line 2,
Column H)Foundation Information
2015 Foundation Allowance 7,126.00$ (H1)
Maximum 2015 Fdtn 8,099.00$ (H2)
State Share ((lesser of H1,H2)-
(G/A3))) -$ (I)
Foundation Allowance - Local Share of Foundation
Allowance
Local Share (G/A3) 8,141.18$ (J)
NH Property Value times Millage Rate divided by GE FTE
Blend
1995 Foundation Allowance 4,442.93$ (K1)
Maximum 1995 Fdtn. 6,500.00$ (K2)
State Share of 1995 ((lesser of K1,
K2)-(G/C))) -$ (L)
NH Property Value times Millage Rate divided by Total FTE
Blend
SE Obligation
SE Costs 51,369.00$ (M1) Estimated SE4096
SE Transportation Costs 5,826.00$ (M2) Estimated SE4094
1997 Section 52 6,986.21$ (M3)
Information Available on State Aid Aid Website
http://www.michigan.gov/documents/sehh_79613_7.xls
1997 Section 58 -$ (M4)
Information Available on State Aid Aid Website
http://www.michigan.gov/documents/sehh_79613_7.xls
Original SE Hold Harmless Amt. 6,986.21 (M5) Original SE Hold Harmless Amt.
Current SE Costs (M1) x.0633359998 3,253.51 (M6) Current cost x rate used to determine FY97 amount
Adjusted Sect. 52 HH level 3,253.51 (M7) lesser of M3 & M6
Current SE trans cost (M2) x .704165 4,102.47 (M8) Current cost x rate used to determine FY97 amount
Adjusted Sect. 58 HH level 0.00 (M9) lesser of M4 & M8
Adjusted SEHH level 3,253.51 (M10) SE Hold Harmless Amt.
Calculations:
CY Calculation Info:
Section 20 (L x A3) 0.00 N1 CY State Share Times GE Blend FTE
Adj for GE Non Residents 0.00 N2 Estimated Adj. For Non Resident
Total Section 20 GE Fndtn. 0.00 N3 (N1+N2)
SE Fdtn. (lesser of H1, H2 xB3) 9,964.52 O1 CY Foundation Times SE Blend FTE
Adj for SE Non Residents 0.00 O2 Estimated Adj. For Non Resident
Total SE Fndtn. 9,964.52 O3 (O1+O2)
51a Special Ed Costs *.286138 14,698.62 P1 State Obligation for Special Education Costs
51a Special Ed Trans Cost *.704165 4,102.47 P2 State Obligation for Special Education Transportation
State Obligation for SE Costs 18,801.09 P3 Total of P1 + P2
Section 51.a3 Hold Harmless
Difference between (M5- (P3-O3)) or
0 if negative $0.00 P4
Total CY State Fdtn & SE Oblig.
((N3+O3)+(P3-O1)+(P4) 18,801.09 QBreakdown of Foundation and SE
Obligation
Section 22a - Proposal A (L*C) 0.00 R Proposal A Obligation
Section 51c (P3) 18,801.09 (P3) Special Education Obligation based on SE Costs
Section 22b (Q-R-P3) 0.00 S Discretionary Payment
Notes:
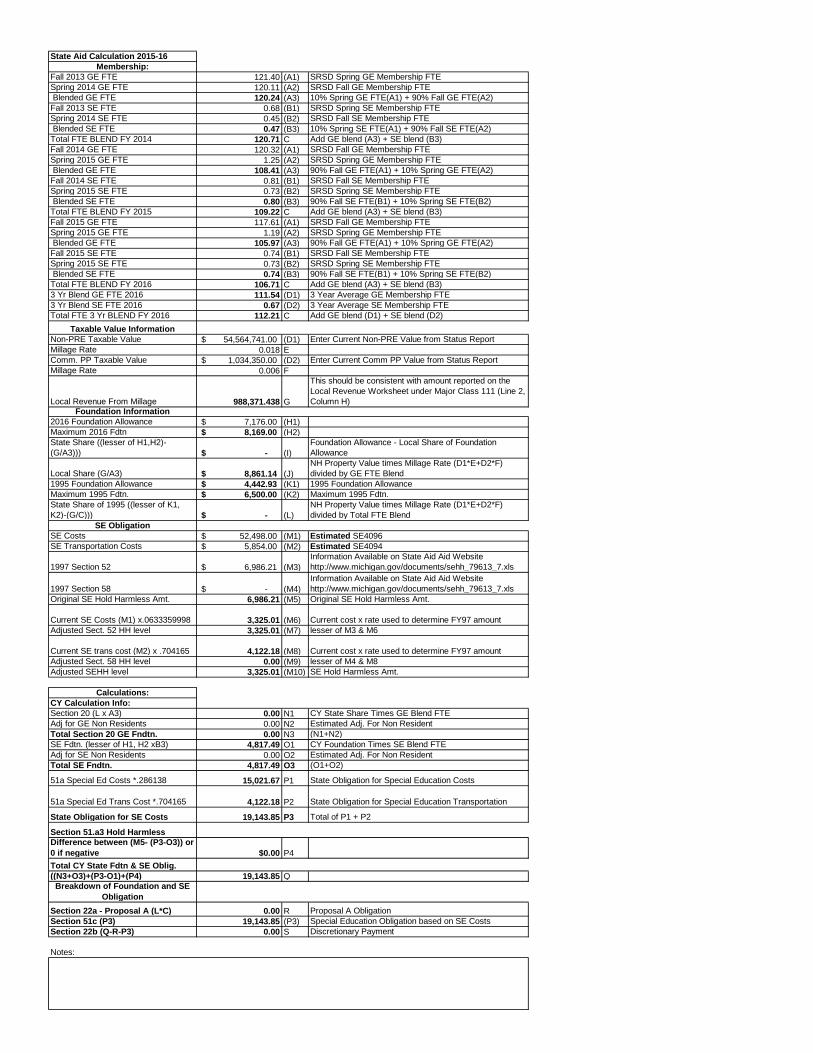
State Aid Calculation 2015-16
Membership:
Fall 2013 GE FTE 121.40 (A1) SRSD Spring GE Membership FTE
Spring 2014 GE FTE 120.11 (A2) SRSD Fall GE Membership FTE
Blended GE FTE 120.24 (A3) 10% Spring GE FTE(A1) + 90% Fall GE FTE(A2)
Fall 2013 SE FTE 0.68 (B1) SRSD Spring SE Membership FTE
Spring 2014 SE FTE 0.45 (B2) SRSD Fall SE Membership FTE
Blended SE FTE 0.47 (B3) 10% Spring SE FTE(A1) + 90% Fall SE FTE(A2)
Total FTE BLEND FY 2014 120.71 C Add GE blend (A3) + SE blend (B3)
Fall 2014 GE FTE 120.32 (A1) SRSD Fall GE Membership FTE
Spring 2015 GE FTE 1.25 (A2) SRSD Spring GE Membership FTE
Blended GE FTE 108.41 (A3) 90% Fall GE FTE(A1) + 10% Spring GE FTE(A2)
Fall 2014 SE FTE 0.81 (B1) SRSD Fall SE Membership FTE
Spring 2015 SE FTE 0.73 (B2) SRSD Spring SE Membership FTE
Blended SE FTE 0.80 (B3) 90% Fall SE FTE(B1) + 10% Spring SE FTE(B2)
Total FTE BLEND FY 2015 109.22 C Add GE blend (A3) + SE blend (B3)
Fall 2015 GE FTE 117.61 (A1) SRSD Fall GE Membership FTE
Spring 2015 GE FTE 1.19 (A2) SRSD Spring GE Membership FTE
Blended GE FTE 105.97 (A3) 90% Fall GE FTE(A1) + 10% Spring GE FTE(A2)
Fall 2015 SE FTE 0.74 (B1) SRSD Fall SE Membership FTE
Spring 2015 SE FTE 0.73 (B2) SRSD Spring SE Membership FTE
Blended SE FTE 0.74 (B3) 90% Fall SE FTE(B1) + 10% Spring SE FTE(B2)
Total FTE BLEND FY 2016 106.71 C Add GE blend (A3) + SE blend (B3)
3 Yr Blend GE FTE 2016 111.54 (D1) 3 Year Average GE Membership FTE
3 Yr Blend SE FTE 2016 0.67 (D2) 3 Year Average SE Membership FTE
Total FTE 3 Yr BLEND FY 2016 112.21 C Add GE blend (D1) + SE blend (D2)
Taxable Value Information
Non-PRE Taxable Value 54,564,741.00$ (D1) Enter Current Non-PRE Value from Status Report
Millage Rate 0.018 E
Comm. PP Taxable Value 1,034,350.00$ (D2) Enter Current Comm PP Value from Status Report
Millage Rate 0.006 F
Local Revenue From Millage 988,371.438 G
This should be consistent with amount reported on the
Local Revenue Worksheet under Major Class 111 (Line 2,
Column H)Foundation Information
2016 Foundation Allowance 7,176.00$ (H1)
Maximum 2016 Fdtn 8,169.00$ (H2)
State Share ((lesser of H1,H2)-
(G/A3))) -$ (I)
Foundation Allowance - Local Share of Foundation
Allowance
Local Share (G/A3) 8,861.14$ (J)
NH Property Value times Millage Rate (D1*E+D2*F)
divided by GE FTE Blend
1995 Foundation Allowance 4,442.93$ (K1) 1995 Foundation Allowance
Maximum 1995 Fdtn. 6,500.00$ (K2) Maximum 1995 Fdtn.
State Share of 1995 ((lesser of K1,
K2)-(G/C))) -$ (L)
NH Property Value times Millage Rate (D1*E+D2*F)
divided by Total FTE Blend
SE Obligation
SE Costs 52,498.00$ (M1) Estimated SE4096
SE Transportation Costs 5,854.00$ (M2) Estimated SE4094
1997 Section 52 6,986.21$ (M3)
Information Available on State Aid Aid Website
http://www.michigan.gov/documents/sehh_79613_7.xls
1997 Section 58 -$ (M4)
Information Available on State Aid Aid Website
http://www.michigan.gov/documents/sehh_79613_7.xls
Original SE Hold Harmless Amt. 6,986.21 (M5) Original SE Hold Harmless Amt.
Current SE Costs (M1) x.0633359998 3,325.01 (M6) Current cost x rate used to determine FY97 amount
Adjusted Sect. 52 HH level 3,325.01 (M7) lesser of M3 & M6
Current SE trans cost (M2) x .704165 4,122.18 (M8) Current cost x rate used to determine FY97 amount
Adjusted Sect. 58 HH level 0.00 (M9) lesser of M4 & M8
Adjusted SEHH level 3,325.01 (M10) SE Hold Harmless Amt.
Calculations:
CY Calculation Info:
Section 20 (L x A3) 0.00 N1 CY State Share Times GE Blend FTE
Adj for GE Non Residents 0.00 N2 Estimated Adj. For Non Resident
Total Section 20 GE Fndtn. 0.00 N3 (N1+N2)
SE Fdtn. (lesser of H1, H2 xB3) 4,817.49 O1 CY Foundation Times SE Blend FTE
Adj for SE Non Residents 0.00 O2 Estimated Adj. For Non Resident
Total SE Fndtn. 4,817.49 O3 (O1+O2)
51a Special Ed Costs *.286138 15,021.67 P1 State Obligation for Special Education Costs
51a Special Ed Trans Cost *.704165 4,122.18 P2 State Obligation for Special Education Transportation
State Obligation for SE Costs 19,143.85 P3 Total of P1 + P2
Section 51.a3 Hold Harmless
Difference between (M5- (P3-O3)) or
0 if negative $0.00 P4
Total CY State Fdtn & SE Oblig.
((N3+O3)+(P3-O1)+(P4) 19,143.85 QBreakdown of Foundation and SE
Obligation
Section 22a - Proposal A (L*C) 0.00 R Proposal A Obligation
Section 51c (P3) 19,143.85 (P3) Special Education Obligation based on SE Costs
Section 22b (Q-R-P3) 0.00 S Discretionary Payment
Notes:
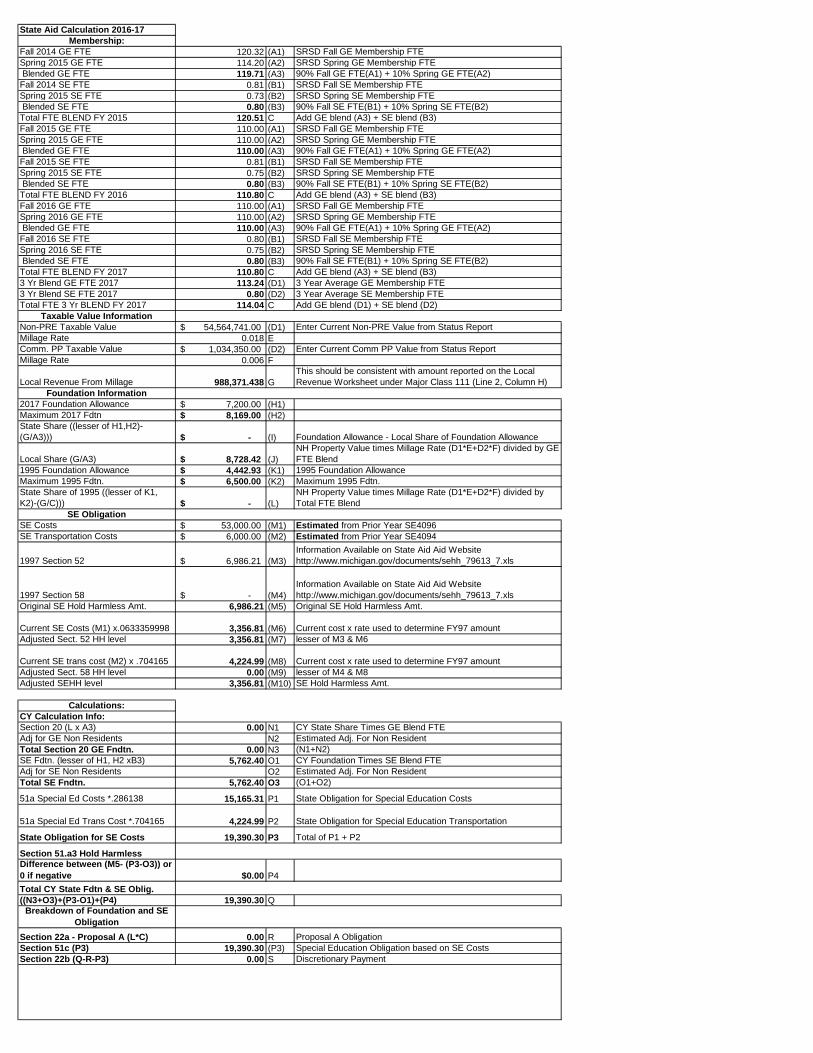
State Aid Calculation 2016-17
Membership:
Fall 2014 GE FTE 120.32 (A1) SRSD Fall GE Membership FTE
Spring 2015 GE FTE 114.20 (A2) SRSD Spring GE Membership FTE
Blended GE FTE 119.71 (A3) 90% Fall GE FTE(A1) + 10% Spring GE FTE(A2)
Fall 2014 SE FTE 0.81 (B1) SRSD Fall SE Membership FTE
Spring 2015 SE FTE 0.73 (B2) SRSD Spring SE Membership FTE
Blended SE FTE 0.80 (B3) 90% Fall SE FTE(B1) + 10% Spring SE FTE(B2)
Total FTE BLEND FY 2015 120.51 C Add GE blend (A3) + SE blend (B3)
Fall 2015 GE FTE 110.00 (A1) SRSD Fall GE Membership FTE
Spring 2015 GE FTE 110.00 (A2) SRSD Spring GE Membership FTE
Blended GE FTE 110.00 (A3) 90% Fall GE FTE(A1) + 10% Spring GE FTE(A2)
Fall 2015 SE FTE 0.81 (B1) SRSD Fall SE Membership FTE
Spring 2015 SE FTE 0.75 (B2) SRSD Spring SE Membership FTE
Blended SE FTE 0.80 (B3) 90% Fall SE FTE(B1) + 10% Spring SE FTE(B2)
Total FTE BLEND FY 2016 110.80 C Add GE blend (A3) + SE blend (B3)
Fall 2016 GE FTE 110.00 (A1) SRSD Fall GE Membership FTE
Spring 2016 GE FTE 110.00 (A2) SRSD Spring GE Membership FTE
Blended GE FTE 110.00 (A3) 90% Fall GE FTE(A1) + 10% Spring GE FTE(A2)
Fall 2016 SE FTE 0.80 (B1) SRSD Fall SE Membership FTE
Spring 2016 SE FTE 0.75 (B2) SRSD Spring SE Membership FTE
Blended SE FTE 0.80 (B3) 90% Fall SE FTE(B1) + 10% Spring SE FTE(B2)
Total FTE BLEND FY 2017 110.80 C Add GE blend (A3) + SE blend (B3)
3 Yr Blend GE FTE 2017 113.24 (D1) 3 Year Average GE Membership FTE
3 Yr Blend SE FTE 2017 0.80 (D2) 3 Year Average SE Membership FTE
Total FTE 3 Yr BLEND FY 2017 114.04 C Add GE blend (D1) + SE blend (D2)
Taxable Value Information
Non-PRE Taxable Value 54,564,741.00$ (D1) Enter Current Non-PRE Value from Status Report
Millage Rate 0.018 E
Comm. PP Taxable Value 1,034,350.00$ (D2) Enter Current Comm PP Value from Status Report
Millage Rate 0.006 F
Local Revenue From Millage 988,371.438 G
This should be consistent with amount reported on the Local
Revenue Worksheet under Major Class 111 (Line 2, Column H)
Foundation Information
2017 Foundation Allowance 7,200.00$ (H1)
Maximum 2017 Fdtn 8,169.00$ (H2)
State Share ((lesser of H1,H2)-
(G/A3))) -$ (I) Foundation Allowance - Local Share of Foundation Allowance
Local Share (G/A3) 8,728.42$ (J)
NH Property Value times Millage Rate (D1*E+D2*F) divided by GE
FTE Blend
1995 Foundation Allowance 4,442.93$ (K1) 1995 Foundation Allowance
Maximum 1995 Fdtn. 6,500.00$ (K2) Maximum 1995 Fdtn.
State Share of 1995 ((lesser of K1,
K2)-(G/C))) -$ (L)
NH Property Value times Millage Rate (D1*E+D2*F) divided by
Total FTE Blend
SE Obligation
SE Costs 53,000.00$ (M1) Estimated from Prior Year SE4096
SE Transportation Costs 6,000.00$ (M2) Estimated from Prior Year SE4094
1997 Section 52 6,986.21$ (M3)
Information Available on State Aid Aid Website
http://www.michigan.gov/documents/sehh_79613_7.xls
1997 Section 58 -$ (M4)
Information Available on State Aid Aid Website
http://www.michigan.gov/documents/sehh_79613_7.xls
Original SE Hold Harmless Amt. 6,986.21 (M5) Original SE Hold Harmless Amt.
Current SE Costs (M1) x.0633359998 3,356.81 (M6) Current cost x rate used to determine FY97 amount
Adjusted Sect. 52 HH level 3,356.81 (M7) lesser of M3 & M6
Current SE trans cost (M2) x .704165 4,224.99 (M8) Current cost x rate used to determine FY97 amount
Adjusted Sect. 58 HH level 0.00 (M9) lesser of M4 & M8
Adjusted SEHH level 3,356.81 (M10) SE Hold Harmless Amt.
Calculations:
CY Calculation Info:
Section 20 (L x A3) 0.00 N1 CY State Share Times GE Blend FTE
Adj for GE Non Residents N2 Estimated Adj. For Non Resident
Total Section 20 GE Fndtn. 0.00 N3 (N1+N2)
SE Fdtn. (lesser of H1, H2 xB3) 5,762.40 O1 CY Foundation Times SE Blend FTE
Adj for SE Non Residents O2 Estimated Adj. For Non Resident
Total SE Fndtn. 5,762.40 O3 (O1+O2)
51a Special Ed Costs *.286138 15,165.31 P1 State Obligation for Special Education Costs
51a Special Ed Trans Cost *.704165 4,224.99 P2 State Obligation for Special Education Transportation
State Obligation for SE Costs 19,390.30 P3 Total of P1 + P2
Section 51.a3 Hold Harmless
Difference between (M5- (P3-O3)) or
0 if negative $0.00 P4
Total CY State Fdtn & SE Oblig.
((N3+O3)+(P3-O1)+(P4) 19,390.30 QBreakdown of Foundation and SE
Obligation
Section 22a - Proposal A (L*C) 0.00 R Proposal A Obligation
Section 51c (P3) 19,390.30 (P3) Special Education Obligation based on SE Costs
Section 22b (Q-R-P3) 0.00 S Discretionary Payment
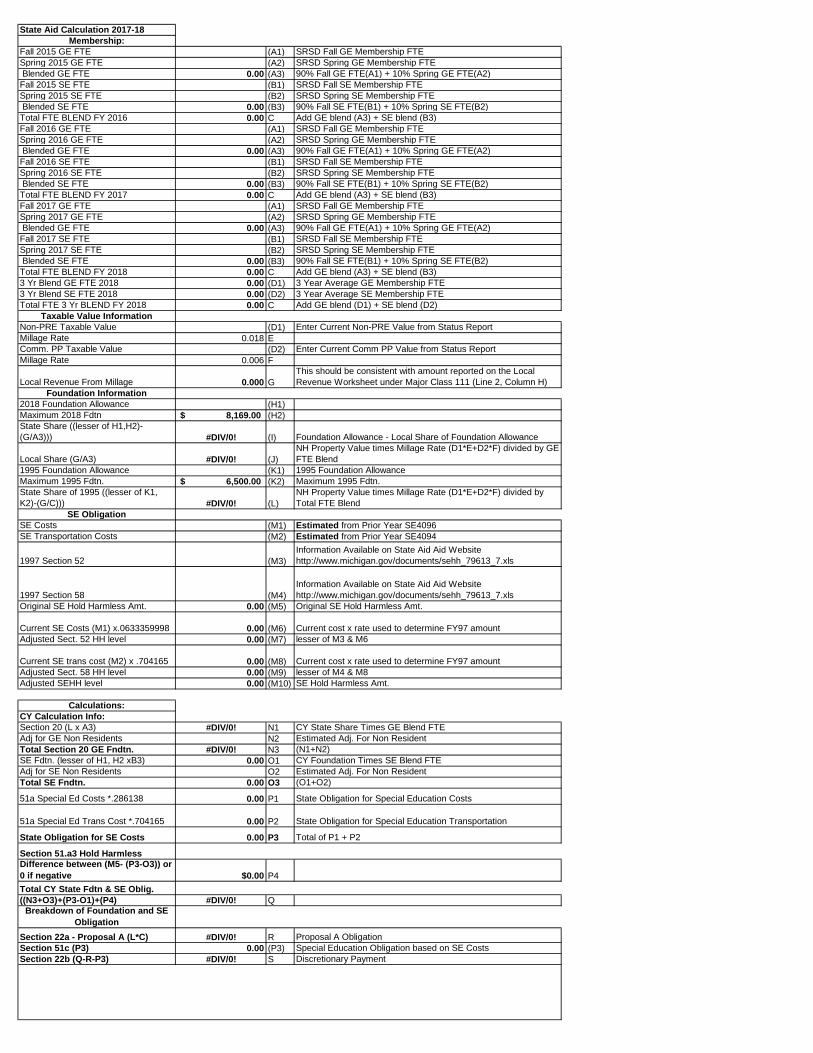
State Aid Calculation 2017-18
Membership:
Fall 2015 GE FTE (A1) SRSD Fall GE Membership FTE
Spring 2015 GE FTE (A2) SRSD Spring GE Membership FTE
Blended GE FTE 0.00 (A3) 90% Fall GE FTE(A1) + 10% Spring GE FTE(A2)
Fall 2015 SE FTE (B1) SRSD Fall SE Membership FTE
Spring 2015 SE FTE (B2) SRSD Spring SE Membership FTE
Blended SE FTE 0.00 (B3) 90% Fall SE FTE(B1) + 10% Spring SE FTE(B2)
Total FTE BLEND FY 2016 0.00 C Add GE blend (A3) + SE blend (B3)
Fall 2016 GE FTE (A1) SRSD Fall GE Membership FTE
Spring 2016 GE FTE (A2) SRSD Spring GE Membership FTE
Blended GE FTE 0.00 (A3) 90% Fall GE FTE(A1) + 10% Spring GE FTE(A2)
Fall 2016 SE FTE (B1) SRSD Fall SE Membership FTE
Spring 2016 SE FTE (B2) SRSD Spring SE Membership FTE
Blended SE FTE 0.00 (B3) 90% Fall SE FTE(B1) + 10% Spring SE FTE(B2)
Total FTE BLEND FY 2017 0.00 C Add GE blend (A3) + SE blend (B3)
Fall 2017 GE FTE (A1) SRSD Fall GE Membership FTE
Spring 2017 GE FTE (A2) SRSD Spring GE Membership FTE
Blended GE FTE 0.00 (A3) 90% Fall GE FTE(A1) + 10% Spring GE FTE(A2)
Fall 2017 SE FTE (B1) SRSD Fall SE Membership FTE
Spring 2017 SE FTE (B2) SRSD Spring SE Membership FTE
Blended SE FTE 0.00 (B3) 90% Fall SE FTE(B1) + 10% Spring SE FTE(B2)
Total FTE BLEND FY 2018 0.00 C Add GE blend (A3) + SE blend (B3)
3 Yr Blend GE FTE 2018 0.00 (D1) 3 Year Average GE Membership FTE
3 Yr Blend SE FTE 2018 0.00 (D2) 3 Year Average SE Membership FTE
Total FTE 3 Yr BLEND FY 2018 0.00 C Add GE blend (D1) + SE blend (D2)
Taxable Value Information
Non-PRE Taxable Value (D1) Enter Current Non-PRE Value from Status Report
Millage Rate 0.018 E
Comm. PP Taxable Value (D2) Enter Current Comm PP Value from Status Report
Millage Rate 0.006 F
Local Revenue From Millage 0.000 G
This should be consistent with amount reported on the Local
Revenue Worksheet under Major Class 111 (Line 2, Column H)
Foundation Information
2018 Foundation Allowance (H1)
Maximum 2018 Fdtn 8,169.00$ (H2)
State Share ((lesser of H1,H2)-
(G/A3))) #DIV/0! (I) Foundation Allowance - Local Share of Foundation Allowance
Local Share (G/A3) #DIV/0! (J)
NH Property Value times Millage Rate (D1*E+D2*F) divided by GE
FTE Blend
1995 Foundation Allowance (K1) 1995 Foundation Allowance
Maximum 1995 Fdtn. 6,500.00$ (K2) Maximum 1995 Fdtn.
State Share of 1995 ((lesser of K1,
K2)-(G/C))) #DIV/0! (L)
NH Property Value times Millage Rate (D1*E+D2*F) divided by
Total FTE Blend
SE Obligation
SE Costs (M1) Estimated from Prior Year SE4096
SE Transportation Costs (M2) Estimated from Prior Year SE4094
1997 Section 52 (M3)
Information Available on State Aid Aid Website
http://www.michigan.gov/documents/sehh_79613_7.xls
1997 Section 58 (M4)
Information Available on State Aid Aid Website
http://www.michigan.gov/documents/sehh_79613_7.xls
Original SE Hold Harmless Amt. 0.00 (M5) Original SE Hold Harmless Amt.
Current SE Costs (M1) x.0633359998 0.00 (M6) Current cost x rate used to determine FY97 amount
Adjusted Sect. 52 HH level 0.00 (M7) lesser of M3 & M6
Current SE trans cost (M2) x .704165 0.00 (M8) Current cost x rate used to determine FY97 amount
Adjusted Sect. 58 HH level 0.00 (M9) lesser of M4 & M8
Adjusted SEHH level 0.00 (M10) SE Hold Harmless Amt.
Calculations:
CY Calculation Info:
Section 20 (L x A3) #DIV/0! N1 CY State Share Times GE Blend FTE
Adj for GE Non Residents N2 Estimated Adj. For Non Resident
Total Section 20 GE Fndtn. #DIV/0! N3 (N1+N2)
SE Fdtn. (lesser of H1, H2 xB3) 0.00 O1 CY Foundation Times SE Blend FTE
Adj for SE Non Residents O2 Estimated Adj. For Non Resident
Total SE Fndtn. 0.00 O3 (O1+O2)
51a Special Ed Costs *.286138 0.00 P1 State Obligation for Special Education Costs
51a Special Ed Trans Cost *.704165 0.00 P2 State Obligation for Special Education Transportation
State Obligation for SE Costs 0.00 P3 Total of P1 + P2
Section 51.a3 Hold Harmless
Difference between (M5- (P3-O3)) or
0 if negative $0.00 P4
Total CY State Fdtn & SE Oblig.
((N3+O3)+(P3-O1)+(P4) #DIV/0! QBreakdown of Foundation and SE
Obligation
Section 22a - Proposal A (L*C) #DIV/0! R Proposal A Obligation
Section 51c (P3) 0.00 (P3) Special Education Obligation based on SE Costs
Section 22b (Q-R-P3) #DIV/0! S Discretionary Payment
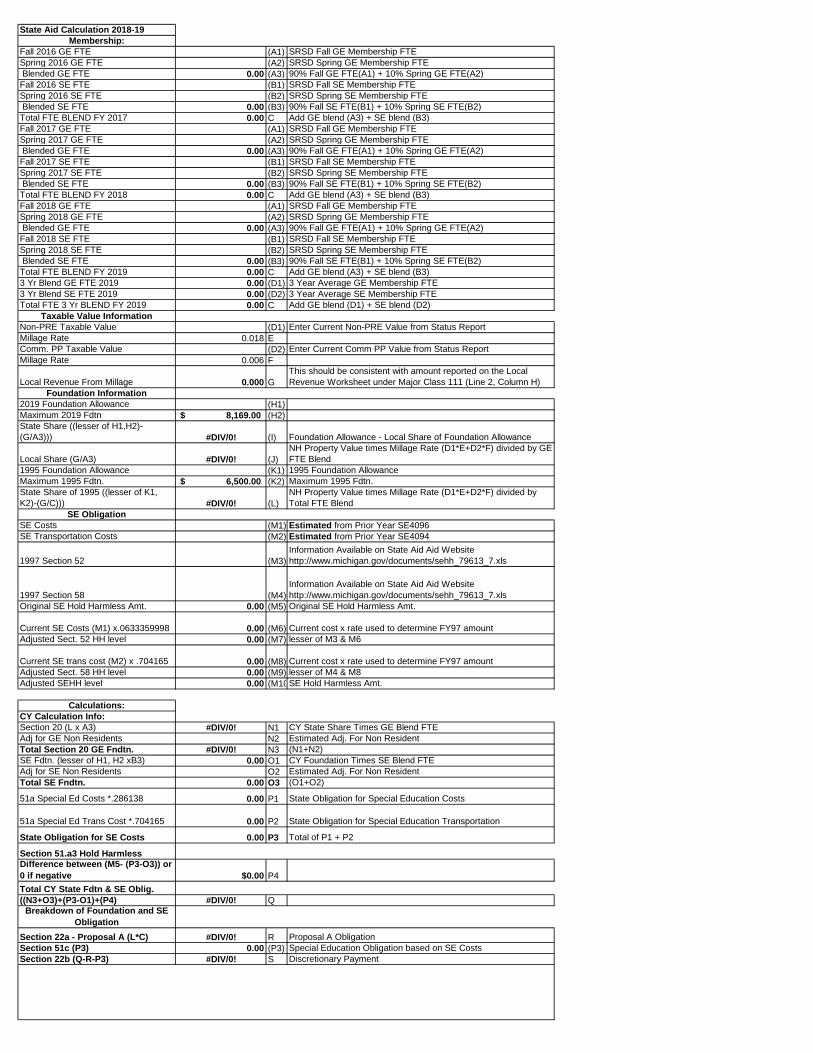
State Aid Calculation 2018-19
Membership:
Fall 2016 GE FTE (A1) SRSD Fall GE Membership FTE
Spring 2016 GE FTE (A2) SRSD Spring GE Membership FTE
Blended GE FTE 0.00 (A3) 90% Fall GE FTE(A1) + 10% Spring GE FTE(A2)
Fall 2016 SE FTE (B1) SRSD Fall SE Membership FTE
Spring 2016 SE FTE (B2) SRSD Spring SE Membership FTE
Blended SE FTE 0.00 (B3) 90% Fall SE FTE(B1) + 10% Spring SE FTE(B2)
Total FTE BLEND FY 2017 0.00 C Add GE blend (A3) + SE blend (B3)
Fall 2017 GE FTE (A1) SRSD Fall GE Membership FTE
Spring 2017 GE FTE (A2) SRSD Spring GE Membership FTE
Blended GE FTE 0.00 (A3) 90% Fall GE FTE(A1) + 10% Spring GE FTE(A2)
Fall 2017 SE FTE (B1) SRSD Fall SE Membership FTE
Spring 2017 SE FTE (B2) SRSD Spring SE Membership FTE
Blended SE FTE 0.00 (B3) 90% Fall SE FTE(B1) + 10% Spring SE FTE(B2)
Total FTE BLEND FY 2018 0.00 C Add GE blend (A3) + SE blend (B3)
Fall 2018 GE FTE (A1) SRSD Fall GE Membership FTE
Spring 2018 GE FTE (A2) SRSD Spring GE Membership FTE
Blended GE FTE 0.00 (A3) 90% Fall GE FTE(A1) + 10% Spring GE FTE(A2)
Fall 2018 SE FTE (B1) SRSD Fall SE Membership FTE
Spring 2018 SE FTE (B2) SRSD Spring SE Membership FTE
Blended SE FTE 0.00 (B3) 90% Fall SE FTE(B1) + 10% Spring SE FTE(B2)
Total FTE BLEND FY 2019 0.00 C Add GE blend (A3) + SE blend (B3)
3 Yr Blend GE FTE 2019 0.00 (D1) 3 Year Average GE Membership FTE
3 Yr Blend SE FTE 2019 0.00 (D2) 3 Year Average SE Membership FTE
Total FTE 3 Yr BLEND FY 2019 0.00 C Add GE blend (D1) + SE blend (D2)
Taxable Value Information
Non-PRE Taxable Value (D1) Enter Current Non-PRE Value from Status Report
Millage Rate 0.018 E
Comm. PP Taxable Value (D2) Enter Current Comm PP Value from Status Report
Millage Rate 0.006 F
Local Revenue From Millage 0.000 G
This should be consistent with amount reported on the Local
Revenue Worksheet under Major Class 111 (Line 2, Column H)
Foundation Information
2019 Foundation Allowance (H1)
Maximum 2019 Fdtn 8,169.00$ (H2)
State Share ((lesser of H1,H2)-
(G/A3))) #DIV/0! (I) Foundation Allowance - Local Share of Foundation Allowance
Local Share (G/A3) #DIV/0! (J)
NH Property Value times Millage Rate (D1*E+D2*F) divided by GE
FTE Blend
1995 Foundation Allowance (K1) 1995 Foundation Allowance
Maximum 1995 Fdtn. 6,500.00$ (K2) Maximum 1995 Fdtn.
State Share of 1995 ((lesser of K1,
K2)-(G/C))) #DIV/0! (L)
NH Property Value times Millage Rate (D1*E+D2*F) divided by
Total FTE Blend
SE Obligation
SE Costs (M1) Estimated from Prior Year SE4096
SE Transportation Costs (M2) Estimated from Prior Year SE4094
1997 Section 52 (M3)
Information Available on State Aid Aid Website
http://www.michigan.gov/documents/sehh_79613_7.xls
1997 Section 58 (M4)
Information Available on State Aid Aid Website
http://www.michigan.gov/documents/sehh_79613_7.xls
Original SE Hold Harmless Amt. 0.00 (M5) Original SE Hold Harmless Amt.
Current SE Costs (M1) x.0633359998 0.00 (M6) Current cost x rate used to determine FY97 amount
Adjusted Sect. 52 HH level 0.00 (M7) lesser of M3 & M6
Current SE trans cost (M2) x .704165 0.00 (M8) Current cost x rate used to determine FY97 amount
Adjusted Sect. 58 HH level 0.00 (M9) lesser of M4 & M8
Adjusted SEHH level 0.00 (M10)SE Hold Harmless Amt.
Calculations:
CY Calculation Info:
Section 20 (L x A3) #DIV/0! N1 CY State Share Times GE Blend FTE
Adj for GE Non Residents N2 Estimated Adj. For Non Resident
Total Section 20 GE Fndtn. #DIV/0! N3 (N1+N2)
SE Fdtn. (lesser of H1, H2 xB3) 0.00 O1 CY Foundation Times SE Blend FTE
Adj for SE Non Residents O2 Estimated Adj. For Non Resident
Total SE Fndtn. 0.00 O3 (O1+O2)
51a Special Ed Costs *.286138 0.00 P1 State Obligation for Special Education Costs
51a Special Ed Trans Cost *.704165 0.00 P2 State Obligation for Special Education Transportation
State Obligation for SE Costs 0.00 P3 Total of P1 + P2
Section 51.a3 Hold Harmless
Difference between (M5- (P3-O3)) or
0 if negative $0.00 P4
Total CY State Fdtn & SE Oblig.
((N3+O3)+(P3-O1)+(P4) #DIV/0! QBreakdown of Foundation and SE
Obligation
Section 22a - Proposal A (L*C) #DIV/0! R Proposal A Obligation
Section 51c (P3) 0.00 (P3) Special Education Obligation based on SE Costs
Section 22b (Q-R-P3) #DIV/0! S Discretionary Payment

State Aid Calculation 2019-20
Membership:
Fall 2017 GE FTE (A1) SRSD Fall GE Membership FTE
Spring 2017 GE FTE (A2) SRSD Spring GE Membership FTE
Blended GE FTE 0.00 (A3) 90% Fall GE FTE(A1) + 10% Spring GE FTE(A2)
Fall 2017 SE FTE (B1) SRSD Fall SE Membership FTE
Spring 2017 SE FTE (B2) SRSD Spring SE Membership FTE
Blended SE FTE 0.00 (B3) 90% Fall SE FTE(B1) + 10% Spring SE FTE(B2)
Total FTE BLEND FY 2018 0.00 C Add GE blend (A3) + SE blend (B3)
Fall 2018 GE FTE (A1) SRSD Fall GE Membership FTE
Spring 2018 GE FTE (A2) SRSD Spring GE Membership FTE
Blended GE FTE 0.00 (A3) 90% Fall GE FTE(A1) + 10% Spring GE FTE(A2)
Fall 2018 SE FTE (B1) SRSD Fall SE Membership FTE
Spring 2018 SE FTE (B2) SRSD Spring SE Membership FTE
Blended SE FTE 0.00 (B3) 90% Fall SE FTE(B1) + 10% Spring SE FTE(B2)
Total FTE BLEND FY 2019 0.00 C Add GE blend (A3) + SE blend (B3)
Fall 2019 GE FTE (A1) SRSD Fall GE Membership FTE
Spring 2019 GE FTE (A2) SRSD Spring GE Membership FTE
Blended GE FTE 0.00 (A3) 90% Fall GE FTE(A1) + 10% Spring GE FTE(A2)
Fall 2019 SE FTE (B1) SRSD Fall SE Membership FTE
Spring 2019 SE FTE (B2) SRSD Spring SE Membership FTE
Blended SE FTE 0.00 (B3) 90% Fall SE FTE(B1) + 10% Spring SE FTE(B2)
Total FTE BLEND FY 2020 0.00 C Add GE blend (A3) + SE blend (B3)
3 Yr Blend GE FTE 2020 0.00 (D1) 3 Year Average GE Membership FTE
3 Yr Blend SE FTE 2020 0.00 (D2) 3 Year Average SE Membership FTE
Total FTE 3 Yr BLEND FY 2020 0.00 C Add GE blend (D1) + SE blend (D2)
Taxable Value Information
Non-PRE Taxable Value (D1) Enter Current Non-PRE Value from Status Report
Millage Rate 0.018 E
Comm. PP Taxable Value (D2) Enter Current Comm PP Value from Status Report
Millage Rate 0.006 F
Local Revenue From Millage 0.000 G
This should be consistent with amount reported on the Local
Revenue Worksheet under Major Class 111 (Line 2, Column H)
Foundation Information
2020 Foundation Allowance (H1)
Maximum 2020 Fdtn 8,169.00$ (H2)
State Share ((lesser of H1,H2)-
(G/A3))) #DIV/0! (I) Foundation Allowance - Local Share of Foundation Allowance
Local Share (G/A3) #DIV/0! (J)
NH Property Value times Millage Rate (D1*E+D2*F) divided by GE
FTE Blend
1995 Foundation Allowance (K1) 1995 Foundation Allowance
Maximum 1995 Fdtn. 6,500.00$ (K2) Maximum 1995 Fdtn.
State Share of 1995 ((lesser of K1,
K2)-(G/C))) #DIV/0! (L)
NH Property Value times Millage Rate (D1*E+D2*F) divided by
Total FTE Blend
SE Obligation
SE Costs (M1) Estimated from Prior Year SE4096
SE Transportation Costs (M2) Estimated from Prior Year SE4094
1997 Section 52 (M3)
Information Available on State Aid Aid Website
http://www.michigan.gov/documents/sehh_79613_7.xls
1997 Section 58 (M4)
Information Available on State Aid Aid Website
http://www.michigan.gov/documents/sehh_79613_7.xls
Original SE Hold Harmless Amt. 0.00 (M5) Original SE Hold Harmless Amt.
Current SE Costs (M1) x.0633359998 0.00 (M6) Current cost x rate used to determine FY97 amount
Adjusted Sect. 52 HH level 0.00 (M7) lesser of M3 & M6
Current SE trans cost (M2) x .704165 0.00 (M8) Current cost x rate used to determine FY97 amount
Adjusted Sect. 58 HH level 0.00 (M9) lesser of M4 & M8
Adjusted SEHH level 0.00 (M10)SE Hold Harmless Amt.
Calculations:
CY Calculation Info:
Section 20 (L x A3) #DIV/0! N1 CY State Share Times GE Blend FTE
Adj for GE Non Residents N2 Estimated Adj. For Non Resident
Total Section 20 GE Fndtn. #DIV/0! N3 (N1+N2)
SE Fdtn. (lesser of H1, H2 xB3) 0.00 O1 CY Foundation Times SE Blend FTE
Adj for SE Non Residents O2 Estimated Adj. For Non Resident
Total SE Fndtn. 0.00 O3 (O1+O2)
51a Special Ed Costs *.286138 0.00 P1 State Obligation for Special Education Costs
51a Special Ed Trans Cost *.704165 0.00 P2 State Obligation for Special Education Transportation
State Obligation for SE Costs 0.00 P3 Total of P1 + P2
Section 51.a3 Hold Harmless
Difference between (M5- (P3-O3)) or
0 if negative $0.00 P4
Total CY State Fdtn & SE Oblig.
((N3+O3)+(P3-O1)+(P4) #DIV/0! QBreakdown of Foundation and SE
Obligation
Section 22a - Proposal A (L*C) #DIV/0! R Proposal A Obligation
Section 51c (P3) 0.00 (P3) Special Education Obligation based on SE Costs
Section 22b (Q-R-P3) #DIV/0! S Discretionary Payment
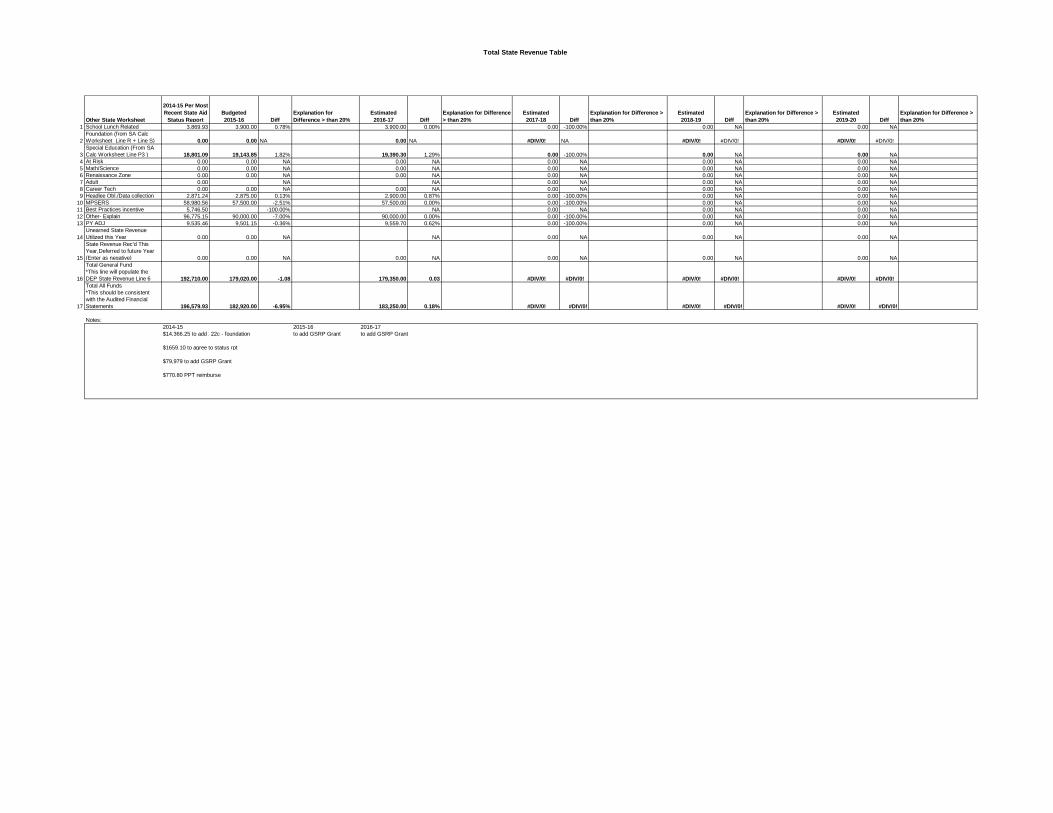
Total State Revenue Table
Other State Worksheet
2014-15 Per Most
Recent State Aid
Status Report
Budgeted
2015-16 Diff
Explanation for
Difference > than 20%
Estimated
2016-17 Diff
Explanation for Difference
> than 20%
Estimated
2017-18 Diff
Explanation for Difference >
than 20%
Estimated
2018-19 Diff
Explanation for Difference >
than 20%
Estimated
2019-20 Diff
Explanation for Difference >
than 20%
1 School Lunch Related 3,869.93 3,900.00 0.78% 3,900.00 0.00% 0.00 -100.00% 0.00 NA 0.00 NA
2
Foundation (from SA Calc
Worksheet Line R + Line S) 0.00 0.00 NA 0.00 NA #DIV/0! NA #DIV/0! #DIV/0! #DIV/0! #DIV/0!
3
Special Education (From SA
Calc Worksheet Line P3 ) 18,801.09 19,143.85 1.82% 19,390.30 1.29% 0.00 -100.00% 0.00 NA 0.00 NA
4 At Risk 0.00 0.00 NA 0.00 NA 0.00 NA 0.00 NA 0.00 NA
5 Math/Science 0.00 0.00 NA 0.00 NA 0.00 NA 0.00 NA 0.00 NA
6 Renaissance Zone 0.00 0.00 NA 0.00 NA 0.00 NA 0.00 NA 0.00 NA
7 Adult 0.00 NA NA 0.00 NA 0.00 NA 0.00 NA
8 Career Tech 0.00 0.00 NA 0.00 NA 0.00 NA 0.00 NA 0.00 NA
9 Headlee Obl./Data collection 2,871.24 2,875.00 0.13% 2,900.00 0.87% 0.00 -100.00% 0.00 NA 0.00 NA
10 MPSERS 58,980.56 57,500.00 -2.51% 57,500.00 0.00% 0.00 -100.00% 0.00 NA 0.00 NA
11 Best Practices incentive 5,746.50 -100.00% NA 0.00 NA 0.00 NA 0.00 NA
12 Other- Explain 96,775.15 90,000.00 -7.00% 90,000.00 0.00% 0.00 -100.00% 0.00 NA 0.00 NA
13 PY ADJ 9,535.46 9,501.15 -0.36% 9,559.70 0.62% 0.00 -100.00% 0.00 NA 0.00 NA
14
Unearned State Revenue
Utilized this Year 0.00 0.00 NA NA 0.00 NA 0.00 NA 0.00 NA
15
State Revenue Rec'd This
Year,Deferred to future Year
(Enter as negative) 0.00 0.00 NA 0.00 NA 0.00 NA 0.00 NA 0.00 NA
16
Total General Fund
*This line will populate the
DEP State Revenue Line 6 192,710.00 179,020.00 -1.08 179,350.00 0.03 #DIV/0! #DIV/0! #DIV/0! #DIV/0! #DIV/0! #DIV/0!
17
Total All Funds
*This should be consistent
with the Audited Financial
Statements 196,579.93 182,920.00 -6.95% 183,250.00 0.18% #DIV/0! #DIV/0! #DIV/0! #DIV/0! #DIV/0! #DIV/0!
Notes:
2014-15 2015-16 2016-17
$14,366.25 to add 22c Found22c - foundation to add GSRP Grant to add GSRP Grant
$1659.10 to agree to status rpt
$79,979 to add GSRP Grant
$770.80 PPT reimburse
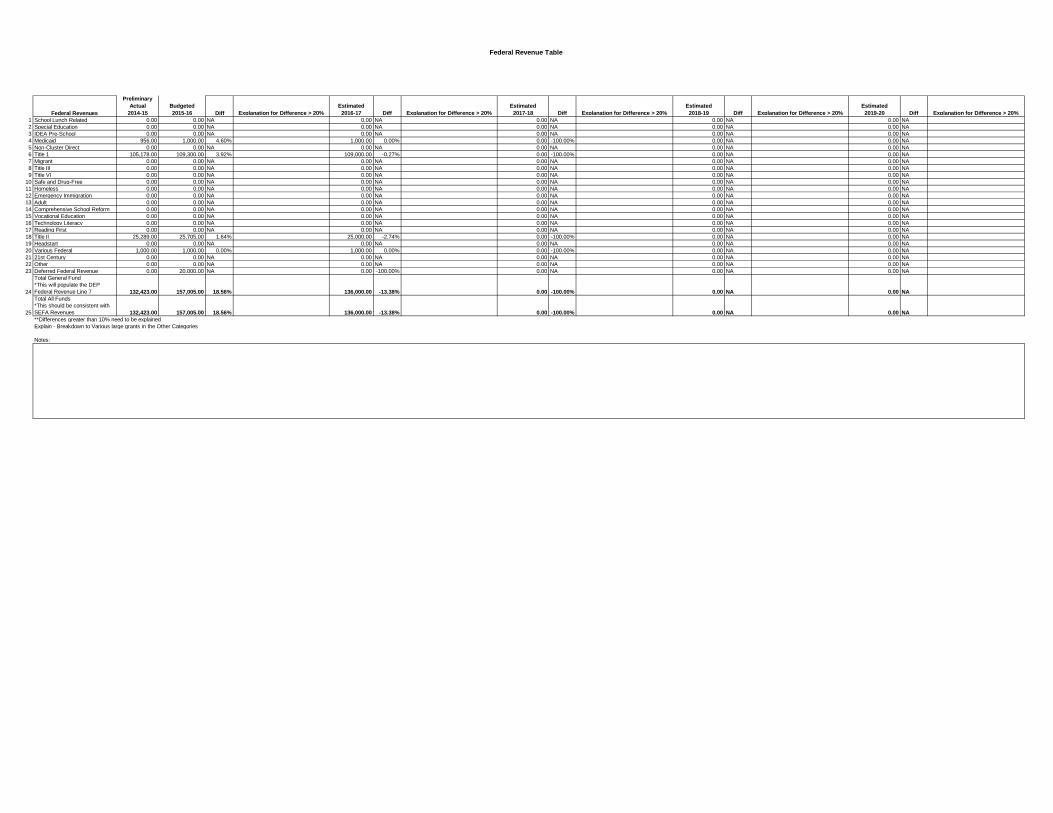
Federal Revenue Table
Federal Revenues
Preliminary
Actual
2014-15
Budgeted
2015-16 Diff Explanation for Difference > 20%
Estimated
2016-17 Diff Explanation for Difference > 20%
Estimated
2017-18 Diff Explanation for Difference > 20%
Estimated
2018-19 Diff Explanation for Difference > 20%
Estimated
2019-20 Diff Explanation for Difference > 20%
1 School Lunch Related 0.00 0.00 NA 0.00 NA 0.00 NA 0.00 NA 0.00 NA
2 Special Education 0.00 0.00 NA 0.00 NA 0.00 NA 0.00 NA 0.00 NA
3 IDEA Pre-School 0.00 0.00 NA 0.00 NA 0.00 NA 0.00 NA 0.00 NA
4 Medicaid 956.00 1,000.00 4.60% 1,000.00 0.00% 0.00 -100.00% 0.00 NA 0.00 NA
5 Non-Cluster Direct 0.00 0.00 NA 0.00 NA 0.00 NA 0.00 NA 0.00 NA
6 Title 1 105,178.00 109,300.00 3.92% 109,000.00 -0.27% 0.00 -100.00% 0.00 NA 0.00 NA
7 Migrant 0.00 0.00 NA 0.00 NA 0.00 NA 0.00 NA 0.00 NA
8 Title III 0.00 0.00 NA 0.00 NA 0.00 NA 0.00 NA 0.00 NA
9 Title VI 0.00 0.00 NA 0.00 NA 0.00 NA 0.00 NA 0.00 NA
10 Safe and Drug-Free 0.00 0.00 NA 0.00 NA 0.00 NA 0.00 NA 0.00 NA
11 Homeless 0.00 0.00 NA 0.00 NA 0.00 NA 0.00 NA 0.00 NA
12 Emergency Immigration 0.00 0.00 NA 0.00 NA 0.00 NA 0.00 NA 0.00 NA
13 Adult 0.00 0.00 NA 0.00 NA 0.00 NA 0.00 NA 0.00 NA
14 Comprehensive School Reform 0.00 0.00 NA 0.00 NA 0.00 NA 0.00 NA 0.00 NA
15 Vocational Education 0.00 0.00 NA 0.00 NA 0.00 NA 0.00 NA 0.00 NA
16 Technology Literacy 0.00 0.00 NA 0.00 NA 0.00 NA 0.00 NA 0.00 NA
17 Reading First 0.00 0.00 NA 0.00 NA 0.00 NA 0.00 NA 0.00 NA
18 Title II 25,289.00 25,705.00 1.64% 25,000.00 -2.74% 0.00 -100.00% 0.00 NA 0.00 NA
19 Headstart 0.00 0.00 NA 0.00 NA 0.00 NA 0.00 NA 0.00 NA
20 Various Federal 1,000.00 1,000.00 0.00% 1,000.00 0.00% 0.00 -100.00% 0.00 NA 0.00 NA
21 21st Century 0.00 0.00 NA 0.00 NA 0.00 NA 0.00 NA 0.00 NA
22 Other 0.00 0.00 NA 0.00 NA 0.00 NA 0.00 NA 0.00 NA
23 Deferred Federal Revenue 0.00 20,000.00 NA 0.00 -100.00% 0.00 NA 0.00 NA 0.00 NA
24
Total General Fund
*This will populate the DEP
Federal Revenue Line 7 132,423.00 157,005.00 18.56% 136,000.00 -13.38% 0.00 -100.00% 0.00 NA 0.00 NA
25
Total All Funds
*This should be consistent with
SEFA Revenues 132,423.00 157,005.00 18.56% 136,000.00 -13.38% 0.00 -100.00% 0.00 NA 0.00 NA
**Differences greater than 10% need to be explained
Explain - Breakdown to Various large grants in the Other Categories
Notes:
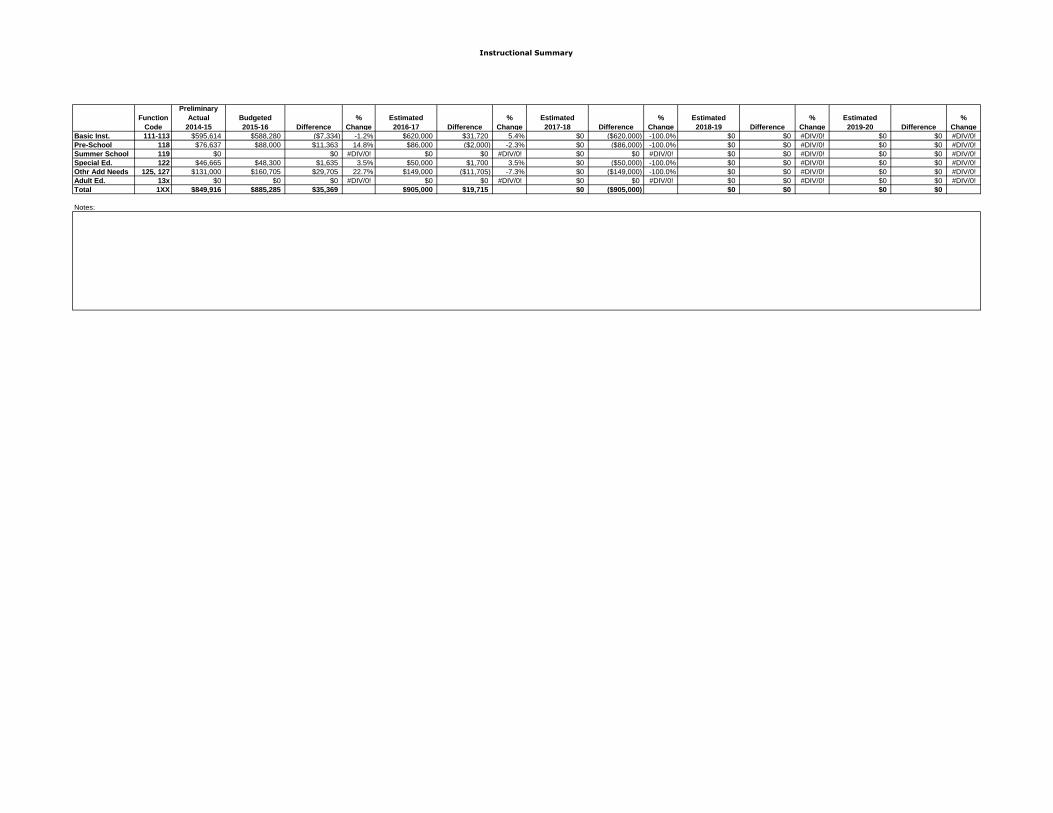
Instructional Summary
Function
Code
Preliminary
Actual
2014-15
Budgeted
2015-16 Difference
%
Change
Estimated
2016-17 Difference
%
Change
Estimated
2017-18 Difference
%
Change
Estimated
2018-19 Difference
%
Change
Estimated
2019-20 Difference
%
Change
Basic Inst. 111-113 $595,614 $588,280 ($7,334) -1.2% $620,000 $31,720 5.4% $0 ($620,000) -100.0% $0 $0 #DIV/0! $0 $0 #DIV/0!
Pre-School 118 $76,637 $88,000 $11,363 14.8% $86,000 ($2,000) -2.3% $0 ($86,000) -100.0% $0 $0 #DIV/0! $0 $0 #DIV/0!
Summer School 119 $0 $0 #DIV/0! $0 $0 #DIV/0! $0 $0 #DIV/0! $0 $0 #DIV/0! $0 $0 #DIV/0!
Special Ed. 122 $46,665 $48,300 $1,635 3.5% $50,000 $1,700 3.5% $0 ($50,000) -100.0% $0 $0 #DIV/0! $0 $0 #DIV/0!
Othr Add Needs 125, 127 $131,000 $160,705 $29,705 22.7% $149,000 ($11,705) -7.3% $0 ($149,000) -100.0% $0 $0 #DIV/0! $0 $0 #DIV/0!
Adult Ed. 13x $0 $0 $0 #DIV/0! $0 $0 #DIV/0! $0 $0 #DIV/0! $0 $0 #DIV/0! $0 $0 #DIV/0!
Total 1XX $849,916 $885,285 $35,369 $905,000 $19,715 $0 ($905,000) $0 $0 $0 $0
Notes:
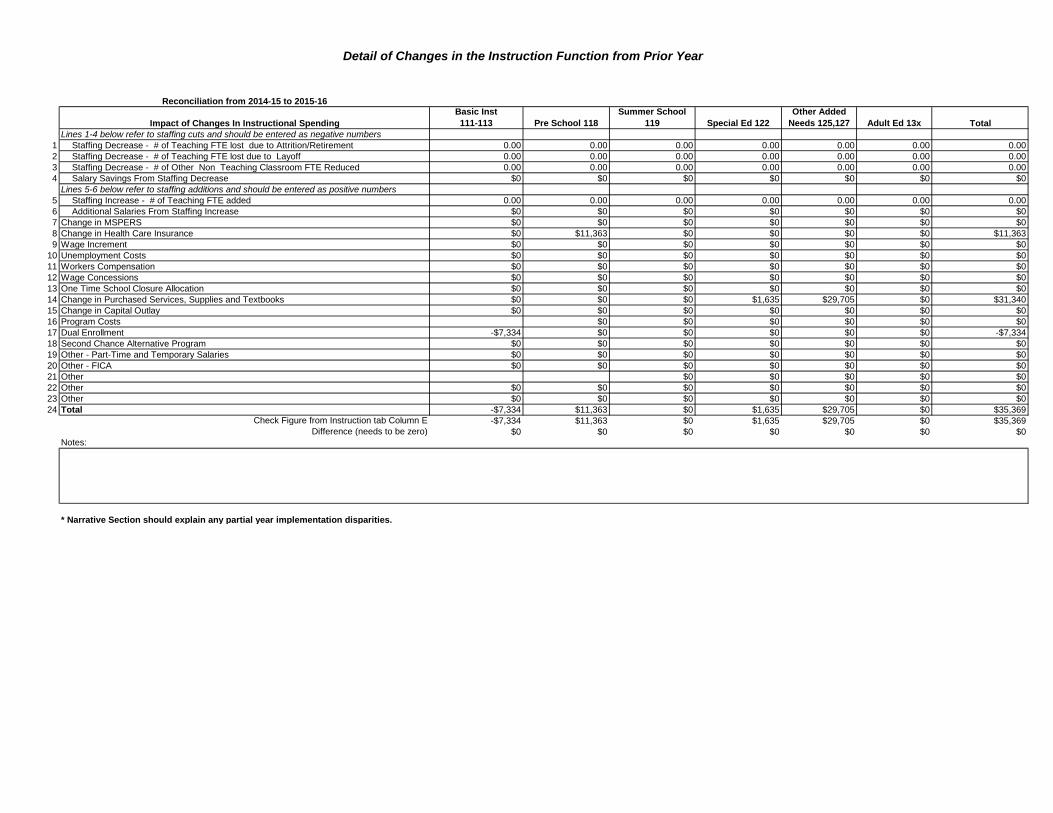
Detail of Changes in the Instruction Function from Prior Year
Reconciliation from 2014-15 to 2015-16
Impact of Changes In Instructional Spending
Basic Inst
111-113 Pre School 118
Summer School
119 Special Ed 122
Other Added
Needs 125,127 Adult Ed 13x Total
Lines 1-4 below refer to staffing cuts and should be entered as negative numbers
1 Staffing Decrease - # of Teaching FTE lost due to Attrition/Retirement 0.00 0.00 0.00 0.00 0.00 0.00 0.00
2 Staffing Decrease - # of Teaching FTE lost due to Layoff 0.00 0.00 0.00 0.00 0.00 0.00 0.00
3 Staffing Decrease - # of Other Non Teaching Classroom FTE Reduced 0.00 0.00 0.00 0.00 0.00 0.00 0.00
4 Salary Savings From Staffing Decrease $0 $0 $0 $0 $0 $0 $0
Lines 5-6 below refer to staffing additions and should be entered as positive numbers
5 Staffing Increase - # of Teaching FTE added 0.00 0.00 0.00 0.00 0.00 0.00 0.00
6 Additional Salaries From Staffing Increase $0 $0 $0 $0 $0 $0 $0
7 Change in MSPERS $0 $0 $0 $0 $0 $0 $0
8 Change in Health Care Insurance $0 $11,363 $0 $0 $0 $0 $11,363
9 Wage Increment $0 $0 $0 $0 $0 $0 $0
10 Unemployment Costs $0 $0 $0 $0 $0 $0 $0
11 Workers Compensation $0 $0 $0 $0 $0 $0 $0
12 Wage Concessions $0 $0 $0 $0 $0 $0 $0
13 One Time School Closure Allocation $0 $0 $0 $0 $0 $0 $0
14 Change in Purchased Services, Supplies and Textbooks $0 $0 $0 $1,635 $29,705 $0 $31,340
15 Change in Capital Outlay $0 $0 $0 $0 $0 $0 $0
16 Program Costs $0 $0 $0 $0 $0 $0
17 Dual Enrollment -$7,334 $0 $0 $0 $0 $0 -$7,334
18 Second Chance Alternative Program $0 $0 $0 $0 $0 $0 $0
19 Other - Part-Time and Temporary Salaries $0 $0 $0 $0 $0 $0 $0
20 Other - FICA $0 $0 $0 $0 $0 $0 $0
21 Other $0 $0 $0 $0 $0
22 Other $0 $0 $0 $0 $0 $0 $0
23 Other $0 $0 $0 $0 $0 $0 $0
24 Total -$7,334 $11,363 $0 $1,635 $29,705 $0 $35,369
Check Figure from Instruction tab Column E -$7,334 $11,363 $0 $1,635 $29,705 $0 $35,369
Difference (needs to be zero) $0 $0 $0 $0 $0 $0 $0
Notes:
* Narrative Section should explain any partial year implementation disparities.
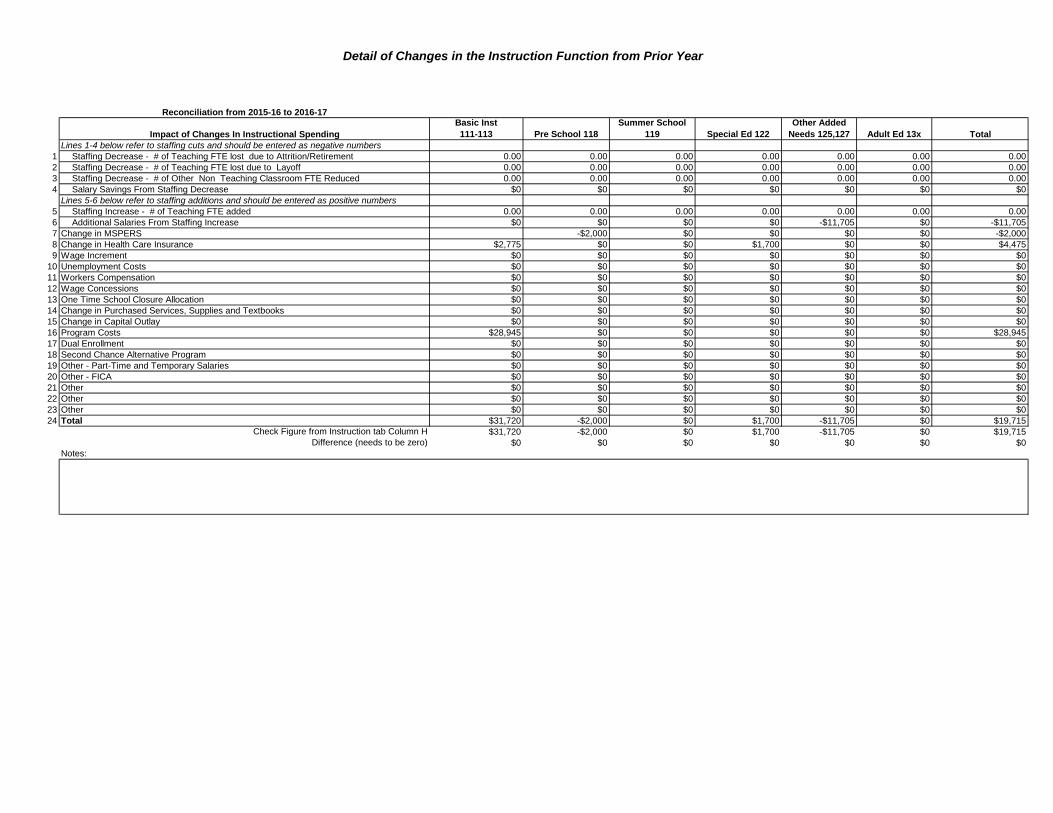
Detail of Changes in the Instruction Function from Prior Year
Reconciliation from 2015-16 to 2016-17
Impact of Changes In Instructional Spending
Basic Inst
111-113 Pre School 118
Summer School
119 Special Ed 122
Other Added
Needs 125,127 Adult Ed 13x Total
Lines 1-4 below refer to staffing cuts and should be entered as negative numbers
1 Staffing Decrease - # of Teaching FTE lost due to Attrition/Retirement 0.00 0.00 0.00 0.00 0.00 0.00 0.00
2 Staffing Decrease - # of Teaching FTE lost due to Layoff 0.00 0.00 0.00 0.00 0.00 0.00 0.00
3 Staffing Decrease - # of Other Non Teaching Classroom FTE Reduced 0.00 0.00 0.00 0.00 0.00 0.00 0.00
4 Salary Savings From Staffing Decrease $0 $0 $0 $0 $0 $0 $0
Lines 5-6 below refer to staffing additions and should be entered as positive numbers
5 Staffing Increase - # of Teaching FTE added 0.00 0.00 0.00 0.00 0.00 0.00 0.00
6 Additional Salaries From Staffing Increase $0 $0 $0 $0 -$11,705 $0 -$11,705
7 Change in MSPERS -$2,000 $0 $0 $0 $0 -$2,000
8 Change in Health Care Insurance $2,775 $0 $0 $1,700 $0 $0 $4,475
9 Wage Increment $0 $0 $0 $0 $0 $0 $0
10 Unemployment Costs $0 $0 $0 $0 $0 $0 $0
11 Workers Compensation $0 $0 $0 $0 $0 $0 $0
12 Wage Concessions $0 $0 $0 $0 $0 $0 $0
13 One Time School Closure Allocation $0 $0 $0 $0 $0 $0 $0
14 Change in Purchased Services, Supplies and Textbooks $0 $0 $0 $0 $0 $0 $0
15 Change in Capital Outlay $0 $0 $0 $0 $0 $0 $0
16 Program Costs $28,945 $0 $0 $0 $0 $0 $28,945
17 Dual Enrollment $0 $0 $0 $0 $0 $0 $0
18 Second Chance Alternative Program $0 $0 $0 $0 $0 $0 $0
19 Other - Part-Time and Temporary Salaries $0 $0 $0 $0 $0 $0 $0
20 Other - FICA $0 $0 $0 $0 $0 $0 $0
21 Other $0 $0 $0 $0 $0 $0 $0
22 Other $0 $0 $0 $0 $0 $0 $0
23 Other $0 $0 $0 $0 $0 $0 $0
24 Total $31,720 -$2,000 $0 $1,700 -$11,705 $0 $19,715
Check Figure from Instruction tab Column H $31,720 -$2,000 $0 $1,700 -$11,705 $0 $19,715
Difference (needs to be zero) $0 $0 $0 $0 $0 $0 $0
Notes:
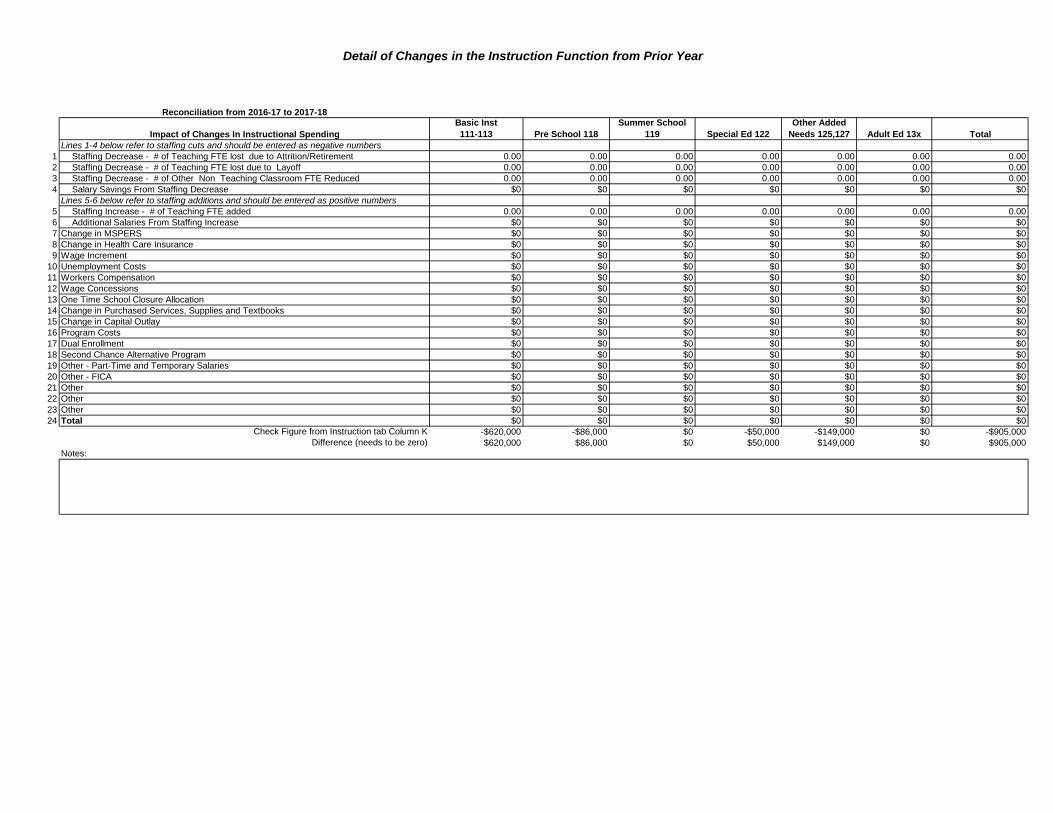
Detail of Changes in the Instruction Function from Prior Year
Reconciliation from 2016-17 to 2017-18
Impact of Changes In Instructional Spending
Basic Inst
111-113 Pre School 118
Summer School
119 Special Ed 122
Other Added
Needs 125,127 Adult Ed 13x Total
Lines 1-4 below refer to staffing cuts and should be entered as negative numbers
1 Staffing Decrease - # of Teaching FTE lost due to Attrition/Retirement 0.00 0.00 0.00 0.00 0.00 0.00 0.00
2 Staffing Decrease - # of Teaching FTE lost due to Layoff 0.00 0.00 0.00 0.00 0.00 0.00 0.00
3 Staffing Decrease - # of Other Non Teaching Classroom FTE Reduced 0.00 0.00 0.00 0.00 0.00 0.00 0.00
4 Salary Savings From Staffing Decrease $0 $0 $0 $0 $0 $0 $0
Lines 5-6 below refer to staffing additions and should be entered as positive numbers
5 Staffing Increase - # of Teaching FTE added 0.00 0.00 0.00 0.00 0.00 0.00 0.00
6 Additional Salaries From Staffing Increase $0 $0 $0 $0 $0 $0 $0
7 Change in MSPERS $0 $0 $0 $0 $0 $0 $0
8 Change in Health Care Insurance $0 $0 $0 $0 $0 $0 $0
9 Wage Increment $0 $0 $0 $0 $0 $0 $0
10 Unemployment Costs $0 $0 $0 $0 $0 $0 $0
11 Workers Compensation $0 $0 $0 $0 $0 $0 $0
12 Wage Concessions $0 $0 $0 $0 $0 $0 $0
13 One Time School Closure Allocation $0 $0 $0 $0 $0 $0 $0
14 Change in Purchased Services, Supplies and Textbooks $0 $0 $0 $0 $0 $0 $0
15 Change in Capital Outlay $0 $0 $0 $0 $0 $0 $0
16 Program Costs $0 $0 $0 $0 $0 $0 $0
17 Dual Enrollment $0 $0 $0 $0 $0 $0 $0
18 Second Chance Alternative Program $0 $0 $0 $0 $0 $0 $0
19 Other - Part-Time and Temporary Salaries $0 $0 $0 $0 $0 $0 $0
20 Other - FICA $0 $0 $0 $0 $0 $0 $0
21 Other $0 $0 $0 $0 $0 $0 $0
22 Other $0 $0 $0 $0 $0 $0 $0
23 Other $0 $0 $0 $0 $0 $0 $0
24 Total $0 $0 $0 $0 $0 $0 $0
Check Figure from Instruction tab Column K -$620,000 -$86,000 $0 -$50,000 -$149,000 $0 -$905,000
Difference (needs to be zero) $620,000 $86,000 $0 $50,000 $149,000 $0 $905,000
Notes:
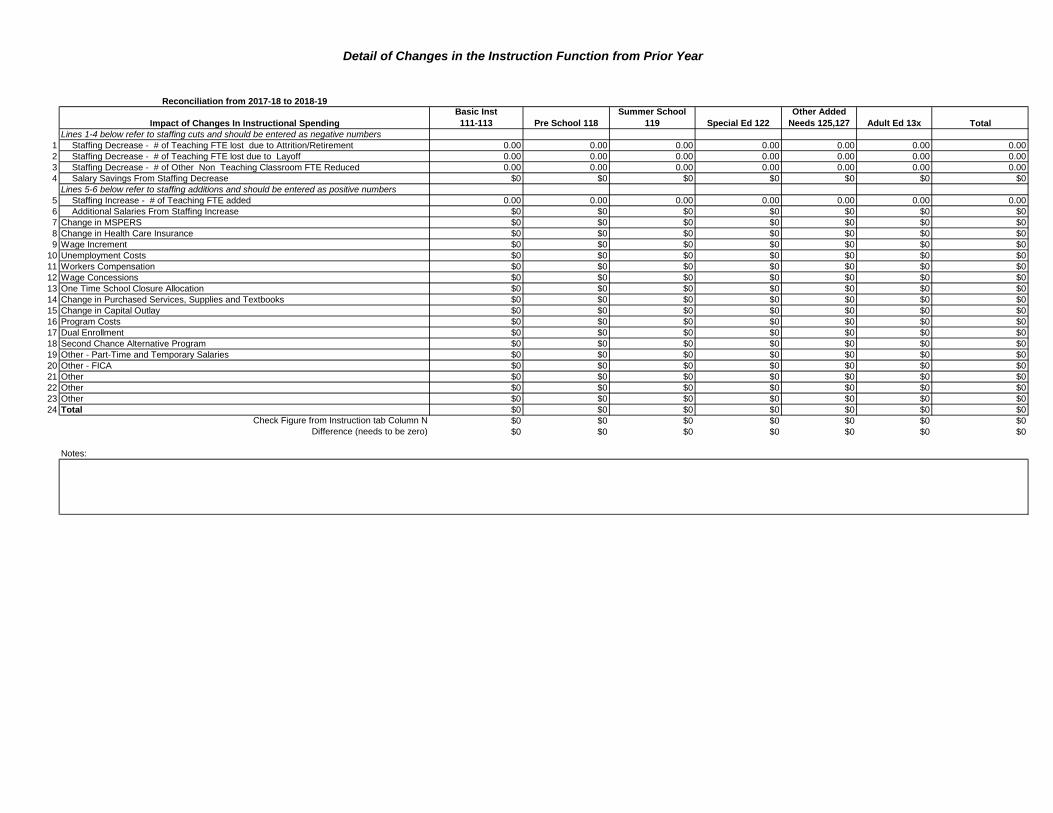
Detail of Changes in the Instruction Function from Prior Year
Reconciliation from 2017-18 to 2018-19
Impact of Changes In Instructional Spending
Basic Inst
111-113 Pre School 118
Summer School
119 Special Ed 122
Other Added
Needs 125,127 Adult Ed 13x Total
Lines 1-4 below refer to staffing cuts and should be entered as negative numbers
1 Staffing Decrease - # of Teaching FTE lost due to Attrition/Retirement 0.00 0.00 0.00 0.00 0.00 0.00 0.00
2 Staffing Decrease - # of Teaching FTE lost due to Layoff 0.00 0.00 0.00 0.00 0.00 0.00 0.00
3 Staffing Decrease - # of Other Non Teaching Classroom FTE Reduced 0.00 0.00 0.00 0.00 0.00 0.00 0.00
4 Salary Savings From Staffing Decrease $0 $0 $0 $0 $0 $0 $0
Lines 5-6 below refer to staffing additions and should be entered as positive numbers
5 Staffing Increase - # of Teaching FTE added 0.00 0.00 0.00 0.00 0.00 0.00 0.00
6 Additional Salaries From Staffing Increase $0 $0 $0 $0 $0 $0 $0
7 Change in MSPERS $0 $0 $0 $0 $0 $0 $0
8 Change in Health Care Insurance $0 $0 $0 $0 $0 $0 $0
9 Wage Increment $0 $0 $0 $0 $0 $0 $0
10 Unemployment Costs $0 $0 $0 $0 $0 $0 $0
11 Workers Compensation $0 $0 $0 $0 $0 $0 $0
12 Wage Concessions $0 $0 $0 $0 $0 $0 $0
13 One Time School Closure Allocation $0 $0 $0 $0 $0 $0 $0
14 Change in Purchased Services, Supplies and Textbooks $0 $0 $0 $0 $0 $0 $0
15 Change in Capital Outlay $0 $0 $0 $0 $0 $0 $0
16 Program Costs $0 $0 $0 $0 $0 $0 $0
17 Dual Enrollment $0 $0 $0 $0 $0 $0 $0
18 Second Chance Alternative Program $0 $0 $0 $0 $0 $0 $0
19 Other - Part-Time and Temporary Salaries $0 $0 $0 $0 $0 $0 $0
20 Other - FICA $0 $0 $0 $0 $0 $0 $0
21 Other $0 $0 $0 $0 $0 $0 $0
22 Other $0 $0 $0 $0 $0 $0 $0
23 Other $0 $0 $0 $0 $0 $0 $0
24 Total $0 $0 $0 $0 $0 $0 $0
Check Figure from Instruction tab Column N $0 $0 $0 $0 $0 $0 $0
Difference (needs to be zero) $0 $0 $0 $0 $0 $0 $0
Notes:

Detail of Changes in the Instruction Function from Prior Year
Reconciliation from 2018-19 to 2019-20
Impact of Changes In Instructional Spending
Basic Inst
111-113 Pre School 118
Summer School
119 Special Ed 122
Other Added
Needs 125,127 Adult Ed 13x Total
Lines 1-4 below refer to staffing cuts and should be entered as negative numbers
1 Staffing Decrease - # of Teaching FTE lost due to Attrition/Retirement 0.00 0.00 0.00 0.00 0.00 0.00 0.00
2 Staffing Decrease - # of Teaching FTE lost due to Layoff 0.00 0.00 0.00 0.00 0.00 0.00 0.00
3 Staffing Decrease - # of Other Non Teaching Classroom FTE Reduced 0.00 0.00 0.00 0.00 0.00 0.00 0.00
4 Salary Savings From Staffing Decrease $0 $0 $0 $0 $0 $0 $0
Lines 5-6 below refer to staffing additions and should be entered as positive numbers
5 Staffing Increase - # of Teaching FTE added 0.00 0.00 0.00 0.00 0.00 0.00 0.00
6 Additional Salaries From Staffing Increase $0 $0 $0 $0 $0 $0 $0
7 Change in MSPERS $0 $0 $0 $0 $0 $0 $0
8 Change in Health Care Insurance $0 $0 $0 $0 $0 $0 $0
9 Wage Increment $0 $0 $0 $0 $0 $0 $0
10 Unemployment Costs $0 $0 $0 $0 $0 $0 $0
11 Workers Compensation $0 $0 $0 $0 $0 $0 $0
12 Wage Concessions $0 $0 $0 $0 $0 $0 $0
13 One Time School Closure Allocation $0 $0 $0 $0 $0 $0 $0
14 Change in Purchased Services, Supplies and Textbooks $0 $0 $0 $0 $0 $0 $0
15 Change in Capital Outlay $0 $0 $0 $0 $0 $0 $0
16 Program Costs $0 $0 $0 $0 $0 $0 $0
17 Dual Enrollment $0 $0 $0 $0 $0 $0 $0
18 Second Chance Alternative Program $0 $0 $0 $0 $0 $0 $0
19 Other - Part-Time and Temporary Salaries $0 $0 $0 $0 $0 $0 $0
20 Other - FICA $0 $0 $0 $0 $0 $0 $0
21 Other $0 $0 $0 $0 $0 $0 $0
22 Other $0 $0 $0 $0 $0 $0 $0
23 Other $0 $0 $0 $0 $0 $0 $0
24 Total $0 $0 $0 $0 $0 $0 $0
Check Figure from Instruction tab Column Q $0 $0 $0 $0 $0 $0 $0
Difference (needs to be zero) $0 $0 $0 $0 $0 $0 $0
Notes:
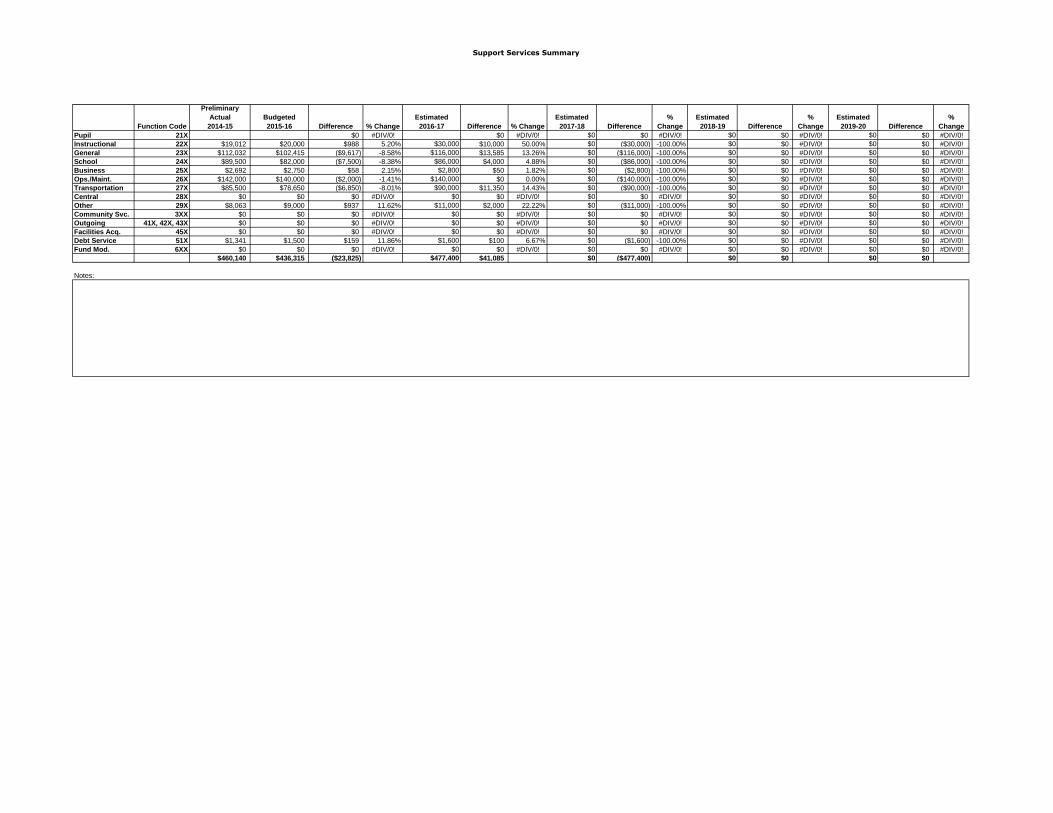
Support Services Summary
Function Code
Preliminary
Actual
2014-15
Budgeted
2015-16 Difference % Change
Estimated
2016-17 Difference % Change
Estimated
2017-18 Difference
%
Change
Estimated
2018-19 Difference
%
Change
Estimated
2019-20 Difference
%
Change
Pupil 21X $0 #DIV/0! $0 #DIV/0! $0 $0 #DIV/0! $0 $0 #DIV/0! $0 $0 #DIV/0!
Instructional 22X $19,012 $20,000 $988 5.20% $30,000 $10,000 50.00% $0 ($30,000) -100.00% $0 $0 #DIV/0! $0 $0 #DIV/0!
General 23X $112,032 $102,415 ($9,617) -8.58% $116,000 $13,585 13.26% $0 ($116,000) -100.00% $0 $0 #DIV/0! $0 $0 #DIV/0!
School 24X $89,500 $82,000 ($7,500) -8.38% $86,000 $4,000 4.88% $0 ($86,000) -100.00% $0 $0 #DIV/0! $0 $0 #DIV/0!
Business 25X $2,692 $2,750 $58 2.15% $2,800 $50 1.82% $0 ($2,800) -100.00% $0 $0 #DIV/0! $0 $0 #DIV/0!
Ops./Maint. 26X $142,000 $140,000 ($2,000) -1.41% $140,000 $0 0.00% $0 ($140,000) -100.00% $0 $0 #DIV/0! $0 $0 #DIV/0!
Transportation 27X $85,500 $78,650 ($6,850) -8.01% $90,000 $11,350 14.43% $0 ($90,000) -100.00% $0 $0 #DIV/0! $0 $0 #DIV/0!
Central 28X $0 $0 $0 #DIV/0! $0 $0 #DIV/0! $0 $0 #DIV/0! $0 $0 #DIV/0! $0 $0 #DIV/0!
Other 29X $8,063 $9,000 $937 11.62% $11,000 $2,000 22.22% $0 ($11,000) -100.00% $0 $0 #DIV/0! $0 $0 #DIV/0!
Community Svc. 3XX $0 $0 $0 #DIV/0! $0 $0 #DIV/0! $0 $0 #DIV/0! $0 $0 #DIV/0! $0 $0 #DIV/0!
Outgoing 41X, 42X, 43X $0 $0 $0 #DIV/0! $0 $0 #DIV/0! $0 $0 #DIV/0! $0 $0 #DIV/0! $0 $0 #DIV/0!
Facilities Acq. 45X $0 $0 $0 #DIV/0! $0 $0 #DIV/0! $0 $0 #DIV/0! $0 $0 #DIV/0! $0 $0 #DIV/0!
Debt Service 51X $1,341 $1,500 $159 11.86% $1,600 $100 6.67% $0 ($1,600) -100.00% $0 $0 #DIV/0! $0 $0 #DIV/0!
Fund Mod. 6XX $0 $0 $0 #DIV/0! $0 $0 #DIV/0! $0 $0 #DIV/0! $0 $0 #DIV/0! $0 $0 #DIV/0!
$460,140 $436,315 ($23,825) $477,400 $41,085 $0 ($477,400) $0 $0 $0 $0
Notes:
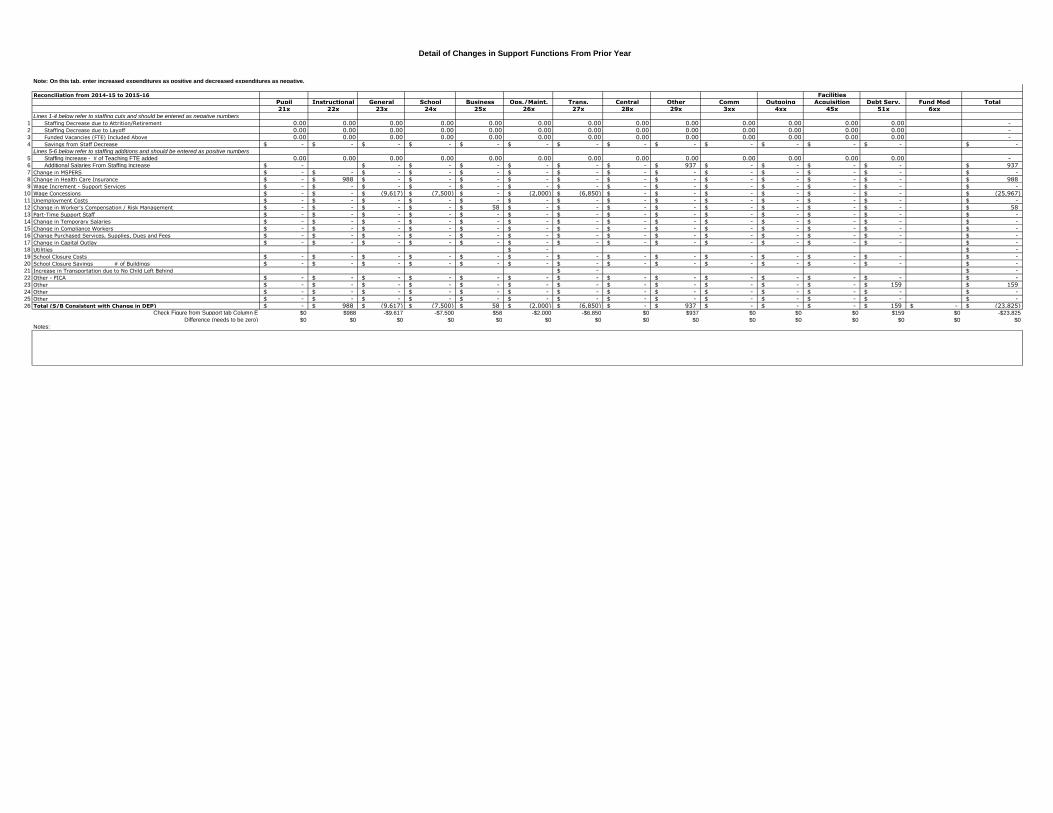
Detail of Changes in Support Functions From Prior Year
Note: On this tab, enter increased expenditures as positive and decreased expenditures as negative.
Reconciliation from 2014-15 to 2015-16 Facilities
Pupil Instructional General School Business Ops./Maint. Trans. Central Other Comm Outgoing Acquisition Debt Serv. Fund Mod Total
21x 22x 23x 24x 25x 26x 27x 28x 29x 3xx 4xx 45x 51x 6xx
Lines 1-4 below refer to staffing cuts and should be entered as negative numbers
1 Staffing Decrease due to Attrition/Retirement 0.00 0.00 0.00 0.00 0.00 0.00 0.00 0.00 0.00 0.00 0.00 0.00 0.00 -
2 Staffing Decrease due to Layoff 0.00 0.00 0.00 0.00 0.00 0.00 0.00 0.00 0.00 0.00 0.00 0.00 0.00 -
3 Funded Vacancies (FTE) Included Above 0.00 0.00 0.00 0.00 0.00 0.00 0.00 0.00 0.00 0.00 0.00 0.00 0.00 -
4 Savings from Staff Decrease -$ -$ -$ -$ -$ -$ -$ -$ -$ -$ -$ -$ -$ -$
Lines 5-6 below refer to staffing additions and should be entered as positive numbers
5 Staffing Increase - # of Teaching FTE added 0.00 0.00 0.00 0.00 0.00 0.00 0.00 0.00 0.00 0.00 0.00 0.00 0.00 -
6 Additional Salaries From Staffing Increase -$ -$ -$ -$ -$ -$ -$ 937$ -$ -$ -$ -$ 937$
7 Change in MSPERS -$ -$ -$ -$ -$ -$ -$ -$ -$ -$ -$ -$ -$ -$
8 Change in Health Care Insurance -$ 988$ -$ -$ -$ -$ -$ -$ -$ -$ -$ -$ -$ 988$
9 Wage Increment - Support Services -$ -$ -$ -$ -$ -$ -$ -$ -$ -$ -$ -$ -$ -$
10 Wage Concessions -$ -$ (9,617)$ (7,500)$ -$ (2,000)$ (6,850)$ -$ -$ -$ -$ -$ -$ (25,967)$
11 Unemployment Costs -$ -$ -$ -$ -$ -$ -$ -$ -$ -$ -$ -$ -$ -$
12 Change in Worker's Compensation / Risk Management -$ -$ -$ -$ 58$ -$ -$ -$ -$ -$ -$ -$ -$ 58$
13 Part-Time Support Staff -$ -$ -$ -$ -$ -$ -$ -$ -$ -$ -$ -$ -$ -$
14 Change in Temporary Salaries -$ -$ -$ -$ -$ -$ -$ -$ -$ -$ -$ -$ -$ -$
15 Change in Compliance Workers -$ -$ -$ -$ -$ -$ -$ -$ -$ -$ -$ -$ -$ -$
16 Change Purchased Services, Supplies, Dues and Fees -$ -$ -$ -$ -$ -$ -$ -$ -$ -$ -$ -$ -$ -$
17 Change in Capital Outlay -$ -$ -$ -$ -$ -$ -$ -$ -$ -$ -$ -$ -$ -$
18 Utilities -$ -$
19 School Closure Costs -$ -$ -$ -$ -$ -$ -$ -$ -$ -$ -$ -$ -$ -$
20 School Closure Savings # of Buildings -$ -$ -$ -$ -$ -$ -$ -$ -$ -$ -$ -$ -$ -$
21 Increase in Transportation due to No Child Left Behind -$ -$
22 Other - FICA -$ -$ -$ -$ -$ -$ -$ -$ -$ -$ -$ -$ -$ -$
23 Other -$ -$ -$ -$ -$ -$ -$ -$ -$ -$ -$ -$ 159$ 159$
24 Other -$ -$ -$ -$ -$ -$ -$ -$ -$ -$ -$ -$ -$ -$
25 Other -$ -$ -$ -$ -$ -$ -$ -$ -$ -$ -$ -$ -$ -$
26 Total (S/B Consistent with Change in DEP) -$ 988$ (9,617)$ (7,500)$ 58$ (2,000)$ (6,850)$ -$ 937$ -$ -$ -$ 159$ -$ (23,825)$ Check Figure from Support tab Column E $0 $988 -$9,617 -$7,500 $58 -$2,000 -$6,850 $0 $937 $0 $0 $0 $159 $0 -$23,825
Difference (needs to be zero) $0 $0 $0 $0 $0 $0 $0 $0 $0 $0 $0 $0 $0 $0 $0
Notes:
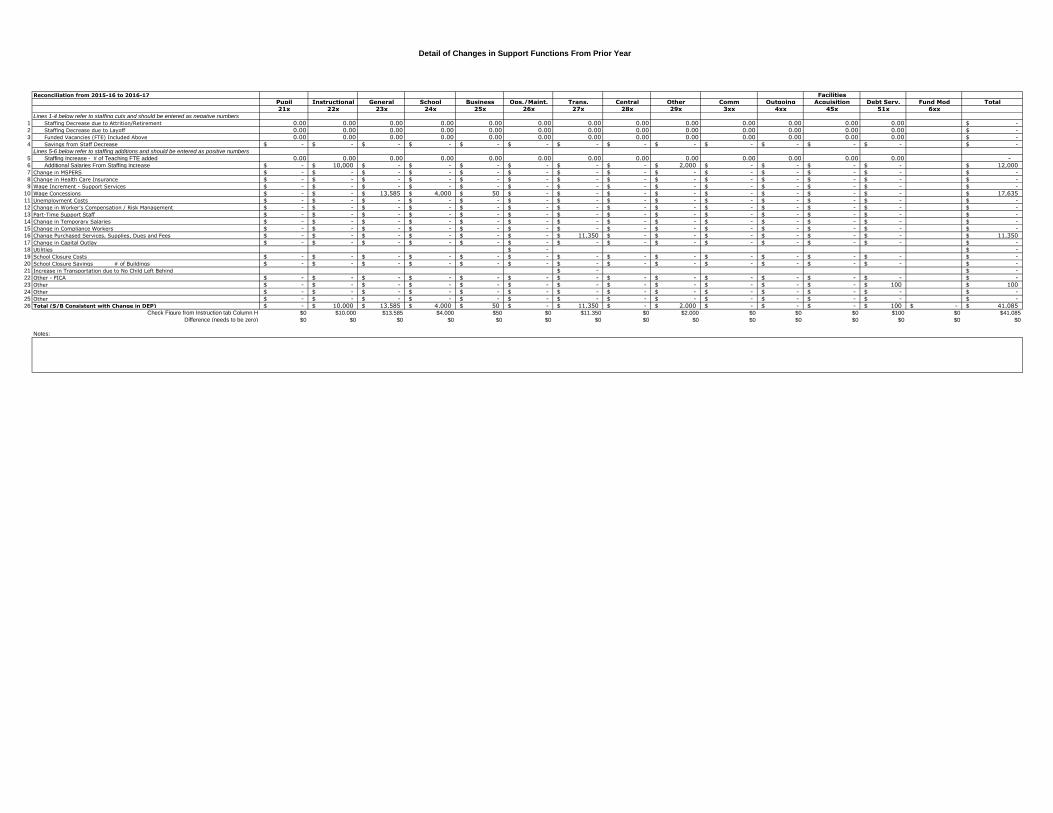
Detail of Changes in Support Functions From Prior Year
Reconciliation from 2015-16 to 2016-17 Facilities
Pupil Instructional General School Business Ops./Maint. Trans. Central Other Comm Outgoing Acquisition Debt Serv. Fund Mod Total
21x 22x 23x 24x 25x 26x 27x 28x 29x 3xx 4xx 45x 51x 6xx
Lines 1-4 below refer to staffing cuts and should be entered as negative numbers
1 Staffing Decrease due to Attrition/Retirement 0.00 0.00 0.00 0.00 0.00 0.00 0.00 0.00 0.00 0.00 0.00 0.00 0.00 -$
2 Staffing Decrease due to Layoff 0.00 0.00 0.00 0.00 0.00 0.00 0.00 0.00 0.00 0.00 0.00 0.00 0.00 -$
3 Funded Vacancies (FTE) Included Above 0.00 0.00 0.00 0.00 0.00 0.00 0.00 0.00 0.00 0.00 0.00 0.00 0.00 -$
4 Savings from Staff Decrease -$ -$ -$ -$ -$ -$ -$ -$ -$ -$ -$ -$ -$ -$
Lines 5-6 below refer to staffing additions and should be entered as positive numbers
5 Staffing Increase - # of Teaching FTE added 0.00 0.00 0.00 0.00 0.00 0.00 0.00 0.00 0.00 0.00 0.00 0.00 0.00 -
6 Additional Salaries From Staffing Increase -$ 10,000$ -$ -$ -$ -$ -$ -$ 2,000$ -$ -$ -$ -$ 12,000$
7 Change in MSPERS -$ -$ -$ -$ -$ -$ -$ -$ -$ -$ -$ -$ -$ -$
8 Change in Health Care Insurance -$ -$ -$ -$ -$ -$ -$ -$ -$ -$ -$ -$ -$ -$
9 Wage Increment - Support Services -$ -$ -$ -$ -$ -$ -$ -$ -$ -$ -$ -$ -$ -$
10 Wage Concessions -$ -$ 13,585$ 4,000$ 50$ -$ -$ -$ -$ -$ -$ -$ -$ 17,635$
11 Unemployment Costs -$ -$ -$ -$ -$ -$ -$ -$ -$ -$ -$ -$ -$ -$
12 Change in Worker's Compensation / Risk Management -$ -$ -$ -$ -$ -$ -$ -$ -$ -$ -$ -$ -$ -$
13 Part-Time Support Staff -$ -$ -$ -$ -$ -$ -$ -$ -$ -$ -$ -$ -$ -$
14 Change in Temporary Salaries -$ -$ -$ -$ -$ -$ -$ -$ -$ -$ -$ -$ -$ -$
15 Change in Compliance Workers -$ -$ -$ -$ -$ -$ -$ -$ -$ -$ -$ -$ -$ -$
16 Change Purchased Services, Supplies, Dues and Fees -$ -$ -$ -$ -$ -$ 11,350$ -$ -$ -$ -$ -$ -$ 11,350$
17 Change in Capital Outlay -$ -$ -$ -$ -$ -$ -$ -$ -$ -$ -$ -$ -$ -$
18 Utilities -$ -$
19 School Closure Costs -$ -$ -$ -$ -$ -$ -$ -$ -$ -$ -$ -$ -$ -$
20 School Closure Savings # of Buildings -$ -$ -$ -$ -$ -$ -$ -$ -$ -$ -$ -$ -$ -$
21 Increase in Transportation due to No Child Left Behind -$ -$
22 Other - FICA -$ -$ -$ -$ -$ -$ -$ -$ -$ -$ -$ -$ -$ -$
23 Other -$ -$ -$ -$ -$ -$ -$ -$ -$ -$ -$ -$ 100$ 100$
24 Other -$ -$ -$ -$ -$ -$ -$ -$ -$ -$ -$ -$ -$ -$
25 Other -$ -$ -$ -$ -$ -$ -$ -$ -$ -$ -$ -$ -$ -$
26 Total (S/B Consistent with Change in DEP) -$ 10,000$ 13,585$ 4,000$ 50$ -$ 11,350$ -$ 2,000$ -$ -$ -$ 100$ -$ 41,085$ Check Figure from Instruction tab Column H $0 $10,000 $13,585 $4,000 $50 $0 $11,350 $0 $2,000 $0 $0 $0 $100 $0 $41,085
Difference (needs to be zero) $0 $0 $0 $0 $0 $0 $0 $0 $0 $0 $0 $0 $0 $0 $0
Notes:

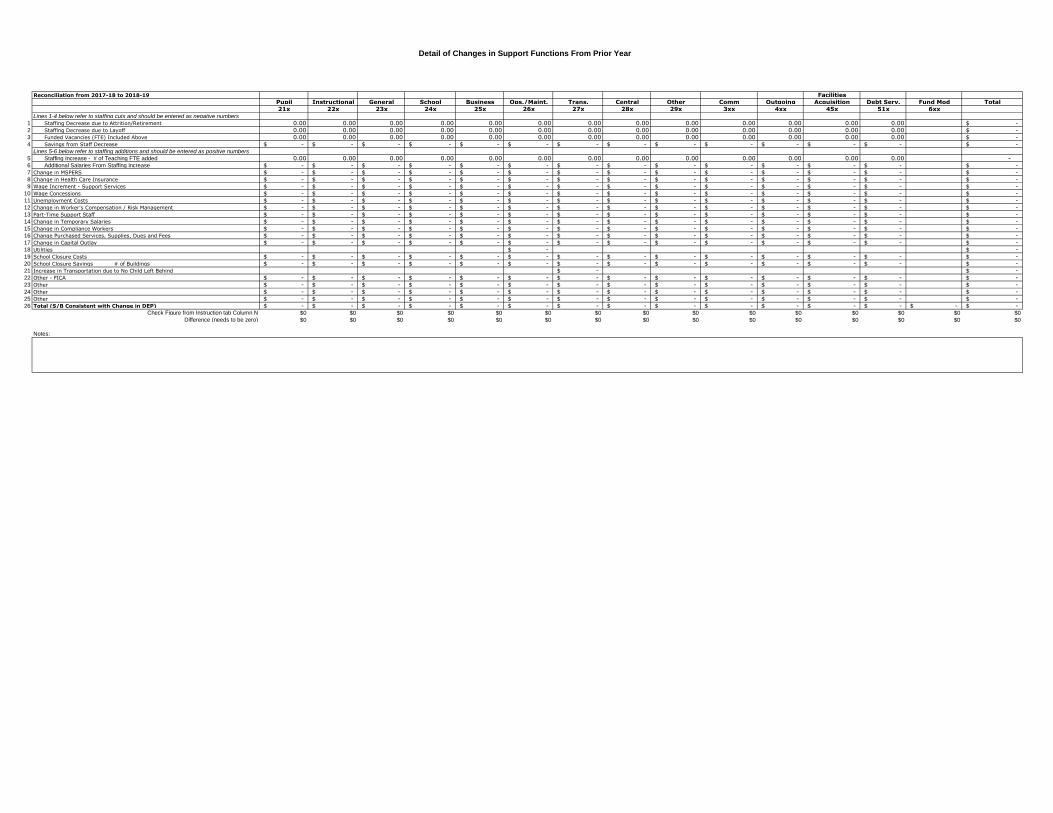
Detail of Changes in Support Functions From Prior Year
Reconciliation from 2016-17 to 2017-18 Facilities
Pupil Instructional General School Business Ops./Maint. Trans. Central Other Comm Outgoing Acquisition Debt Serv. Fund Mod Total
21x 22x 23x 24x 25x 26x 27x 28x 29x 3xx 4xx 45x 51x 6xx
Lines 1-4 below refer to staffing cuts and should be entered as negative numbers
1 Staffing Decrease due to Attrition/Retirement 0.00 0.00 0.00 0.00 0.00 0.00 0.00 0.00 0.00 0.00 0.00 0.00 0.00 -$
2 Staffing Decrease due to Layoff 0.00 0.00 0.00 0.00 0.00 0.00 0.00 0.00 0.00 0.00 0.00 0.00 0.00 -$
3 Funded Vacancies (FTE) Included Above 0.00 0.00 0.00 0.00 0.00 0.00 0.00 0.00 0.00 0.00 0.00 0.00 0.00 -$
4 Savings from Staff Decrease -$ -$ -$ -$ -$ -$ -$ -$ -$ -$ -$ -$ -$ -$
Lines 5-6 below refer to staffing additions and should be entered as positive numbers
5 Staffing Increase - # of Teaching FTE added 0.00 0.00 0.00 0.00 0.00 0.00 0.00 0.00 0.00 0.00 0.00 0.00 0.00 -
6 Additional Salaries From Staffing Increase -$ -$ -$ -$ -$ -$ -$ -$ -$ -$ -$ -$ -$ -$
7 Change in MSPERS -$ -$ -$ -$ -$ -$ -$ -$ -$ -$ -$ -$ -$ -$
8 Change in Health Care Insurance -$ -$ -$ -$ -$ -$ -$ -$ -$ -$ -$ -$ -$ -$
9 Wage Increment - Support Services -$ -$ -$ -$ -$ -$ -$ -$ -$ -$ -$ -$ -$ -$
10 Wage Concessions -$ -$ -$ -$ -$ -$ -$ -$ -$ -$ -$ -$ -$ -$
11 Unemployment Costs -$ -$ -$ -$ -$ -$ -$ -$ -$ -$ -$ -$ -$ -$
12 Change in Worker's Compensation / Risk Management -$ -$ -$ -$ -$ -$ -$ -$ -$ -$ -$ -$ -$ -$
13 Part-Time Support Staff -$ -$ -$ -$ -$ -$ -$ -$ -$ -$ -$ -$ -$ -$
14 Change in Temporary Salaries -$ -$ -$ -$ -$ -$ -$ -$ -$ -$ -$ -$ -$ -$
15 Change in Compliance Workers -$ -$ -$ -$ -$ -$ -$ -$ -$ -$ -$ -$ -$ -$
16 Change Purchased Services, Supplies, Dues and Fees -$ -$ -$ -$ -$ -$ -$ -$ -$ -$ -$ -$ -$ -$
17 Change in Capital Outlay -$ -$ -$ -$ -$ -$ -$ -$ -$ -$ -$ -$ -$ -$
18 Utilities -$ -$
19 School Closure Costs -$ -$ -$ -$ -$ -$ -$ -$ -$ -$ -$ -$ -$ -$
20 School Closure Savings # of Buildings -$ -$ -$ -$ -$ -$ -$ -$ -$ -$ -$ -$ -$ -$
21 Increase in Transportation due to No Child Left Behind -$ -$
22 Other - FICA -$ -$ -$ -$ -$ -$ -$ -$ -$ -$ -$ -$ -$ -$
23 Other -$ -$ -$ -$ -$ -$ -$ -$ -$ -$ -$ -$ -$ -$
24 Other -$ -$ -$ -$ -$ -$ -$ -$ -$ -$ -$ -$ -$ -$
25 Other -$ -$ -$ -$ -$ -$ -$ -$ -$ -$ -$ -$ -$ -$
26 Total (S/B Consistent with Change in DEP) -$ -$ -$ -$ -$ -$ -$ -$ -$ -$ -$ -$ -$ -$ -$ Check Figure from Instruction tab Column K $0 -$30,000 -$116,000 -$86,000 -$2,800 -$140,000 -$90,000 $0 -$11,000 $0 $0 $0 -$1,600 $0 -$477,400
Difference (needs to be zero) $0 $30,000 $116,000 $86,000 $2,800 $140,000 $90,000 $0 $11,000 $0 $0 $0 $1,600 $0 $477,400
Notes:
Detail of Changes in Support Functions From Prior Year
Reconciliation from 2017-18 to 2018-19 Facilities
Pupil Instructional General School Business Ops./Maint. Trans. Central Other Comm Outgoing Acquisition Debt Serv. Fund Mod Total
21x 22x 23x 24x 25x 26x 27x 28x 29x 3xx 4xx 45x 51x 6xx
Lines 1-4 below refer to staffing cuts and should be entered as negative numbers
1 Staffing Decrease due to Attrition/Retirement 0.00 0.00 0.00 0.00 0.00 0.00 0.00 0.00 0.00 0.00 0.00 0.00 0.00 -$
2 Staffing Decrease due to Layoff 0.00 0.00 0.00 0.00 0.00 0.00 0.00 0.00 0.00 0.00 0.00 0.00 0.00 -$
3 Funded Vacancies (FTE) Included Above 0.00 0.00 0.00 0.00 0.00 0.00 0.00 0.00 0.00 0.00 0.00 0.00 0.00 -$
4 Savings from Staff Decrease -$ -$ -$ -$ -$ -$ -$ -$ -$ -$ -$ -$ -$ -$
Lines 5-6 below refer to staffing additions and should be entered as positive numbers
5 Staffing Increase - # of Teaching FTE added 0.00 0.00 0.00 0.00 0.00 0.00 0.00 0.00 0.00 0.00 0.00 0.00 0.00 -
6 Additional Salaries From Staffing Increase -$ -$ -$ -$ -$ -$ -$ -$ -$ -$ -$ -$ -$ -$
7 Change in MSPERS -$ -$ -$ -$ -$ -$ -$ -$ -$ -$ -$ -$ -$ -$
8 Change in Health Care Insurance -$ -$ -$ -$ -$ -$ -$ -$ -$ -$ -$ -$ -$ -$
9 Wage Increment - Support Services -$ -$ -$ -$ -$ -$ -$ -$ -$ -$ -$ -$ -$ -$
10 Wage Concessions -$ -$ -$ -$ -$ -$ -$ -$ -$ -$ -$ -$ -$ -$
11 Unemployment Costs -$ -$ -$ -$ -$ -$ -$ -$ -$ -$ -$ -$ -$ -$
12 Change in Worker's Compensation / Risk Management -$ -$ -$ -$ -$ -$ -$ -$ -$ -$ -$ -$ -$ -$
13 Part-Time Support Staff -$ -$ -$ -$ -$ -$ -$ -$ -$ -$ -$ -$ -$ -$
14 Change in Temporary Salaries -$ -$ -$ -$ -$ -$ -$ -$ -$ -$ -$ -$ -$ -$
15 Change in Compliance Workers -$ -$ -$ -$ -$ -$ -$ -$ -$ -$ -$ -$ -$ -$
16 Change Purchased Services, Supplies, Dues and Fees -$ -$ -$ -$ -$ -$ -$ -$ -$ -$ -$ -$ -$ -$
17 Change in Capital Outlay -$ -$ -$ -$ -$ -$ -$ -$ -$ -$ -$ -$ -$ -$
18 Utilities -$ -$
19 School Closure Costs -$ -$ -$ -$ -$ -$ -$ -$ -$ -$ -$ -$ -$ -$
20 School Closure Savings # of Buildings -$ -$ -$ -$ -$ -$ -$ -$ -$ -$ -$ -$ -$ -$
21 Increase in Transportation due to No Child Left Behind -$ -$
22 Other - FICA -$ -$ -$ -$ -$ -$ -$ -$ -$ -$ -$ -$ -$ -$
23 Other -$ -$ -$ -$ -$ -$ -$ -$ -$ -$ -$ -$ -$ -$
24 Other -$ -$ -$ -$ -$ -$ -$ -$ -$ -$ -$ -$ -$ -$
25 Other -$ -$ -$ -$ -$ -$ -$ -$ -$ -$ -$ -$ -$ -$
26 Total (S/B Consistent with Change in DEP) -$ -$ -$ -$ -$ -$ -$ -$ -$ -$ -$ -$ -$ -$ -$ Check Figure from Instruction tab Column N $0 $0 $0 $0 $0 $0 $0 $0 $0 $0 $0 $0 $0 $0 $0
Difference (needs to be zero) $0 $0 $0 $0 $0 $0 $0 $0 $0 $0 $0 $0 $0 $0 $0
Notes:

Detail of Changes in Support Functions From Prior Year
Reconciliation from 2018-19 to 2019-20 Facilities
Pupil Instructional General School Business Ops./Maint. Trans. Central Other Comm Outgoing Acquisition Debt Serv. Fund Mod Total
21x 22x 23x 24x 25x 26x 27x 28x 29x 3xx 4xx 45x 51x 6xx
Lines 1-4 below refer to staffing cuts and should be entered as negative numbers
1 Staffing Decrease due to Attrition/Retirement 0.00 0.00 0.00 0.00 0.00 0.00 0.00 0.00 0.00 0.00 0.00 0.00 0.00 -$
2 Staffing Decrease due to Layoff 0.00 0.00 0.00 0.00 0.00 0.00 0.00 0.00 0.00 0.00 0.00 0.00 0.00 -$
3 Funded Vacancies (FTE) Included Above 0.00 0.00 0.00 0.00 0.00 0.00 0.00 0.00 0.00 0.00 0.00 0.00 0.00 -$
4 Savings from Staff Decrease -$ -$ -$ -$ -$ -$ -$ -$ -$ -$ -$ -$ -$ -$
Lines 5-6 below refer to staffing additions and should be entered as positive numbers
5 Staffing Increase - # of Teaching FTE added 0.00 0.00 0.00 0.00 0.00 0.00 0.00 0.00 0.00 0.00 0.00 0.00 0.00 -
6 Additional Salaries From Staffing Increase -$ -$ -$ -$ -$ -$ -$ -$ -$ -$ -$ -$ -$ -$
7 Change in MSPERS -$ -$ -$ -$ -$ -$ -$ -$ -$ -$ -$ -$ -$ -$
8 Change in Health Care Insurance -$ -$ -$ -$ -$ -$ -$ -$ -$ -$ -$ -$ -$ -$
9 Wage Increment - Support Services -$ -$ -$ -$ -$ -$ -$ -$ -$ -$ -$ -$ -$ -$
10 Wage Concessions -$ -$ -$ -$ -$ -$ -$ -$ -$ -$ -$ -$ -$ -$
11 Unemployment Costs -$ -$ -$ -$ -$ -$ -$ -$ -$ -$ -$ -$ -$ -$
12 Change in Worker's Compensation / Risk Management -$ -$ -$ -$ -$ -$ -$ -$ -$ -$ -$ -$ -$ -$
13 Part-Time Support Staff -$ -$ -$ -$ -$ -$ -$ -$ -$ -$ -$ -$ -$ -$
14 Change in Temporary Salaries -$ -$ -$ -$ -$ -$ -$ -$ -$ -$ -$ -$ -$ -$
15 Change in Compliance Workers -$ -$ -$ -$ -$ -$ -$ -$ -$ -$ -$ -$ -$ -$
16 Change Purchased Services, Supplies, Dues and Fees -$ -$ -$ -$ -$ -$ -$ -$ -$ -$ -$ -$ -$ -$
17 Change in Capital Outlay -$ -$ -$ -$ -$ -$ -$ -$ -$ -$ -$ -$ -$ -$
18 Utilities -$ -$
19 School Closure Costs -$ -$ -$ -$ -$ -$ -$ -$ -$ -$ -$ -$ -$ -$
20 School Closure Savings # of Buildings -$ -$ -$ -$ -$ -$ -$ -$ -$ -$ -$ -$ -$ -$
21 Increase in Transportation due to No Child Left Behind -$ -$
22 Other - FICA -$ -$ -$ -$ -$ -$ -$ -$ -$ -$ -$ -$ -$ -$
23 Other -$ -$ -$ -$ -$ -$ -$ -$ -$ -$ -$ -$ -$ -$
24 Other -$ -$ -$ -$ -$ -$ -$ -$ -$ -$ -$ -$ -$ -$
25 Other -$ -$ -$ -$ -$ -$ -$ -$ -$ -$ -$ -$ -$ -$
26 Total (S/B Consistent with Change in DEP) -$ -$ -$ -$ -$ -$ -$ -$ -$ -$ -$ -$ -$ -$ -$ Check Figure from Instruction tab Column Q $0 $0 $0 $0 $0 $0 $0 $0 $0 $0 $0 $0 $0 $0 $0
Difference (needs to be zero) $0 $0 $0 $0 $0 $0 $0 $0 $0 $0 $0 $0 $0 $0 $0
Notes:
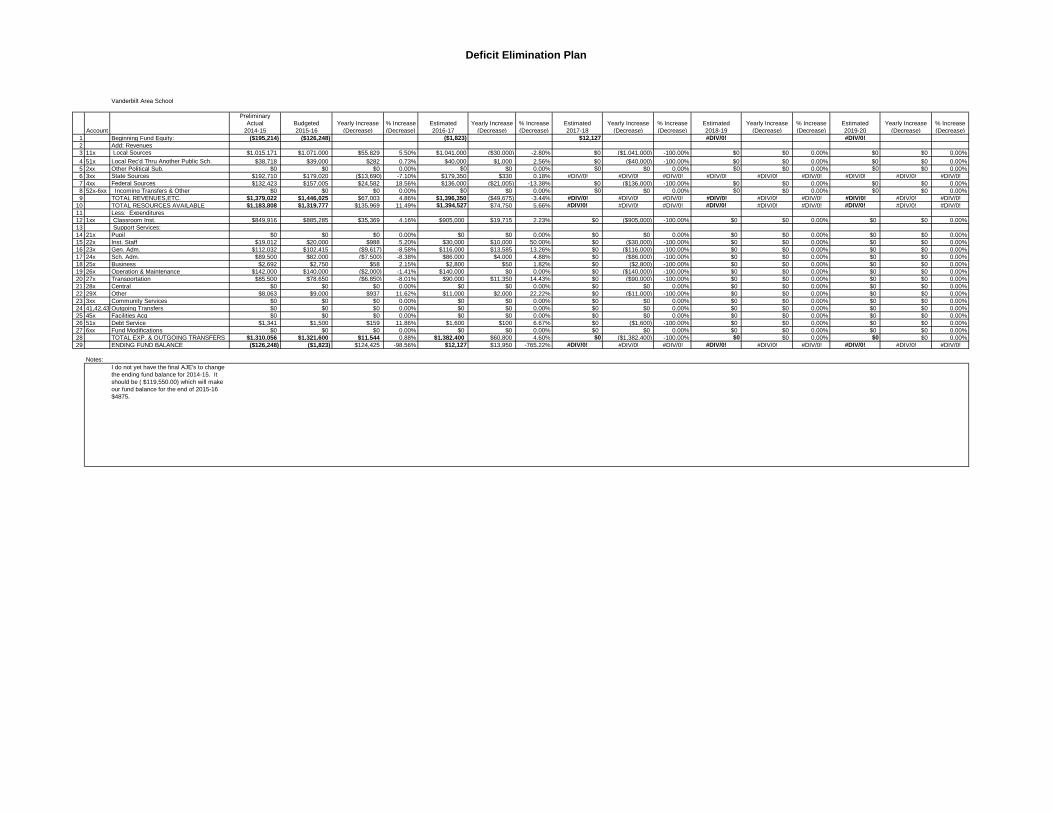
Deficit Elimination Plan
Vanderbilt Area School
Account
Preliminary
Actual
2014-15
Budgeted
2015-16
Yearly Increase
(Decrease)
% Increase
(Decrease)
Estimated
2016-17
Yearly Increase
(Decrease)
% Increase
(Decrease)
Estimated
2017-18
Yearly Increase
(Decrease)
% Increase
(Decrease)
Estimated
2018-19
Yearly Increase
(Decrease)
% Increase
(Decrease)
Estimated
2019-20
Yearly Increase
(Decrease)
% Increase
(Decrease)
1 Beginning Fund Equity: ($195,214) ($126,248) ($1,823) $12,127 #DIV/0! #DIV/0!
2 Add: Revenues
3 11x Local Sources $1,015,171 $1,071,000 $55,829 5.50% $1,041,000 ($30,000) -2.80% $0 ($1,041,000) -100.00% $0 $0 0.00% $0 $0 0.00%
4 51x Local Rec'd Thru Another Public Sch. $38,718 $39,000 $282 0.73% $40,000 $1,000 2.56% $0 ($40,000) -100.00% $0 $0 0.00% $0 $0 0.00%
5 2xx Other Political Sub. $0 $0 $0 0.00% $0 $0 0.00% $0 $0 0.00% $0 $0 0.00% $0 $0 0.00%
6 3xx State Sources $192,710 $179,020 ($13,690) -7.10% $179,350 $330 0.18% #DIV/0! #DIV/0! #DIV/0! #DIV/0! #DIV/0! #DIV/0! #DIV/0! #DIV/0! #DIV/0!
7 4xx Federal Sources $132,423 $157,005 $24,582 18.56% $136,000 ($21,005) -13.38% $0 ($136,000) -100.00% $0 $0 0.00% $0 $0 0.00%
8 52x-6xx Incoming Transfers & Other $0 $0 $0 0.00% $0 $0 0.00% $0 $0 0.00% $0 $0 0.00% $0 $0 0.00%
9 TOTAL REVENUES,ETC. $1,379,022 $1,446,025 $67,003 4.86% $1,396,350 ($49,675) -3.44% #DIV/0! #DIV/0! #DIV/0! #DIV/0! #DIV/0! #DIV/0! #DIV/0! #DIV/0! #DIV/0!
10 TOTAL RESOURCES AVAILABLE $1,183,808 $1,319,777 $135,969 11.49% $1,394,527 $74,750 5.66% #DIV/0! #DIV/0! #DIV/0! #DIV/0! #DIV/0! #DIV/0! #DIV/0! #DIV/0! #DIV/0!
11 Less: Expenditures
12 1xx Classroom Inst. $849,916 $885,285 $35,369 4.16% $905,000 $19,715 2.23% $0 ($905,000) -100.00% $0 $0 0.00% $0 $0 0.00%
13 Support Services:
14 21x Pupil $0 $0 $0 0.00% $0 $0 0.00% $0 $0 0.00% $0 $0 0.00% $0 $0 0.00%
15 22x Inst. Staff $19,012 $20,000 $988 5.20% $30,000 $10,000 50.00% $0 ($30,000) -100.00% $0 $0 0.00% $0 $0 0.00%
16 23x Gen. Adm. $112,032 $102,415 ($9,617) -8.58% $116,000 $13,585 13.26% $0 ($116,000) -100.00% $0 $0 0.00% $0 $0 0.00%
17 24x Sch. Adm. $89,500 $82,000 ($7,500) -8.38% $86,000 $4,000 4.88% $0 ($86,000) -100.00% $0 $0 0.00% $0 $0 0.00%
18 25x Business $2,692 $2,750 $58 2.15% $2,800 $50 1.82% $0 ($2,800) -100.00% $0 $0 0.00% $0 $0 0.00%
19 26x Operation & Maintenance $142,000 $140,000 ($2,000) -1.41% $140,000 $0 0.00% $0 ($140,000) -100.00% $0 $0 0.00% $0 $0 0.00%
20 27x Transportation $85,500 $78,650 ($6,850) -8.01% $90,000 $11,350 14.43% $0 ($90,000) -100.00% $0 $0 0.00% $0 $0 0.00%
21 28x Central $0 $0 $0 0.00% $0 $0 0.00% $0 $0 0.00% $0 $0 0.00% $0 $0 0.00%
22 29X Other $8,063 $9,000 $937 11.62% $11,000 $2,000 22.22% $0 ($11,000) -100.00% $0 $0 0.00% $0 $0 0.00%
23 3xx Community Services $0 $0 $0 0.00% $0 $0 0.00% $0 $0 0.00% $0 $0 0.00% $0 $0 0.00%
24 41,42,43,49Outgoing Transfers $0 $0 $0 0.00% $0 $0 0.00% $0 $0 0.00% $0 $0 0.00% $0 $0 0.00%
25 45x Facilities Acq $0 $0 $0 0.00% $0 $0 0.00% $0 $0 0.00% $0 $0 0.00% $0 $0 0.00%
26 51x Debt Service $1,341 $1,500 $159 11.86% $1,600 $100 6.67% $0 ($1,600) -100.00% $0 $0 0.00% $0 $0 0.00%
27 6xx Fund Modifications $0 $0 $0 0.00% $0 $0 0.00% $0 $0 0.00% $0 $0 0.00% $0 $0 0.00%
28 TOTAL EXP. & OUTGOING TRANSFERS $1,310,056 $1,321,600 $11,544 0.88% $1,382,400 $60,800 4.60% $0 ($1,382,400) -100.00% $0 $0 0.00% $0 $0 0.00%
29 ENDING FUND BALANCE ($126,248) ($1,823) $124,425 -98.56% $12,127 $13,950 -765.22% #DIV/0! #DIV/0! #DIV/0! #DIV/0! #DIV/0! #DIV/0! #DIV/0! #DIV/0! #DIV/0!
Notes:
I do not yet have the final AJE's to change
the ending fund balance for 2014-15. It
should be ( $119,550.00) which will make
our fund balance for the end of 2015-16
$4875.

NARRATIVE SECTION
1.
Answer: Support Staff
2.
Answer: Teachers
3.
Answer: None
4.
Answer: Teachers and support staff
5.
Answer: 2015-16 - Teachers 2016-2017 Both Teachers and Support
6.
Answer: Yes - wages have been frozen for both groups for four years
7.
Answer: Yes
8.
Answer: Declining enrollment, retirement and insurance costs
9.
Answer: Eliminate personnel, cut hours , contract for services whenever possible, cut school forest, lease school
property. Pay cuts and freezes
10.
Answer: We have eliminated the Librarian position. Art has becone half time. Wood Shop teacher resigned and is not
being replaced.
11.
Answer: All services ( kitchen, custodial and transportation) have been privatized.
12.
Answer: All steps referred to above.
13.
Answer: please see #10
14.
Answer: Wages frozen, hours cut, wage cuts for administration, clerical and contract employees. We have gone to one
administrator.
15.
Answer: Budget is online @ WWW.vanderbilt.k12.mi.us
16.
Answer: Plan was adopted at the September 9, 2015 meeting.
17.
Answer: All extra curriculars that could be eliminated were gone three years ago
18.
Answer: Yes. Disignated for buildings and grounds.
For which employee groups have negotiations been completed for 2015-16?
For which employee groups have negotiations not been completed for 2015-16?
For which employee groups have negotiations been completed for 2016-17?
For which employee groups have negotiations not been completed for 2016-17?
When is the next year employee negotiations will be open?
Are projected savings from employee negotiations included in 2015-16?
Are projected savings from employee negotiations included in 2016-17?
What factors caused the school district's deficit?
What is the school district's plan to eliminate the deficit?
What subjects or instructional programs is the district proposing to discontinue or curtail?
What support services would be reduced or eliminated?
What specific steps have been initiated to carry out the plan?
List expected savings to be achieved by eliminating specific extra-curricular activities.
Do you have a sinking fund? If so, what is it designated for?
Please give the details of staff reductions for instruction, support services, and community services.
Please give the details of any proposed employee wage concessions. Have any of those concessions been
adopted?
Please submit the most recent board approved budget along with the board resolution with which it was adopted
or provide the URL at which it is located.
Please submit the Board Resolution showing approval of this Deficit Elimination Plan.
NARRATIVE SECTION
19.
Answer: Yes, we are current.
Are you current on payments to MPSERS, health insurance premiums, etc.?