establishing and maintaining fidelity to evidence-based ... · establishing and maintaining...
TRANSCRIPT

Establishing and Maintaining Fidelity to Evidence-Based Practices
Using the CQI Process to Change Agency, Staff, and Offender Behavior
Kimberly Gentry Sperber, Ph.D.Talbert House

Latessa, Cullen, and Gendreau (2002)
� Stated that corrections has resisted becoming a true profession.
� Profession defined by the extent that its practices are based on research.
� Offer analogy of medical malpractice – denotes that there are established standards that must be followed.

Latessa et al. (2002) Continued
� Article notes 4 common failures of correctional programs:
� Failure to use research in designing programs
� Failure to follow appropriate assessment and classification practices
� Failure to use effective treatment models
� Failure to evaluate what we do

CPAI Data as Further Evidence
� Lowenkamp and Latessa (2005)� Examined data from 38 residential correctional programs for adults
� Looked at relationship between program fidelity and program effectiveness.
� Program fidelity was assessed using the CPAI.
� Found significant correlation between fidelity and effectiveness� CPAI scores correlated to reincarceration

Lowenkamp and Latessa Findings
Continued
� Differences in recidivism rates based on CPAI scores:
� Scores of 0-49% demonstrated 1.7%reduction compared to comparison group.
� Scores of 50-59% demonstrated 8.1%reduction.
� Scores of 60-69% demonstrated 22%reduction.
CPAI Data Continued
� Holsinger (1999)� Examined data from Adolescent Community Correctional Facilities in Ohio
� Looked at relationship between program fidelity and program effectiveness.
� Program fidelity was assessed using the CPAI.
� Outcome measures examined included any court contact, felony or misdemeanor, felony, personal offense, and commitment to a secure facility

CPAI Data Continued
� Total composite score significantly correlated with all outcome measures.
� Each individual domain of the CPAI also significantly correlated with all of the outcomes
� Program Implementation
� Client Assessment
� Program Characteristics
� Staff Quality
� Evaluation

CPAI Data Continued
� Hoge, Leschied, and Andrews(1993) reviewed 135 programs assessed by CPAI� 35% received failing score; only 10% received score of satisfactory or better.
� Holsinger and Latessa (1999) reviewed 51 programs assessed by CPAI� 60% scored as satisfactory but needs improvement or unsatisfactory; only 12% scored as very satisfactory.

CPAI Data Continued
� Gendreau and Goggin (2000) reviewed 101 programs assessed by CPAI� Mean score of 25%; only 10% scored received satisfactory score
� Matthews, Hubbard, and Latessa (2001) reviewed 86 programs assessed by CPAI� 54% scored as satisfactory or satisfactory but needs improvement; only 10% scored as very satisfactory.
More Fidelity Research
� Landenberger and Lipsey (2005)� Brand of CBT didn’t matter but quality of implementation did.� Implementation defined as low dropout rate, close monitoring
of quality and fidelity, and adequate training for providers.
� Schoenwald et al. (2003) � Therapist adherence to the model predicted post-treatment
reductions in problem behaviors of the clients.
� Henggeler et al. (2002)� Supervisors’ expertise in the model predicted therapist
adherence to the model.
� Sexton (2001)� Direct linear relationship between staff competence and
recidivism reductions.

Even More Fidelity Research
� Kirigin et al. (1982) found that higher fidelity among staff was associated with greater reductions in delinquency.
� Schoenwald et al. (2004) found that higher consultant fidelity was related to higher practitioner fidelity; higher practitioner fidelity was related to better youth outcomes.
� Bruns et al. (2005) compared high fidelity Wraparound sites to low fidelity sites and found high fidelity sites to result in improved
social/academic functioning of children and lower restrictiveness of placements.

Even More Fidelity Research Cont’d.
� Schoenwald et al. (2004) found that higher consultant fidelity was related to higher practitioner fidelity; higher practitioner fidelity was related to better youth outcomes.
� Schoenwald and Chapman (2007)� A 1-unit increase in therapist adherence score predicted 38% lower rate of criminal charges 2 years post-treatment
� A 1-unit increase in supervisor adherence score predicted 53% lower rate of criminal charges 2 years post-treatment.
� Schoenwald et al. (2007)� When therapist adherence was low, criminal outcomes for substance abusing youth were worse relative to the outcomes of the non-substance abusing youth.

UC Halfway House/CBCF Study in Ohio:A Look at Fidelity Statewide
� Average Treatment Effect was 4% reduction in recidivism
� Lowest was a 41% Increase in recidivism
� Highest was a 43% reduction in recidivism
� Programs that had acceptable termination rates, had been in operation for 3 years or more, had a cognitive behavioral program, targeted criminogenic needs, used role playing in almost every session, and varied treatment and length of supervision by risk had a 39% reduction in recidivism

What Do We Know About Fidelity?
� Fidelity is related to successful outcomes (i.e., recidivism reductions).
� Poor fidelity can lead to null effects or even iatrogenic effects.
� Fidelity can be measured and monitored.
� Fidelity cannot be assumed.

Ways to Monitor Fidelity
� Training post-tests
� Structured staff supervision for use of evidence-based techniques
� Self-assessment of adherence to evidence-based practices
� Program audits for adherence to specific models/curricula
� Focus review of assessment instruments
� Formalized CQI process

Staff Trainings
Ensuring Training Transfer
� Use of knowledge-based pre/post-tests
� Use of knowledge-based proficiency tests
� Use of skill-based rating upon completion of training
� Mechanism for use of data
� Staff must meet certain criteria or score to be deemed competent.
� Failure to meet criteria results in consequent training, supervision, etc.

Staff Supervision

Staff Supervision
Staff supervision is a “formalprocess of professional support and learning which enables individual practitioners to develop knowledge and competence, assume responsibility for their own practice and enhance [client]… care in complex … situations.”
Modified from Department of Health, 1993

Unique Challenges in Corrections
� High concentration of paraprofessionals.
� Focus of supervision on clinical staff.
� Influence of personal beliefs about crime on job performance
Common Results
� Supervision often translates into senior staff person simply telling junior staff person what to do.
� Based on own personal beliefs and experiences.
� No systematic approach to supervision.
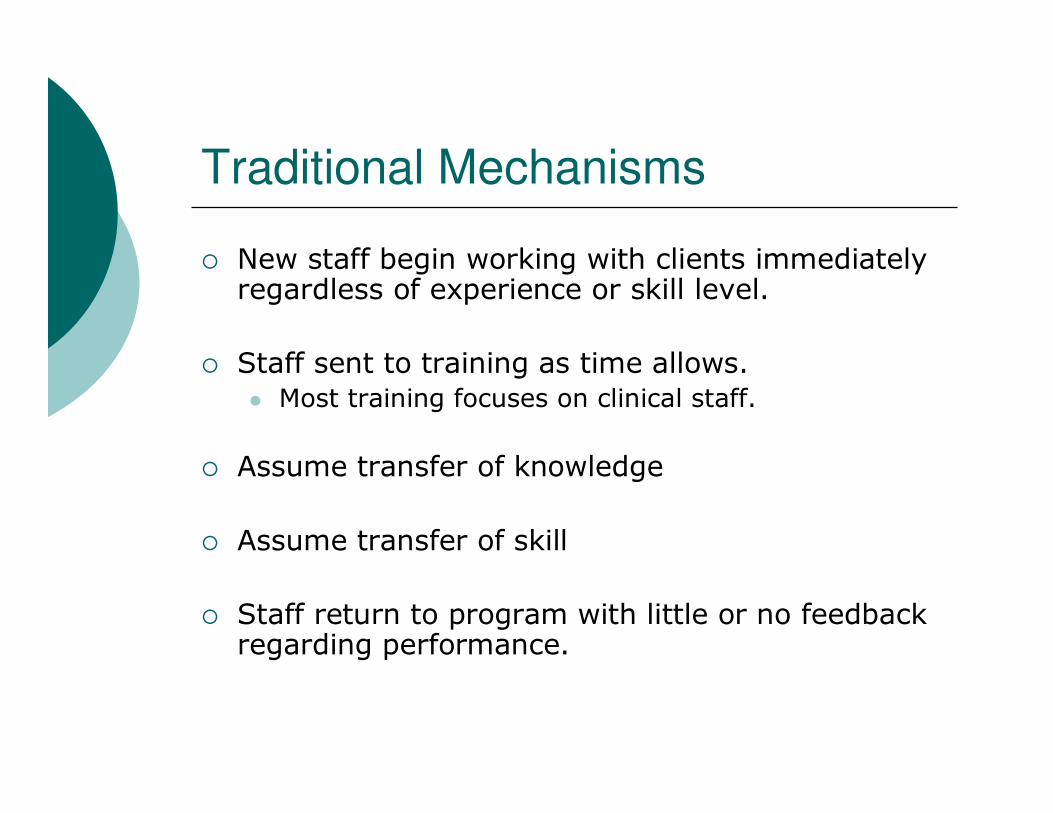
Traditional Mechanisms
� New staff begin working with clients immediately regardless of experience or skill level.
� Staff sent to training as time allows.
� Most training focuses on clinical staff.
� Assume transfer of knowledge
� Assume transfer of skill
� Staff return to program with little or no feedback regarding performance.
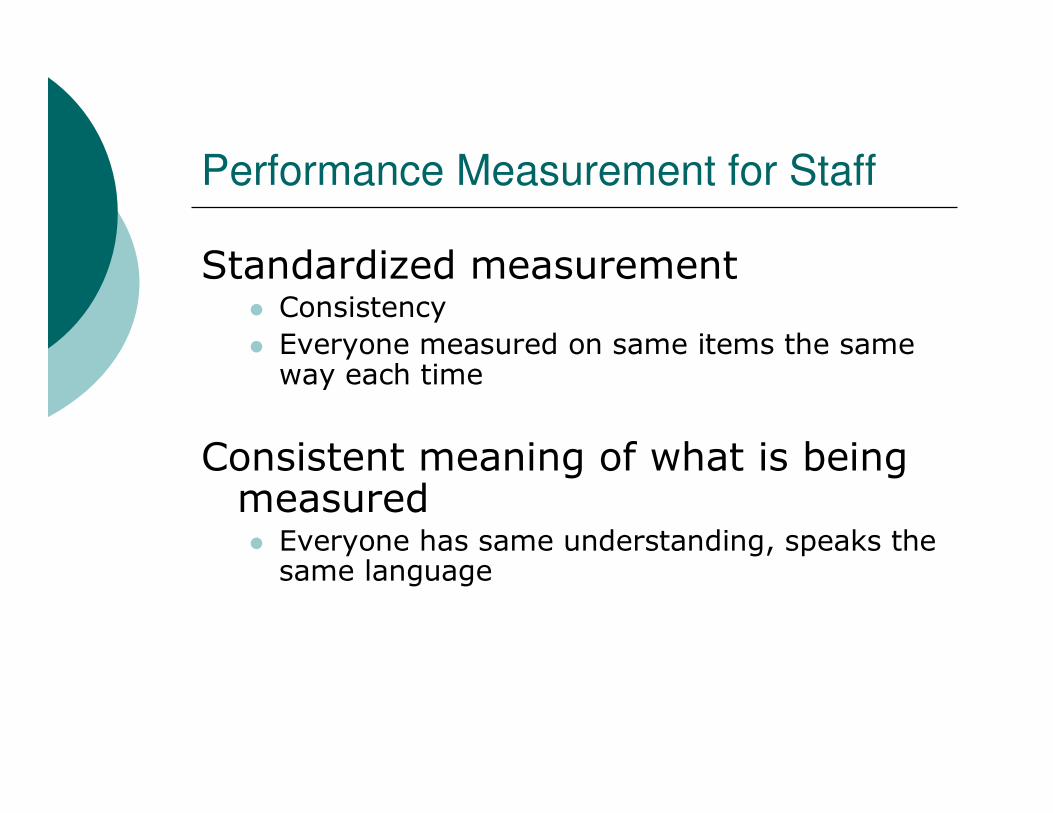
Performance Measurement for Staff
Standardized measurement� Consistency
� Everyone measured on same items the same way each time
Consistent meaning of what is being measured� Everyone has same understanding, speaks the same language

Sample Measures
� Uses CBT language during encounters with clients.
� Models appropriate language and behaviors to clients.
� Avoids power struggles with clients.
� Consistently applies appropriate consequences for behaviors.
� Identifies thinking errors in clients in value-neutral way.

Sample Employee Observation Evaluation Employee Name:
Supervisor Name: Site:
Observation Time (amount): Start Time: Stop Time: Place of Observation:
Activity Observed:
Behavior Below
Expectations
Needs
Improvement
Meets
Expectations
Exceeds
Expectations
Comments on Direct Observations
Uses corrective thinking language
during encounters with clients.
Models appropriate language and
behavior to clients. Includes:
Speaking positively about program,
law, courts, etc. Does not use
derogatory language/jokes op
sarcasm.
Avoids power struggles with clients
(e.g., does not argue with clients,
raise voice at clients, antagonize
clients)
Consistently applies appropriate
consequences for behaviors (both
positive and negative)
Identifies thinking barriers in clients
in value-neutral way
Overall Score

IN-PROGRAM FEEDBACK FORM
Practitioner: Date of Observation:
Supervisor: Date of Feedback:
Please select several concept areas that represent observed strengths of the practitioner and one area for continued
professional development. Following is a list of Teaching-Family Model concepts you may select from or you may
choose other related concepts that are appropriate to practitioners at Talbert House. Put a plus in front of the
concepts you want to address as strengths and put a checkmark in front of the concept area for skill development.
STAFF STRENGTHS
Concept Label: (what concept above are you using for this observation)
Concept Definition: (describing the meaning of the concept chosen)
Associated Developmental Theory ( examples of
Rationale: ( a statement that explains a natural benefit, or nature positive consequence that
a staff may receive from engaging in appropriate behavior.)
Descriptive Praise: ( praise staff for the parts they did well in the interaction)
SUGGESTED CONCEPT AREAS
___Use of Effective Praise ___Motivating the children
___Use of Corrective Teaching ___Self determination
___Use of Planned/Preventive Teaching ___Developmentally appropriate planning
___SODAS Counseling ___Setting clear expectations for children
___Intensive Teaching ___Relationship development
___Social skills training ___Professionalism
___Implementation of child/family’s treatment plan ___Working effectively with other professionals
___Effective use of teaching components ___Communication with the child’s parents
___Appropriate monitoring ___ Advocating for the child
___Perceiving opportunities to teach ___Culturally competent environment
___Community involvement ___Use of community resources
___Safe environment ___ Other:
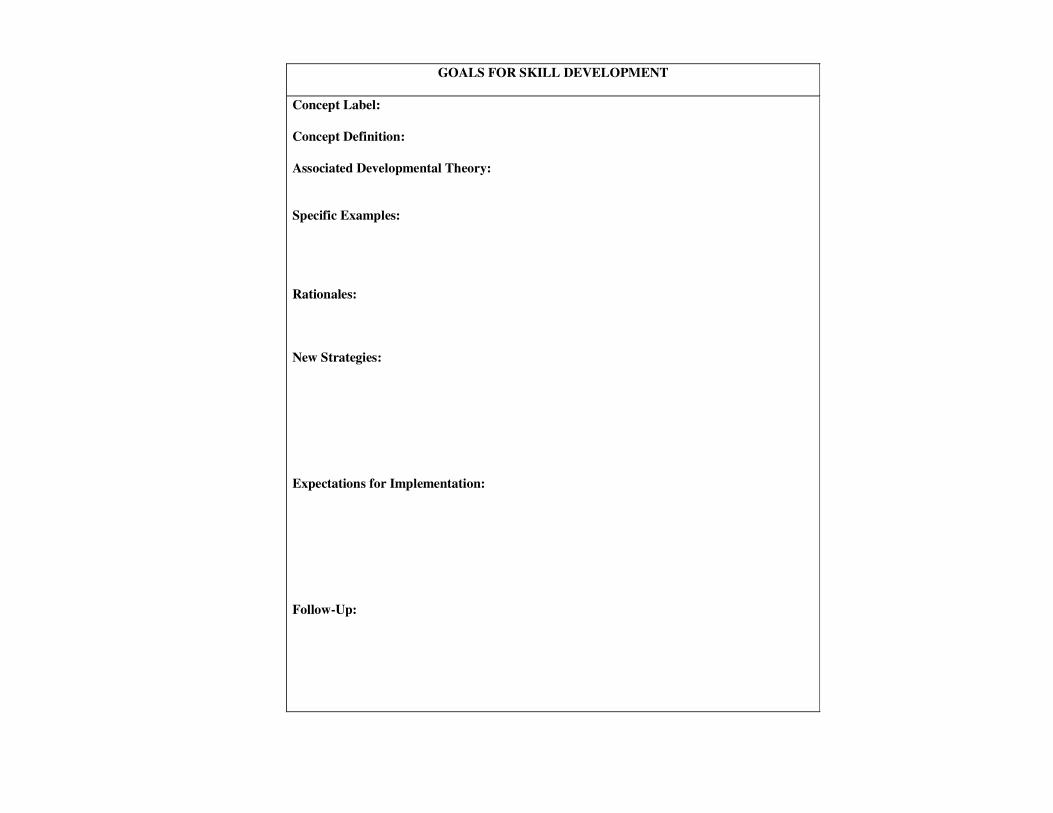
GOALS FOR SKILL DEVELOPMENT
Concept Label:
Concept Definition:
Associated Developmental Theory:
Specific Examples:
Rationales:
New Strategies:
Expectations for Implementation:
Follow-Up:

Bottom Line
Incorporation Into Supervision
CQI Principles
Improving skills of staff can help to improve client outcomes
Tied to Client Outcomes
Empowers staff and improves morale
Problem-Solving
Changes perceptions about receiving feedback on performance
Improvement-Focused
Provides direction for action planning and staff development
Data Driven
Objective, quantifiable data to share with staff
Measurement
Reduction of crisis-oriented management
Proactive

Agency Self-Assessment

Assessing Best Practices at 17 Sites
� Use of ICCA Treatment Survey to establish baseline
� Complete again based on best practice
� Perform Gap Analysis
� Action Plan
� Reassess

ICCA Treatment Survey
� CQI Manager and Clinical Director met with key staff from each program to conduct self assessment of current practices.
� Evaluated performance in 6 key areas� Staff� Assessment/Classification� Programming� Aftercare� Organizational Responsivity� Evaluation

Agency Results
� Agency Strengths
� 40-hour New Employee Orientation for all staff
� 88.2% reported good adherence to selection/exclusionary criteria
� 64.7% reported use of a standardized risk assessment instrument; 82.5% reported use of standardized substance abuse assessment.

Agency Results
� Agency Strengths Continued
� Approximately 2/3 of clients participate in aftercare services and most programs reported working with a large number of external providers for additional services.
� All reported strong support from parent agency.
� 64.7% had participated in an outcome study with comparison group in past 5 years.

Agency Results
� Agency Weaknesses
� Need a more systematic approach to directing ongoing training requirements.
� 88.2% had not validated assessment instruments.
� 58.8% were not varying programming by risk and need.

Agency Results
� Agency Weaknesses Continued
� Consistency of use of role-plays was rated as 2.12 (scale of 0-5).
� Strength of formal arrangements for aftercare services was rated as 2.0 (scale of 0-5).
� External entities’ support of best practice implementation not as strong as desired.
� 58.8% were not routinely tracking recidivism.

Agency Response
� FY2006� Required to submit at least 1 action plan to “fix” an identified gap.
� Gaps in the areas of risk and need to be given priority.
� FY2007� Required to submit 2 action plans.� One on use of role-plays and one on appropriate use of reinforcements.
� FY2008� Required to create a fidelity measurement tool and to collect baseline performance data.
� FY2009� Fidelity measure becomes a required CQI indicator with an established threshold; must meet or exceed by end of year.

Program Audits
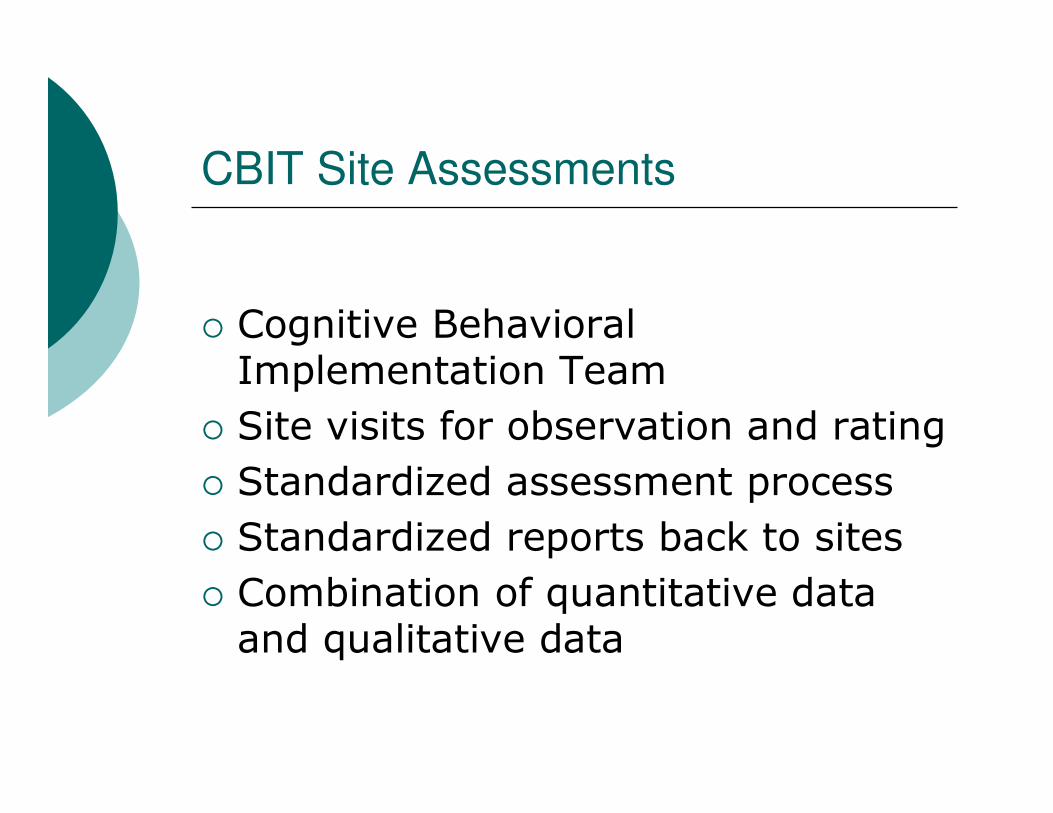
CBIT Site Assessments
� Cognitive Behavioral Implementation Team
� Site visits for observation and rating
� Standardized assessment process
� Standardized reports back to sites
� Combination of quantitative data and qualitative data

Corrective Thinking Site Checklist
Site name____________________
Type of Site Residential, Halfway House, Outpatient, Day treatment.
Date of visit______________
Do you have the following at your site?
1. Full set of Truthought Posters Yes_____ No________
2. How many _________
3. Where are they located________________
4. Set of Truthought Workbooks Yes_______ No_______
(for residential sites)
Charting the Course book in house Yes_____ No____
4 = A Great Deal; 3 = Moderate; 2 = Some; 1 = Not At All
4 3 2 1
Are you utilizing Truthought tools? ���� ���� ���� ����
1. Pocket handouts ���� ���� ���� ����
2. tactic cards ���� ���� ���� ����
3. thinking cards ���� ���� ���� ����
4. thinking reports ���� ���� ���� ����
5. ripple chart ���� ���� ���� ����
6. corrective thinking language ���� ���� ���� ����
(give examples observed)
7. positive reinforcers for ���� ���� ���� ����
pro social behaviors.
8. What are they? __________________________________________
9. Do your client orientation policies
explain corrective thinking? ���� ���� ���� ����
10. Do the treatment plans incorporate
corrective thinking exercises,
not just attending the groups? ���� ���� ���� ����
What is the percentage of staff that is trained in corrective thinking at your site? ____%
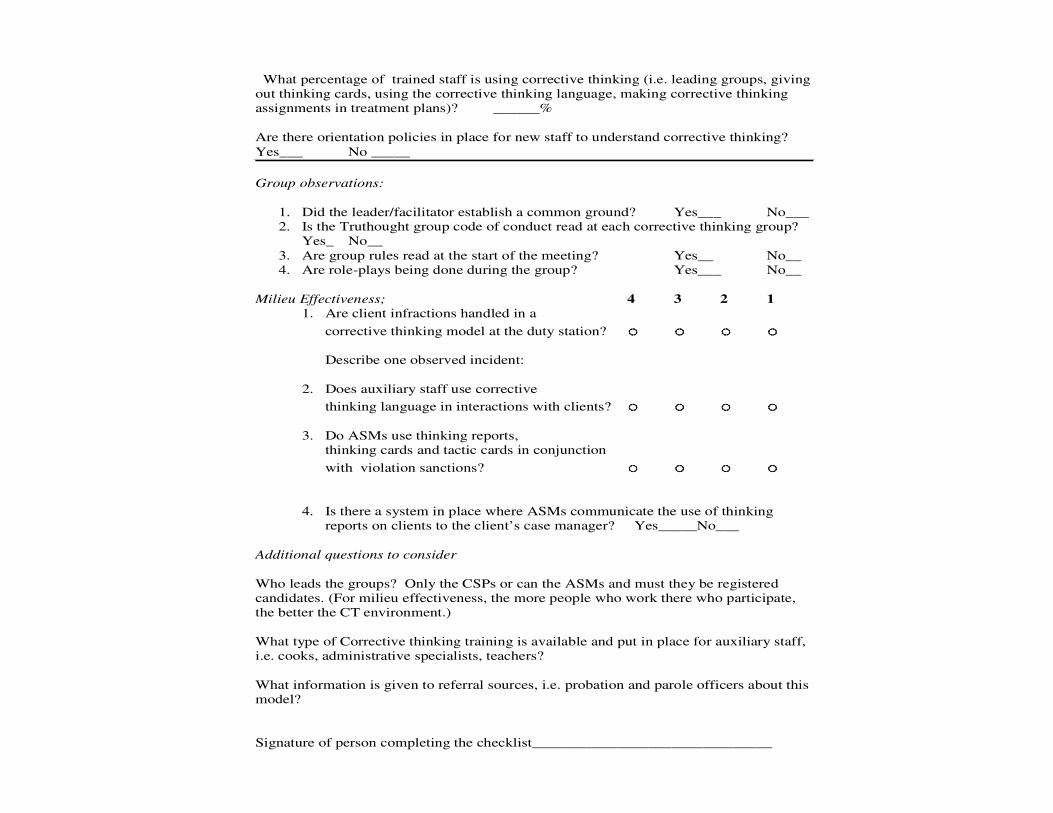
What percentage of trained staff is using corrective thinking (i.e. leading groups, giving
out thinking cards, using the corrective thinking language, making corrective thinking
assignments in treatment plans)? ______%
Are there orientation policies in place for new staff to understand corrective thinking?
Yes___ No _____
Group observations:
1. Did the leader/facilitator establish a common ground? Yes___ No___
2. Is the Truthought group code of conduct read at each corrective thinking group?
Yes_ No__
3. Are group rules read at the start of the meeting? Yes__ No__
4. Are role-plays being done during the group? Yes___ No__
Milieu Effectiveness; 4 3 2 1
1. Are client infractions handled in a
corrective thinking model at the duty station? ���� ���� ���� ����
Describe one observed incident:
2. Does auxiliary staff use corrective
thinking language in interactions with clients? ���� ���� ���� ����
3. Do ASMs use thinking reports,
thinking cards and tactic cards in conjunction
with violation sanctions? ���� ���� ���� ����
4. Is there a system in place where ASMs communicate the use of thinking
reports on clients to the client’s case manager? Yes_____No___
Additional questions to consider
Who leads the groups? Only the CSPs or can the ASMs and must they be registered
candidates. (For milieu effectiveness, the more people who work there who participate,
the better the CT environment.)
What type of Corrective thinking training is available and put in place for auxiliary staff,
i.e. cooks, administrative specialists, teachers?
What information is given to referral sources, i.e. probation and parole officers about this
model?
Signature of person completing the checklist_______________________________

Implications
• Individual Staff– Used for staff development
• Program– Identifies each individual program’s strengths and
weaknesses.
• Agency– Identifies strengths and weaknesses that cut across
programs.
– Possible identification of population-specific issues (e.g., male vs. female)

Focus Review of Assessment Tools

Review of LSI Scores
� Reviewed all open cases at Facility A
� Recorded LSI risk category, UC Risk category, and name of interviewer
� 77.5% of cases reviewed did not have a match between staff rating and UC rating

LSI Scores Post-Training
� First 2 weeks after training – 0 matches� 3-6 weeks after training – 46.2% matched� First 2 weeks after training – 50% were off by 2 risk
categories� 3-6 weeks after the training – 0% were off by 2 risk
categories
0
20
40
60
Match Off By 1 Off By 2 or More
Weeks 1-2
Weeks 3-6

Implications
� Individual Staff
� Data revealed that staff with most problems had not been trained.
� Program
� Led to creation of more formal training requirements and schedule.
� Agency
� Led to developing infrastructure for ongoing QA across programs

Individual LSI Reviews
� Schedule of videotaped interviews
� Submitted for review
� Use of standardized audit sheet
� Feedback loop for staff development
� Aggregate results to inform training efforts

LSI Audit Form
Reviewer: Date:
Interviewer:
1 = Poor 2 = Fair/Needs Improvement 3 = Good 4 = Excellent
1 2 3 4
1. Explanation of the purpose of the interview. ❑ ❑ ❑ ❑
2. Established structure for the interview. ❑ ❑ ❑ ❑
3. Adequate use of open-ended questions. ❑ ❑ ❑ ❑
4. Avoidance of double-barreled questions. ❑ ❑ ❑ ❑
5. Avoidance of biased/leading questions. ❑ ❑ ❑ ❑
6. Adequate use of follow-up questions. ❑ ❑ ❑ ❑
7. Avoided barriers to listening (such as moralizing, disagreeing,
Blaming, shaming, reinforcing). ❑ ❑ ❑ ❑
8. Interview overcame problems such as silence or excessive talking. ❑ ❑ ❑ ❑
9. Interviewer used the interview guide. ❑ ❑ ❑ ❑
10. Notes were made indicating why items were or were not scored. ❑ ❑ ❑ ❑
11. Adequate documentation in the case of an override. ❑ ❑ ❑ ❑
12. Treatment plan clearly relates to information captured in the LSI. ❑ ❑ ❑ ❑
Total score: ______ divided by _______ =
Reviewer Comments:

Creating a Formal CQI Process
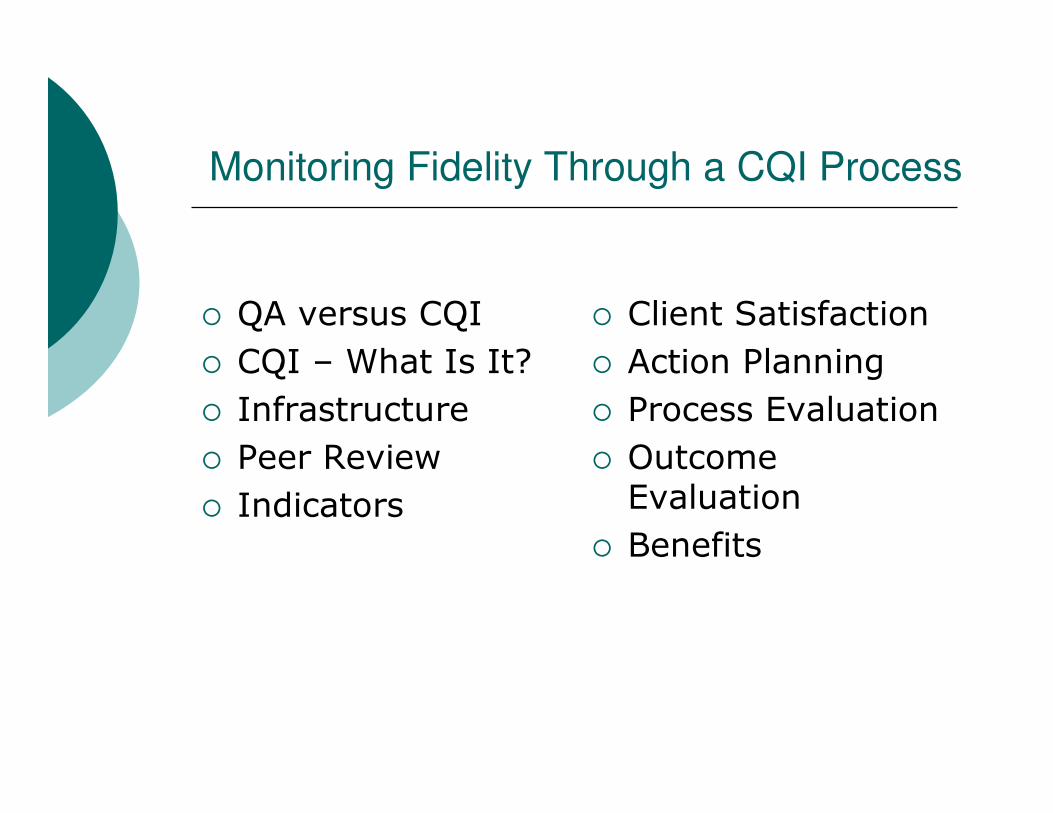
Monitoring Fidelity Through a CQI Process
� QA versus CQI
� CQI – What Is It?
� Infrastructure
� Peer Review
� Indicators
� Client Satisfaction
� Action Planning
� Process Evaluation
� Outcome Evaluation
� Benefits

QA – The Old Way
� Retrospective review process
� Emphasis on regulatory and contract compliance
� Catching people being bad leads to hide and seek behavior
� Targets represent minimum standard
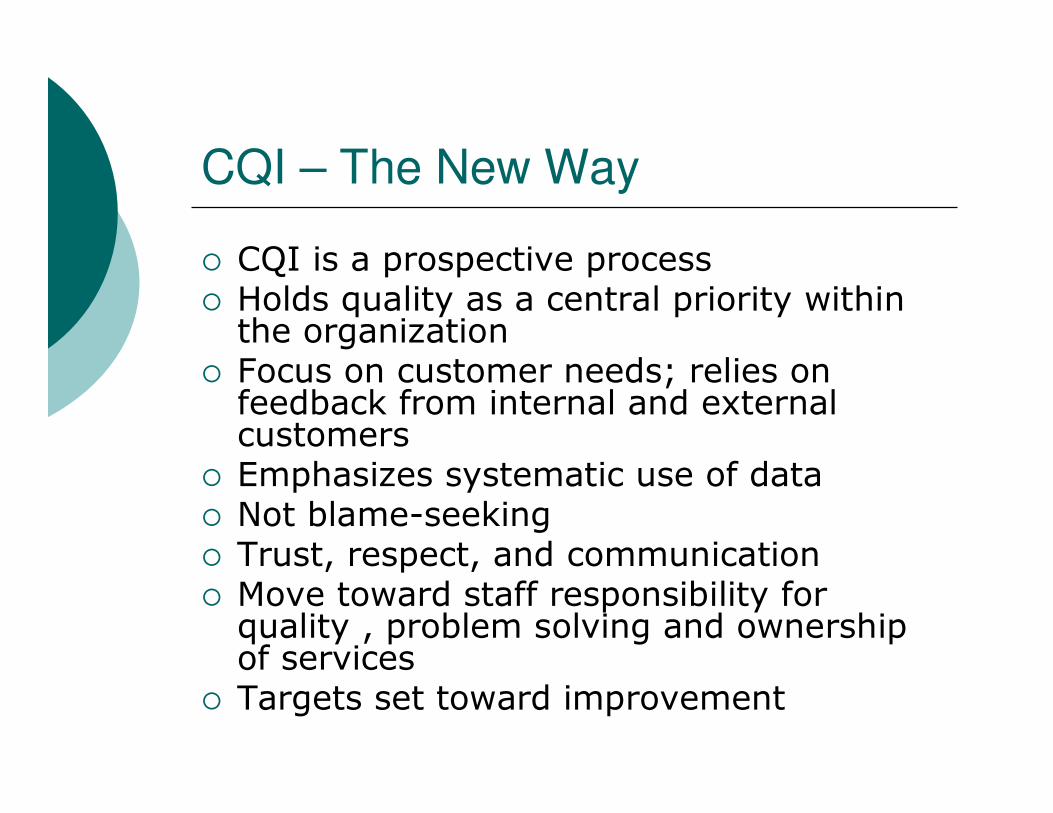
CQI – The New Way
� CQI is a prospective process� Holds quality as a central priority within the organization
� Focus on customer needs; relies on feedback from internal and external customers
� Emphasizes systematic use of data� Not blame-seeking� Trust, respect, and communication� Move toward staff responsibility for quality , problem solving and ownership of services
� Targets set toward improvement

Objectives of CQI
� To facilitate the Agency’s mission
� To ensure appropriateness of services
� To improve efficiency of services/processes
� To improve effectiveness of directing services to client needs
� To foster a culture of learning
� To ensure compliance with funding and regulatory standards

Creating a CQI Infrastructure
Oversight CQI Committee
Risk Management
Committee
Safety Committee Human Subjects
Committee
Diversity Committee Corporate Compliance
Committee
Cluster CQI
Committees
Program Peer Review
Committees
Morbidity & Mortality
Conference

Establishing a Written CQI Plan
� Quality of Documentation – Peer Review
� Quality of Services – Indicators
� Customer Satisfaction
� Program Evaluation

Why Review Documentation?
� Clinical Implications� Documentation is not separate from service delivery.
� Did the client receive the services he/she needed?
� Operational Implications� Good documentation should drive decision-making.� Means of communication
� Risk Management Implications� If it isn’t documented, it didn’t happen.� Permanent record of what occurred in the facility
� Source of Staff Training � Reflection of the provider and organization’s
competency:� EBP� Outcome of care

Establishing Indicators
� Relevant to the services offered
� Align with existing research
� Measurable
� No “homegrown” instruments
� Reliable and valid standardized measures

Examples of Indicators
Process Indicators� Percentage of clients with a serious MH issue referred to community services within 14 days of intake.
� Percentage of clients with family involved in treatment (defined as min. number of face-to-face contacts).
� Percentage of clients whose first billable service is within 72 hours (case mgt).

Examples of Indicators
Outcome Indicators� Clients will demonstrate a reduction in antisocial attitudes.
� Clients will demonstrate a reduction in LSI scores.
� Clients will demonstrate an increase in treatment readiness.
� Clients will obtain a GED.
� Clients will obtain full-time employment.
� Clients will demonstrate a reduction in Symptom Distress.

Sample Fidelity Measure - TFM
� 4 residential adolescent programs implemented Teaching Family Model.
� Required to complete monthly observations on all direct service staff.
� Required to record data on standardized form and to enter into Fidelity database.
� CQI Indicator = percentage of staff achieving 4:1 ratio.

Sample Fidelity Measure – CBT
� Several programs conducting group observations using standardized rating form.
� Needed to operationalize who would do observations and how frequently.
� Needed to operationalize how data would be collected, stored, analyzed, and reported.
� CQI Indicator = percentage of staff achieving a rating of 3.0. (on scale of 0-3).

Measuring CBT in Groups
� Chose 5 items from observation tool:
� Use of role plays/or other rehearsal techniques
� Ability of the group leader to keep participants on task
� Use of peer interaction to promote prosocial behavior
� Use of modeling
� Use of behavioral reinforcements

Sample Fidelity Measure - Dosage
� Program created dosage grid by LSI-R risk category and criminogenic need domains.� Requires prescribed set of treatment hours by risk
� Program created dosage report out of automated clinical documentation system.
� Will review monthly to insure clients are receiving prescribed dosage.
� Will also review individual client data at monthly staffings.
� CQI Indicator = percentage of successful completers receiving prescribed dosage (measured monthly).

Sample Dosage Protocol
Community Correctional Center
Risk Level Structure Guide
Medium
High High Medium Low/ Moderate Low
LSI Score Range 34+ 31-33 24-30 19-23 0-18
Length of Stay Target (days) 147 133 119 105 60
Corrective Thinking 200 180 132 92 52
AOD 62 54 46 38 28
Individualized Relapse Prevention 21
Anger Management 24 24 24 24 if needed
Domestic Violence 24 15 15 15 if needed
Vocational* 15 15 15 15 8
Life Skills* 16 16 16 16 8
Personal Development* 10 10 10 10 if needed
*not counted in dosage total
Total hours available: 351 314 258 210 117
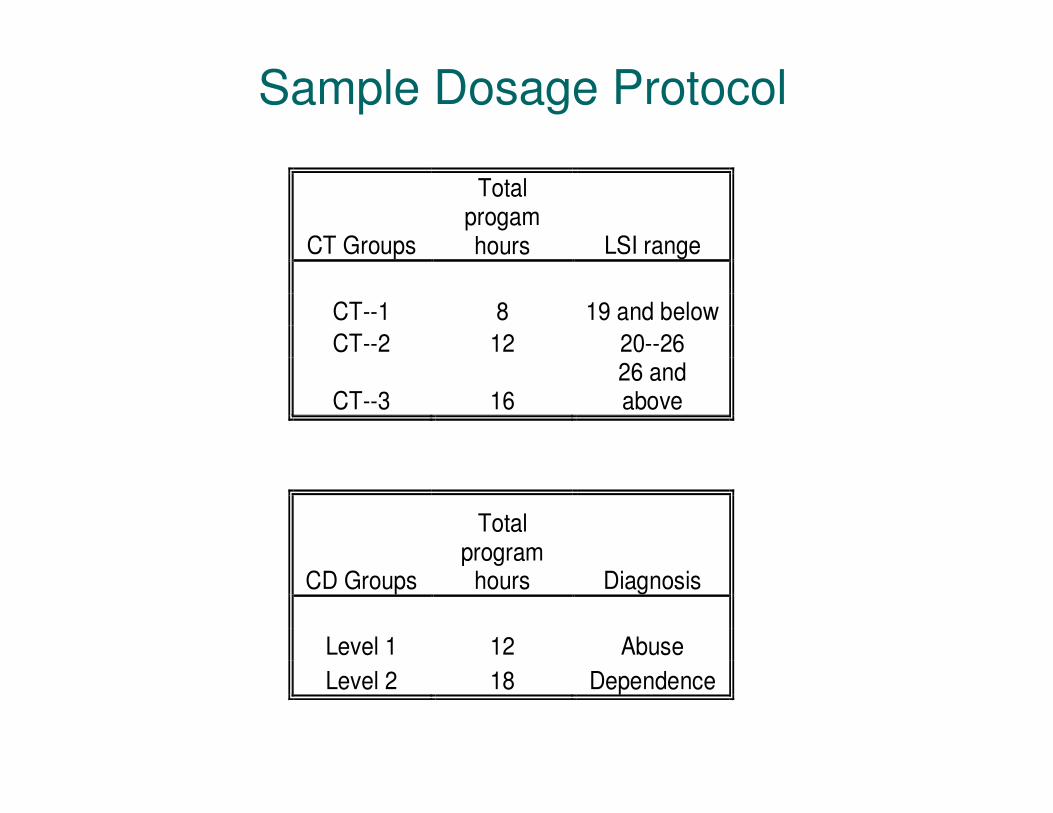
Sample Dosage Protocol
CT Groups
Total progam hours LSI range
CT--1 8 19 and below
CT--2 12 20--26
CT--3 16 26 and above
CD Groups
Total program
hours Diagnosis
Level 1 12 Abuse
Level 2 18 Dependence

Establishing Thresholds
� Establish internal baselines
� Compare to similar programs
� Compare to state or national data

Client Satisfaction
� Identify the dimensions� Access
� Involvement in treatment planning
� Emergency response
� Respect from staff
� Respect from staff for cultural background
� All programs use the same survey
� Items are scored on a 1-4 Likert scale
� Falling below a 3.0 generates an action plan
Action Plans
� Plan of correction
� Proactive approach to problem-solving
� Empowers staff
� Using objective data to inform decision making

Process Evaluation
� Are we serving our target population?
� Are the services being delivered?
� Did we implement the program as designed (tx fidelity)?
� Are there areas that need improvement?

Focus Review at Two Male Halfway
Houses – In Process
� Examining how many clients receive prescribed dosage based on risk/need.
� Examining LOS by risk.
� AWOL profiling
� Performance on HIT indicator
� Performance on successful completion

Focus Review at an Adolescent
Residential Program
� Examined changes in client characteristics over time
� Examined successful completion over time� Identified factors predictive of AWOL’s, incidents, and completion
� Examined use of role-plays in groups� Primary predictors of intermediate outcomes:� Overall Risk (education and peers specifically also important)
� Criminal History� Treatment Dosage� Involvement in incidents

Focus Review at a Female Halfway
House – Preliminary Findings
� Client Profile� Basic demographics and clinical characteristics� Many of the HIT subscales correlate in the expected
direction with the LSI subscales and overall score.
� AWOL and Completion Profiling� Clients scoring as higher risk were more likely to AWOL
and less likely to successfully complete the program.� Municipal clients were more likely to AWOL and therefore
to be negatively terminated.� Clients with higher risk scores in the areas of criminal
history and employment were less likely to successfully complete the program.
� LOS by Risk� For overall sample, the higher the LSI score, the shorter
the length of stay (this is likely a result of AWOL's and unsuccessful completions); when looking at successful completers only, length of stay increased along with risk scores as expected.
Outcome Evaluation
� Are our services effective?
� Do clients benefit (change) from the services?
� Intermediate outcomes
� Reduction in risk
� Reduction in antisocial values
� Long-term outcomes
� Recidivism
� Sobriety

Relationship Between Intermediate Outcomes and
Recidivism
� Female adolescent program’s intermediate outcome measures:
� Antisocial attitudes
� Self-esteem
� Self-efficacy
� Family functioning
� Determine whether improvement on intermediate measures results in lower recidivism.
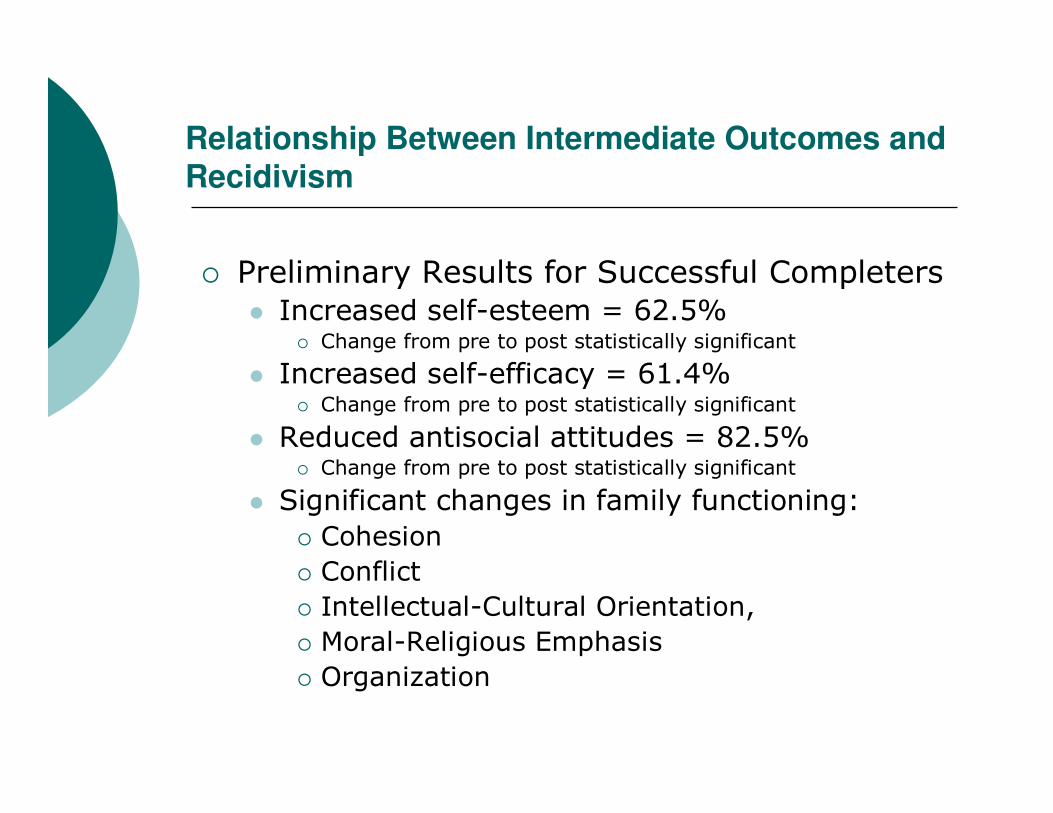
Relationship Between Intermediate Outcomes and Recidivism
� Preliminary Results for Successful Completers
� Increased self-esteem = 62.5%� Change from pre to post statistically significant
� Increased self-efficacy = 61.4%� Change from pre to post statistically significant
� Reduced antisocial attitudes = 82.5%� Change from pre to post statistically significant
� Significant changes in family functioning:
� Cohesion
� Conflict
� Intellectual-Cultural Orientation,
� Moral-Religious Emphasis
� Organization

Outcome Evaluation of New Dosage Protocol
� Practical application of the risk principle
� Seeking to quantify how much dosage is required to reduce recidivism
�Will compare clients discharged from the program pre-implementation to clients discharged from the program post-implementation.

Benefits of Program Evaluation
� Proof of effective services� Maintain or secure funding
� Improve staff morale and retention
� Educate key stakeholders about services
� Highlights opportunities for improvement
� Data to inform quality improvement initiatives
� Establish/enhance best practices
� Monitor/ensure treatment fidelity

Relationship Between Evaluation and Treatment Effect(based on UC Halfway House and CBCF study)
6
1
0
2
4
6
8
Internal QA No Internal QA
% C
han
ge i
n R
ecid
ivis
m

Conclusions
� Many agencies are allocating resources to selection/implementation of EBP with no evidence that staff are adhering to the model.
� There is evidence that fidelity directly affects client outcomes.
� There is evidence that internal CQI processes directly affect client outcomes.
� Therefore, agencies have an obligation to routinely assess and assure fidelity to EBP’s.
� Requires a formal infrastructure to routinely monitor fidelity performance.