establishing links between urban forestry, geospatial ... · esri health gis conference, denver,...
TRANSCRIPT

ESRI Health GIS Conference, Denver, ColoradoOctober 19, 2010
“Establishing Links between Urban Forestry, Geospatial Technologies, and Public Health” g
Understand | Communicate | CollaborateUnderstand | Communicate | Collaborate AMEC Earth & Environmental, Inc – www.amec.com
Credits:US Forest Service, Davey Resource Group,Texas Trees Foundation

Agenda
• Overview of the social, environmental, and economic benefits of urban treesof urban trees • Modeling ecosystem services: CITYgreen and U.S. Forest Service i-Tree software
• Geospatial technologies to plan for, measure and monitor
• Linkages and current research or data gapsLinkages and current research or data gaps
Understand | Communicate | CollaborateUnderstand | Communicate | Collaborate AMEC Earth & Environmental, Inc – www.amec.com

Urban Forestry Across the Country
Federal or National Level:State & Private ForestryU b & C it F tUrban & Community ForestryRegional USFS OfficesNational Associations (SMA, ISA)
State Level:Urban Forest CouncilsDNR State CoordinatorsExtension and State Associations
Local Level:Non profitsNon-profitsTree Planting InitiativesEconomic DevelopmentUniversity/Academic
Understand | Communicate | CollaborateUnderstand | Communicate | Collaborate AMEC Earth & Environmental, Inc – www.amec.com
University/AcademicIndustryThe Public (the Community!)

Benefits of Urban Forestry
AMEC Earth & Environmental, Inc – www.amec.com

Benefits of Urban Forestry
Economic – Environmental – SocialUSFS “Value of Trees Summary – Statistics Sheet”USFS Value of Trees Summary – Statistics Sheet• “Trees reduce runoff and erosion from storms by about 7% and reduce
the need for erosion control structures, saving cities money on materials installation and maintenance ” MD Dept of Naturalmaterials, installation and maintenance. - MD Dept of Natural Resources
• “Shade from two large trees on the west side of a house and one on the east side can save up to 30% of a typical residence’s annual airthe east side can save up to 30% of a typical residence s annual air conditioning costs.” - Center for Urban Forest Research (CUFR)
• Trees in Davis, CA parking lots reduced asphalt temperatures by as much as 36F and car interior temperatures by 47F ” CUFRmuch as 36F, and car interior temperatures by 47F. - CUFR
• “An increase of 10% canopy in the NYC Area were shown to reduce peak ozone levels by up to 4 parts per billion (nearly 3% of the max and 37% of the amount by its air quality standard) ” USFS Northern
AMEC Earth & Environmental, Inc – www.amec.com
and 37% of the amount by its air quality standard). - USFS, Northern Research Station

Benefits of Urban Forestry
“Trees help improve air quality by reducing air t t i i ll t t d iditemperature, removing air pollutants and providing
shade that lowers energy use in buildings, thus reducing air-polluting emissions from power plants.”
“Planting trees near roadways has the potential to reduce particles at the nano level Canopy has the potential to
g p g p p
particles at the nano level. Canopy has the potential to protect those living near roads. 36 million Americans live within 300 feet of a four-lane highway, railroad or airport.”
Max Zhang, Assistant Professor, Cornell
AMEC Earth & Environmental, Inc – www.amec.com

Urban Forest Ecosystem Services Modeling
AMEC Earth & Environmental, Inc – www.amec.com

Urban Forest Dollar Value
CITYgreen Software
Air Pollution Removal
Carbon Storage &Carbon Storage &Sequestration
StormwaterStormwaterMitigation
Water Quality(Contaminant
AMEC Earth & Environmental, Inc – www.amec.com
(ContaminantLoading)

A Suite of Tools for Urban Forestfor Urban Forest
Inventory & yAssessment
Understand | Communicate | CollaborateUnderstand | Communicate | Collaborate AMEC Earth & Environmental, Inc – www.amec.com

AMEC Earth & Environmental, Inc – www.amec.comSource: Scott Maco, Davey Institute

ComponentsCo po e ts
Benefit Analysis Tools Utilities
Street Tree Populations
• MCTI (inventory)
• Storm Damage Urban
EcosystemsPopulations gAssessment Protocol• Streets • Eco
Ecosystems
• Sample generator
AMEC Earth & Environmental, Inc – www.amec.com

StructureStructure
ManagementManagementFunctionFunction
Management Management NeedsNeeds
ValueValue
AMEC Earth & Environmental, Inc – www.amec.com

AMEC Earth & Environmental, Inc – www.amec.comSource: Scott Maco, Davey Institute

Sacramento Example
AMEC Earth & Environmental, Inc – www.amec.com

Trees Pay Us Back100 Trees Over 40 YearsBenefits = $379,000
Energy
100 Trees Over 40 Years...
Energy
Air Quality
Runoff
R l E t tReal Estate
Costs = $148,000Planting - Pruning g g
Removal/Disposal
Irrigation
Sidewalk RepairSidewalk Repair
Litter
Legal - Admin
AMEC Earth & Environmental, Inc – www.amec.com
Pay Off: $231,000

“The combined total effects of trees on air pollutants are significant enough that urban tree management could provide a viable means to improve air quality and help
meet clean air standards in the United States.”
AMEC Earth & Environmental, Inc – www.amec.com
Dr. Dave Nowak, USFS Northern Research Station

i-Tree Version-3: Hydro
UFORE-Hydro: a GIS-based program that estimates stream flow and water quality change based on tree cover and
Eastern U.S. Beta Testing Sites
change based on tree cover and impervious surface attributes within a watershed. It is calibrated against actual stream flow data and designed
f ffspecifically to estimate effects as a result of changes in vegetation cover.
Inputs: weather / precipitation, elevation, land cover gauging stations dataland cover, gauging stations data, watershed boundary
Parameters: 9 channel, soil, and vegetationResolution: 10-meter & 30-meter so far, but
1-meter is possible with <5sqkm areaOther: no dollar-value associated (resource
units only), also testing in Minnesota, Oregon Colorado Florida and Phoenix
AMEC Earth & Environmental, Inc – www.amec.com
Oregon, Colorado, Florida, and Phoenix

i-Tree Version-3: Spatial
Spatial Model Components City Scale Mapping (i‐Tree Vue; released in version 3.0) – illustrate current ecosystem services across a city and how changes in tree cover will affect these services. The goal of i‐Tree is to move this mapping capability to a web server (i‐Tree Geo) to allow for more sophisticated analyses and determine the best locations to plant trees, for example to improve water quality or protect the most people in the warmest and most polluted parts of the city. This work is well underway.
Future effects (i‐Tree Future; in development) – project future tree population totals, tree cover and ecosystem services within land use types
Local Scale Site Design (i‐Tree Design; proposed) – this web‐based tool will allow users to draw their local site on maps (e.g., building outlines, existing trees on a residential lot) to: a) map the best locations on the site for optimizing ecosystem services; b) provide suggestions for the best trees for various locations on the site given site constraints; and c) allow users to virtually “move” new trees
ff f faround the site to illustrate effects on future tree benefits and cover on the site.
Research Mission: Effects of Urban Forests and their Management on Environmental Quality and Associated Human Health USDA Forest Service, Northern Research Station, Syracuse, NY.
AMEC Earth & Environmental, Inc – www.amec.com

Geospatial Technologies for M i d M it iMeasuring and Monitoring
Urban Forests• Urban Tree Canopy Assessment
• GIS Analysis for Planting Prioritization
• Geospatial Community Tree Inventory
AMEC Earth & Environmental, Inc – www.amec.com

AMEC Earth & Environmental, Inc – www.amec.com

Urban Tree Canopy (UTC)
Discontinuity in UrbanTree Canopy (UTC)Tree Canopy (UTC)
Environmental andSocial Injustice?j
Opportunities canbe identified using GISand Demographicand Demographic Analysis
Ecosystem servicescan be assessed
Policy can be improved
Understand | Communicate | CollaborateUnderstand | Communicate | Collaborate AMEC Earth & Environmental, Inc – www.amec.com

Hudson, OH UTC Assessment
Hudson Current UTC: 41.4% (6,669 acres)
Hudson Possible UTC: 53 3% (8 585 acres)Hudson Possible UTC: 53.3% (8,585 acres)
UTC in Right-of-Way: 31.5% (494 acres)
Hudson Urban Forest Value Calculated Using CITYgreen Software: TBD
80,000
90,000
50,000
60,000
70,000
UTCMetrics
20,000
30,000
40,000
Understand | Communicate | CollaborateUnderstand | Communicate | Collaborate AMEC Earth & Environmental, Inc – www.amec.com
0
10,000
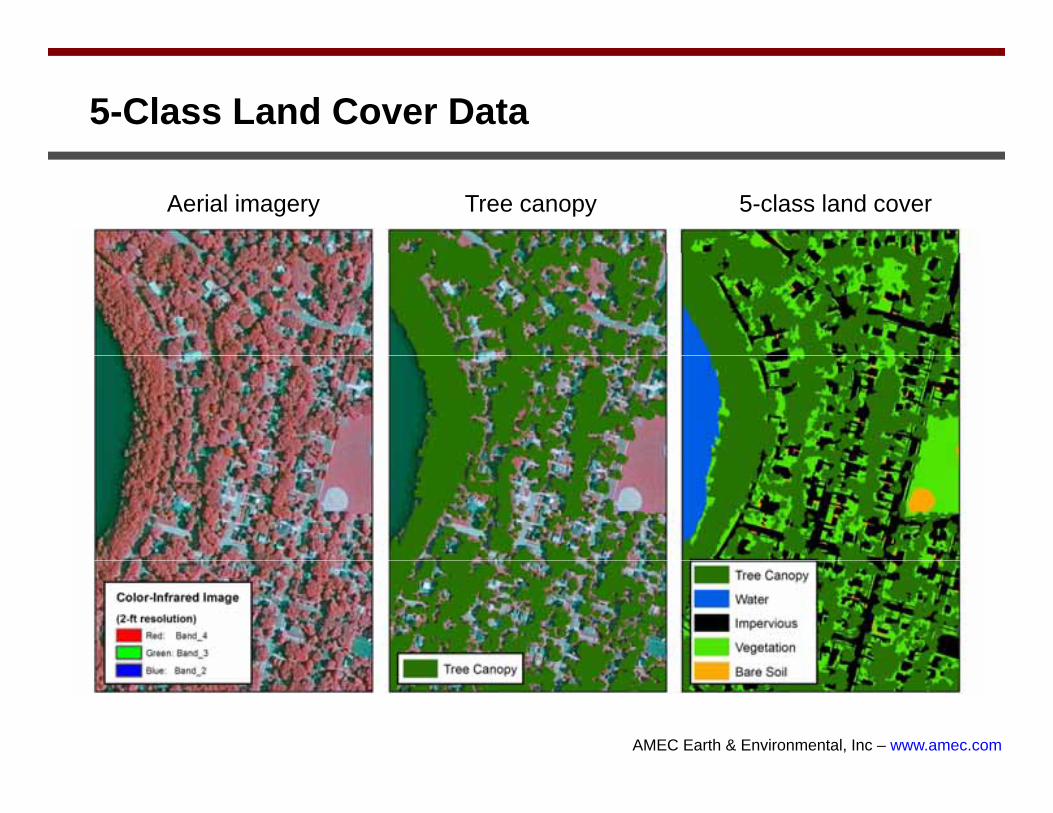
5-Class Land Cover Data
Aerial imagery Tree canopy 5-class land cover
Understand | Communicate | CollaborateUnderstand | Communicate | Collaborate AMEC Earth & Environmental, Inc – www.amec.com
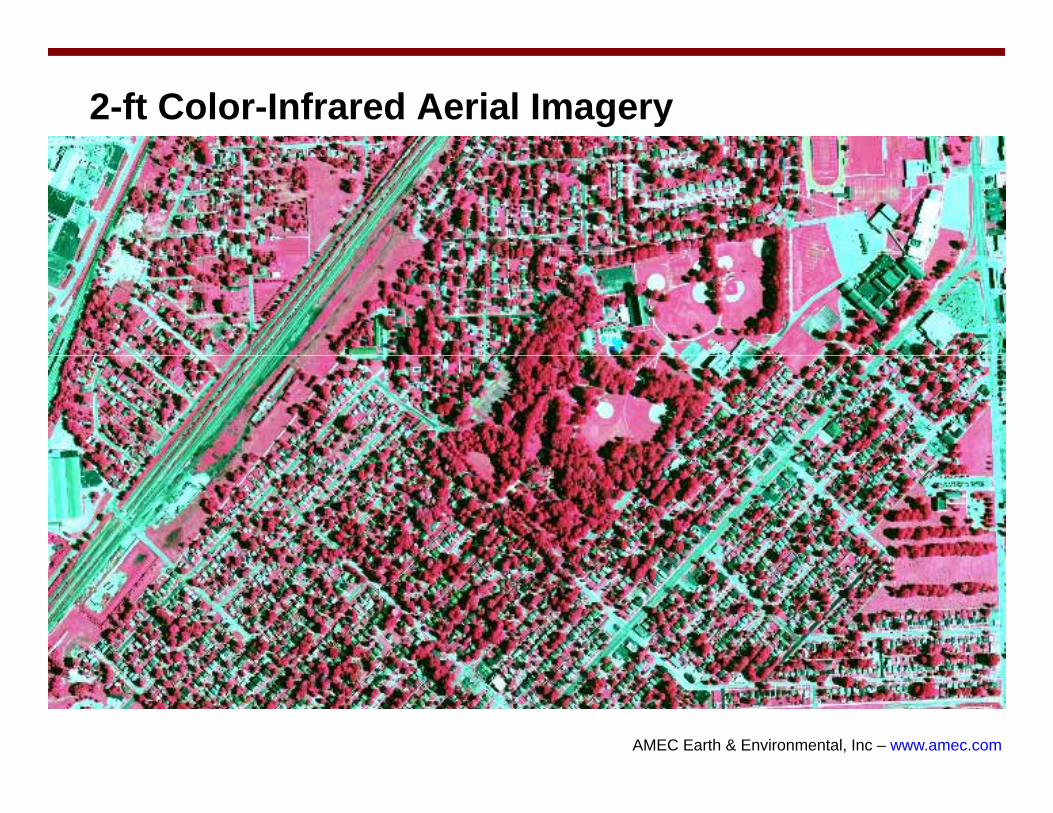
2-ft Color-Infrared Aerial Imagery
Understand | Communicate | CollaborateUnderstand | Communicate | Collaborate AMEC Earth & Environmental, Inc – www.amec.com
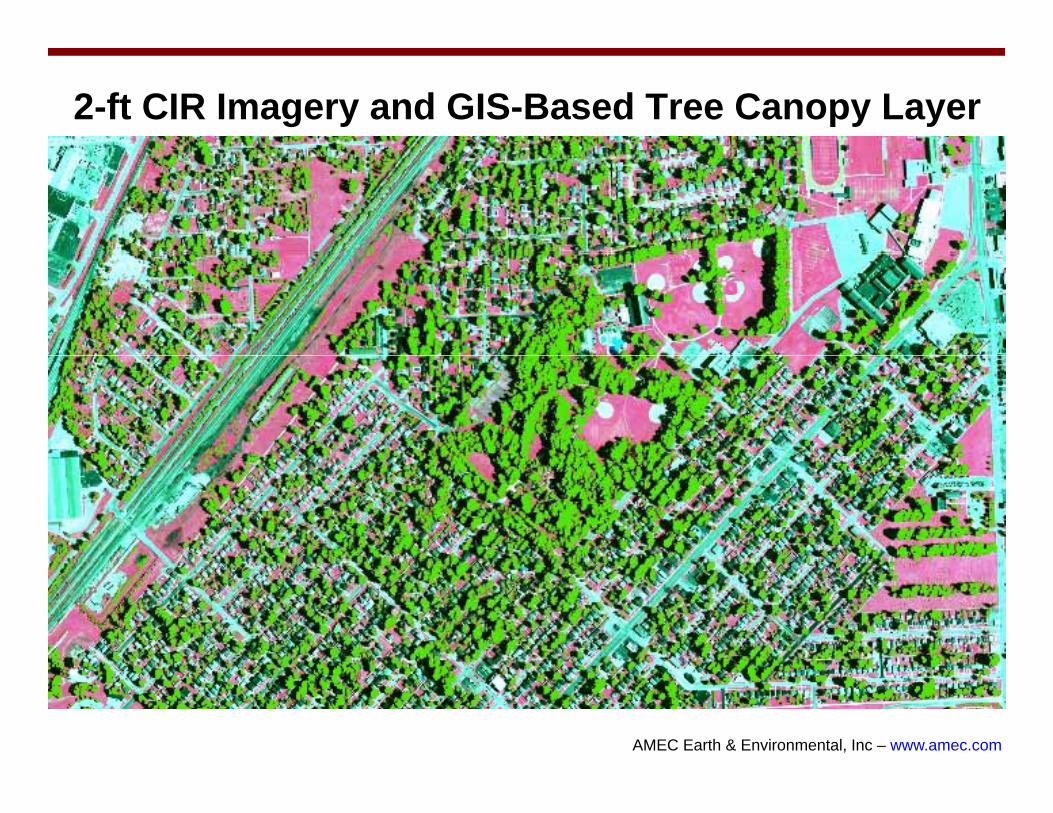
2-ft CIR Imagery and GIS-Based Tree Canopy Layer
AMEC Earth & Environmental, Inc – www.amec.com

Hudson, OH UTC by Individual Parcel Lots
AMEC Earth & Environmental, Inc – www.amec.com

Seattle UTC Change 2002-2007
AMEC Earth & Environmental, Inc – www.amec.com

Seattle UTC Change 2002-2007
d U C
2002 Canopy C
2007 Canopy C
Goal Canopy CLand Use Category Cover Cover Cover
Commercial/ Mixed Use 8.4% 9.7% 15%
Developed Park or Boulevard 25.9% 25.5% 25%
Downtown 4.2% 4.7% 12%
Major Institution 18 4% 19 4% 20%Major Institution 18.4% 19.4% 20%
Manufacturing/ Industrial 3.8% 4.3% 10%
Multi-Family 16.6% 17.1% 20%
Parks Natural Area 82.5% 80.4% 80%
Single Family 25.2% 25.7% 31%
AMEC Earth & Environmental, Inc – www.amec.com
Total 22.5% 22.9% 30%
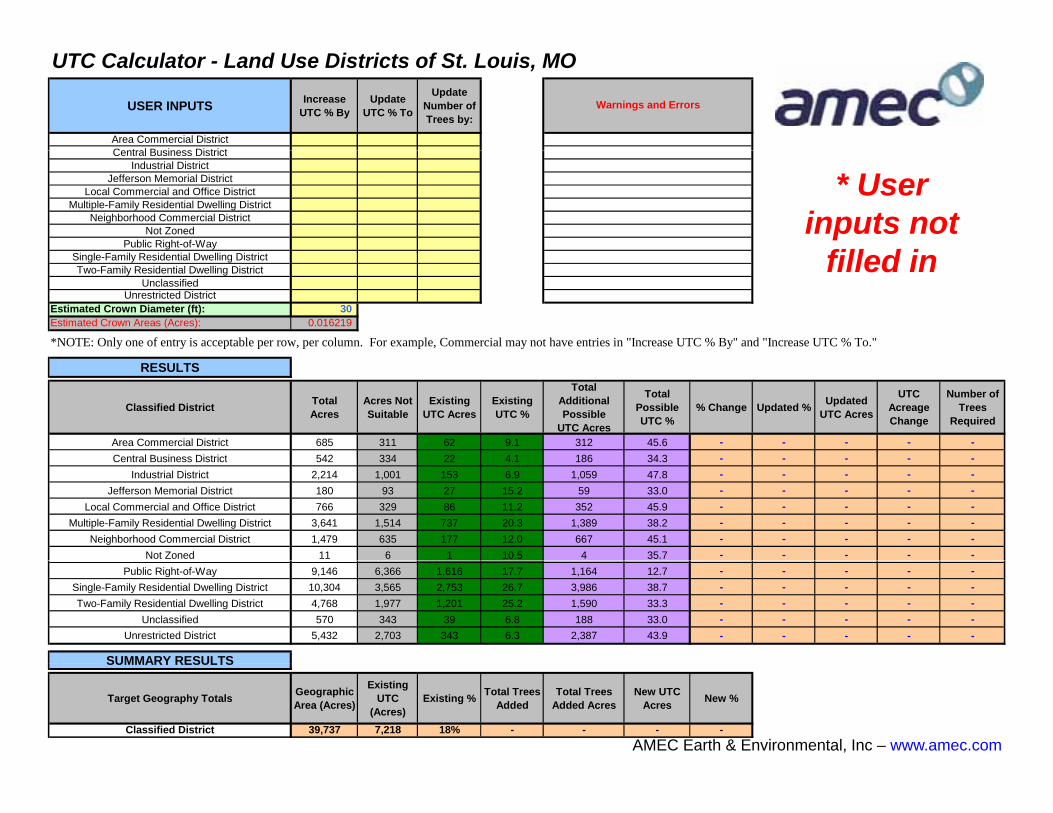
UTC Calculator - Land Use Districts of St. Louis, MO
USER INPUTS Increase UTC % By
Update UTC % To
Update Number of Trees by:
Area Commercial DistrictCentral B siness District
Warnings and Errors
Central Business DistrictIndustrial District
Jefferson Memorial DistrictLocal Commercial and Office District
Multiple-Family Residential Dwelling DistrictNeighborhood Commercial District
Not ZonedPublic Right-of-Way
Si l F il R id i l D lli Di i
* User inputs not
fill d iSingle-Family Residential Dwelling DistrictTwo-Family Residential Dwelling District
UnclassifiedUnrestricted District
Estimated Crown Diameter (ft): 30 Estimated Crown Areas (Acres): 0.016219
*NOTE: Only one of entry is acceptable per row, per column. For example, Commercial may not have entries in "Increase UTC % By" and "Increase UTC % To."
filled in
RESULTS
Classified District TotalAcres
Acres NotSuitable
ExistingUTC Acres
ExistingUTC %
Total Additional Possible
UTC Acres
Total PossibleUTC %
% Change Updated % Updated UTC Acres
UTC Acreage Change
Number of Trees
Required
Area Commercial District 685 311 62 9.1 312 45.6 - - - - -Central Business District 542 334 22 4 1 186 34 3Central Business District 542 334 22 4.1 186 34.3 - - - - -
Industrial District 2,214 1,001 153 6.9 1,059 47.8 - - - - -Jefferson Memorial District 180 93 27 15.2 59 33.0 - - - - -
Local Commercial and Office District 766 329 86 11.2 352 45.9 - - - - -Multiple-Family Residential Dwelling District 3,641 1,514 737 20.3 1,389 38.2 - - - - -
Neighborhood Commercial District 1,479 635 177 12.0 667 45.1 - - - - -Not Zoned 11 6 1 10.5 4 35.7 - - - - -
Public Right-of-Way 9,146 6,366 1,616 17.7 1,164 12.7 - - - - -Single-Family Residential Dwelling District 10,304 3,565 2,753 26.7 3,986 38.7 - - - - -Two-Family Residential Dwelling District 4,768 1,977 1,201 25.2 1,590 33.3 - - - - -
Unclassified 570 343 39 6.8 188 33.0 - - - - -Unrestricted District 5,432 2,703 343 6.3 2,387 43.9 - - - - -
SUMMARY RESULTS
AMEC Earth & Environmental, Inc – www.amec.com
SUMMARY RESULTS
Target Geography Totals Geographic Area (Acres)
Existing UTC
(Acres)Existing % Total Trees
AddedTotal Trees
Added AcresNew UTC
Acres New %
Classified District 39,737 7,218 18% - - - -

UTC Calculator - Land Use Districts of St. Louis, MO
USER INPUTS Increase UTC % By
Update UTC % To
Update Number of Trees by:
Area Commercial District 1,000Central B siness District 5 000
Warnings and Errors
Central Business District 5,000Industrial District 10.0%
Jefferson Memorial District 20.0%Local Commercial and Office District 20.0%
Multiple-Family Residential Dwelling District 50.0%Neighborhood Commercial District 20.0%
Not Zoned 0.0%Public Right-of-Way 20.0%
Si l F il R id i l D lli Di iUTC Exceeds Possible Limit
* User inputs
Single-Family Residential Dwelling District 50.0%Two-Family Residential Dwelling District 50.0%
Unclassified 0.0%Unrestricted District 10.0%
Estimated Crown Diameter (ft): 30 Estimated Crown Areas (Acres): 0.016219
*NOTE: Only one of entry is acceptable per row, per column. For example, Commercial may not have entries in "Increase UTC % By" and "Increase UTC % To."
filled in
RESULTS
Classified District TotalAcres
Acres NotSuitable
ExistingUTC Acres
ExistingUTC %
Total Additional Possible
UTC Acres
Total PossibleUTC %
% Change Updated % Updated UTC Acres
UTC Acreage Change
Number of Trees
Required
Area Commercial District 685 311 62 9.1 312 45.6 2.4 11.5 78.5 16.2 1,000Central Business District 542 334 22 4 1 186 34 3 15 0 19 1 103 3 81 1 5 000Central Business District 542 334 22 4.1 186 34.3 15.0 19.1 103.3 81.1 5,000
Industrial District 2,214 1,001 153 6.9 1,059 47.8 10.0 16.9 374.1 220.7 13,608Jefferson Memorial District 180 93 27 15.2 59 33.0 20.0 35.2 63.2 35.9 2,214
Local Commercial and Office District 766 329 86 11.2 352 45.9 20.0 31.2 239.1 153.4 9,458Multiple-Family Residential Dwelling District 3,641 1,514 737 20.3 1,389 38.2 29.7 50.0 1,820.6 1,083.2 66,786
Neighborhood Commercial District 1,479 635 177 12.0 667 45.1 20.0 32.0 473.2 296.4 18,275Not Zoned 11 6 1 10.5 4 35.7 - - - - -
Public Right-of-Way 9,146 6,366 1,616 17.7 1,164 12.7 20.0 37.7 3,448.0 1,831.7 112,935Single-Family Residential Dwelling District 10,304 3,565 2,753 26.7 3,986 38.7 23.3 50.0 5,151.9 2,399.1 147,919Two-Family Residential Dwelling District 4,768 1,977 1,201 25.2 1,590 33.3 24.8 50.0 2,383.8 1,182.8 72,927
Unclassified 570 343 39 6.8 188 33.0 - - - - -Unrestricted District 5,432 2,703 343 6.3 2,387 43.9 10.0 16.3 885.4 542.9 33,473
SUMMARY RESULTS
AMEC Earth & Environmental, Inc – www.amec.com
SUMMARY RESULTS
Target Geography Totals Geographic Area (Acres)
Existing UTC
(Acres)Existing % Total Trees
AddedTotal Trees
Added AcresNew UTC
Acres New %
Classified District 39,737 7,218 18% 483,594 7,843 15,061 38%

Planting Sites Analysis g yand Prioritization
AMEC Earth & Environmental, Inc – www.amec.com

Dallas, TX - Texas Trees Foundation
Purpose: increase funding opportunities with
Partners: City of Dallas, Texas Forest Service, NCTCOG, Urban Renewal, EPA, g pp
a practical model that will identify and prioritize tree planting sites using GIS
NCTCOG, Urban Renewal, EPA, Houston Advanced Research Center, USDA Forest Service and UC-Davis
planting sites using GIS, remote sensing and environmental factors
AMEC Earth & Environmental, Inc – www.amec.com

Existing Tree Canopy and Potential Planting Sites
AMEC Earth & Environmental, Inc – www.amec.com

Planting Sites in Heat Islands
Planting SitesThat Would
B t Miti tBest MitigateUrban Heat Islands
AMEC Earth & Environmental, Inc – www.amec.com

Energy Savings (East/West, yellow dots) vs. Other Planting Sites (green dots)
AMEC Earth & Environmental, Inc – www.amec.com

GIS DataInputs:
Parking Lots
p
(# of trees needed(# of trees neededto reach 15% canopy cover)
AMEC Earth & Environmental, Inc – www.amec.com

Dallas Roadmap p“Web Map”
• Doesn’t require GIS software or training
• Includes reporting functionality
• Communicate, plan and visualize with partners and funding sources for successful tree planting
AMEC Earth & Environmental, Inc – www.amec.com
tree planting programs

Suitability Modeling Weights (applied to factors)g ( pp )
Scenarios
F t
Scenarios
Factors
AMEC Earth & Environmental, Inc – www.amec.com

Community Tree Inventory Programs
AMEC Earth & Environmental, Inc – www.amec.com

Community Tree Inventory Programs
AMEC Earth & Environmental, Inc – www.amec.com

Sample Web Resources
• http://www.itreetools.org/index.php
• http://www.itreetools.org/eco/resources/UFUG_Air_Pollution_Removal.pdf
• http://www.phillywatersheds.org/ltcpu/Vol02_TBL.pdf
• http://www.urbanforestrysouth.org/p y g
• www.cufr.ucdavis.edu/
• www.dnr.state.md.us/forests/publications/urban.html
AMEC Earth & Environmental, Inc – www.amec.com
• www.treelink.org/
Research or Data Gaps
• Public Health data at the local level for spatial l i ith l d d d hi d tanalysis with land cover and demographic data
• Partnerships between Public Health and treePartnerships between Public Health and tree planting and maintenance programs
R h li ki i t l b fit l t d t• Research linking environmental benefits related to air quality with asthma, ozone reduction, etc
• Others??
AMEC Earth & Environmental, Inc – www.amec.com

Discussion
• Do you think urban forests have a significant role in public health?in public health?
• What partnership opportunities do you see?
• What initiatives are underway in your area?
• What is the biggest hurdle to incorporating urban vegetation into public health policy?
• What will you do with this information?
AMEC Earth & Environmental, Inc – www.amec.com

Contact Information
Ian HanouS i P j t MSenior Project ManagerAMEC Earth & Environmental, Inc.355 S Teller St, Suite #300, Denver, CO 80226,(303) 742-5320 (office)(303) 503-4846 (mobile)[email protected]
AMEC Earth & Environmental, Inc – www.amec.com