establishing the baseline to ensure ... - … mill ha. ... method to estimate change against the...
TRANSCRIPT

ESTABLISHING THE BASELINE TO ENSURE
ENVIRONMENTAL PERFORMANCE –
THE INDONESIA APPROACH
Ministry of Forestry of the Republic of Indonesia
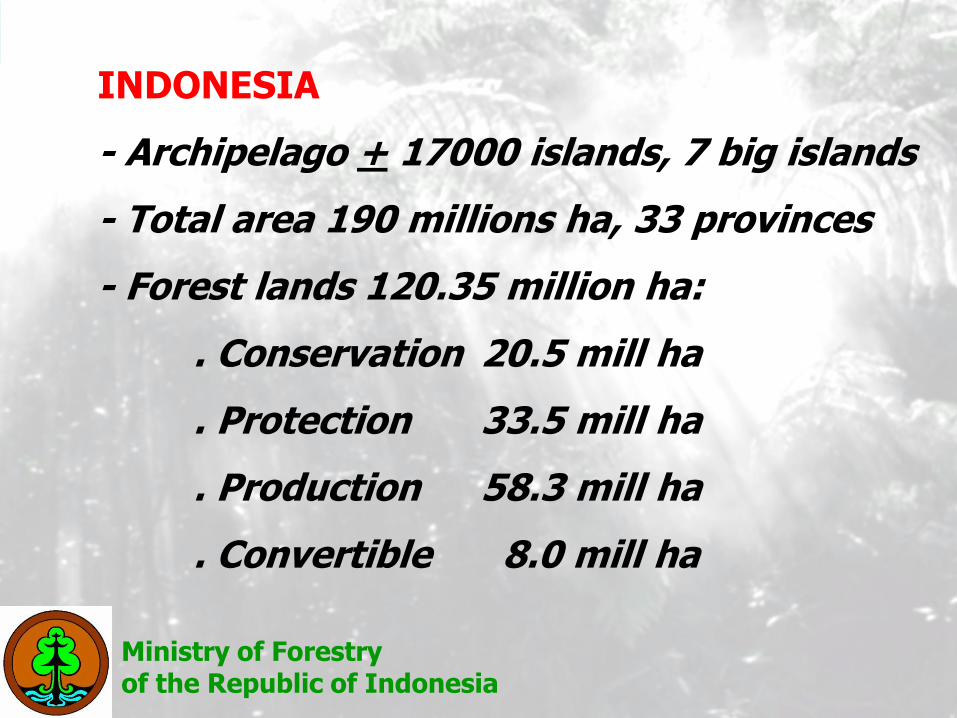
INDONESIA
- Archipelago + 17000 islands, 7 big islands
- Total area 190 millions ha, 33 provinces
- Forest lands 120.35 million ha:
. Conservation 20.5 mill ha
. Protection 33.5 mill ha
. Production 58.3 mill ha
. Convertible 8.0 mill ha
Ministry of Forestry of the Republic of Indonesia
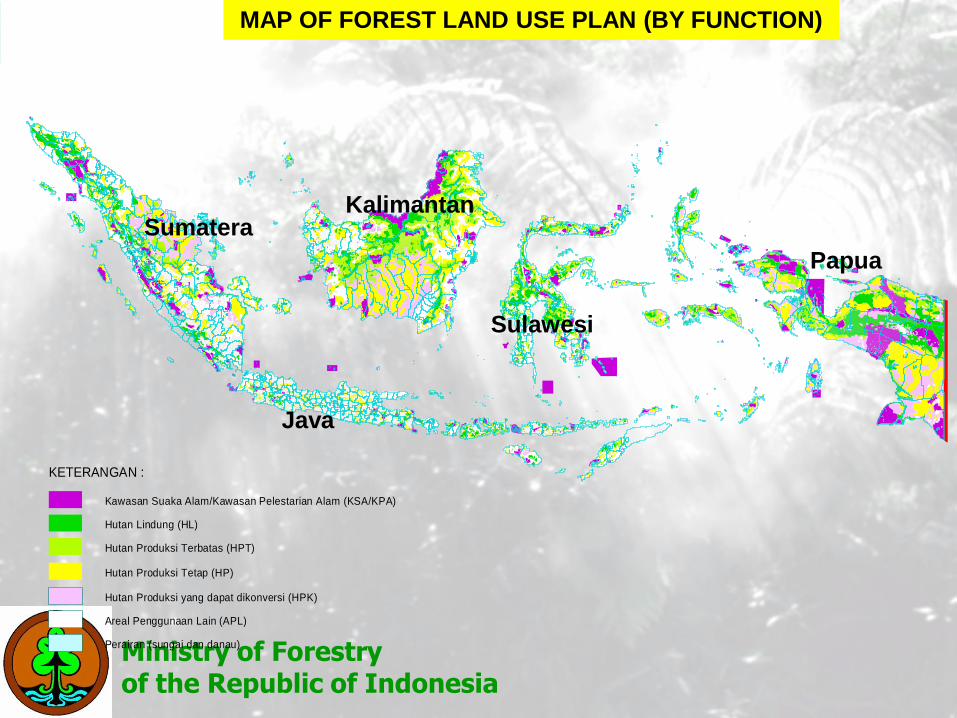
PETA KAWASAN HUTAN INDONESIA
KETERANGAN :
Hutan Lindung (HL)
Kawasan Suaka Alam/Kawasan Pelestarian Alam (KSA/KPA)
Hutan Produksi Tetap (HP)
Hutan Produksi Terbatas (HPT)
Hutan Produksi yang dapat dikonversi (HPK)
Areal Penggunaan Lain (APL)
Perairan (sungai dan danau)
KETERANGAN :
HL
KSA/KPA
HP
HPT
HPK
APL
Perairan
MAP OF FOREST LAND USE PLAN (BY FUNCTION)
Java
SumateraKalimantan
Sulawesi
Papua

Trend of forest condition
Forest
cover
Time
Papua
Kalimantan
Sumatra
Forest/plantations/
agric. mosaics
Undisturbed
forests
Forest/agric.
mosaics
Forest
frontiers
Java?
Papua
Kalimantan
SumatraJava
REDD
AR/REDD
I. INTRODUCTION
Ministry of Forestry of the Republic of Indonesia

Baseline Reduced
Deforestation
Monitoring Carbon
markets ($)
Payment
distribution
mechanism
How much
forest will be
lost in the
future?
What can be
done to reduce
deforestation?
What would it
take to
implement it?
How much
would it cost?
Where to start
from?
How can we
prove that
reduced
deforestation
as really taken
place?
Who is entitled
to sell forestry
carbon?
Who are the
buyers?
How is the
price formed?
How should
carbon
transactions be
regulated?
How will
carbon
payments be
distributed to
provide
incentives to
reduce
deforestation?
Who has a
legal
entitlement to
receive
payments?
I. INTRODUCTION
Ministry of Forestry of the Republic of Indonesia
Elements of REDD need to be developed in Indonesia

A BASELINE:
• A projection of emissions from
deforestation and forest degradation
• A reference for measuring
reductions in emissions from
deforestation and forest degradation
II. BASELINE CONCEPTS
Ministry of Forestry of the Republic of Indonesia

How is a Baseline Set?
1. Historical approach
– a straight projection of the past
•Which years and how far back?
– an average of the past
•Which years and how far back?
2. Modeling approach (Business as usual)
- it is modeled on planned land use
..Spatial model
..Non spatial model
- Which model, how far to the future?
II. BASELINE CONCEPTS
Ministry of Forestry of the Republic of Indonesia
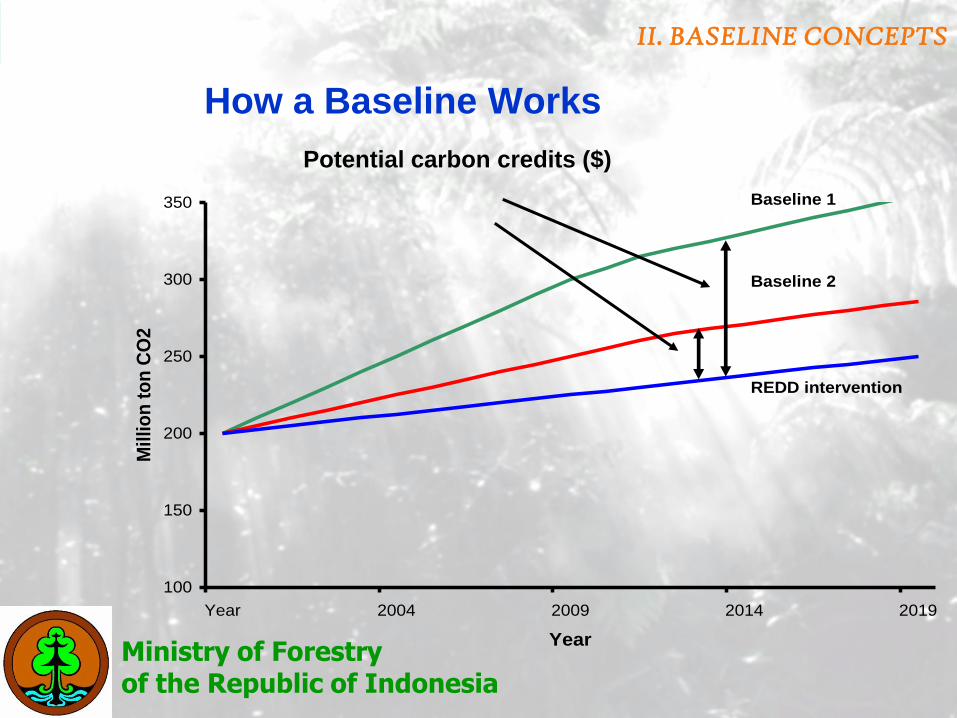
How a Baseline Works
100
150
200
250
300
350
Year 2004 2009 2014 2019
Year
Millio
n t
on
CO
2
Baseline 1
Baseline 2
REDD intervention
Potential carbon credits ($)
II. BASELINE CONCEPTS
Ministry of Forestry of the Republic of Indonesia

SCALE OF BASELINE:
• Local - individual project/sub national» Leakage ?
• National - whole country» Leakage ?
• Global - several countries in the system» Leakage ?
II. BASELINE CONCEPTS
Ministry of Forestry of the Republic of Indonesia

Approach for activity data:
change in areas
Tiers for emission factors:
change in C stocks
1. Non-spatial country statistics
(e.g. FAO )—generally gives
net change in forest area
1. IPCC default values at a
continental scale
2. Based on maps, surveys, and
other national statistical data
2. Country specific data for
key factors
3. Spatially specific data from
interpretation of remote
sensing data
3.National inventory of key
carbon stocks, repeated
measurements or
modeling
Approaches and Tiers (IPCC GPG 2006)
II. BASELINE CONCEPTS
Ministry of Forestry of the Republic of Indonesia
Method to estimate change against the baseline

• Table 5: Sectoral Report for LULUCF (1 Table)
• Tables 5.A - 5.F: Sectoral Background Data for LULUCF for each of the land use categories (6 Tables):
– 5.A: Forest Land
– 5.B: Cropland
– 5.C: Grassland
– 5.D: Wetlands
– 5.E: Settlements
– 5.F: Other Land
• Tables 5 (I) - (V): Sectoral Background Data for LULUCF for emission sources from land use categories (5 Tables):– Table 5(I): Direct N20 emissions from N fertilization
– Table 5(II): N2O emissions from drainage of soils
– Table 5(III): N20 emissions from disturbance associated with land-use conversion to cropland
– Table 5(IV): Carbon emissions from agricultural lime application
– Table 5 (V): Biomass burning
II. BASELINE CONCEPTS
Ministry of Forestry of the Republic of Indonesia
The 12 common reporting format (CRF) Tables
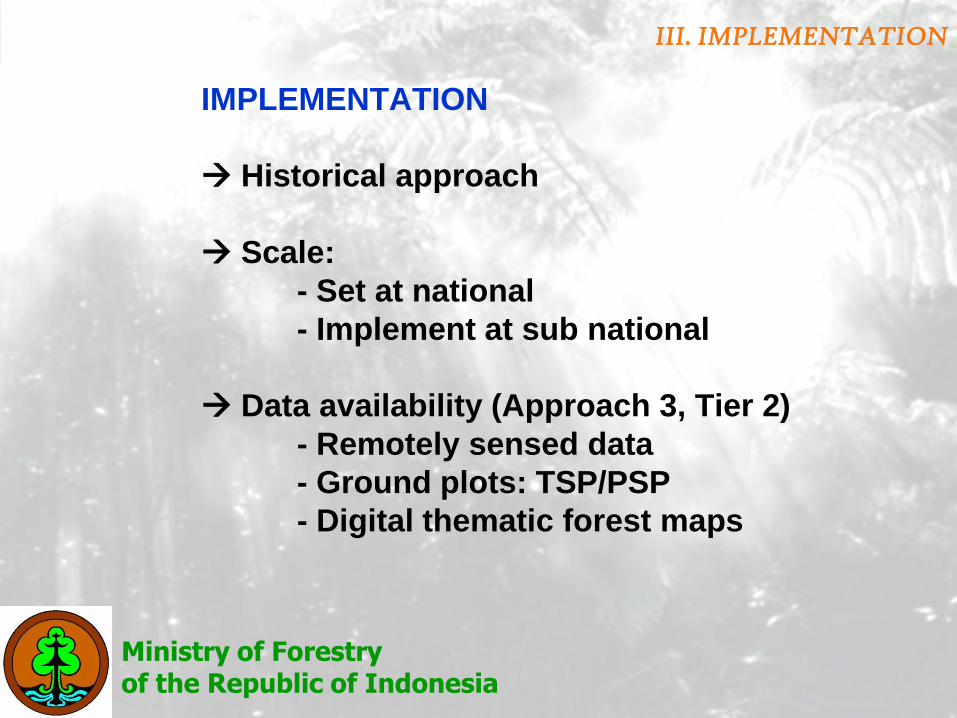
IMPLEMENTATION
Historical approach
Scale:
- Set at national
- Implement at sub national
Data availability (Approach 3, Tier 2)
- Remotely sensed data
- Ground plots: TSP/PSP
- Digital thematic forest maps
III. IMPLEMENTATION
Ministry of Forestry of the Republic of Indonesia

Ministry of Forestry of the Republic of Indonesia
DATA AVAILABILITY
A. MEDIUM SPATIAL RESOLUTION IMAGES
Satellite data (3-year monitoring):
. 1997 Landsat MSS, Landsat 5
. 2000 Landsat TM 7
. 2003 Landsat ETM 7
. 2006 Landsat ETM 7, SPOT 4
Outputs:
. Landcover maps – forest, non-forest (1997)
. Landcover maps – 23 classes (2000-2006)
III. IMPLEMENTATION

Ministry of Forestry of the Republic of Indonesia
INDONESIA FOREST COVERS
0
10000
20000
30000
40000
50000
60000
Conserv Protec Product
Forest
Non forest
No data
AR
EA
(x 0
00 H
a)

Year 2000
Year 2003
Year 2006
FOREST COVER CHANGE
BASED ON LANDSAT
IMAGES
III. IMPLEMENTATION
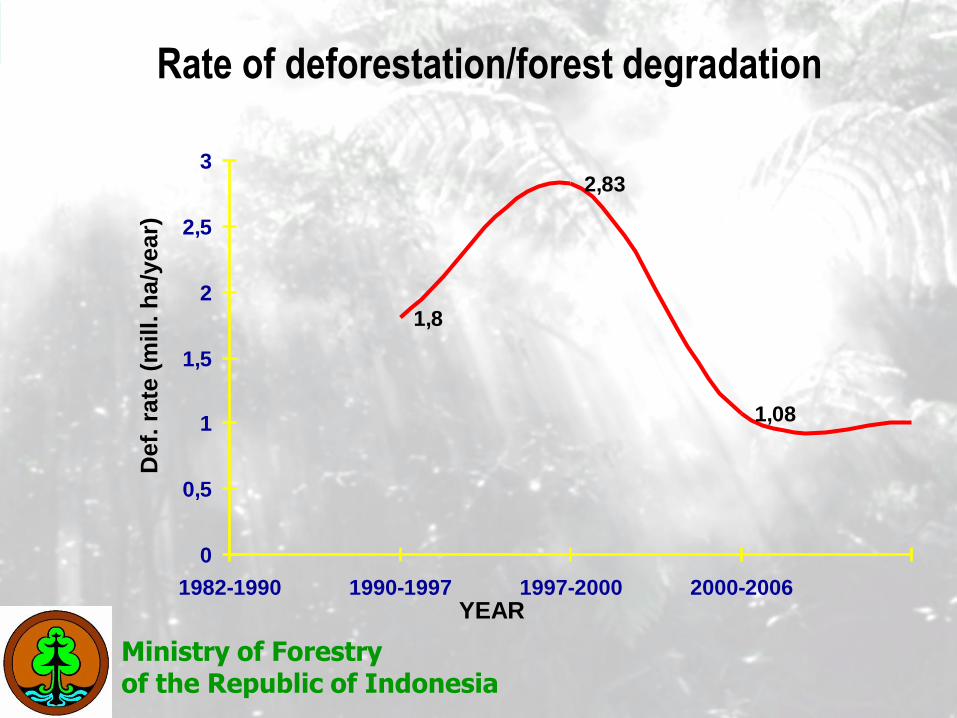
1,8
2,83
1,08
0
0,5
1
1,5
2
2,5
3
1982-1990 1990-1997 1997-2000 2000-2006YEAR
Def.
rate
(m
ill.
ha/y
ear)
Ministry of Forestry of the Republic of Indonesia
Rate of deforestation/forest degradation

• Annual monitoring
• Fill gaps of Landsat 3-year monitoring
• Cover class: forest, non forest
• Map scale 1:500.000
>> In-cooperation with SDSU, WB, WRI (2006)
B. LOW SPATIAL RESOLUTION IMAGES >250 M (MODIS)
Ministry of Forestry of the Republic of Indonesia
III. IMPLEMENTATION

Vegetation Continuous Field of percent tree cover for Indonesia for the year 2000.
Ministry of Forestry of the Republic of Indonesia
III. IMPLEMENTATION
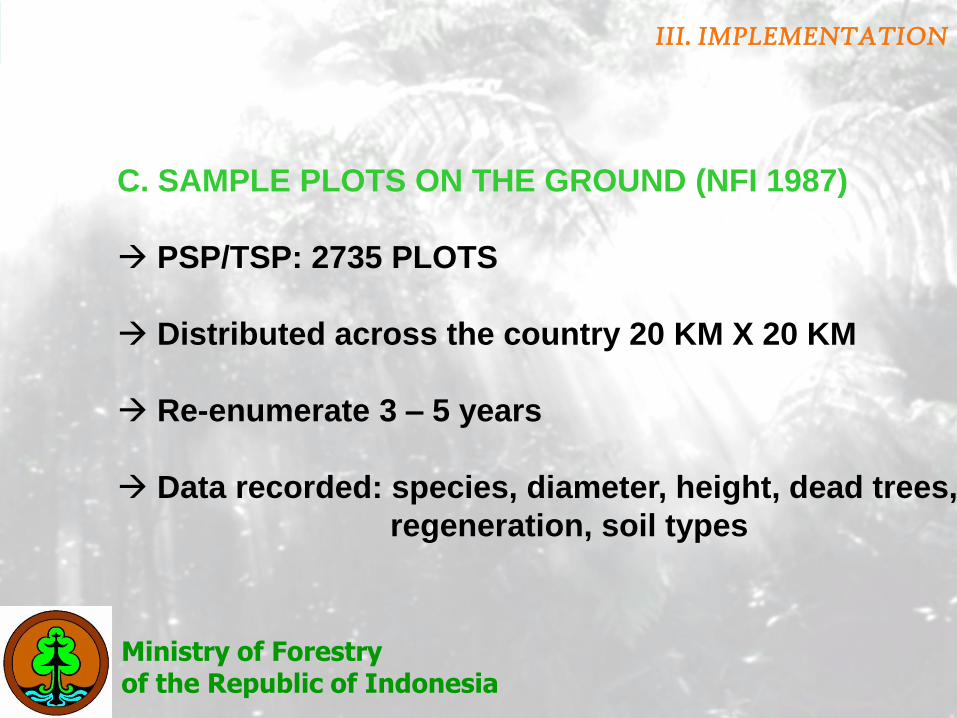
C. SAMPLE PLOTS ON THE GROUND (NFI 1987)
PSP/TSP: 2735 PLOTS
Distributed across the country 20 KM X 20 KM
Re-enumerate 3 – 5 years
Data recorded: species, diameter, height, dead trees,
regeneration, soil types
Ministry of Forestry of the Republic of Indonesia
III. IMPLEMENTATION

DISTRIBUTION OF 2.735 CLUSTER PLOTS ACROSS INDONESIA
Ministry of Forestry of the Republic of Indonesia

• To estimate stand volume using multi spatial imageries
• Multi-stage sampling:- Medium resolution images (Landsat TM)- High resolution images (SPOT 5)- Field surveys
• Production Forest- 2006 – Kalimantan- 2007 – Sumatera, Sulawesi- 2008 – Papua, Maluku, Nusteng
D. STAND VOLUME ESTIMATION
Ministry of Forestry of the Republic of Indonesia
III. IMPLEMENTATION

How is the baseline set
using available data?
• Maps of forest cover from Landsat images
– 23 land cover classes
• Maps of PSP/TSP
– 2735 plots
• Maps of rainfall
– Wet, moist, dry
Ministry of Forestry of the Republic of Indonesia
III. IMPLEMENTATION

Land cover 23 classes
PSP/TSP Rainfall
CALCULATE
BIOMASS &
CARBON
Biomass & carbon stock
Land cover 6 classes
Reclassify
Union
Ministry of Forestry of the Republic of Indonesia


Ministry of Forestry of the Republic of Indonesia

Ministry of Forestry of the Republic of Indonesia
IV. Follow up Development
- Capacity building
. Transfer of technology
. Pilot/demonstration activities
. Development of technical guidance
- Data base management:
. Data/images requirement/availability
-Definition:
. forest, deforestation, degradation

Ministry of Forestry of the Republic of Indonesia
V. SUMMARY
• In Indonesia, forest lands occupy more than 60% of the country
land territory. Based on forest land use plans, Indonesia Forests
consist of conservation forest, protection forest, and production
forest.
• Forest cover monitoring in Indonesia indicated that deforestation
and forest degradation have significantly decreased in the last
decade.
• As encouraged on the decision of COP-13, the IPCC GPG 2006 is
used as the reference to set baselines and to measure emission
changes. Common reporting format of GPG 2006 included
components of environmental performance in the tables.
• Data from several sources (remotely sensed data, on the ground
sample plots, and digital forest thematic maps) are available in
the Ministry of Forestry of Indonesia. These data met the
approach 3 of activity data, and tier 2 of emission factors of the
GPG 2006.

Ministry of Forestry of the Republic of Indonesia
V. SUMMARY
• Setting the baseline with the available data has been carried out
under the standard procedure of the GPG 2006, and results are in
progress.
• The baseline exercises indicated that the procedures are
complex, and detailed data are needed.
