establishment of pavement maintenance management …
TRANSCRIPT
www.theinternationaljournal.org > RJSITM: Volume: 04, Number: 10, August-2015 Page 1
Establishment of Pavement Maintenance Management System
In Industrial Area
Vivek S. Hokam
PhD Research Scholar, Department of Civil Engineering, Visvesvaraya National Institute of
Technology Nagpur, Maharashtra, India
&
Dr. V. S. Landge
Associate Professor, Department of Civil Engineering, Visvesvaraya National Institute of Technology
Nagpur, Maharashtra, India
Abstract
MIDC (Maharashtra Industrial Development Corporation) is one statutory body responsible for
providing infrastructure for industrial units. MIDC have elaborate road network of 2826 Kms of
length. MIDC has spent Rs. 18820 Millions on development and maintenance of road network, which
is @ 32% of total development expenditure. Pavement is one of the major infrastructures of
Corporation. The maintenance system used for preserving road network is insufficient to assist in
decision making during the design life of pavements. A system has been presented to facilitate the
decision maker for prioritizing maintenance strategy for the industrial pavements in order to reduce the
deterioration. The Concept of Pavement Management System is already established for National
Highway and State highway network in India. However it‟s relatively new for small establishments.
Pavement is one of the prime infrastructural elements for MIDC area. This paper embodies the effort
done for establishing Pavement Maintenance Priority Index (MPI).
Key Words: PMMS, Overloading, Deterioration, MPI,
1. Introduction: A pavement management system is a planning tool that is able to model
pavement and surface deterioration due to the effects of traffic and environmental ageing. PMS
contains a series of decision units used to determine how and when repair should be done. The
prioritization of maintenance activities is commonly applied in pavement maintenance planning. As a
result of overuse, overloading and aging, deterioration of roads occurs. The cost of restoring such
roads to the required standard escalates the total cost, with a consequent effect on cost of goods and
services. A good pavement management system is therefore necessary to reduce the rate of
deterioration in order to maintain the pavement in serviceable manner. A widely adopted practice is to
express maintenance priority in the form of a priority index, computed by means of an empirical
mathematical expression (the priority model) which is convenient to use.
A number of pavement condition prediction models which simulate the deterioration process of road
pavements and forecast their condition over time have been developed for use by road maintenance
agencies in various countries. They include Defect Rating Index, Present Serviceability Rating (PSR)
and Surface Rating (SR). Traditionally, ranking of road sections for maintenance operations in
industrial areas have been based wholly on the experience and judgement of pavement engineers and
maintenance personnel. However, due to the randomness and complex interactions of the factors
involved in pavement deterioration mechanism, this approach is inefficient, prone to errors and may
lead to improperly scheduled maintenance activities.
This paper presents the methodology for developing model for prioritizing road pavement maintenance
in industrial areas and putting into consideration all possible factors that affect pavement deterioration
process.
1.2 Model Parameters: In other to determine the model parameters, data on the road under study was
collected to obtain a broad picture of pavement conditions under various climatic and traffic situations.
The Information on pavement distresses such as length of cracks, rut depths and area of potholes was

www.theinternationaljournal.org > RJSITM: Volume: 04, Number: 10, August-2015 Page 2
obtained through field survey and measurement. The implementation procedure that involves the
following tasks:
1. Defining the roadway network by breaking it into segments and creating an inventory for each
segment.
2. Gathering and inspecting the pavement condition and maintenance data of each segment.
3. Calculating the pavement condition assessment by selecting an evaluation criteria.
4. Determining the treatment strategy and cost for each segment based on pavement condition.
5. Developing a method of prioritizing segments when funding constraints exists in a pavement
maintenance program.
6. Documenting and reporting results.
2. Methodology for maintenance prioritization at network level:
A simplified procedure for determining the maintenance priorities of industrial road at network level
are suggested in this study. The study aims at developing a structured approach to evaluate and
prioritize industrial road sections in the existing industrial road network, which will help in making
efficient use of the available limited maintenance budgetary provisions.
There are number of factors that influence the performance of industrial roads. Five deterioration
parameters namely cracking, ravelling, rutting, potholes and edge-break are considered for suggesting
maintenance index for the industrial roads.
2.1 Cracking Area: Sum of rectangular areas circumscribing manifest distress, expressed in square
meter area as shown in Fig. No. 1 and 2.
Fig. No. 1 Fig. No. 2
2.2 Ravelling Area: Area of loss of material from wearing surface, expressed in square meter area as
shown in Fig. No. 3 and 4.
Fig. No. 3 Fig. No. 4

www.theinternationaljournal.org > RJSITM: Volume: 04, Number: 10, August-2015 Page 3
2.3 Rutting: Permanent traffic-associated deformation within pavement layers which, if channelized
into wheel paths, accumulates over time and becomes manifested as a rut, expressed as the maximum
depth under 2 m straightedge placed transversely across a wheel path as shown in Fig. No. 5 and 6.
Fig. No. 5 Fig. No. 6
2.4 Number of Potholes: A pothole is defined as an open cavity in road surface with at least 150 mm
diameter and at least 25 mm depth as shown in Fig. No. 7 and 8. Number of potholes per kilometer
expressed in terms of the number of „standard‟ sized potholes of area 0.1 m2. The World Bank
describes one pothole means accommodating 10 liters of water.
Fig. No. 7 Fig. No.8
2.5 Edge Break Area: Loss of bituminous surface material (and possibly base materials) from the
edge of the pavement as shown in Fig. No. 9 and 10, expressed in square meters.
Fig. No 9 Fig. No. 10
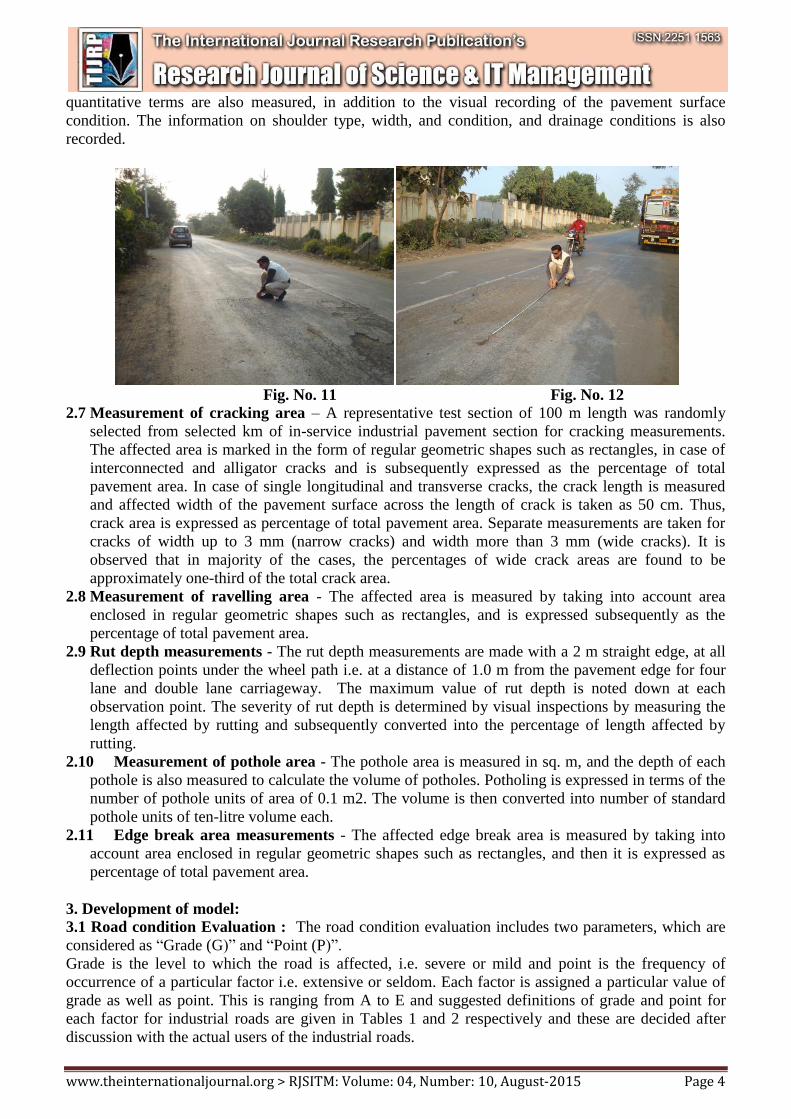
2.6 Surface Distress Measurements: The surface distress measurements are carried out periodically
in various cycles as before monsoon, after monsoon and during winter season for each selected in-
service industrial road section as shown in Fig. No. 11 and 12. The type and extent of distress
developed at the surface i.e. cracking, ravelling, patch work, potholes, rut depth, depressions etc. are
observed based on the visual condition survey. The extent and type of distress developed in
www.theinternationaljournal.org > RJSITM: Volume: 04, Number: 10, August-2015 Page 4
quantitative terms are also measured, in addition to the visual recording of the pavement surface
condition. The information on shoulder type, width, and condition, and drainage conditions is also
recorded.
Fig. No. 11 Fig. No. 12
2.7 Measurement of cracking area – A representative test section of 100 m length was randomly
selected from selected km of in-service industrial pavement section for cracking measurements.
The affected area is marked in the form of regular geometric shapes such as rectangles, in case of
interconnected and alligator cracks and is subsequently expressed as the percentage of total
pavement area. In case of single longitudinal and transverse cracks, the crack length is measured
and affected width of the pavement surface across the length of crack is taken as 50 cm. Thus,
crack area is expressed as percentage of total pavement area. Separate measurements are taken for
cracks of width up to 3 mm (narrow cracks) and width more than 3 mm (wide cracks). It is
observed that in majority of the cases, the percentages of wide crack areas are found to be
approximately one-third of the total crack area.
2.8 Measurement of ravelling area - The affected area is measured by taking into account area
enclosed in regular geometric shapes such as rectangles, and is expressed subsequently as the
percentage of total pavement area.
2.9 Rut depth measurements - The rut depth measurements are made with a 2 m straight edge, at all
deflection points under the wheel path i.e. at a distance of 1.0 m from the pavement edge for four
lane and double lane carriageway. The maximum value of rut depth is noted down at each
observation point. The severity of rut depth is determined by visual inspections by measuring the
length affected by rutting and subsequently converted into the percentage of length affected by
rutting.
2.10 Measurement of pothole area - The pothole area is measured in sq. m, and the depth of each
pothole is also measured to calculate the volume of potholes. Potholing is expressed in terms of the
number of pothole units of area of 0.1 m2. The volume is then converted into number of standard
pothole units of ten-litre volume each.
2.11 Edge break area measurements - The affected edge break area is measured by taking into
account area enclosed in regular geometric shapes such as rectangles, and then it is expressed as
percentage of total pavement area.
3. Development of model:
3.1 Road condition Evaluation : The road condition evaluation includes two parameters, which are
considered as “Grade (G)” and “Point (P)”.
Grade is the level to which the road is affected, i.e. severe or mild and point is the frequency of
occurrence of a particular factor i.e. extensive or seldom. Each factor is assigned a particular value of
grade as well as point. This is ranging from A to E and suggested definitions of grade and point for
each factor for industrial roads are given in Tables 1 and 2 respectively and these are decided after
discussion with the actual users of the industrial roads.
www.theinternationaljournal.org > RJSITM: Volume: 04, Number: 10, August-2015 Page 5
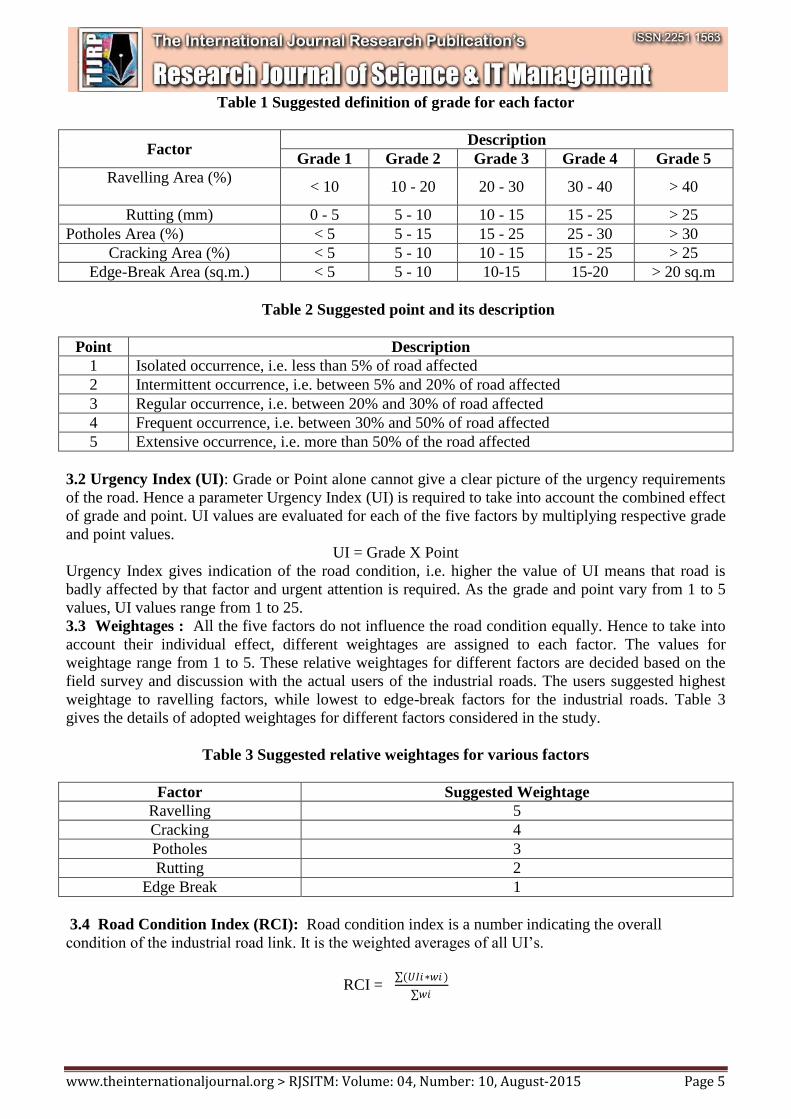
Table 1 Suggested definition of grade for each factor
Factor Description
Grade 1 Grade 2 Grade 3 Grade 4 Grade 5
Ravelling Area (%)
< 10 10 - 20 20 - 30 30 - 40 > 40
Rutting (mm) 0 - 5 5 - 10 10 - 15 15 - 25 > 25
Potholes Area (%) < 5 5 - 15 15 - 25 25 - 30 > 30
Cracking Area (%) < 5 5 - 10 10 - 15 15 - 25 > 25
Edge-Break Area (sq.m.) < 5 5 - 10 10-15 15-20 > 20 sq.m
Table 2 Suggested point and its description
Point Description
1 Isolated occurrence, i.e. less than 5% of road affected
2 Intermittent occurrence, i.e. between 5% and 20% of road affected
3 Regular occurrence, i.e. between 20% and 30% of road affected
4 Frequent occurrence, i.e. between 30% and 50% of road affected
5 Extensive occurrence, i.e. more than 50% of the road affected
3.2 Urgency Index (UI): Grade or Point alone cannot give a clear picture of the urgency requirements
of the road. Hence a parameter Urgency Index (UI) is required to take into account the combined effect
of grade and point. UI values are evaluated for each of the five factors by multiplying respective grade
and point values.
UI = Grade X Point
Urgency Index gives indication of the road condition, i.e. higher the value of UI means that road is
badly affected by that factor and urgent attention is required. As the grade and point vary from 1 to 5
values, UI values range from 1 to 25.
3.3 Weightages : All the five factors do not influence the road condition equally. Hence to take into
account their individual effect, different weightages are assigned to each factor. The values for
weightage range from 1 to 5. These relative weightages for different factors are decided based on the
field survey and discussion with the actual users of the industrial roads. The users suggested highest
weightage to ravelling factors, while lowest to edge-break factors for the industrial roads. Table 3
gives the details of adopted weightages for different factors considered in the study.
Table 3 Suggested relative weightages for various factors
Factor Suggested Weightage
Ravelling 5
Cracking 4
Potholes 3
Rutting 2
Edge Break 1
3.4 Road Condition Index (RCI): Road condition index is a number indicating the overall
condition of the industrial road link. It is the weighted averages of all UI‟s.
RCI = (𝑈𝐼𝑖∗𝑤𝑖 )
𝑤𝑖
www.theinternationaljournal.org > RJSITM: Volume: 04, Number: 10, August-2015 Page 6
RCI values range from 1 to 25. Suggested ranges of RCI values and its implication are given in Table
4 and these are decided based upon the discussion with the actual users of the industrial roads.
Table no. 4. Suggested condition of the road as indicated by RCI
RCI Condition
1 to 5 Road is in very good condition.
Between 5-
10 Road is in good condition, although there are few isolated problems.
Between 10-
15 Road condition is inacceptable level but notable short out-comings are present.
Between 15-
20 Road is deteriorated to such an extent that fairly urgent attention is required.
More than 20 Road is very badly affected and urgent attention is required.
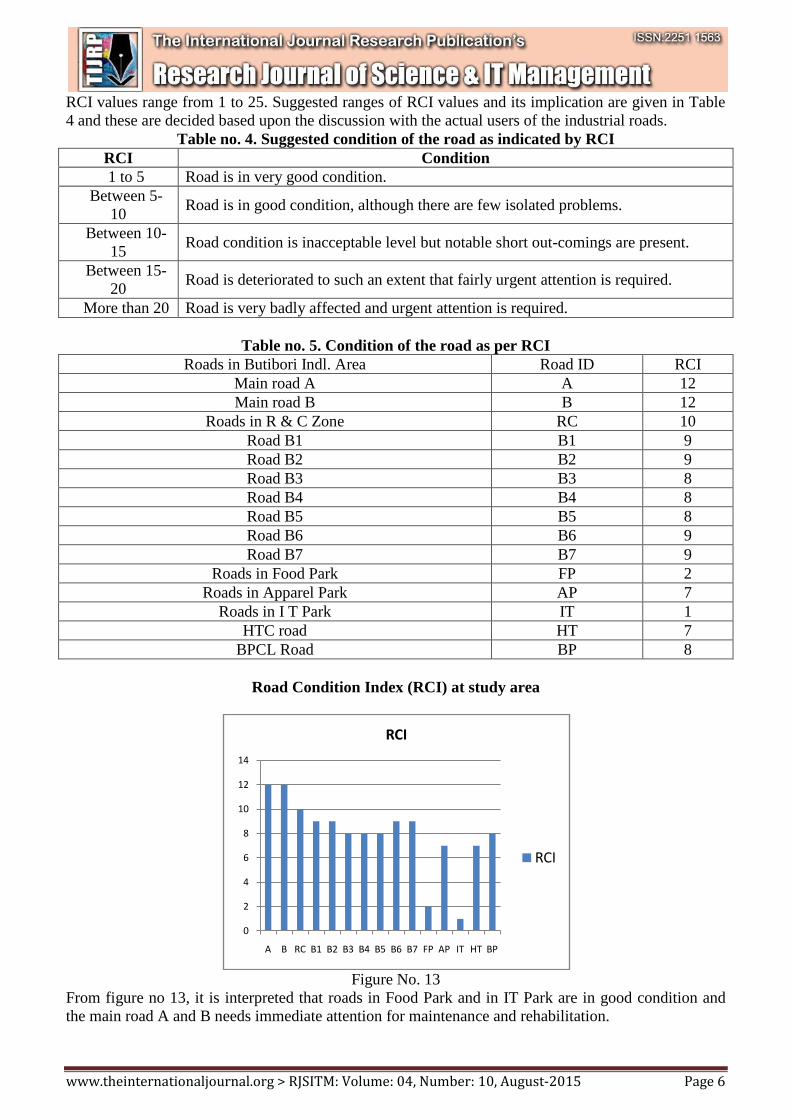
Table no. 5. Condition of the road as per RCI
Roads in Butibori Indl. Area Road ID RCI
Main road A A 12
Main road B B 12
Roads in R & C Zone RC 10
Road B1 B1 9
Road B2 B2 9
Road B3 B3 8
Road B4 B4 8
Road B5 B5 8
Road B6 B6 9
Road B7 B7 9
Roads in Food Park FP 2
Roads in Apparel Park AP 7
Roads in I T Park IT 1
HTC road HT 7
BPCL Road BP 8
Road Condition Index (RCI) at study area
Figure No. 13
From figure no 13, it is interpreted that roads in Food Park and in IT Park are in good condition and
the main road A and B needs immediate attention for maintenance and rehabilitation.
0
2
4
6
8
10
12
14
A B RC B1 B2 B3 B4 B5 B6 B7 FP AP IT HT BP
RCI
RCI

www.theinternationaljournal.org > RJSITM: Volume: 04, Number: 10, August-2015 Page 7
3.5 Traffic Volume (TV) and Traffic Composition (TC): The priority given for the maintenance of
the industrial road does not depend only on the condition of the road. It also depends on number and
type of vehicles using the road. Hence two parameters, Traffic Volume (TV) and Traffic Composition
(TC) are incorporated into the model. Traffic Volume (TV) indicates the number of vehicles passing
on the particular link in a day. Different ranges for these parameters as suggested in present study are
given in Table 6. The values of TV and TC are restricted to 5.
Table 6 Suggested ranges of parameters for TV/TC values
TV/TC
Values 1 2 3 4 5
Vehicles/day <
100 100-200 200-300 300-400 >400
Composition Cars Cars, Jeeps,
tractors
Cars, Jeeps,
tractors, trucks
Cars, Jeeps,
tractors, trucks,
buses
Cars, Jeeps, tractors,
trucks, buses, trailers
3.6 Road User Factor (RUF)
A road user factor (RUF) is calculated by taking into consideration the combined effect of TV and TC.
RUF is defined as follows:
RUF = TV * TC
A higher value of RUF indicates that the particular road in industrial area is being used extensively and
is more important amongst the industrial road network.
3.7 Maintenance Priority Index (MPI)
This is the final index, indicating the overall priority associated with the industrial road link. MPI is
defined as follows:
MPI = RCI * RUF
Higher value of MPI suggests that the industrial road link is in bad condition and should be given
higher maintenance priority while considering the maintenance for industrial road network.
Table no. 7. Condition of the road as per RCI
Roads in Butibori Indl. Area Road ID RCI TV/TC value MPI
Main road A A 12 5 60
Main road B B 12 5 60
Roads in R & C Zone RC 10 4 40
Road B1 B1 9 3 27
Road B2 B2 9 3 27
Road B3 B3 8 3 24
Road B4 B4 8 3 24
Road B5 B5 8 3 24
Road B6 B6 9 4 36
Road B7 B7 9 4 36
Roads in Food Park FP 2 2 4
Roads in Apparel Park AP 7 4 28
Roads in I T Park IT 1 4 4
HTC road HT 7 4 28
BPCL Road BP 8 5 40

www.theinternationaljournal.org > RJSITM: Volume: 04, Number: 10, August-2015 Page 8
Fig 14 Maintenance Priority Index (MPI)
4. Conclusion : The details of calculated MPI values for selected industrial road sections in Butibori
Industrial Area based on Sept / Oct 2013 field study data are shown in table no. 7 and the graph is
plotted as shown in Fig. 14. It is observed that industrial road section main road A, main road B, roads
in R & C zone and BPCL road are having the highest maintenance priority amongst the selected
industrial road sections in Butibori of the study area from Fig 14. With reference to this suggested
simple approach in present study, the maintenance authority of industrial roads, has given priority
amongst the industrial road network. Accordingly roads having highest MPI i.e. main road A, main
road B has given maintenance treatments with reference to severity and now the roads are in excellent
condition. The another road network namely roads in R & C zone and BPCL road has given next
priority and accordingly the maintenance work has started from Oct. 2014.
5. References:
1. Adebayo Owalabi and O. S. Abiola. (2011). “Development Of Priority Index Assessment
Model For Road Pavements In Nigeria”. 8th International Conference on Managing Pavement
Assets, Paper ICMPA093.
2. Aggarwal, S., Jain, S.S. and Parida, M. (2002) “ Maintenance Management of Highway
Infrastructure in India”, Transport Track, Vol.2 No.1.
3. Aggarwal, S., Jain, S.S. and Parida, M. (2005), “Use of Pavement Management Systems in
Developing Countries”, Indian Highways, Indian Roads Congress, New Delhi, Vol. 33, No.4,
April, pp. 5-16.
4. Burger W., Canisius P. & Sulten P. (1994). “Towards a New Pavement Management System in
Germany: Organization, Data Collection, Experience and Innovations”. Third International
Conference On Managing Pavements, San Antonio, Texas, May 22-26, 1994. Conference
Proceedings, Volume 1. Transportation Research Board, Washington DC 20001. USA
5. Dhir M.P, Phull Y.R., and Sood V.K. (1987). “Studies towards development of pavement
management system in India”. 2nd North American Pavement Management Conference,
Toronto, Canada. pp. 1.379-1.390.
6. Gandhi, Ujaval, Shenoy, M. Nitin., and Sarkar, Ashok. K. (2004). “Development of
maintenance plan for earth roads”. Indian Highways, 32(9), Indian Road Congress, New Delhi.
7. Haas R. & Hudson W. R. (1978). "Pavement Management Systems” McGraw- Hill Book
Company.
8. Jain, S.S., Parida, M. and Thube, D.T. (2008), “Performance Based Maintenance Management
for Rural Roads”, Paper submitted for presentation 6th International Conference on Road and
Airfield Pavement Technology (ICPT 2008) to be held at Sapporo, Japan on July 20-23.
9. Jain, S.S., Parida, M., Aggarwal, S. (2001) “Emerging Trends in Development of Road
Maintenance Management System”, CE&CR, November, pp. 39-46.
0
10
20
30
40
50
60
70
A B RC B1 B2 B3 B4 B5 B6 B7 FP AP IT HT BP
www.theinternationaljournal.org > RJSITM: Volume: 04, Number: 10, August-2015 Page 9
10. Khabiry Mehdi and Gourbian Nader (2009). “An experience on street pavement maintenance
Program in small region- (Bafq city)”. ARPN (Asian Research Publishing Network) Journal of
Engineering and Applied Sciences, Vol. 4, NO. 3, May 2009. Pp. 1-5.
11. Sanjiv Aggarwal, Prof. (Dr.) S.S. Jain & Dr. M. Parida (2004). “Development of pavement
management system for Indian National Highway network”. Indian road congress Journal,
Paper no. 502, pp 272-326.
12. Shafik Jendia and Maher Al Hallaq (2005). “Development of a Pavement Maintenance
Management System (PMMS) For Gaza City”. Journal of the Islamic University of Gaza
(Series of Natural Studies & Engineering) Vol.13, No.1, pp 119-138.
13. Tienchote Chongpeepien and Veeris Ammarapala (2008). “A Review of Thailand Pavement
Management System (TPMS)”. IEEE Journal, Proceedings of the 2008 IEEE ICMIT, pp 554-
558.
14. Town of Brookfield, Public Works Department, Pavement Management Plan (2011)
15. Ufuk Kirbas and Mustafa Gursoy. “Developing the basics of pavement management system in
Besiktas district and evaluation of the selected sections” (2010). Scientific Research and
Essays Vol. 5(8), pp. 806-812.