establishment & production costs for grapes in · pdf fileestablishment & production...
TRANSCRIPT

Establishment & Production Costs for Grapes in Ontario
2009 Economic Report


Establishment and Production Costs for Grapes in Ontario 2009 Economic Report
Editors Ken Slingerland, Tender Fruit and Grape Specialist and John Molenhuis, Business Analysis and Cost of Production Lead, OMAFRA Acknowledgements This report was prepared with the help of the following: Hugh Fraser, Agricultural Engineer, OMAFRA; Dr. Wendy McFadden-Smith, Tender Fruit and Grape IPM Specialist; John Barkovic, Regional Claims Manager, Agricorp; Grape Growers of Ontario; the growers that participated in the survey; Karen VanWeerden, part-time assistant contracted by GGO to interview growers for the surveys, Vineland Growers Co-operative Ltd., Louth Niagara Ltd., Lakeview Vineyard Equipment, St. Catharines New Holland Ltd. and Redtrac International Ltd. This report was reviewed by Dr. Helen Fisher, Research Scientist, Department of Plant Agriculture, Uni-versity of Guelph and prepared by Carolyn Prieur, Client Service Representative, OMAFRA. Need technical and business information? Contact the Agricultural Information Contact Centre at 1-877-424-1300 or [email protected] A complete listing of all OMAFRA products and services is available on the OMAFRA website. To obtain copies of ministry publications, contact Service Ontario through the Service Ontario Publications website at www.ServiceOntario.ca/publications, or by phone at 1-800-668-9938 or 416-326-5300 or TTY 1-800-268-7095. The report was published by the Ontario Ministry of Agriculture, Food and Rural Affairs. Copies of the report were printed and mailed by the Grape Growers of Ontario.


Table of Contents 1. Introduction
Objectives.................................................................................................................................................................. 1 Methods and Procedures ........................................................................................................................................ 1 Assumptions ............................................................................................................................................................. 1 Changes for the 2009 Economic Report .............................................................................................................. 2
Vinifera and Hybrid Grapes 2. Cabernet Franc
Preplant year ............................................................................................................................................................. 4 Planting year.............................................................................................................................................................. 5 Second year ............................................................................................................................................................... 6 Third year .................................................................................................................................................................. 9 Fourth year .............................................................................................................................................................. 11 Total establishment cost........................................................................................................................................ 12 Mature Vineyard: Annual Costs ........................................................................................................................... 13 Break even point..................................................................................................................................................... 15 Graph: Cost of Production 1997 - 2009 at 3.5 tonne per acre ....................................................................... 17 Graph: Cost of Production 1997 - 2009 at 4.5 tonne per acre ....................................................................... 17
3. Chardonnay Preplant year ........................................................................................................................................................... 18 Planting year............................................................................................................................................................ 19 Second year ............................................................................................................................................................. 21 Third year ................................................................................................................................................................ 23 Fourth year .............................................................................................................................................................. 25 Total establishment cost........................................................................................................................................ 26 Mature Vineyard: Annual Costs ........................................................................................................................... 27 Break even point..................................................................................................................................................... 29 Graph: Cost of Production 1997 - 2009 at 4 tonne per acre .......................................................................... 31 Graph: Cost of Production 1997 - 2009 at 5 tonne per acre .......................................................................... 31
4. Vidal
Preplant year ........................................................................................................................................................... 32 Planting year............................................................................................................................................................ 33 Second year ............................................................................................................................................................. 35 Third year ................................................................................................................................................................ 37 Fourth year .............................................................................................................................................................. 39 Total establishment cost........................................................................................................................................ 40 Mature Vineyard: Annual Costs ........................................................................................................................... 41 Break even point..................................................................................................................................................... 43 Graph: Cost of Production 1997 - 2009 at 5 tonne per acre .......................................................................... 45 Graph: Cost of Production 1997 - 2009 at 7 tonne per acre .......................................................................... 45
Labrusca Grapes 5. Concord
Mature Vineyard: Annual Costs ........................................................................................................................... 47
i
1
1. Introduction This report tries to reflect the management practices used by growers today. Soil condition, cultivar selec-tions, personal grower management decisions and the unique meso-climates of Ontario result in many differ-ent grower practices in training systems, pest manage-ment programs and fertilizer rates. The four grape cultivars in this document are the same as those used four years ago. Concord, Vidal, Chardon-nay and Cabernet Franc reflect some of the most signifi-cant cultivars in Ontario. They represent Labrusca, French Hybrid and Vinifera types of grapes. Objectives
The grape industry utilizes the cost of establishment and cost of production models extensively to determine the profitability of the industry and to help growers make business decisions and planting plans. Growers can use the input costs as general guidelines to help identify strengths and weaknesses in their business. Methods and procedures
The information used in this report is derived from pre-vious economic reports, surveys with growers and pri-vate consultants, and data from researchers, extensions and agribusiness. Input costs are organized into variable and measurable fixed costs. Variable costs include plants, seed, fertiliz-ers, pesticides, marketing charges, hired labour, tractor and machine costs and interest on operating capital. Measurable fixed costs are interest on investment, de-preciation and other overhead cost items such as a por-tion of utilities, equipment storage, insurance, account-ing, farm vehicles and general maintenance. Assumptions
The contribution margin is obtained by subtracting the total variable costs from the gross income. Contribution margin is the amount of funds that the crop contributes to cover fixed costs and provide returns for owner man-agement and investment.
Hired Labour is charged at $12.40 per hour, which in-cludes benefits (Workers’ Compensation, Employment Insurance and Canada Pension Plan). A blended base price of $12.40 is used to reflect the workforce in the grape industry, which is made up of both local and off-shore labour. Offshore labour includes an allowance for additional costs such as air flight, housing, local trans-portation. Hired machine operator labour is charged at $ 17.20 per hour (includes benefits). Machinery and equipment costs are based on a commer-cial farm size of 50 acres. Machinery costs are calculated based on the purchase price for 2009, useful life, annual use and trade-in value. Interest on investment is calculated at 2.0 %, which is the average interest rate paid by chartered banks on Guaranteed Investment Certificates. The interest rate applied to the operating capital is based on the prime lending rate of 2.25 % plus 1.0% = 3.25%. Interest on operating capital is compounded annually until the vineyard generates revenue to first pay down the accumulated interest and then the outstanding prin-cipal. Operating capital includes cost of materials, fuel, repairs, labour and other cash items but does not include farm overhead expenses. Fuel costs are based on the size of each tractor, truck or self-propelled machine used in production. The follow-ing farm-gate fuel prices are used: gasoline 92.0 cents/litre and diesel 75.0 cents/litre. Fuel costs are net of all 2009 provincial and federal rebates. Yields are given as both a low and high range to reflect the wide differences of commercial production and con-ditions for each farm. Yields used are 25% of annual yield for year 3 and 50% for year 4 (high range).

2
The prices listed are the 2009 payments for each cultivar sold through the Ontario Grape Growers Marketing Board. Chardonnay and Cabernet Franc vines are spaced at 9 x 4 feet and 1210 vines per acre. 1 acre = 9 rows with approximately 134 vines per row. Vidal vines are spaced at 9 x 5 feet and 968 vines per acre. 1 acre = 9 rows with approximately 108 vines per row. Labrusca vines are spaced at 10 x 6 feet and 728 vines per acre. 1 acre = 8 rows with approximately 91 vines per row. The training system for Vinifera grapes is a vertical shoot position system (i.e. Pendelbogen), while Labrusca and French Hybrid grapes are trained to four-cane kniffin. The establishment of the vineyard covers a 4.5 year pe-riod: a half-year for pre-plant preparation, one year for planting and three years for the vine to grow to full cropping potential. Crop Services includes several items such as petiole and soil sampling, pest monitoring, etc. The establishment costs will need to be recovered over the productive life of the vineyard. An estimate of the annual costs to recover establishment costs is included in the Total Establishment Costs section for each vari-ety. They are amortized over the 21 years of full pro-duction at a rate of interest of 2.0%. Due to rounding, figures may not add to the total shown. Changes for the 2009 Economic Report
Costs continue to rise faster than gross revenues. Hand labour wages rose 14% while skilled tractor driver wages climbed 21% since 2005. Gross revenue per tonne actu-ally declined 1.5% since 2005. Wind Machines for minimizing spring/fall frosts and winter injury are included for the first time in the cost of production.
Additional operations: shoot thinning, shoot position-ing, tucking, leaf removal, are added to the operations to include more detail to the canopy management. Other minor changes include – using less fertilizer, extra mowing in the vineyard, and one additional spray in the vineyard. Land costs and carrying charges are not included as part of the establishment or production costs because of the extreme variance in land prices. Land ownership and rental prices vary considerably from farm to farm depending on road location, services, soil types, access to water, and potential for urban devel-opment or establishing a new winery. For this reason a space is provided to insert land rental cost in the vari-able cost section and land ownership in the fixed cost section. Costs should be added into vineyard establish-ment and cost of production. A management allowance is not included as a cost. All labour costs are charged to the project whether the owner performs the task or whether it was hired out. Two additional tables have been added in the report; “The Breakeven Yield to cover variable costs” and “The Breakeven Yield to cover all costs”. These assumptions reflect the current practices in the industry and do not necessarily represent recommenda-tions from the contributors. Newer plantings of these varieties may involve higher vine densities, alternative training systems and other innovative cultural practices. The authors assume no liability or responsibility as a result of the reader relying or acting upon the information contained herein. Any use or misuse of the information is the sole responsibility of the reader.

VINIFERA AND HYBRID
GRAPES
3

4
2. Cabernet Franc
Preplant Year
Cost per acre ($) Variable Costs Actual Budget Labour: Machinery operator, 4.2 hrs 72 Custom Plowing 23 Cover Crop 46 Machine Costs :Repairs and maintenance 33 Fuel 36 Consulting Fees 32 Interest on operating capital 65 Land rental Land Preparation (levelling etc.) 850 Tile Drainage 2918 Total Variable Costs 4075 Fixed Costs Machine Costs: Depreciation 59 Interest on investment 13 Other overhead 107 Land ownership Measurable Fixed Costs 178 Total Measurable "Preplant Year” Costs 4254
Operation Labour(hours)
Labour Costs
Machine Costs*
Fixed Costs
Total Costs
Machine: Discing (2x) 1.9 33 29 27 88 Cultivating 0.9 15 13 11 39 Sub Soiling 0.7 12 12 10 34 Sow Cover Crop 0.7 12 14 24 51 Total Machinery Operator 4.2 72 69 71 213 *Includes maintenance, fuel and repair
Operation Costs
Cabernet Franc - P
replant Year

5
Cost per acre ($)
Variable Costs Actual Budget
Labour: Hand, 28.0 hrs 347 Machine Operator, 19.8 hrs 341 Fertilizer Ammonium Nitrate 3 kg 2 Muriate of Potash, 17 kg 12 Insecticides 0 Fungicides 63 Grape vines, ($2.70/vine) 3267 Custom Trellis:Materials, labour 5306 Training: Stakes, material 1162 Cover crop seed 46 Machine costs: Repairs and Maintenance 90 Fuel 156 Custom Planting 724 Irrigation 171 Consulting Fees 32 Interest on operating capital 513 Land rental Total Variable Costs 12231 Fixed Costs Machine Costs: Depreciation 144 Interest on investment 31 Other overhead 214 Land ownership Measurable Fixed Costs 389 Total Measurable "Planting Year” Costs 12620
Planting Year
Cab
erne
t Fr
anc
- Pla
ntin
g Ye
ar

6
Operation Labour (hours)
Labour Costs
Machine Costs*
Fixed Costs
Total Costs
Hand Weed Control: Hand Hoeing 8.0 99 99 Summer training, tying, trunk est 20.0 248 248 Total Hand Labour 28.0 347 347 Machine Weed Control: Grape Hoeing 4.0 69 43 16 128 Discing (2x) 1.9 33 28 25 86 Cultivating (2x) 1.9 33 24 14 70 Spray Pesticide (2x) 0.9 15 27 32 74 Fertilizing (2x) 0.7 12 9 8 29 Sow Cover Crop 0.7 12 14 24 50 Mowing (3x) 2.1 36 27 14 77 Hilling up 1.8 31 22 20 72 Vineyard Maintenance 3.6 62 42 18 123 Picking up vines & supplies 2.2 38 10 4 52 Total Machinery Operator 19.8 341 246 175 761
*Includes maintenance, fuel and repair
Cabernet Franc - P
lanting Year
Operation Costs

Second Year
Cab
erne
t Fr
anc
- Sec
ond
Yea
r
Cost per acre ($)
Variable Costs Actual Budget Labour: Hand, 22.6 hr 280 Machine Operator, 28.4 hr 488 Fertilizer: Ammonium nitrate, 3 kg 3 Muriate of Potash, 17 kg 14 Insecticides 43 Fungicides 178 Herbicides 19 Replacement vines, 2% 101 Cover crop seed 23 Machine Costs: Repairs and maintenance 113 Fuel 243 Custom Pruning - $.25/vine 303 Custom Tying - $.15/vine 182 Tying material 25 Irrigation 171 Consulting Fees 32 Interest on operating capital 602 Land rental Total Variable Costs 2820 Fixed Costs Machine Costs: Depreciation 178 Interest on investment 39 Other overhead 214 Land ownership Measurable Fixed Costs 431 Total Measurable "Second Year” Costs 3251
7

Cabernet Franc - S
econd Year
Operation Labour (hours)
Labour Costs
Machine Costs*
Fixed Costs
Total Costs
Hand Weed Control: Hand Hoeing 2.6 32 32 Summer training, tying, trunk est 20.0 248 248 Total Hand Labour 22.6 280 280 Machine
Weed Control: Grape Hoeing 4.0 69 43 16 128 Spraying (1x) 0.7 12 10 6 28 Discing (2x) 1.9 33 28 25 86 Cultivation (2x) 1.9 33 24 14 70 Spray Pesticide (7x) 3.1 53 51 41 145 Fertilizing (2x) 1.0 17 12 9 38 Sow cover crop 0.7 12 14 24 50 Mowing (5x) 3.5 60 42 20 122 Hilling up and removal 3.6 62 43 28 133 Vineyard Maintenance 3.6 62 40 16 119 Replacing vines 4.4 76 48 19 143 Total Machinery Operator 28.4 488 356 217 1062
*Includes maintenance, fuel and repair
Operation Costs
8

Third Year
Cab
erne
t Fr
anc
- Th
ird
Year
1.125 tonne (25% Yield) Cost per acre ($)
Variable Costs Actual Budget
Labour: Hand, 44.1 hrs 547 Machine Operator, 30.7 hrs 528 Fertilizer: Ammonium nitrate, 9 kg 7 Muriate of Potash, 39 kg 46 Insecticides 86 Fungicides 357 Herbicides 36 Replacement vines, 1% 50 Cover crop seed 23 Machine Costs: Repairs and maintenance 127 Fuel 262 Custom Pruning - $.31/vine 375 Custom Tying - $.18/vine 218 Tying material 25 Irrigation 171 Bird Control 124 Marketing Board Fees 29 Crop Insurance 156 Consulting Fees 32 Interest on operating capital 726 Land rental Total Variable Costs 3925 Fixed Costs Machine Costs: Depreciation 192 Interest on investment 42 Other overhead 214 Land ownership Measurable Fixed Costs 448 Total Measurable "Third Year” Costs 4373 Contribution Margin Gross Income ($1676 per tonne) 1886 Total Variable Costs 3925 Contribution Margin (no land costs) -2040
9
Operation Costs
Cabernet Franc - Th
ird Year
Operation Labour (hours)
Labour Costs
Machine Costs*
Fixed Costs
Total Costs
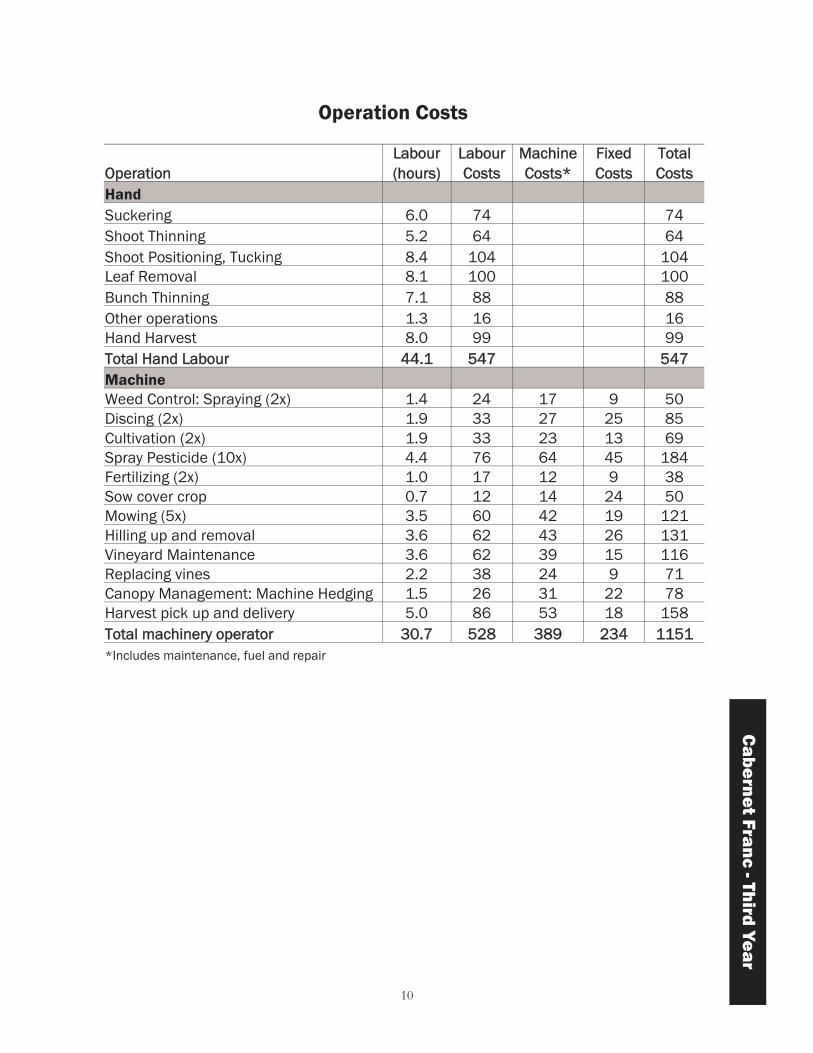
Hand Suckering 6.0 74 74 Shoot Thinning 5.2 64 64 Shoot Positioning, Tucking 8.4 104 104 Leaf Removal 8.1 100 100 Bunch Thinning 7.1 88 88 Other operations 1.3 16 16 Hand Harvest 8.0 99 99 Total Hand Labour 44.1 547 547 Machine Weed Control: Spraying (2x) 1.4 24 17 9 50 Discing (2x) 1.9 33 27 25 85 Cultivation (2x) 1.9 33 23 13 69 Spray Pesticide (10x) 4.4 76 64 45 184 Fertilizing (2x) 1.0 17 12 9 38 Sow cover crop 0.7 12 14 24 50 Mowing (5x) 3.5 60 42 19 121 Hilling up and removal 3.6 62 43 26 131 Vineyard Maintenance 3.6 62 39 15 116 Replacing vines 2.2 38 24 9 71 Canopy Management: Machine Hedging 1.5 26 31 22 78 Harvest pick up and delivery 5.0 86 53 18 158 Total machinery operator 30.7 528 389 234 1151 *Includes maintenance, fuel and repair
10

Fourth Year
Cab
erne
t Fr
anc
- Fo
urth
Yea
r
2.25 tonne (50% Yield) Cost per acre ($)
Variable Costs Actual Budget
Labour: Hand, 44.0 hrs 546 Machine Operator, 26.5 hrs 456 Fertilizer: Ammonium nitrate, 21 kg 17 Muriate of Potash, 48 kg 56 Insecticides 130 Fungicides 541 Herbicides 45 Replacement vines, 1% 50 Cover crop seed 23 Machine Costs: Repairs and maintenance 127 Fuel 226 Custom Pruning - $.36/vine 436 Custom Tying - $.19/vine 230 Tying material 25 Irrigation 171 Bird Control 124 Custom harvest/delivery 182 Marketing Board Fees 59 Crop Insurance 312 Consulting Fees 32 Interest on operating capital 811 Land rental Total Variable Costs 4599 Fixed Costs Machine Costs: Depreciation 192 Interest on investment 42 Other overhead 214 Land ownership Measurable Fixed Costs 448
Total Measurable "Fourth Year” Costs 5047 Contribution Margin Gross Income ($1676) per tonne) 3771 Total Variable Costs 4599 Contribution Margin (no land costs) -828
11

Cabernet Franc - Fo
urth Year
Operation Labour (hours)
Labour Costs
Machine Costs*
Fixed Costs
Total Costs
Hand Suckering 5.0 62 62 Shoot Thinning 6.5 81 81 Shoot Positioning, Tucking 12.3 153 153 Leaf Removal 9.9 123 123 Bunch Thinning 9.0 112 112 Other operations 1.3 16 16 Total Hand Labour 44.0 546 546 Machine Weed Control: Spraying (3x) 2.2 38 26 13 77 Discing (2x) 1.9 33 28 26 87 Cultivation (2x) 1.9 33 24 14 71 Spray Pesticide (10x) 4.4 76 65 47 188 Fertilizing (2x) 1.0 17 12 10 39 Sow cover crop 0.7 12 14 24 50 Mowing (5x) 3.5 60 43 21 124 Hilling up and removal 3.6 62 44 29 135 Vineyard Maintenance 3.6 62 40 17 120 Replacing vines 2.2 38 25 11 73 Canopy Management: Machine Hedging 1.5 26 31 23 80 Total machinery operator 26.5 456 354 234 963 *Includes maintenance, fuel and repair
Operation Costs
Actual Budget Preplant Year 4254 Planting Year 12620 Second Year 3251 Third Year 4078 Fourth Year 4797 Total 29000
Total Establishment Cost
Excludes Board fees, harvest costs and does not include revenues for years 3 and 4. Does not include land costs.
Actual Annual Cost to Recover Establishment Costs 1404 per year
Budget
(amortized over remaining 21 years of vineyard life)
12
Cost per acre ($)
Your Farm Yield Yield
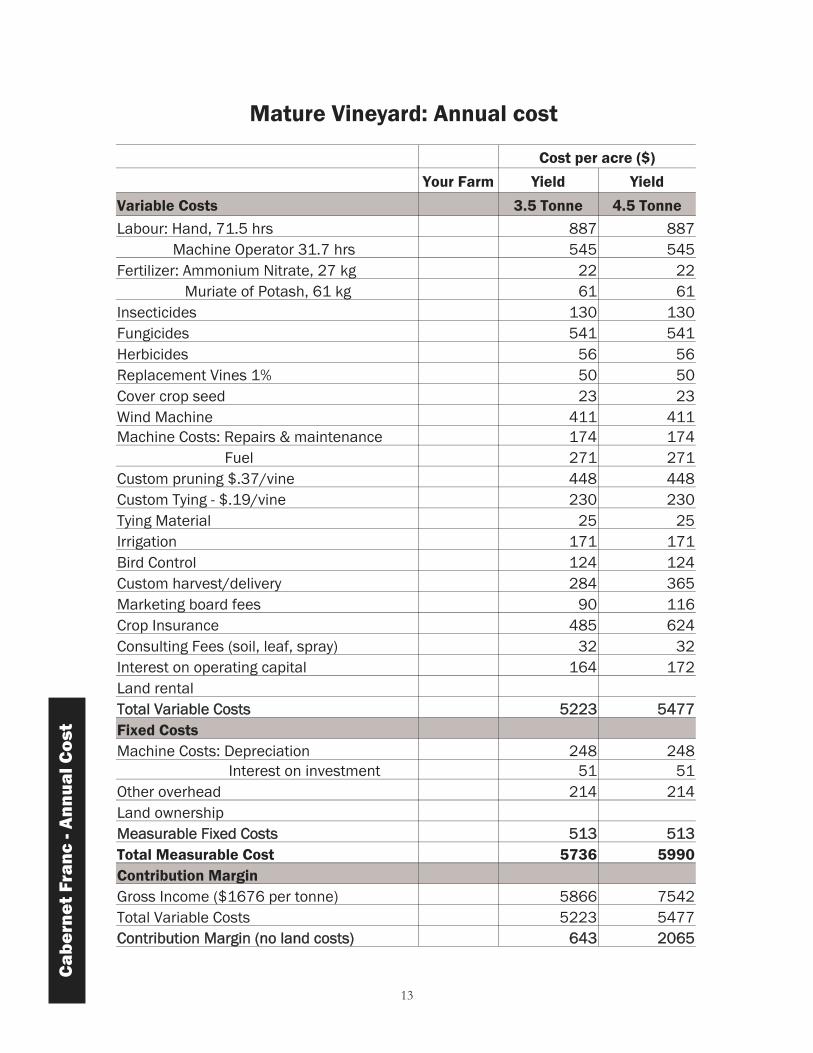
Variable Costs 3.5 Tonne 4.5 Tonne Labour: Hand, 71.5 hrs 887 887 Machine Operator 31.7 hrs 545 545 Fertilizer: Ammonium Nitrate, 27 kg 22 22 Muriate of Potash, 61 kg 61 61 Insecticides 130 130 Fungicides 541 541 Herbicides 56 56 Replacement Vines 1% 50 50 Cover crop seed 23 23 Wind Machine 411 411 Machine Costs: Repairs & maintenance 174 174 Fuel 271 271 Custom pruning $.37/vine 448 448 Custom Tying - $.19/vine 230 230 Tying Material 25 25 Irrigation 171 171 Bird Control 124 124 Custom harvest/delivery 284 365 Marketing board fees 90 116 Crop Insurance 485 624 Consulting Fees (soil, leaf, spray) 32 32 Interest on operating capital 164 172 Land rental Total Variable Costs 5223 5477 Fixed Costs Machine Costs: Depreciation 248 248 Interest on investment 51 51 Other overhead 214 214 Land ownership Measurable Fixed Costs 513 513 Total Measurable Cost 5736 5990 Contribution Margin Gross Income ($1676 per tonne) 5866 7542 Total Variable Costs 5223 5477 Contribution Margin (no land costs) 643 2065
Mature Vineyard: Annual cost
Cab
erne
t Fr
anc
- Ann
ual C
ost
13

Cabernet Franc - A
nnual Co
st
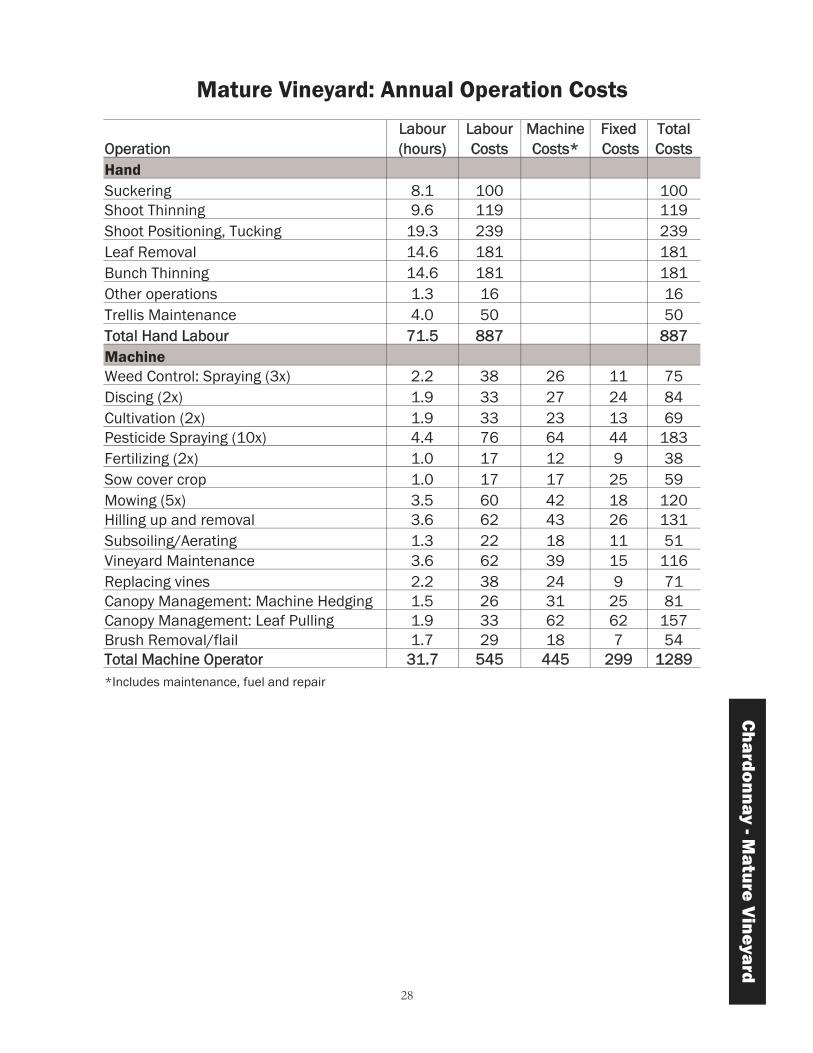
Mature Vineyard: Annual Operation Costs
Operation Labour(hours)
Labour Costs
Machine Costs*
Fixed Costs
Total Costs
Hand Suckering 8.1 100 100 Shoot Thinning 9.6 119 119 Shoot Positioning, Tucking 19.3 239 239 Leaf Removal 14.6 181 181 Bunch Thinning 14.6 181 181 Other operations 1.3 16 16 Trellis Maintenance 4.0 50 50 Total Hand Labour 71.5 887 887 Machine Weed Control: Spraying (3x) 2.2 38 26 11 75 Discing (2x) 1.9 33 27 24 84 Cultivation (2x) 1.9 33 23 13 69 Pesticide Spraying (10x) 4.4 76 64 44 183 Fertilizing (2x) 1.0 17 12 9 38 Sow cover crop 1.0 17 17 25 59 Mowing (5x) 3.5 60 42 18 120 Hilling up and removal 3.6 62 43 26 131 Subsoiling/Aerating 1.3 22 18 11 51 Vineyard Maintenance 3.6 62 39 15 116 Replacing vines 2.2 38 24 9 71 Canopy Management: Machine Hedging 1.5 26 31 25 81 Canopy Management: Leaf Pulling 1.9 33 62 62 157 Brush Removal/flail 1.7 29 18 7 54 Total Machine Operator 31.7 545 445 299 1289
*Includes maintenance, fuel and repair
14
Cab
erne
t Fr
anc
- Bre
ak E
ven
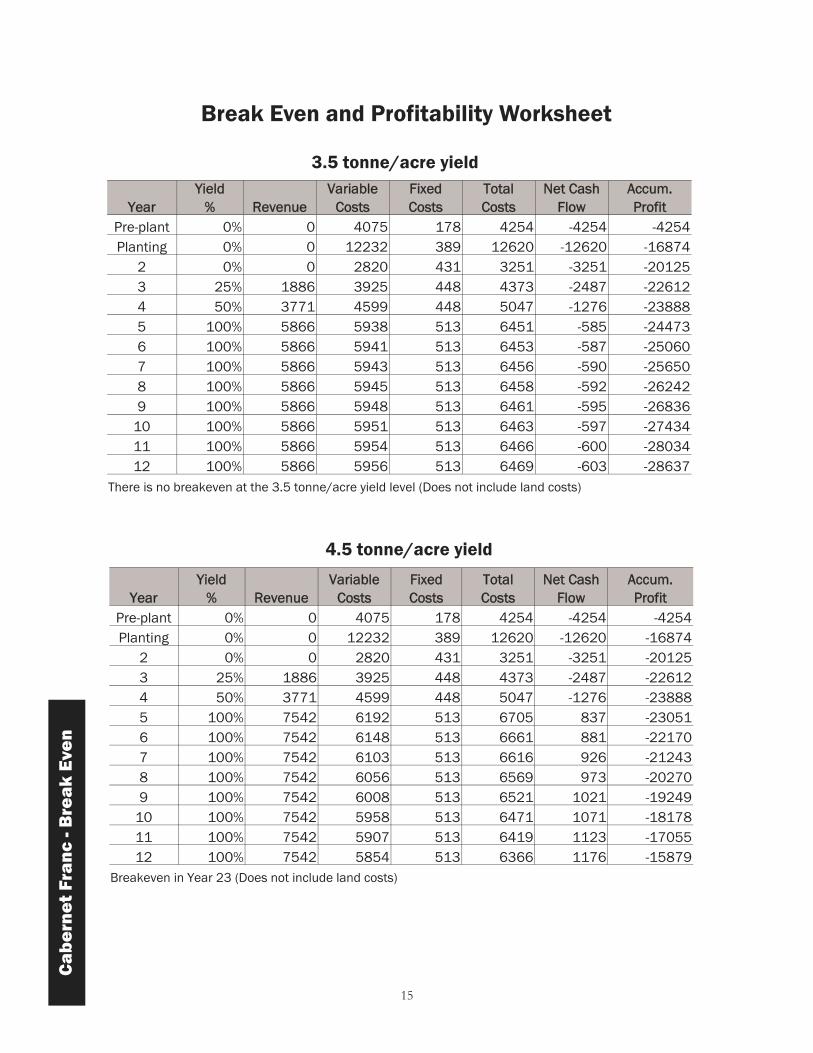
Break Even and Profitability Worksheet
Year Yield
% Revenue Variable
Costs Fixed Costs
Total Costs
Net Cash Flow
Accum. Profit
Pre-plant 0% 0 4075 178 4254 -4254 -4254 Planting 0% 0 12232 389 12620 -12620 -16874
2 0% 0 2820 431 3251 -3251 -20125 3 25% 1886 3925 448 4373 -2487 -22612 4 50% 3771 4599 448 5047 -1276 -23888 5 100% 5866 5938 513 6451 -585 -24473 6 100% 5866 5941 513 6453 -587 -25060 7 100% 5866 5943 513 6456 -590 -25650 8 100% 5866 5945 513 6458 -592 -26242 9 100% 5866 5948 513 6461 -595 -26836
10 100% 5866 5951 513 6463 -597 -27434 11 100% 5866 5954 513 6466 -600 -28034 12 100% 5866 5956 513 6469 -603 -28637
There is no breakeven at the 3.5 tonne/acre yield level (Does not include land costs)
3.5 tonne/acre yield
Year Yield
% Revenue Variable
Costs Fixed Costs
Total Costs
Net Cash Flow
Accum. Profit
Pre-plant 0% 0 4075 178 4254 -4254 -4254 Planting 0% 0 12232 389 12620 -12620 -16874
2 0% 0 2820 431 3251 -3251 -20125 3 25% 1886 3925 448 4373 -2487 -22612 4 50% 3771 4599 448 5047 -1276 -23888 5 100% 7542 6192 513 6705 837 -23051 6 100% 7542 6148 513 6661 881 -22170 7 100% 7542 6103 513 6616 926 -21243 8 100% 7542 6056 513 6569 973 -20270 9 100% 7542 6008 513 6521 1021 -19249
10 100% 7542 5958 513 6471 1071 -18178 11 100% 7542 5907 513 6419 1123 -17055 12 100% 7542 5854 513 6366 1176 -15879
Breakeven in Year 23 (Does not include land costs)
4.5 tonne/acre yield
15

Yield MT/ac Revenue
Variable costs excluding harvest and operating interest costs
Harvest costs
Operate interest
Total Variable Costs
Contribution Margin
2.5 4,190 4,755 260 161 5,176 -986 2.6 4,358 4,755 270 161 5,186 -829 2.7 4,525 4,755 281 161 5,197 -672 2.8 4,693 4,755 291 162 5,208 -515 2.9 4,860 4,755 302 162 5,219 -358 3.0 5,028 4,755 312 162 5,229 -201 3.1 5,196 4,755 322 163 5,240 -45 3.2 5,363 4,755 333 163 5,251 112 3.3 5,531 4,755 343 163 5,262 269 3.4 5,698 4,755 354 164 5,272 426 3.5 5,866 4,755 364 164 5,283 583 3.6 6,034 4,755 374 164 5,294 740 3.7 6,201 4,755 385 165 5,305 897 3.8 6,369 4,755 395 165 5,315 1,053
Breakeven yield to cover annual variable costs is 3.2 tonnes / acre
Yield MT/ac Revenue
Annual costs excl. harvest and operating
interest costs Harvesting
costs Operating interest
Annualized Est. Costs
Total Costs with Est.
Costs Net Cash
Flow 4.0 6704 5,268 416 166 1404 7254 -550 4.1 6872 5,268 426 166 1404 7264 -393 4.2 7039 5,268 437 166 1404 7275 -236 4.3 7207 5,268 447 167 1404 7286 -79 4.4 7374 5,268 458 167 1404 7297 78 4.5 7542 5,268 468 167 1404 7307 235 4.6 7710 5,268 478 168 1404 7318 392 4.7 7877 5,268 489 168 1404 7329 548 4.8 8045 5,268 499 168 1404 7340 705 4.9 8212 5,268 510 169 1404 7350 862 5.0 8380 5,268 520 169 1404 7361 1019 5.1 8548 5,268 530 170 1404 7372 1176
Breakeven yield to cover total annual costs is 4.4 tonnes / acre
(Includes annualized establishment costs, does not include land costs)
Cabernet Franc - B
reak Even
Break Even Yield to Cover Total Annual Costs
Break Even Yield to Cover Annual Variable Costs
16

17
OMAFRA Cabernet Franc Cost of Production 1997 - 2009 at 3.5 tonne per acre (3.0 t/acre in 1997)
$5,049$5,338
$5,950
$1,969
$3,821
$2,129
$5,866
$5,223
$2,723
$2,615
$3,080
$643
0
1000
2000
3000
4000
5000
6000
7000
1997 2001 2005 2009
dolla
rs
Gross Income Variable Costs Contribution Margin (Gross Income less Variable Costs)
Cabernet Franc Cost of Production 1997- 2009 at 4.5 tonnes per acre
$7,574
$6,863
$7,650
$2,084
$4,047
$5,490
$3,979
$7,542
$2,884
$5,477
$2,065$3,603
0
1000
2000
3000
4000
5000
6000
7000
8000
9000
1997 2001 2005 2009
dolla
rs
Gross Income Variable Costs Contribution Margin (Gross Income less Variable Costs)

3. Chardonnay
Preplant Year
Cost per acre ($) Variable Costs Actual Budget Labour: Machinery operator, 4.2 hrs 72 Custom Plowing 23 Cover Crop 46 Machine Costs: Repairs and maintenance 33 Fuel 36 Consulting Fees 32 Interest on operating capital 65 Land rental Land Preparation (levelling etc.) 850 Tile Drainage 2918 Total Variable Costs 4075 Fixed Costs Machine Costs: Depreciation 59 Interest on investment 13 Other overhead 107 Land ownership Measurable Fixed Costs 178 Total Measurable "Preplant Year” Costs 4254
Operation Labour (hours)
Labour Costs
Machine Costs*
Fixed Costs
Total Costs
Machine Discing (2x) 1.9 33 29 27 88 Cultivating 0.9 15 13 11 39 Sub Soiling 0.7 12 12 10 34 Sow Cover Crop 0.7 12 14 24 51 Total Machinery Operator 4.2 72 69 71 213
*Includes maintenance, fuel and repair
Operation Costs
Ch
ardonnay - P
replant Year
18

Cost per acre ($) Variable Costs Actual Budget Labour: Hand, 28.0 hrs 347 Machine Operator, 19.8 hrs 341 Fertilizer Ammonium Nitrate 3 kg 2 Muriate of Potash, 17 kg 12 Insecticides 0 Fungicides 63 Grape vines, ($2.70/vine) 3267 Custom Trellis: Materials, labour 5306 Training: Stakes, material 1162 Cover crop seed 46 Machine costs: Repairs and Maintenance 90 Fuel 156 Custom Planting 724 Irrigation 171 Consulting Fees 32 Interest on operating capital 513 Land rental Total Variable Costs 12231 Fixed Costs Machine Costs: Depreciation 144 Interest on investment 31 Other overhead 214 Land ownership Measurable Fixed Costs 389 Total Measurable "Planting Year” Costs 12620
Planting Year
Ch
ardo
nnay
- P
lant
ing
Year
19

Operation Labour (hours)
Labour Costs
Machine Costs*
Fixed Costs
Total Costs
Hand Weed Control: Hand Hoeing 8.0 99 99 Summer training, tying, trunk est 20.0 248 248 Total Hand Labour 28.0 347 347 Machine Weed Control: Grape Hoeing 4.0 69 43 16 128 Discing (2x) 1.9 33 28 25 86 Cultivating (2x) 1.9 33 24 14 70 Spray Pesticide (2x) 0.9 15 27 32 74 Fertilizing (2x) 0.7 12 9 8 29 Sow cover crop 0.7 12 14 24 50 Mowing (3x) 2.1 36 27 14 77 Hilling up 1.8 31 24 20 75 Vineyard Maintenance 3.6 62 40 18 120 Picking up vines & supplies 2.2 38 10 4 52 Total Machinery Operator 19.8 341 246 175 761 *Includes maintenance, fuel and repair
Ch
ardonnay - P
lanting Year
Operation Costs
20

Cost per acre ($) Variable Costs Actual Budget Labour: Hand, 22.6 hr 280 Machine Operator, 28.4 hr 488 Fertilizer: Ammonium nitrate, 3 kg 3 Muriate of Potash, 17 kg 14 Insecticides 43 Fungicides 178 Herbicides 19 Replacement vines, 2% 101 Cover crop seed 23 Machine Costs: Repairs and maintenance 113 Fuel 243 Custom Pruning - $.25/vine 303 Custom Tying - $.15/vine 182 Tying material 25 Irrigation 171 Consulting Fees 32 Interest on operating capital 602 Land rental Total Variable Costs 2820 Fixed Costs Machine Costs: Depreciation 178 Interest on investment 39 Other overhead 214 Land ownership Measurable Fixed Costs 431 Total Measurable "Second Year” Costs 3251
Second Year
Ch
ardo
nnay
- S
eco
nd Y
ear
21

Ch
ardonnay - S
econd Year
Operation Costs
Operation Labour (hours)
Labour Costs
Machine Costs*
Fixed Costs
Total Costs
Hand Weed Control: Hand Hoeing 2.6 32 32 Summer training, tying, trunk est 20.0 248 248 Total Hand Labour 22.6 280 280 Machine
Weed Control: Grape Hoeing 4.0 69 43 16 128 Spraying (1x) 0.7 12 10 6 28 Discing (2x) 1.9 33 28 25 86 Cultivation (2x) 1.9 33 24 14 70 Spray Pesticide (7x) 3.1 53 51 41 145 Fertilizing (2x) 1.0 17 12 9 38 Sow cover crop 0.7 12 14 24 50 Mowing (5x) 3.5 60 42 20 122 Hilling up and removal 3.6 62 43 28 133 Vineyard Maintenance 3.6 62 40 16 119 Replacing vines 4.4 76 48 19 143 Total Machinery Operator 28.4 488 356 217 1062 *Includes maintenance, fuel and repair
22

1.25 tonne (25% Yield) Cost per acre ($) Variable Costs Actual Budget Labour: Hand, 44.1 hrs 547 Machine Operator, 30.7 hrs 528 Fertilizer: Ammonium nitrate, 9 kg 7 Muriate of Potash, 39 kg 46 Insecticides 86 Fungicides 357 Herbicides 36 Replacement vines, 1% 50 Cover crop seed 23 Machine Costs: Repairs and maintenance 127 Fuel 262 Custom Pruning - $.31/vine 375 Custom Tying - $.18/vine 218 Tying material 25 Irrigation 171 Bird Control 124 Marketing Board Fees 28 Crop Insurance 142 Consulting Fees 32 Interest on operating capital 725 Land rental Total Variable Costs 3909 Fixed Costs Machine Costs: Depreciation 192 Interest on investment 42 Other overhead 214 Land ownership Measurable Fixed Costs 448 Total Measurable "Third Year” Costs 4357 Contribution Margin Gross Income ($1396 per tonne) 1745 Total Variable Costs 3909 Contribution Margin (no land costs) -2164
Third Year
23
Ch
ardo
nnay
- Th
ird
Year

Operation Labour (hours)
Labour Costs
Machine Costs*
Fixed Costs
Total Costs
Hand Suckering 6.0 74 74 Shoot Thinning 5.2 64 64 Shoot Positioning, Tucking 8.4 104 104 Leaf Removal 8.1 100 100 Bunch Thinning 7.1 88 88 Other operations 1.3 16 16 Hand Harvest 8.0 99 99 Total Hand Labour 44.1 547 547 Machine Weed Control: Spraying (2x) 1.4 24 17 9 50 Discing (2x) 1.9 33 27 25 85 Cultivation (2x) 1.9 33 23 13 69 Spray Pesticide (10x) 4.4 76 64 45 184 Fertilizing (2x) 1.0 17 12 9 38 Sow cover crop 0.7 12 14 24 50 Mowing (5x) 3.5 60 42 19 121 Hilling up and removal 3.6 62 43 26 131 Vineyard Maintenance 3.6 62 39 15 116 Replacing vines 2.2 38 24 9 71 Canopy Management: Machine Hedging 1.5 26 31 22 78 Harvest pick up and delivery 5.0 86 53 18 158 Total machinery operator 30.7 528 389 234 1151
*Includes maintenance, fuel and repair
Operation Costs
24
Ch
ardonnay - Th
ird Year

2.5 tonne (50% Yield) Cost per acre ($) Variable Costs Actual Budget Labour: Hand, 44.0 hrs 546 Machine Operator, 26.5 hrs 456 Fertilizer: Ammonium nitrate, 21 kg 17 Muriate of Potash, 48 kg 56 Insecticides 130 Fungicides 541 Herbicides 45 Replacement vines, 1% 50 Cover crop seed 23 Machine Costs: Repairs and maintenance 127 Fuel 226 Custom Pruning - $.36/vine 436 Custom Tying - $.19/vine 230 Tying material 25 Irrigation 171 Bird Control 124 Custom harvest/delivery 203 Marketing Board Fees 58 Crop Insurance 284 Consulting Fees 32 Interest on operating capital 815 Land rental Total Variable Costs 4595 Fixed Costs Machine Costs: Depreciation 192 Interest on investment 42 Other overhead 214 Land ownership Measurable Fixed Costs 448 Total Measurable "Fourth Year” Costs 5042 Contribution Margin Gross Income ($1396) per tonne) 3490 Total Variable Costs 4595 Contribution Margin (no land costs) -1105
Fourth Year
25
Ch
ardo
nnay
- Fo
urth
Yea
r

Operation Labour (hours)
Labour Costs
Machine Costs*
Fixed Costs
Total Costs
Hand Suckering 5.0 62 62 Shoot Thinning 6.5 81 81 Shoot Positioning, Tucking 12.3 153 153 Leaf Removal 9.9 123 123 Bunch Thinning 9.0 112 112 Other operations 1.3 16 16 Total Hand Labour 44.0 546 546 Machine Weed Control: Spraying (3x) 2.2 38 26 13 77 Discing (2x) 1.9 33 28 26 87 Cultivation (2) 1.9 33 24 14 71 Spray Pesticide (10x) 4.4 76 65 47 188 Fertilizing (2x) 1.0 17 12 10 39 Sow cover crop 0.7 12 14 24 50 Mowing (5x) 3.5 60 43 21 124 Hilling up and removal 3.6 62 44 29 135 Vineyard Maintenance 3.6 62 40 17 120 Replacing vines 2.2 38 25 11 73 Canopy Management: Machine Hedging 1.5 26 31 23 80 Total machinery operator 26.5 456 354 234 1043
*Includes maintenance, fuel and repair
Operation Costs
Actual Budget Preplant Year 4254
Planting Year 12620 Second Year 3251 Third Year 4063 Fourth Year 4773 Total 28961
Total Establishment Cost
Excludes Board fees, harvest costs and does not include revenues for years 3 and 4. Does not include land costs.
Actual Budget Annual Cost to Recover Establishment Costs 1428 per year (amortized over remaining 21 years of vineyard life)
26
Ch
ardonnay - Fo
urth Year

Cost per acre ($) Your Farm Yield Yield
Variable Costs 4 Tonne 5 Tonne Labour: Hand, 71.5 hrs 887 887 Machine Operator 31.7 hrs 545 545 Fertilizer: Ammonium Nitrate, 27 kg 22 22 Muriate of Potash, 61 kg 61 61 Insecticides 130 125 Fungicides 541 541 Herbicides 56 56 Replacement Vines 1% 50 50 Cover crop seed 23 23 Wind Machine 411 411 Machine Costs: Repairs & maintenance 174 174 Fuel 271 271 Custom pruning $.37/vine 448 448 Custom Tying - $.19/vine 230 230 Tying Material 25 25 Irrigation 171 171 Bird Control 124 124 Custom harvest/delivery 324 405 Marketing board fees 92 115 Crop Insurance 454 568 Consulting Fees (soil, leaf, spray) 32 32 Interest on operating capital 165 172 Land rental Total Variable Costs 5235 5455 Fixed Costs Machine Costs: Depreciation 248 248 Interest on investment 51 51 Other overhead 214 214 Land ownership Measurable Fixed Costs 513 513 Total Measurable Cost 5748 5967 Contribution Margin Gross Income ($1396 per tonne) 5584 6980 Total Variable Costs 5235 5455 Contribution Margin (no land costs) 349 1525
Mature Vineyard: Annual Costs
27
Ch
ardo
nnay
- M
atur
e V
iney
ard
Operation Labour (hours)
Labour Costs
Machine Costs*
Fixed Costs
Total Costs
Hand Suckering 8.1 100 100 Shoot Thinning 9.6 119 119 Shoot Positioning, Tucking 19.3 239 239 Leaf Removal 14.6 181 181 Bunch Thinning 14.6 181 181 Other operations 1.3 16 16 Trellis Maintenance 4.0 50 50 Total Hand Labour 71.5 887 887 Machine Weed Control: Spraying (3x) 2.2 38 26 11 75 Discing (2x) 1.9 33 27 24 84 Cultivation (2x) 1.9 33 23 13 69 Pesticide Spraying (10x) 4.4 76 64 44 183 Fertilizing (2x) 1.0 17 12 9 38 Sow cover crop 1.0 17 17 25 59 Mowing (5x) 3.5 60 42 18 120 Hilling up and removal 3.6 62 43 26 131 Subsoiling/Aerating 1.3 22 18 11 51 Vineyard Maintenance 3.6 62 39 15 116 Replacing vines 2.2 38 24 9 71 Canopy Management: Machine Hedging 1.5 26 31 25 81 Canopy Management: Leaf Pulling 1.9 33 62 62 157 Brush Removal/flail 1.7 29 18 7 54 Total Machine Operator 31.7 545 445 299 1289 *Includes maintenance, fuel and repair
Mature Vineyard: Annual Operation Costs
28
Ch
ardonnay - M
ature Vineyard

Break Even and Profitability Worksheet
Year Yield
% Revenue Variable
Costs Fixed Costs
Total Costs
Net Cash Flow
Accum. Profit
Pre-plant 0% 0 4075 178 4254 -4254 -4254 Planting 0% 0 12232 389 12620 -12620 -16874
2 0% 0 2820 431 3251 -3251 -20125 3 25% 1745 3909 448 4357 -2612 -22737 4 50% 3490 4594 448 5042 -1552 -24290 5 100% 5584 5963 513 6476 -892 -25181 6 100% 5584 5975 513 6488 -904 -26085 7 100% 5584 5988 513 6501 -917 -27001 8 100% 5584 6001 513 6514 -930 -27931 9 100% 5584 6015 513 6527 -943 -28874
10 100% 5584 6029 513 6541 -957 -29831 11 100% 5584 6043 513 6556 -972 -30803 12 100% 5584 6058 513 6571 -987 -31790
There is no breakeven at the 4 tonne/acre yield level (Does not include land costs)
4 tonne/acre yield
Year Yield
% Revenue Variable
Costs Fixed Costs
Total Costs
Net Cash Flow
Accum. Profit
Pre-plant 0% 0 4075 178 4254 -4254 -4254 Planting 0% 0 12232 389 12620 -12620 -16874
2 0% 0 2820 431 3251 -3251 -20125 3 25% 1745 3909 448 4357 -2612 -22737 4 50% 3490 4594 448 5042 -1552 -24290 5 100% 6980 6182 513 6695 285 -24005 6 100% 6980 6156 513 6669 311 -23694 7 100% 6980 6130 513 6642 338 -23356 8 100% 6980 6102 513 6615 365 -22990 9 100% 6980 6073 513 6586 394 -22597
10 100% 6980 6044 513 6557 423 -22173 11 100% 6980 6014 513 6526 454 -21719 12 100% 6980 5982 513 6495 485 -21234
Breakeven in Year 35 (Does not include land costs)
5 tonne/acre yield
29
Ch
ardo
nnay
- B
reak
Eve
n

Yield MT/ac Revenue
Variable costs excluding harvest and operating interest costs
Harvesting costs
Operating interest
Total Variable Costs
Contribution Margin
3.5 4,886 4,711 364 163 5,238 -352 3.6 5,026 4,711 374 163 5,249 -223 3.7 5,165 4,711 385 164 5,260 -95 3.8 5,305 4,711 395 164 5,271 34 3.9 5,444 4,711 406 164 5,281 163 4.0 5,584 4,711 416 165 5,292 292 4.1 5,724 4,711 426 165 5,303 421 4.2 5,863 4,711 437 165 5,314 550 4.3 6,003 4,711 447 166 5,324 679 4.4 6,142 4,711 458 166 5,335 807 4.5 6,282 4,711 468 166 5,346 936
Breakeven yield to cover annual variable costs is 3.8 tonnes / acre
3.4 4,746 4,711 354 163 5,228 -481 3.3 4,607 4,711 343 162 5,217 -610 3.2 4,467 4,711 333 162 5,206 -739
Yield MT/ac Revenue
Annual costs excluding harvest and operating
interest costs Harvesting
costs Operating interest
Annualized Est. Costs
Total Costs with Est.
Costs Net Cash
Flow 4.2 5863 5,224 437 165 1428 7254 -1391 4.3 6003 5,224 447 166 1428 7265 -1262 4.4 6142 5,224 458 166 1428 7275 -1133 4.5 6282 5,224 468 166 1428 7286 -1004 4.6 6422 5,224 478 167 1428 7297 -875 4.7 6561 5,224 489 167 1428 7308 -746 4.8 6701 5,224 499 167 1428 7318 -618 4.9 6840 5,224 510 168 1428 7329 -489 5.0 6980 5,224 520 168 1428 7340 -360 5.1 7120 5,224 530 169 1428 7351 -231 5.2 7259 5,224 541 169 1428 7361 -102 5.3 7399 5,224 551 169 1428 7372 27 5.4 7538 5,224 562 170 1428 7383 156 5.5 7678 5,224 572 170 1428 7394 284
Breakeven yield to cover total annual costs is 5.3 tonnes / acre (Includes annualized establishment costs, does not include land costs)
Break Even Yield to Cover Annual Variable Costs
30
Ch
ardonnay - B
reak Even
Break Even Yield to Cover Total Annual Costs

31
OMAFRA Chardonnay Cost of Production 1997 - 2009 at 4 tonne per acre (3.5 t/acre in 1997)
$5,303
$4,900
$5,800
$2,004
$3,864
$1,936
$5,584
$2,755
$5,235
$2,145
$3,299
$3490
1000
2000
3000
4000
5000
6000
7000
1997 2001 2005 2009
dolla
rs
Gross Income Variable Costs Contribution Margin (Gross Income less Variable Costs)
OMAFRA Chardonnay Cost of Production 1997- 2009 at 5 tonnes per acre
$7,575
$6,125
$7,250
$2,117
$4,088
$5,458
$3,220 $3,162
$6,980
$5,455
$2,905
$1,525
0
1000
2000
3000
4000
5000
6000
7000
8000
1997 2001 2005 2009
dolla
rs
Gross Income Variable Costs Contribution Margin (Gross Income less Variable Costs)

32
4. Vidal
Cost per acre ($) Actual Budget
Variable Costs Labour: Machinery operator, 4.2 hrs 72 Custom Plowing 23 Cover Crop 46 Machine Costs: Repairs and maintenance 33 Fuel 36 Consulting Fees 32 Interest on operating capital 61 Land rental Land Preparation (levelling etc.) 600 Tile Drainage 2918 Total Variable Costs 3821 Fixed Costs Machine Costs: Depreciation 59 Interest on investment 13 Other overhead 107 Land ownership Measurable Fixed Costs 178 Total Measurable "Preplant Year” Costs 4000
Operation Labour (hours)
Labour Costs
Machine Costs*
Fixed Costs
Total Costs
Machine Discing (2x) 1.9 33 29 27 88 Cultivating 0.9 15 13 11 39 Sub Soiling 0.7 12 12 10 34 Sow Cover Crop 0.7 12 14 24 51 Total Machinery Operator 4.2 72 69 71 213 *Includes maintenance, fuel and repair
Operation Costs
Vidal - P
replant Year

33
Cost per acre ($) Variable Costs Actual Budget Labour: Hand, 28.0 hrs 347 Machine Operator, 19.8 hrs 341 Fertilizer Ammonium Nitrate 3 kg 2 Muriate of Potash, 17 kg 20 Insecticides 0 Fungicides 63 Grape vines, ($2.70/vine) 2614 Custom Trellis:Materials, labour 4946 Training: Stakes, material 929 Cover crop seed 46 Machine costs: Repairs and Maintenance 90 Fuel 156 Custom Planting 590 Irrigation 171 Consulting Fees 32 Interest on operating capital 460 Land rental Total Variable Costs 10806 Fixed Costs Machine Costs: Depreciation 144 Interest on investment 31 Other overhead 214 Land ownership Measurable Fixed Costs 389 Total Measurable "Planting Year” Costs 11195
Planting Year
Vid
al -
Pla
ntin
g Ye
ar
34
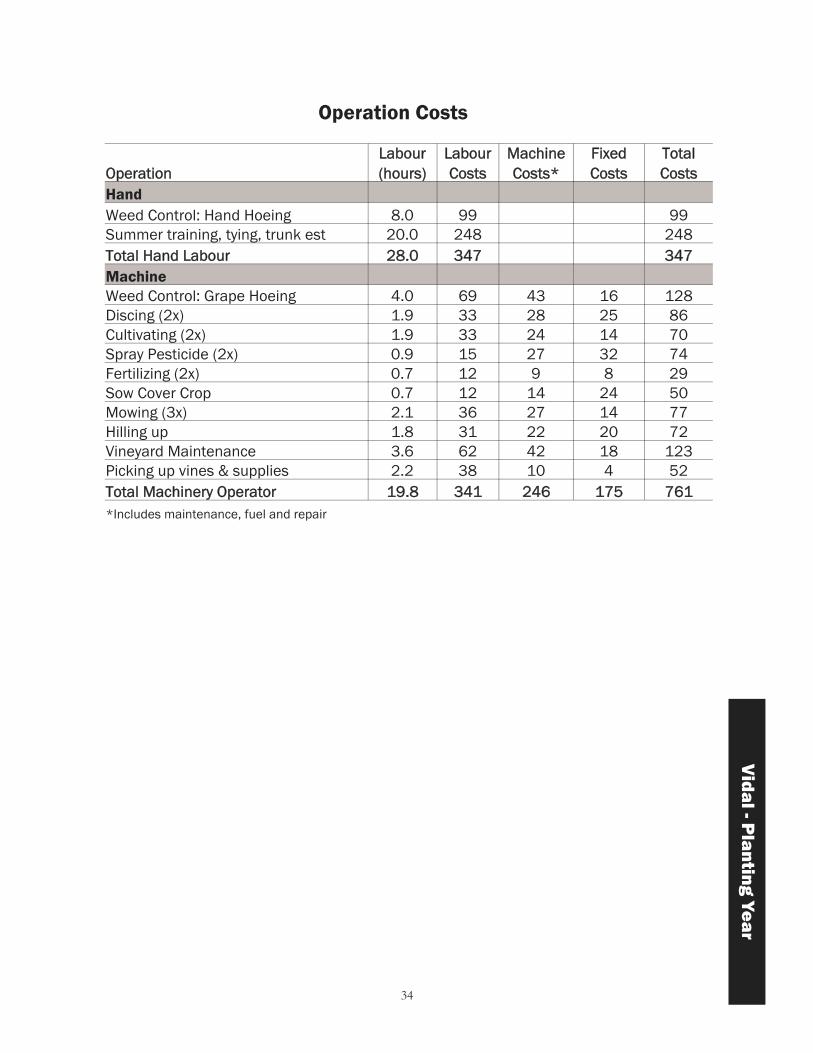
Operation Labour (hours)
Labour Costs
Machine Costs*
Fixed Costs
Total Costs
Hand Weed Control: Hand Hoeing 8.0 99 99 Summer training, tying, trunk est 20.0 248 248 Total Hand Labour 28.0 347 347 Machine Weed Control: Grape Hoeing 4.0 69 43 16 128 Discing (2x) 1.9 33 28 25 86 Cultivating (2x) 1.9 33 24 14 70 Spray Pesticide (2x) 0.9 15 27 32 74 Fertilizing (2x) 0.7 12 9 8 29 Sow Cover Crop 0.7 12 14 24 50 Mowing (3x) 2.1 36 27 14 77 Hilling up 1.8 31 22 20 72 Vineyard Maintenance 3.6 62 42 18 123 Picking up vines & supplies 2.2 38 10 4 52 Total Machinery Operator 19.8 341 246 175 761 *Includes maintenance, fuel and repair
Operation Costs
Vidal - P
lanting Year

35
Cost per acre ($) Variable Costs Actual Budget Labour: Hand, 22.6 hr 280 Machine Operator, 28.4 hr 488 Fertilizer: Ammonium nitrate, 20 kg 16 Muriate of Potash, 41 kg 48 Insecticides 43 Fungicides 178 Herbicides 19 Replacement vines, 2% 79 Cover crop seed 23 Machine Costs: Repairs and maintenance 113 Fuel 243 Custom Pruning - $.25/vine 242 Custom Tying - $.21/vine 203 Tying material 25 Irrigation 171 Consulting Fees 32 Interest on operating capital 547 Land rental Total Variable Costs 2750 Fixed Costs Machine Costs: Depreciation 178 Interest on investment 39 Other overhead 214 Land ownership Measurable Fixed Costs 431 Total Measurable "Second Year” Costs 3182
Vid
al -
Sec
ond
Yea
r
Second Year

36
Operation Labour (hours)
Labour Costs
Machine Costs*
Fixed Costs
Total Costs
Hand Weed Control: Hand Hoeing 2.6 32 32 Summer training, tying, trunk est 20.0 248 248 Total Hand Labour 22.6 280 280 Machine
Weed Control: Grape Hoeing 4.0 69 43 16 128 Spraying (1x) 0.7 12 10 6 28 Discing (2x) 1.9 33 28 25 86 Cultivation (2x) 1.9 33 24 14 70 Spray Pesticide (7x) 3.1 53 51 41 145 Fertilizing (2x) 1.0 17 12 9 38 Sow cover crop 0.7 12 14 24 50 Mowing (5x) 3.5 60 42 20 122 Hilling up and removal 3.6 62 43 28 133 Vineyard Maintenance 3.6 62 40 16 119 Replacing vines 4.4 76 48 19 143 Total Machinery Operator 28.4 488 356 217 1062
*Includes maintenance, fuel and repair
Vidal - S
econd Year
Operation Costs

37
Third Year
1.75 tonne (25% Yield) Cost per acre ($) Variable Costs Actual Budget Labour: Hand, 14.0 hrs 174 Machine Operator, 30.7 hrs 528 Fertilizer: Ammonium nitrate, 41 kg 33 Muriate of Potash, 61 kg 71 Insecticides 86 Fungicides 357 Herbicides 36 Replacement vines, 1% 40 Cover crop seed 23 Machine Costs: Repairs and maintenance 127 Fuel 262 Custom Pruning - $.31/vine 300 Custom Tying - $.22/vine 213 Tying material 25 Irrigation 171 Bird Control 124 Marketing Board Fees 26 Crop Insurance 72 Consulting Fees 32 Interest on operating capital 653 Land rental Total Variable Costs 3353 Fixed Costs Machine Costs: Depreciation 192 Interest on investment 42 Other overhead 214 Land ownership Measurable Fixed Costs 448 Total Measurable "Third Year” Costs 3801 Contribution Margin Gross Income ($588 per tonne) 1029 Total Variable Costs 3353 Contribution Margin (no land costs) -2324
Vid
al -
Thir
d Ye
ar

Operation Labour (hours)
Labour Costs
Machine Costs*
Fixed Costs
Total Costs
Hand Suckering 6.0 74 74 Shoot Thinning 0.0 0 0 Shoot Positioning, Tucking 0.0 0 0 Leaf Removal 0.0 0 0 Bunch Thinning 0.0 0 0 Other operations 0.0 0 0 Hand Harvest 8.0 99 99 Total Hand Labour 14.0 174 174 Machine Weed Control: Spraying (2x) 1.4 24 17 9 50 Discing (2x) 1.9 33 27 25 85 Cultivation (2x) 1.9 33 23 13 69 Spray Pesticide (10x) 4.4 76 64 45 184 Fertilizing (2x) 1.0 17 12 9 38 Sow cover crop 0.7 12 14 24 50 Mowing (5x) 3.5 60 42 19 121 Hilling up and removal 3.6 62 43 26 131 Vineyard Maintenance 3.6 62 39 15 116 Replacing vines 2.2 38 24 9 71 Canopy Management: Machine Hedging 1.5 26 31 22 78 Harvest pick up and delivery 5.0 86 53 18 158 Total machinery operator 30.7 528 389 234 1151
*Includes maintenance, fuel and repair
Operation Costs
Vidal - Th
ird Year
38

3.5 tonne (50% Yield) Cost per acre ($) Variable Costs Actual Budget Labour: Hand, 5.0 hrs 62 Machine Operator, 26.5 hrs 456 Fertilizer: Ammonium nitrate, 61 kg 49 Muriate of Potash, 71 kg 83 Insecticides 130 Fungicides 541 Herbicides 45 Replacement vines, 1% 40 Cover crop seed 23 Machine Costs: Repairs and maintenance 127 Fuel 226 Custom Pruning - $.39/vine 378 Custom Tying - $.23/vine 223 Tying material 25 Irrigation 171 Bird Control 124 Custom harvest/delivery 284 Marketing Board Fees 52 Crop Insurance 144 Consulting Fees 32 Interest on operating capital 745 Land rental Total Variable Costs 3959 Fixed Costs Machine Costs: Depreciation 192 Interest on investment 42 Other overhead 214 Land ownership Measurable Fixed Costs 448 Total Measurable "Fourth Year” Costs 4407 Contribution Margin Gross Income ($588) per tonne) 2058 Total Variable Costs 3959 Contribution Margin (no land costs) -1901
Fourth Year
Vid
al -
Four
th Y
ear
39

Operation Labour (hours)
Labour Costs
Machine Costs*
Fixed Costs
Total Costs
Hand Suckering 5.0 62 62 Shoot Thinning 0.0 0 0 Shoot Positioning, Tucking 0.0 0 0 Leaf Removal 0.0 0 0 Bunch Thinning 0.0 0 0 Other operations 0.0 0 0 Total Hand Labour 5.0 62 62 Machine Weed Control: Spraying (3x) 2.2 38 26 13 77 Discing (2x) 1.9 33 28 26 87 Cultivation (2x) 1.9 33 24 14 71 Spray Pesticide (10x) 4.4 76 65 47 188 Fertilizing (2x) 1.0 17 12 10 39 Sow cover crop 0.7 12 14 24 50 Mowing (5x) 3.5 60 43 21 124 Hilling up and removal 3.6 62 44 29 135 Vineyard Maintenance 3.6 62 40 17 120 Replacing vines 2.2 38 25 11 73 Canopy Management: Machine Hedging 1.5 26 31 23 80 Total machinery operator 26.5 456 354 234 963
*Includes maintenance, fuel and repair
Actual Budget Preplant Year 4000 Planting Year 11195 Second Year 3182 Third Year 3509 Fourth Year 4061 Total 25946
Total Establishment Cost
Excludes Board fees, harvest costs and does not include revenues for years 3 and 4. Does not include land costs.
Actual Budget Annual Cost to Recover Establishment Costs 1381 per year (amortized over remaining 21 years of vineyard life)
Vidal - Fo
urth Year
Operation Costs
40

Cost per acre ($) Your Farm Yield Yield
Variable Costs 5 Tonne 7 Tonne Labour: Hand, 25.1 hrs 311 311 Machine Operator 32.3 hrs 556 556 Fertilizer: Ammonium Nitrate, 81 kg 66 66 Muriate of Potash, 94 kg 110 110 Insecticides 130 130 Fungicides 541 541 Herbicides 56 56 Replacement Vines 1% 40 40 Cover crop seed 23 23 Wind Machine 411 411 Machine Costs: Repairs & maintenance 174 174 Fuel 276 276 Custom pruning $.39/vine 378 378 Custom Tying - $.23/vine 223 223 Tying Material 25 25 Irrigation 171 171 Bird Control 124 124 Custom harvest/delivery 405 567 Marketing board fees 75 105 Crop Insurance 205 287 Consulting Fees (soil, leaf, spray) 32 32 Interest on operating capital 141 150 Land rental Total Variable Costs 4473 4756 Fixed Costs Machine Costs: Depreciation 248 248 Interest on investment 51 51 Other overhead 214 214 Land ownership Measurable Fixed Costs 513 513 Total Measurable Cost 4986 5269 Contribution Margin Gross Income ($588 per tonne) 2940 4116 Total Variable Costs 4473 4756 Contribution Margin (no land costs) -1533 -640
Mature Vineyard: Annual Costs V
idal
- M
atur
e V
iney
ard
41

Vidal - M
ature Vineyard
Operation Labour (hours)
Labour Costs
Machine Costs*
Fixed Costs
Total Costs
Hand Suckering 8.1 100 100 Shoot Thinning 2.0 25 25 Shoot Positioning, Tucking 5.0 62 62 Leaf Removal 1.0 12 12 Bunch Thinning 5.0 62 62 Other operations 0.0 0 0 Trellis Maintenance 4.0 50 50 Total Hand Labour 25.1 311 311 Machine Weed Control: Spraying (3x) 2.2 38 25 11 75 Discing (2x) 1.9 33 27 24 84 Cultivation (2x) 1.9 33 23 13 69 Pesticide Spraying (10x) 4.4 76 64 44 183 Fertilizing (2x) 1.0 17 12 9 38 Sow cover crop 1.0 17 17 24 59 Mowing (5x) 3.5 60 41 18 120 Hilling up and removal 3.6 62 42 26 130 Subsoiling/Aerating 1.3 22 18 11 51 Vineyard Maintenance 3.6 62 39 15 115 Replacing vines 2.2 38 24 9 71 Canopy Management: Machine Hedging 1.5 26 30 24 81 Canopy Management: Leaf Pulling 1.9 33 62 62 156 Brush Removal/flail 2.3 40 25 9 73 Total Machine Operator 32.3 556 450 299 1304
*Includes maintenance, fuel and repair
Mature Vineyard: Annual Operation Costs
42

Break Even and Profitability Worksheet
Year Yield % Revenue Variable
Costs Fixed Costs
Total Costs
Net Cash Flow
Accum. Profit
Pre-plant 0% 0 3821 178 4000 -4000 -4000 Planting 0% 0 10806 389 11195 -11195 -15195
2 0% 0 2750 431 3182 -3182 -18377 3 25% 1029 3353 448 3800 -2771 -21148 4 50% 2058 3959 448 4407 -2349 -23497 5 100% 4116 5458 513 5970 -1854 -25351 6 100% 4116 5501 513 6014 -1898 -27249 7 100% 4116 5546 513 6059 -1943 -29192 8 100% 4116 5593 513 6106 -1990 -31182 9 100% 4116 5641 513 6154 -2038 -33219
10 100% 4116 5690 513 6203 -2087 -35307 11 100% 4116 5742 513 6254 -2138 -37445 12 100% 4116 5794 513 6307 -2191 -39636
There is no breakeven at the 7.0 tonne/acre yield level (Does not include land costs)
7 tonne/acre yield
Year Yield % Revenue Variable
Costs Fixed Costs
Total Costs
Net Cash Flow
Accum. Profit
Pre-plant 0% 0 3821 178 4000 -4000 -4000 Planting 0% 0 10806 389 11195 -11195 -15195
2 0% 0 2750 431 3182 -3182 -18377 3 25% 1029 3353 448 3800 -2771 -21148 4 50% 2058 3959 448 4407 -2349 -23497 5 100% 2940 5175 513 5687 -2747 -26244 6 100% 2940 5248 513 5760 -2820 -29065 7 100% 2940 5323 513 5835 -2895 -31960 8 100% 2940 5400 513 5913 -2973 -34932 9 100% 2940 5480 513 5993 -3053 -37985
10 100% 2940 5562 513 6075 -3135 -41120 11 100% 2940 5648 513 6160 -3220 -44340 12 100% 2940 5736 513 6248 -3308 -47648
There is no breakeven at the 5.0 tonne/acre yield level (Does not include land costs)
5 tonne/acre yield
Vid
al -
Bre
ak E
ven
43

Yield MT/ac Revenue
Variable costs excluding harvest and operating interest costs
Harvesting costs
Operating interest
Total Variable Costs
Contribution Margin
7.3 4,292 3,893 759 150 4,802 -510 7.4 4,351 3,893 770 150 4,813 -462 7.5 4,410 3,893 780 151 4,824 -414 7.6 4,469 3,893 790 151 4,834 -365 7.7 4,528 3,893 801 151 4,845 -317 7.8 4,586 3,893 811 152 4,856 -269 7.9 4,645 3,893 822 152 4,866 -221 8.0 4,704 3,893 832 152 4,877 -173 8.1 4,763 3,893 842 153 4,888 -125 8.2 4,822 3,893 853 153 4,899 -77 8.3 4,880 3,893 863 153 4,909 -29 8.4 4,939 3,893 874 154 4,920 19 8.5 4,998 3,893 884 154 4,931 67
8.6 5,057 3,893 894 154 4,942 115
Breakeven yield to cover annual variable costs is 8.4 tonnes / acre
Vidal - B
reak Even
44
Break Even Yield to Cover Annual Variable Costs
Break Even Yield to Cover Total Annual Costs
Yield MT/ac Revenue
Annual costs excluding harvest and operating
interest costs Harvesting
costs Operating interest
Annualized Est. Costs
Total Costs with Est.
Costs Net Cash
Flow
11.7 6880 4,406 1,217 165 1381 7168 -289
11.8 6938 4,406 1,227 165 1381 7179 -241
11.9 6997 4,406 1,238 165 1381 7190 -193
12.0 7056 4,406 1,248 166 1381 7201 -145
12.1 7115 4,406 1,258 166 1381 7211 -97
12.2 7174 4,406 1,269 166 1381 7222 -49
12.3 7232 4,406 1,279 167 1381 7233 0
12.4 7291 4,406 1,290 167 1381 7244 48
12.5 7350 4,406 1,300 167 1381 7254 96
12.6 7409 4,406 1,310 168 1381 7265 144
12.7 7468 4,406 1,321 168 1381 7276 192
12.8 7526 4,406 1,331 168 1381 7287 240
12.9 7585 4,406 1,342 169 1381 7297 288
13.0 7644 4,406 1,352 169 1381 7308 336 Breakeven yield to cover total annual costs is 12.3 tonnes / acre (Includes annualized establishment costs, does not include land costs)
45
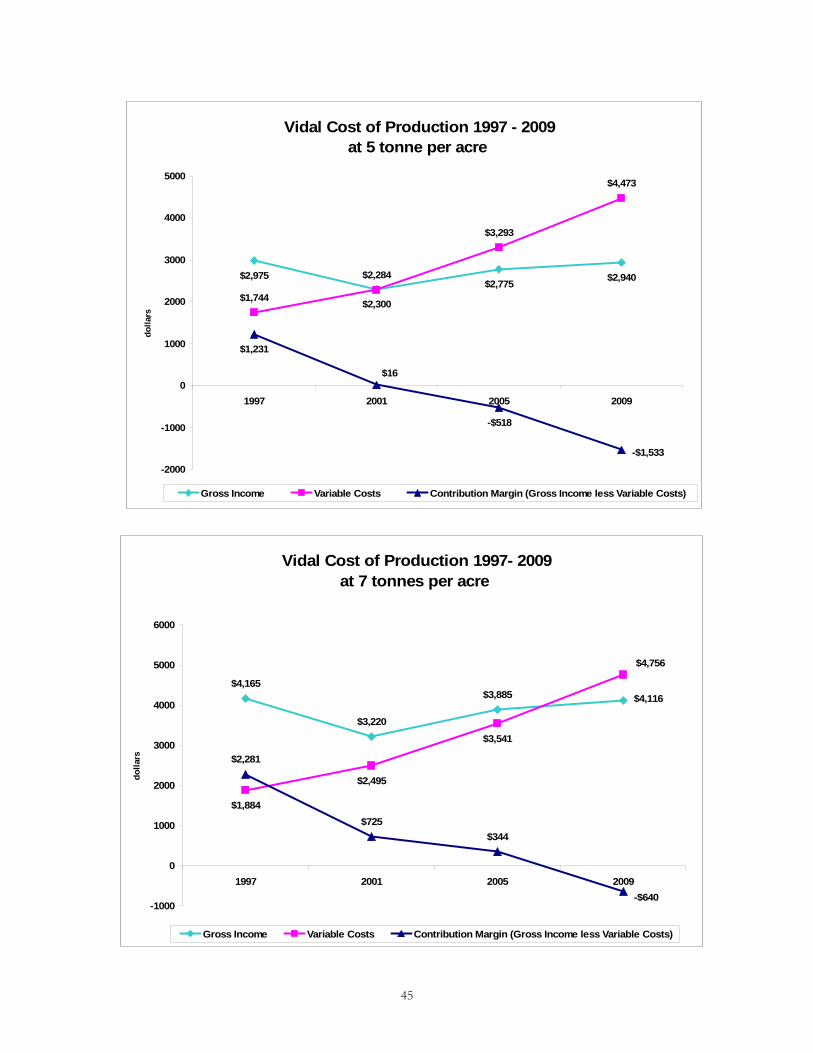
Vidal Cost of Production 1997- 2009 at 7 tonnes per acre
$4,165
$3,220
$3,885
$3,541
$2,281
$725
$4,116
$2,495
$4,756
$1,884
-$640
$344
-1000
0
1000
2000
3000
4000
5000
6000
1997 2001 2005 2009
dolla
rs
Gross Income Variable Costs Contribution Margin (Gross Income less Variable Costs)
Vidal Cost of Production 1997 - 2009 at 5 tonne per acre
$2,975
$2,300
$2,775$1,744
-$518
$2,940
$4,473
$2,284
$3,293
$16
$1,231
-$1,533
-2000
-1000
0
1000
2000
3000
4000
5000
1997 2001 2005 2009
dolla
rs
Gross Income Variable Costs Contribution Margin (Gross Income less Variable Costs)

46
LABRUSCA
GRAPES

47
5. Concord
Cost per acre ($) Your Farm Yield Yield
Variable Costs 3.5 Tonne 5 Tonne Labour: Hand, 3 hrs 37 37 Machine Operator 20.0 hrs 344 344 Fertilizer: Ammonium Nitrate, 81 kg 66 66 Muriate of Potash, 94 kg 110 110 Insecticides 66 66 Fungicides 230 230 Herbicides 56 56 Replacement Vines 1% 23 23 Cover crop seed 23 23 Wind Machine 0 0 Machine Costs: Repairs & maintenance 113 113 Fuel 171 171 Custom pruning $.33/vine 240 240 Custom Tying - $.23/vine 167 167 Tying Material 25 25 Irrigation 0 0 Bird Control 0 0 Custom harvest/delivery 284 405 Marketing board fees 35 50 Crop Insurance 113 130 Consulting Fees (soil, leaf, spray) 32 32 Interest on operating capital 69 74 Land rental Total Variable Costs 2204 2362 Fixed Costs Machine Costs: Depreciation 173 173 Interest on investment 38 38 Other overhead 214 214 Land ownership Measurable Fixed Costs 425 425 Total Measurable Cost 2629 2787 Contribution Margin Gross Income ($418 per tonne) 1463 2090 Total Variable Costs 2204 2362 Contribution Margin (no land costs) -741 -272
Mature Vineyard: Annual Costs
Co
nco
rd -
Mat
ure
Vin
eyar
d

48
Operation Labour (hours)
Labour Costs
Machine Costs*
Fixed Costs
Total Costs
Hand Suckering 3.0 37 37 Shoot Thinning 0.0 0 0 Shoot Positioning, Tucking 0.0 0 0 Leaf Removal 0.0 0 0 Bunch Thinning 0.0 0 0 Other operations 0.0 0 0 Trellis Maintenance 0.0 0 0 Total Hand Labour 3.0 37 37 Machine Weed Control: Spraying (3x) 2.2 38 28 16 82 Discing (2x) 1.9 33 30 28 91 Cultivation (2x) 1.9 33 26 17 75 Pesticide Spraying (4x) 1.8 31 38 39 108 Fertilizing (2x) 1.0 17 13 11 41 Sow cover crop 1.0 17 18 27 62 Mowing (4x) 2.8 48 37 22 107 Hilling up and removal 0.0 0 0 0 0 Subsoiling/Aerating 1.3 22 20 14 56 Vineyard Maintenance 1.6 28 20 11 58 Replacing vines 2.2 38 26 14 78 Canopy Management: Machine Hedging 0.0 0 0 0 0 Canopy Management: Leaf Pulling 0.0 0 0 0 0 Brush Removal/flail 2.3 40 28 14 81 Total Machine Operator 20.0 344 284 211 839 *Includes maintenance, fuel and repair
Mature Vineyard: Annual Operation Costs C
onco
rd - Mature V
ineyard