estimate of the number of spring-run chinook … · the canyon reach between the dam and the...
TRANSCRIPT

Appendix H Estimate of the Number of Spring-Run Chinook Salmon That Could be Supported by Spawning
Habitat Rehabilitation at Sinoro Bar on the Lower Yuba River

Estimate Of The Number Of SpringRun Chinook Salmon That Could Be Supported By Spawning Habitat
Rehabilitation At Sinoro Bar On The Lower Yuba River
(Photo of the area of potential river rehabilitation)
Prepared by
Dr. Gregory B. Pasternack, PhD, M.ASCE
July 2, 2010

1
Introduction
The Habitat Expansion Agreement for Central Valley Spring‐Run Chinook Salmon and California Central Valley Steelhead (HEA) seeks to expand spawning, rearing, and adult holding habitat for these salmonids in the Sacramento River basin. A key goal is to accommodate an estimated net increase of 2,000 to 3,000 adult spawning spring‐run Chinoo k salmon as compared to the habitat available under any relevant requirement orcommitment. This goal is referred to as the Habitat Expansion Threshold (HET).
A draft Habitat Expansion Plan (HEP) has been developed in which two different sets of actions are proposed to achieve the HET. One set of actions involves rehabilitating the lower Yuba River (LYR) between Englebright Dam and the confluence with the Feather River. Different parts of the LYR serve different salmonid species and their freshwater lifestages. Spring‐run Chinook salmon (SRCS) are thought to migrate to the upstream limit of the accessible river at Englebright Dam and attempt to spawn there no matter what the conditions are. The canyon reach between the dam and the junction with Deer Creek (Fig. 1) is called the Englebright Dam Reach (EDR). At present the EDR is highly impacted and suppor t ts few SRCS. Further downstream, opportunities exist to enhance rearing habitaand adult SRCS migration.
The purpose of this report is to combine available information on the EDR with knowledge of spawning behavior and habitat rehabilitation in the Central Valley to obtain the best estimate of the population of adult SRCS spawners that can be accommodated by rehabilitating the downstream half of the EDR in the vicinity of a feature known as Sinoro Bar (see cover photo). In support of the estimate, a summary of the current status of the EDR is provided. Then key opportunities and constraints for rehabilitating the area are iscussed. Finally, a set of specific estimates is provided based on different assumptions bout the project area and SRCS occurrence and behavior in the Central Valley. da C urrent Status
EDR Fluvial Geomorphology Based on a topographic map produced in 2007 (surveyed 2005‐2007) with joint
funding from the USFWS and the Yuba Accord River Management Team (RMT), the EDR is a relatively straight bedrock canyon with a veneer of “shot rock” debris (Fig. 2). Shot rock is irregular‐shaped angular cobbles and boulders blasted or eroded from surrounding hillsides. In the EDR, shot rock was generated and spread by two distinct processes: rock excavatio r n during the construction of Englebright Dam and hillside scouring during majofloods. The EDR is also influenced by a backwater effect imposed by Deer Creek.
There are three shot rock deposits in the EDR. The largest is a mixture of angular cobbles and boulders deposited as a point bar on the inside of a gentle canyon meander bend upstream of the junction with Deer Creek on river right (i.e. the north bank). This point bar has recently been named Sinoro Bar to symbolize the lack of gold expected in it (Fig. 2). Sinoro Bar is located just upstream of the historic gold mining camp known as Malay Camp. Malay Camp was situated across the river from Lander’s Bar, a historic site of placer gold mining on the south bank that pre‐dates hydraulic mining and no longer exists.

Figure 1. Location map of the Englebright Dam Reach (black box) in the Yuba catchment.
There are two notable geometric aspects to the shape of the EDR in the vicinity of Sinoro Bar. First, the width of the canyon walls (at the vertical boundary between the vegetated, soil‐mantled hillside and the exposed bedrock) increases from 79‐161.5 m (260‐530’) through the downstream half of the EDR. Second, over this same domain, the water surface elevation drops a significant height of 1.57 m (5.14’). A lot of the elevation loss occurs abruptly at a rapid formed at a significant channel constriction (Fig. 3, top image, green to orange color change). The USGS gaging station is located just upstream of this constriction, so the constriction acts as the hydraulic control for the gaging station. Velocit ies in the potential rehabilitation area presently range from 0‐7 ft/s due to local flowconstrictions and expansions (Fig. 3).
Pasternack et al. (2010) analyzed the physical geography of the EDR with a focus on the history and status of Sinoro Bar. No EDR aerial imagery pre‐dates hydraulic mining, but the history of gold mining at a site in the vicinity called Landers Bar confirms that alluvium existed in the canyon. Historical photos from 1909 and thereafter show that hydraulic mining debris formed deep alluvial deposits, including multiple gravel‐bedded riffles. Based on the size and shape of the riffles evident in the imagery, they would have provided Chinook salmon spawning habitat. Therefore, there is historical evidence to suppor
2
t rehabilitating the EDR to provide the physical processes and morphologies associated with SRCS physical habitat.
A key conclusion of Pasternack et al. (2010) was that mechanized gold mining on Sinoro Bar (beginning circa 1960) was responsible for degrading SRCS habitat. Prior to mechanized mining, glide‐riffle transitions were gradual, enabling fish to select among a diverse range of local hydraulic conditions. Bulldozer debris constricted the channel significantly, induced abrupt hydraulic transitioning, and caused the main riffle at the apex of the bar to degrade into a chute unsuitable for SRCS spawning. In addition, mining operations evacuated the majority of alluvium at the mouth of Deer Creek, destroying what was likely a hotspot for biological productivity and SRCS spawning. Although shot rock

Figure 2. Topographic map of the Englebright Dam Rach of the lower Yuba River. The otential rehabilitation area is delineated by a polygon with an orange‐dot fill, while the rea of Sinoro Bar is delineated by a polygon with grey diagonal lines. pa
3
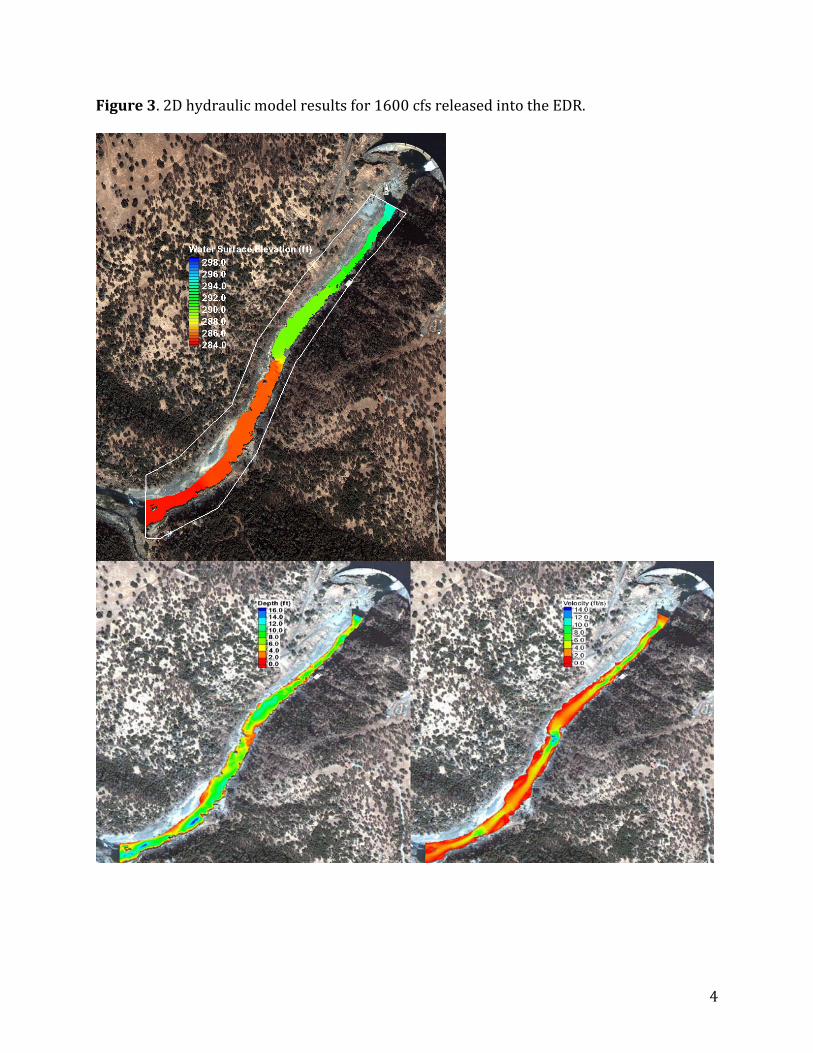
igure 3. 2D hydraulic model results for 1600 cfs released into the EDR. F
4

5
associated with Englebright Dam construction and hillside‐scouring around the dam during the largest historical floods contributed to the problems at Sinoro Bar, the impact of mechan ght Dam ized instream mining was significantly greater than the impact of Englebrion changing the structure of SRCS physical habitat in the vicinity of Sinoro Bar.
Pasternack et al. (2010) used topographic mapping and bedrock elevation assumptions to estimate that Sinoro Bar has an alluvial volume of 128,940 m3 (168,650 yds3). Fill depth was estimated to range between 0‐12.1 m (0‐30.7 ft). Test excavations could be performed to improve this volume estimate. They could also assess any value of the geologic materials present there.
LYR and EDR Salmonid Populations
There are no quantitative estimates for pristine, historic salmonid populations on the Yuba River prior to hydraulic gold mining, but Yoshiyama et al. (1996) reported historic accounts suggesting large populations. For example, they cite Chamberlain and Wells (1879) as stating that the Yuba was so full of salmon that Indians speared them “by the hundred”. However, during hydraulic gold mining much water was diverted away and the river valley was allowed to fill 20‐80’ high with mine tailings. A first‐hand account of a miner at Long Bar on the LYR stated that the miner’s diet primarily consisted of pancakes and there is no mention of fish at all (Lecouvreur, 1906). Even still, Yoshiyama et al. (1996) reported accounts of the construction of Bullards Bar Dam in 1921‐1924 in which it was stated that so many salmon were blocked at the construction location that their carcasses had to be burned. SRCS and steelhead both were known to migrate far up into the North and Middle Yuba Rivers and several miles up into the South Yuba before reaching potentially impassable waterfalls. However, much of the spawning habitat in the upper watershed was badly degraded by mining debris, sand, and turbidity. If the SRCS population was in the hundreds of thousands of fish, then the riffles in the EDR during the mining era and early 20th century would likely have been used by such a large population. However, relative to the total abundance, this number of fish spawning in the EDR may not have dr ting awn the attention of naturalists at the time, especially given the difficulty of getto that area.
During the latter half of the 20th century, salmonid populations were estimated quantitatively (Fig. 4), but it is still difficult to isolate SRCS numbers. Yoshiyama et al. (1996) cite several estimates of the fall‐run Chinook salmon population, but provide no enumeration of SRCS. They cite John Nelson as reporting that fall‐ and spring‐run populations are mixed and that these mixed fish are now present in “minimal numbers”. Table 2 of CDFG (1991) enumerates the annual estimate of fall‐run Chinook salmon, with a range of 1000 in 1957 to 39,000 in 1982. For the SRCS, CDFG (1991) states that a remnant population exists and that it is composed of some in‐river natural reproduction, strays from the Feather River, and restocked, hatchery‐reared fish. Restocking of fingerlings and yearlings was done in 1980. CDFG (1991) reported that 20 pairs of Chinook salmon were observed to spawn at the Narrows powerhouse in autumn 1986 and due to passage barriers in the autumn, it was decided that these were SRCS that migrated during high spring flows. CDFG stopped conducting annual escapement surveys in 1989. No survey was done in 1990. The Yuba County Water Agency (YCWA) sponsored Jones and Stokes, Inc. to perform escapement surveys using the CDFG methodology for 1991‐2004. For

2005‐2007 CDFG took over the effort again, but beginning in 2008 the responsibility shifted to the RMT as part of its new Monitoring and Evaluation Plan. The RMT’s 2008 escapement and redd reports used temporal modalities associated with fresh carcass observations and frequencies of redd observations to try to differentiate spring‐ and fall‐run Chinook salmon. However, it was not possible to obtain a clear distinction and all data were analyzed together. In all of these modern enumerations, abundance estimates did not isolate SRCS or the subpopulation of all Chinook in the EDR; carcass counts were not made in the EDR due to challenging accessibility.
Figure 4. Adult Chinook salmon abundance for the LYR based on carcass surveys and coded‐wire tagging.
For March 2007 through February 2008, the RMT operated a Vaki RiverWatcher
video monitoring system on both fish ladders at Daguerre Point Dam (~12 miles downstream of the EDR). This system scans the side‐view projected area of each fish and takes a color photo of each fish. From these data, staff counts the number of fish that pass and use characteristic morphometrics to identify the species of each fish (for ~70% of individ st,
6
uals). Of the 1,324 Chinook that were observed, 336 (25%) passed in March‐Auguwhich is the period that SRCS likely migrate.
Adult SRCS have been observed holding in pools in the EDR. Acoustic tracking of adult SRCS in 2009 by the RMT showed that some individuals migrate into and out of the

7
reach until September at which point they stop migrating and attempt to spawn. In September 2007, UC Davis graduate student Aaron Fulton observed SRCS attempting to dig redds and spawn on bedrock covered with a thin veneer of angular gravel, causing them injury. Fulton (2008) investigated salmon spawning habitat conditions in the EDR and found the conditions to be very poor to nonexistent.
In November 2007, the U.S. Army Corps of Engineers (USACE) injected 450 metric tons of gravel/cobble into the Narrows II pool below Englebright Dam. Flows in winter and spring 2008 were too low to move the sediment out of the pool. In March and May 2009, there were two moderate floods that overtopped Englebright Dam and caused a short re‐distribution of gravel into suitable depths and velocities for spawning. A report on this is available from the USACE. Preliminary observations of Chinook salmon redds in 2009‐2010 by the RMT found that 120 redds were located in the EDR between September 7, 2009 and February 22, 2010. This response to limited gravel injection indicates that if more spawning habitat was present, a population of SRCS could be accommodated. Rehabilitation Concepts
The goal of this report is to provide an estimate of the number of SRCS individuals that rehabilitating Sinoro Bar could support. There are many ways to calculate such an estimate. Ultimately, the actual population of supported fish is going to depend on exactly how habitat is created and how many SRCS adults enter the LYR. As a result, it is necessary to spend some time characterizing the opportunities and constraints of what the project would look like, based on lessons of other similar projects.
One mistaken notion that some people have is that gravel may be placed anywhere in a degraded spawning area and the adult salmonids will spawn at random over the suitable substrates, regardless of the suitability of the hydraulic and cover conditions. This line of thinking has led to worries about unusual substrate aspects, such as the “smell” of gravel. Spawning studies and gravel placement experiments on the Mokelumne, Yuba, and Trinity Rivers in California refute these notions. Elkins et al. (2007) reported that fall‐run Chinook spawners occurred in lower quality hydraulic habitats prior to river rehabilitation, but they still did not spawn on gravels with depth and velocities outside the range of their depth and velocity habitat suitability curves. On the Trinity River below Lewiston Dam, when gravel was placed throughout the reach according to a designed pattern, spawners avoided building redds in fresh gravels in areas where the depths and velocities were outside the ranges of the habitat suitability curves. Gravel is placed in such locations to achieve geomorphic objectives and to serve different salmonid species’ lifestages. On the LYR, Pasternack (2008) reported that spawners avoided areas with gravel present, but unsuitable hydraulics. Dr. Hamish Moir and Prof. Greg Pasternack also observed Chinook salmon spawning in a deep pile of brightly colored blue gravels that were painted and installed into the bed in an area with high‐quality hydraulics for a tracer experiment‐ suggesting that if hydraulics are high‐quality, then “smell” is not a deterrent. Also, the gravels placed on the Trinity below Lewiston Dam came from out of basin and the fish spawned in it very intensively anyway, again suggesting that fish do not dislike the “smell” of out‐of‐basin gravels. It is likely that reports of statistical analyses of the effects of gravel “smell” are not accounting for other relevant variables in explaining habitat utilization. As a

8
result, a project at Sinoro Bar is not just a matter of pouring gravel to create a big flat riffle; some thought should go into the structure of rehabilitated area to maximize SRCS spawning potential.
Wheaton et al. (2004) and Elkins et al. (2007) lay out a peer‐reviewed framework for river rehabilitation below dams on regulated gravel‐bed rivers (see http://shira.lawrucdavis.edu). The framework is called the Spawning Habitat Integrated Rehabilitation Approach (SHIRA). SHIRA has “spawning habitat” in its name based on the ecological concept of indicator species and its applicability to anadromous fishes (Willson and Halupka, 1995). The concept suggests that there are a few ecologically iconic activities whose abundance, productivity, and/or behavior is an indicator of ecosystem condition. For example, salmonid fisheries experts differ in their view as to what species and lifestage of organism is most limiting for each population’s recovery, but agree that evaluating rearing lifestages is much more difficult and costly than evaluating the spawning lifestage‐ redds are discrete physical structures that can be readily mapped. Also, several studies of spawning habitat rehabilitation projects on the lower Mokelumne River have found that improving spawning habitat yields associated benefits to physico‐chemical conditions in gravels (Merz and Setka, 2004), embryo incubation and emergence to fry (Merz et al., 2004), macroinvertebrate abundance and diversity (Merz and Ochikubo Chan, 2005), streamwood recruitment (for structural shade and cover), and channel‐floodplain connectivity (that provides access to excellent rearing habitat). SHIRA advocates comprehensive pre‐project assessment, planning and design phases followed by construction, post‐project assessment, monitoring and hopefully adaptive management. During ze each of seven phases, four primary modes are used iteratively to collect and analydata on which flexible and informed decisions can be based (Wheaton et al., 2004).
Based on lessons learned in applying SHIRA to the Mokelumne, Trinity, American, Feather, and Yuba Rivers, there are some important opportunities and constraints that should guide the conceptual design for Sinoro Bar and should be reflected in SRCS population estimates.
First, the domain of consideration for river rehabilitation should not be limited to the area of Sinoro Bar itself, but should go from the hydraulic constriction farther upstream to the end of Sinoro Bar (Fig. 2). The main reason for using this larger domain is that the rehabilitated area needs to have much more kinetic energy than is presently available at Sinoro Bar itself. The majority of the available energy is spent at the upstream rapid. There is a step just downstream of the bar that also uses some of the available energy. There is no way around making use of the energy spent in these two bounding steps to rehabilitate SRCS habitat, and the more one uses, the better habitat can be achieved. However, the area of potential rehabilitation should not be filled up with so much gravel as to back water up above the existing upstream constriction during flows of less than ~2,000 cfs. This will preserve the current USGS gaging station rating curve for low flows and minimize any other negative impacts on upstream habitat that will be created by future USACE gravel augmentation efforts.
Second, Elkins et al. (2007) reported that the best quality Chinook spawning habitat on the lower Mokelumne required a local riffle‐to‐riffle slope of ~0.004 (0.4 %). A similar value was found for the Trinity River, which has a similar size and spawning discharge. The EDR has more than double the spawning season discharge as the Mokelumne and Trinity Rivers, but that is offset according to mass conservation by having double the width,

9
so velocities should be roughly similar for the same slope. For the EDR, the centerline length of the potential rehabilitation area between the upstream and downstream confining bed steps (Fig. 2) is ~2,130’. Given an upstream available elevation of 5.14’ (Fig. 5, left photo), the site‐averaged available slope is 0.2%. The height of the downstream step (Fig. 5, right photo) is unknown, but if it were at least ~1.3’, then incorporating that amount into the design would yield a site‐averaged available slope of 0.3%. It is possible that 0.3% is enough to yield good SRCS spawning habitat throughout the whole project area. To have one or more riffles with 0.4% slope for SRCS spawning habitat in the project area, then pool habitat could be incorporated for 158.5 m (520’), leaving 490.7 m (1,610’) of spawning riffles. Incorporating 1‐2 pools would provide holding habitat, and with the addition of boulders and streamwood, there would be adult spawner refugia in proximity to redd construction points and juvenile habitat. This analysis reveals that different SRCS spawning estimates are possible depending on the area that is assumed available for spawning. The highest estimate assumes the whole area is suitable habitat with a slope of 0.3 %, which is possible. An intermediate estimate accounts for having some pools for adult holding in the project domain, leaving optimal riffle habitat with a slope of 0.4%. A conservative estimate reserves an additional 20% of the area for glides, backwaters, and other mesohabitats that are not used for spawning.
Third, it appears that Sinoro Bar takes the form of a “point bar” (see cover photo), which is a sedimentary deposit that forms on the inside of a meander bend. There is definitely a gentle meander in the canyon at this location. As a result, the first instinct of a project designer might be to build the rehabilitated site as a point bar as well. This would severely restrict the amount of SRCS habitat that could be gained from the project. There are several lines of evidence that suggest that designing the site to remain a point bar would be an unnecessary mistake. First, White (2008) analyzed the historical (1937‐2006) pattern of riffles and pools in Timbuctoo Bend downstream of the EDR on the LYR and found that only one out of eight persistent riffles was associated with the pattern of valley and channel meandering (Fig. 6). Some long‐persistent riffles occur right in the middle of a meander where standard theory predicts a deep pool and point bar should be located. The reason why meandering was not important was due to the presence of longitudinally undulating valley walls. During floods, these undulating walls appear to cause a hydrogeomorphic mechanism known as “flow convergence routing” (MacWilliams et al, 2006). In essence, this mechanism involves the funneling of water like a jet through constricted parts of the valley and spreading it out in expansive areas. The locations of such constrictions are stage‐dependent, but during floods it is undulations in the valley walls that drive where pools cut down fast and riffles grow or just cut down slower. Sawyer et al. (2010) and Pasternack (2008) demonstrated the occurrence of flow convergence routing for the pool‐riffle‐run sequence at the apex of Timbuctoo Bend. Pasternack (2008) demonstrated the absence of riffle sustainability in the upper half of the EDR due to canyon width undulations being in phase with bedrock bed undulations. The upshot is that for a wandering gravel‐bed river like the lower Yuba River, wall undulations and flow convergence routing outweigh meandering as the primary control on riffle location and persistence. Thus, it is not necessary to assume that a large amount of area has to be used to form a point bar and thus not serve as SRCS habitat. Instead, Wheaton et al. (2010) demonstrated that flow convergence routing can be built into a site to insure riffle‐pool sustainability.
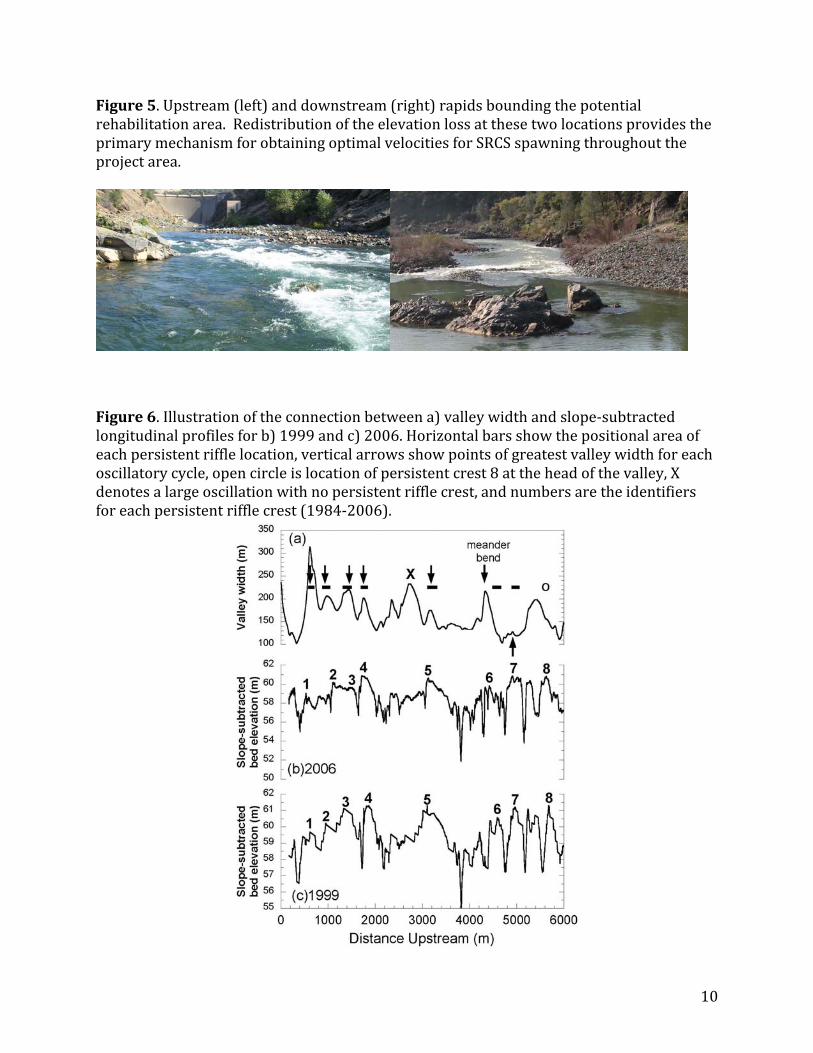
Figure 5. Upstream (left) and downstream (right) rapids bounding the potential rehabilitation area. Redistribution of the elevation loss at these two locations provides the rimary mechanism for obtaining optimal velocities for SRCS spawning throughout the roject area. pp
Figure 6. Illustration of the connection between a) valley width and slope‐subtracted longitudinal profiles for b) 1999 and c) 2006. Horizontal bars show the positional area of each persistent riffle location, vertical arrows show points of greatest valley width for each oscillatory cycle, open circle is location of persistent crest 8 at the head of the valley, X denotes a large oscillation with no persistent riffle crest, and numbers are the identifiers for each persistent riffle crest (1984‐2006).
10

11
Fourth, the situation at Sinoro Bar is further confounded by the role of Deer Creek, which enters the LYR at an almost perpendicular angle right below Sinoro Bar. Flood water
tions from Deer Creek can cause a strong backwater effect and work with valley wall undulaand local bedrock constrictions to promote deposition at Sinoro Bar. However, that only works if flows out of the two rivers are synchronous. Floods out of the smaller, lower‐elevation Deer Creek are rain‐driven and thus rise and fall quickly. Floods out of the Yuba catchment can be rain‐driven or rain‐on‐snow events. The former are slower to develop than those on Deer Creek and tend to peak afterwards, out of phase. That limits the ability of Deer Creek to provide a significant backwater effect. During rain‐on‐snow events, warm rain appears to simultaneously produce floods on both rivers, enabling the backwater effect to promote deposition. Based on historical events, if no action is taken to mitigate shot rock generation at Englebright Dam and if no design elements account for the backwater effect of Deer Creek, then rehabilitated conditions at Sinoro Bar could be short‐lived. As with the meandering factor, consideration of flow convergence routing should help yie itat ld a design to alleviate the problem, but that could come at the cost of some habarea to serve this geomorphic purpose.
Fifth, there is no water temperature or water quality limitation in the EDR that would diminish spawning activity or jeopardize embryo development.
Overall, the above considerations suggest that there is a large area available for river rehabilitation in the vicinity of Sinoro Bar in support of a sizable SRCS population. There is a sufficient river elevation range to provide the necessary kinetic energy for excellent riffle habitat. There is sufficient canyon width to enable a range of options for ontrolling riffle‐pool sustainability. Other factors, including channel meandering and a ributary junction can be managed without large loss of potential riffle area. ct Redd Estimates
There is no single correct method for predicting what the SRCS population supportable by a rehabilitation project at Sinoro Bar would be at this stage of design development. Choices in the design process can enhance or detract from estimates. The approach used here is to evaluate the relation between site conditions and redd occurrence, and then relate redd occurrence to the supportable SRCS adult population. Making an estimate of the number of redds to occur in a channel area comes down to picking two things: redd density (sum of occupied and unoccupied channel surface area (m2) per redd) and area of riffle habitat. In this section, I provide a table with 18 different redd oc area currence estimates using six different redd density and three different channel estimates.
Redd density requires an estimate of individual redd size and unoccupied area, which were estimated together using six different approaches. In all estimates, the only available information on redd size and density was for all runs of Chinook, not just spring‐run. Four estimates were based on observations of redd size in an index area near the upper end of Timbuctoo Bend in the LYR during almost‐daily observations in autumn 2008 by the RMT. According to their measurements of 180 Chinook redds, the mean redd size was 5.55 m2. They found that the mean plus one standard deviation was 8.60 m2. The maximum size observed was 14.18 m2. In comparison, Gallagher and Gallagher (2005)

12
found the average Chinook redd to be 6.72 m2 for several coastal streams in northern California. To go with these measurements, one can assume a redd density of 1 redd per each redd‐sized area of the bed. This assumes complete coverage of the bed with redds and no superimposition. In fact, in the index‐site study on the LYR there were unused areas around redds; however, there were also as many as 8 redds per redd area in some places, due to superimposition. Those confounding factors are hard to explicitly account for. If one were to assume an equal area of occupied and unoccupied space, then that would yield a redd density of 11.1 m2 per redd. Increasing unoccupied space to a 2:1 ratio against occupied space yields a redd density of 16.65 m2 per redd. Redd area also correlated directly with water depth in the index‐area study, but without knowing the eventu be al depth‐distribution of the rehabilitation site, this additional information cannotapplied; it might be useful in design evaluations at a later time.
Another way of estimating the likely density of redds is to take advantage of the experience at a similar site after rehabilitation. The lower Mokelumne River below Camanche Dam provides this opportunity (Fig. 7). However, there is a constraint on using this site in that the Mokelumne hatchery consumes a large percentage of potential spawners that enter the rehabilitated spawning habitat each year. In 2004, 91% of spawners were taken, which is typical (Elkins et al., 2007). As it turns out, 2005 was a banner year for escapement and it was a year in which an agreement was implemented for the hatchery to reduce its take. Their final take was only 36% of escapement. As a result, 10,406 spawners made use of the in‐river spawning habitat, of which 31.9 % chose to spawn on any one of several rehabilitated riffles. Looking at the riffle that had been the focus of habitat expansion and rehabilitation that summer, there were 241 redds observed in weekly surveys by EBMUD in autumn 2005. The area of the spawned over site was 4,401 m2. That yields a redd density of 18.3 m2 per redd. The only problem with this estimate, is that it does not account for superimposition, and in a year with as many spawners as were present in such a small area, superimposition was highly likely. If an assumption is made that there was 10% additional redds that were missed due to superimposition, then that would yield a redd area of 16.60 m2. That is very similar to the estimat e of redd density from the LYR index site using an unoccupied:occupied area ratioof 2:1.
To estimate the area of riffle habitat that could be created for spawning at Sinoro Bar, three different calculations were made. First, the total potential rehabilitation area was estimated. This was done by drawing a polygon around the area in a Geographical Information System (Fig. 2) and using GIS to calculate the area of the polygon, which was found to be 46,486 m2. Using this area assumes that the entire project area will be spawnable riffle habitat. Given a large spawner population, a higher than expected available slope, better velocities than anticipated for the expected slope, and aided by wood and boulder placements that give resting refugia and structural diversity, such a high value for spawnable habitat might be obtained; it is unlikely to be so high, but it is not beyond consideration.
Second, this area was divided by the centerline length of 650 m to obtain an average width of 71.5 m. Earlier it was stated that if a suitable length of the area was set aside for pools, then an optimal 0.4% slope could be achieved for 490.7 m of river length. Multiplying (490.7*71.5) yields 35,090 m2 of riffle habitat of optimal slope.
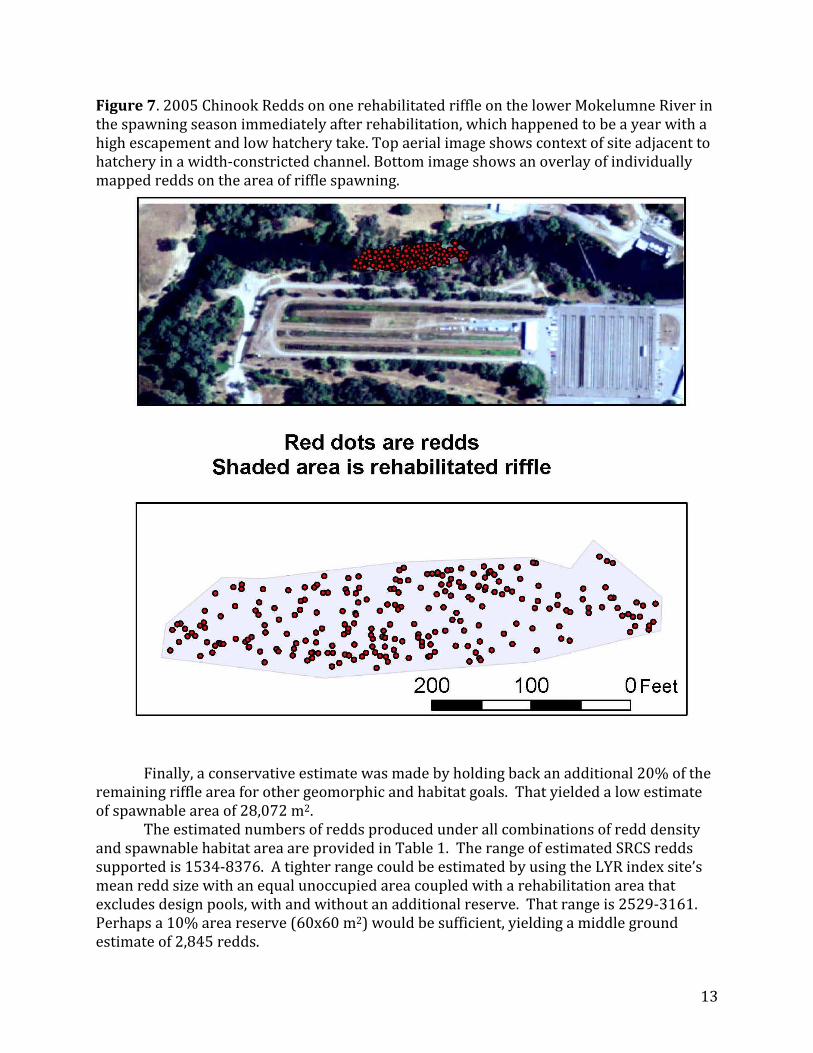
Figure 7. 2005 Chinook Redds on one rehabilitated riffle on the lower Mokelumne River in the spawning season immediately after rehabilitation, which happened to be a year with a high escapement and low hatchery take. Top aerial image shows context of site adjacent to hatchery in a width‐constricted channel. Bottom image shows an overlay of individually mapped redds on the area of riffle spawning.
Finally, a conservative estimate was made by holding back an additional 20% of the remain
13
ing riffle area for other geomorphic and habitat goals. That yielded a low estimate of spawnable area of 28,072 m2.
The estimated numbers of redds produced under all combinations of redd density and spawnable habitat area are provided in Table 1. The range of estimated SRCS redds supported is 1534‐8376. A tighter range could be estimated by using the LYR index site’s mean redd size with an equal unoccupied area coupled with a rehabilitation area that excludes design pools, with and without an additional reserve. That range is 2529‐3161. Perhaps a 10% area reserve (60x60 m2) would be sufficient, yielding a middle ground estimate of 2,845 redds.
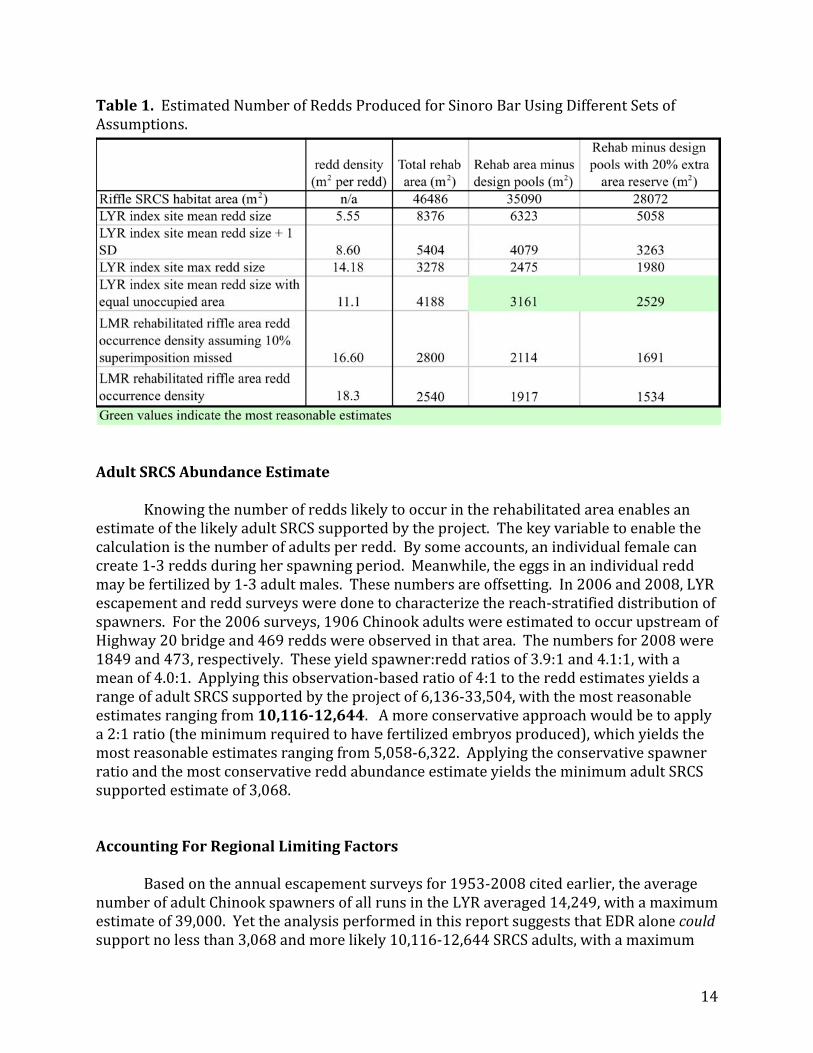
Table 1. Estimated Number of Redds Produced for Sinoro Bar Using Different Sets of Assumptions.
Adult SRCS Abundance Estimate
Knowing the number of redds likely to occur in the rehabilitated area enables an estimate of the likely adult SRCS supported by the project. The key variable to enable the calculation is the number of adults per redd. By some accounts, an individual female can create 1‐3 redds during her spawning period. Meanwhile, the eggs in an individual redd may be fertilized by 1‐3 adult males. These numbers are offsetting. In 2006 and 2008, LYR escapement and redd surveys were done to characterize the reach‐stratified distribution of spawners. For the 2006 surveys, 1906 Chinook adults were estimated to occur upstream of Highway 20 bridge and 469 redds were observed in that area. The numbers for 2008 were 1849 and 473, respectively. These yield spawner:redd ratios of 3.9:1 and 4.1:1, with a mean of 4.0:1. Applying this observation‐based ratio of 4:1 to the redd estimates yields a range of adult SRCS supported by the project of 6,136‐33,504, with the most reasonable estimates ranging from 10,11612,644. A more conservative approach would be to apply a 2:1 ratio (the minimum required to have fertilized embryos produced), which yields the most reasonable estimates ranging from 5,058‐6,322. Applying the conservative spawner atio and the most conservative redd abundance estimate yields the minimum adult SRCS upported estimate of 3,068. rs Accoun
14
ting For Regional Limiting Factors
Based on the annual escapement surveys for 1953‐2008 cited earlier, the average number of adult Chinook spawners of all runs in the LYR averaged 14,249, with a maximum estimate of 39,000. Yet the analysis performed in this report suggests that EDR alone could support no less than 3,068 and more likely 10,116‐12,644 SRCS adults, with a maximum

15
potential population as high as 33,504. The reason why the project can support so many fish is that the lower half of the EDR is actually a large section of river with a moderate slope and relatively high width. Historically there were likely hundreds of thousands of Chinook spawning in the Yuba, and even 33,504 would have been perhaps just 10% of that total ru arge, n. Thus, relative to current conditions the project’s results seem surprisingly lbut relative to historical conditions it is likely still small.
Since 1953 (56 years), there have only been 14 years when the LYR’s Chinook escapement has exceeded 20,000 and just 5 years when it has exceeded 30,000. Without going into a detailed “limiting factors” analysis, it is evident that the quantity and quality of freshwater habitats is not the only factor constraining population size. For example, the sharp decline in salmonid populations throughout the Central Valley for the last few years is a systemic phenomenon that has been tentatively linked to oceanic conditions. Therefore, it would be helpful to provide another way of estimating what the SRCS population would be in light of existing constraints beyond habitat conditions. To begin this analysis, assume that the maximum Chinook salmon population size likely to occur under the existing suite of limiting factors is 40,000, which is slightly bigger than the roughly estimated 39,000 reported for 1982. Also, in the absence of any other characterization, assume that the 2006 mesohabitat distribution and spawning habitat electivity (i.e., forage ratios) reported for Timbuctoo Bend by Pasternack (2008) hold for the whole LYR (Table 2); specifically, that 69% of Chinook salmon preferentially use riffles for spawning and that riffles account for 18% of the total channel area. Also, recall that the otal length of the LYR is 38 km. Using these values, the following calculation provides an stim e: te ate of spawning density in riffles for the maximum Chinook salmon population siz
[0
.69*40000] / [0.18*38] = 4,035 Chinook spawners per km of riffles on the LYR
Assuming the same spawning density for the proposed 0.49‐0.65 km of riffle habitat created under the EDR rehabilitation project, an estimated 1,977 to 2,623 [0.49*4,035 to 0.65*4,035] Chinook salmon could be supported in the proposed project area under the existing conditions that regionally constrain Central Valley populations of all Chinook runs.
Considering the assumptions above, probably the most uncertain one is the percent of area for the whole LYR that is riffles. Timbuctoo Bend has a steeper slope and thus likely more riffle length than the rest of the river downstream. If the actual areal percent of riffles in the entire LYR was half the value for Timbuctoo Bend (9%), then the number of Chinook per km would double to 8,070, and the range of Chinook likely to be supported by the project would also double to 3,954 to 5,246. So the calculation has uncertainty. The actual area of riffle habitat will be determined by the RMT under its Monitoring and Evaluation Plan in the near future.
The important point about this computation is that it has nothing to do with the local physico‐chemical potential of the project area to support SRCS and instead considers the larger problem of regional limiting factors on population size to get at the likely amount f individual Chinook salmon served by the site. o

Table 2. Timbuctoo Bend Mesohabitat Availability and Utilization (from Pasternack 2008)
Other Design Considerations
A common concern with spawning habitat rehabilitation is that project designs are
not natural and may be destroyed quickly. There is an environmental, psychological mindset that suggests that it is not possible for designers to get it right. So far, evidence from the lower Mokelumne River refutes that (Elkins et al., 2007; Wheaton et al., 2010). For the EDR, the historical deposition of mining debris and shot rock at Sinoro Bar proves that the site is naturally depositional and could yield sustainable riffle habitat in the face of large Yuba floods. If the USACE takes actions to reduce hillside erosion and shot rock ransport as well as to inject gravels into the Narrows II pool annually, then floods could ustain the HEA rehabilitated area, not destroy it. ts Literature Cited
h CDFG. 1991. Lower Yuba River Fisheries management Plan. California Department of Fisand Game, Stream Evaluation Report No. 91‐1.
Chamberlain, W.H. and H.L. Wells. 1879. History of Sutter County, California. Thompson keley, and West, Oakland, California. 127 pp. Reprinted by Howell‐North Books, Ber
California. 1974. Elkins, E. E., Pasternack, G. B., and Merz, J. E. 2007. The Use of Slope Creation for
Rehabilitating Incised, Regulated, Gravel‐Bed Rivers. Water Resources Research 43, W05432, doi:10.1029/2006WR005159.
Fulton, A.A. 2008. Gravel for Salmon in Bedrock Channels: Elucidating Mitigation Efficacy .
16
Through Site Characterization, 2D‐Modeling, and Comparison Along the Yuba River, CAM.S. Thesis, University of California, Davis, CA, 110pp.
Gallagher, S. P., and C. M. Gallagher. 2005. Discrimination of chinook and coho salmon and steelhead redds and evaluation of the use of redd data for estimating escapement in several unregulated streams in northern California. North American Journal of Fisheries Management 25:284‐300.

17
Lecouvreur, F. 1906. From East Prussia to the Golden Gate. Angelina Book Concern, LeipzigMacWilliams, M. L., Wheaton, J. M., Pasternack, G. B., Kitanidis, P. K., Street, R. L. 2006. The
s.
.
Flow Convergence‐Routing Hypothesis for Pool‐Riffle Maintenance in Alluvial RiverWater Resources Research 42, W10427, doi:10.1029/2005WR004391.
Merz, J.E., and Setka, J.D. 2004. Evaluation of a Spawning Habitat Enhancement Site for Chinook Salmon in a Regulated California River. North American Journal of Fisheries Management 24:397‐407.
Merz, J. E., Setka, J., Pasternack, G. B., Wheaton, J. M. 2004. Predicting benefits of spawning habitat rehabilitation to salmonid fry production in a regulated California river. Canadian Journal of Fisheries and Aquatic Science 61:1433‐1446.
Merz, J.E., L.K. Ochikubo Chan. 2005. Effects of gravel augmentation on macroinvertebrate assemblages in a regulated California river. River Research and Applications 21:61‐74.
Pasternack, G. B. 2008. SHIRA‐Based River analysis and field‐based manipulative sediment transport experiments to balance habitat and geomorphic goals on the lower Yuba River. Cooperative Ecosystems Studies Unit (CESU) 81332 6 J002 Final Report, University of California at Davis, Davis, CA, 569pp.
Pasternack, G. B., Fulton, A. A., and Morford, S. L. 2010. Yuba River analysis aims to aid spring‐run Chinook salmon habitat rehabilitation. California Agriculture.
Sawyer, A. M., Pasternack, G. B., Moir, H. J., Fulton, A. A. 2010. Riffle‐Pool Maintenance and Flow Convergence Routing Confirmed on a Large Gravel Bed River. Geomorphology
114:143‐160. Wheaton, J.M., Pasternack, G.B., and Merz, J.E. 2004 Spawning habitat rehabilitation – I.
Conceptual Approach & Methods. International Journal of River Basin Management 2:1:3‐20.
Wheaton, J. M., Brasington, J., Darby, S., Merz, J. E., Pasternack, G. B., Sear, D. A., Vericat, D. r 2010. Linking geomorphic changes to salmonid habitat at a scale relevant to fish. Rive
Research and Applications 26:469‐486. White, J.Q., 2008. Valley width controls on riffle location and persistence on a gravel bed
river. Masters Thesis, University of California at Davis. ertebrate Willson,M. F. and Halupka, K. C. 1995. Anadromous Fish as Keystone Species in V
Communities. Conservation Biology, 9:3:489–497. Yoshiyama RM, Gerstung ER, Fisher FW, Moyle PB. 1996. Historical and present
distribution of Chinook salmon in the Central Valley drainage of California. UC Centers for Water and Wildland Resources, Davis. In: Brown RL (ed.). Contributions to the Biology of Central Valley Salmonids. Vol. 1. California Department of Fish and Game, Fish Bulletin 179, p 71–176.