estimated use of water in the united states in 2005 generation water withdrawals were an estimated...
TRANSCRIPT

U.S. Department of the InteriorU.S. Geological Survey
Circular 1344
Estimated Use of Water in the United States in 2005

1 —Chemical manufacturing plant. Photo used with permission. 2 —Sand and gravel mine, Texas. Photo by Nancy L. Barber, USGS. 3 —Domestic water use. Photo by Nancy L. Barber, USGS. 4 —Fire hydrant. Photo by Peter Griffin, http://www.publicdomainpictures.net. 5 —Upper Mississippi River, Wisconsin. Photo by Bob Nichols, USDA Natural Resources Conservation Service. 6 —Livestock watering tank. Photo courtesy of USDA Natural Resources Conservation Service. 7 —Domestic water use. Photo by Nancy L. Barber, USGS. 8 —Alaska salmon. Photo courtesy of U.S. Fish and Wildlife Service. 9 —Center pivot irrigation system. Photo by Tim McCabe, USDA Natural Resources Conservation Service. 10 —Water tower. Photo by Nancy L. Barber, USGS. 11 —Oil well, New Mexico. Photo by Alan M. Cressler, USGS. 12 —Holstein dairy cows. Photo by Bob Nichols, USDA Natural Resources Conservation Service. 13 —Flowing well in the Floridan aquifer, Brunswick, Georgia. Photo Alan M. Cressler, USGS. 14 —Catfish ponds, Louisiana. Photo by Scott Bauer, USDA Agricultural Research Service. 15 —NIPSCO Coal Power Plant cooling tower. Photo by John J. Mosesso, USGS National Biological Information Infrastructure. 16 —Cranberry harvest, New Jersey. Photo by Keith Weller, USDA Agricultural Research Service. 17 —Horseshoe Falls, Niagara River. Photo by Alan M. Cressler, USGS. 18 —Domestic water use. Photo by Nancy L. Barber, USGS. 19 —Breeder chickens in Cleburne County, Alabama. Photo by Michael J. Harper, Alabama Office of Water Resources. 20 —Drip irrigation on citrus. Photo by Ron Nichols, USDA Natural Resources Conservation Service.
1
2
3
45
6
7
8
9
10
11
12
13
14
15
16
17
18
19
20
Cover. Photo collage of water use and supply.

Estimated Use of Water in the United States in 2005
By Joan F. Kenny, Nancy L. Barber, Susan S. Hutson, Kristin S. Linsey, John K. Lovelace, and Molly A. Maupin
Circular 1344
U.S. Department of the InteriorU.S. Geological Survey
U.S. Department of the InteriorKEN SALAZAR, Secretary
U.S. Geological SurveySuzette M. Kimball, Acting Director
U.S. Geological Survey, Reston, Virginia: 2009
For more information on the USGS—the Federal source for science about the Earth, its natural and living resources, natural hazards, and the environment, visit http://www.usgs.gov or call 1-888-ASK-USGS
For an overview of USGS information products, including maps, imagery, and publications, visit http://www.usgs.gov/pubprod
To order this and other USGS information products, visit http://store.usgs.gov
Any use of trade, product, or firm names is for descriptive purposes only and does not imply endorsement by the U.S. Government.
Although this report is in the public domain, permission must be secured from the individual copyright owners to reproduce any copyrighted materials contained within this report.
Suggested citation:Kenny, J.F., Barber, N.L., Hutson, S.S., Linsey, K.S., Lovelace, J.K., and Maupin, M.A., 2009, Estimated use of water in the United States in 2005: U.S. Geological Survey Circular 1344, 52 p.
Library of Congress Cataloging-in-Publication Data
Estimated use of water in the United States in 2005 / by Joan F. Kenny ...[et al.]. -- 1st ed. p. cm. -- (Circular ; 1344) Includes bibliographical references. ISBN 978-1-4113-2600-2 1. Water consumption--United States. I. Kenny, J. F. II. GeologicalSurvey (U.S.) III. Series: U.S. Geological Survey circular ; 1344. TD223.E836 2009 333.91’130973090511--dc22
2009041893

iii
Contents
Abstract ...........................................................................................................................................................1Introduction.....................................................................................................................................................2
Purpose and Scope ..............................................................................................................................2Terminology ...........................................................................................................................................2Changes for the 2005 Report ...............................................................................................................3Sources of Data and Methods of Analysis .......................................................................................3Acknowledgments ................................................................................................................................3
Total Water Use ..............................................................................................................................................4Public Supply ................................................................................................................................................16Domestic........................................................................................................................................................19Irrigation ........................................................................................................................................................23Livestock........................................................................................................................................................26Aquaculture ..................................................................................................................................................29Industrial........................................................................................................................................................32Mining ...........................................................................................................................................................35Thermoelectric Power ................................................................................................................................38Trends in Water Use, 1950 – 2005 ...............................................................................................................42References Cited..........................................................................................................................................46Glossary .........................................................................................................................................................47Cooperating Agencies and Organizations ...............................................................................................50

iv
Conversion FactorsMultiply By To obtain
Areaacre 4,047 square meter (m2)acre 0.4047 hectare (ha)acre .001562 square mile (mi2)
Volumeacre-foot (acre-ft) 1,233 cubic meter (m3)acre-foot (acre-ft) 325,851 gallons (gal)acre-foot (acre-ft) 43,450 cubic feet (ft3)cubic foot (ft3) 7.48 gallons (gal)gallon (gal) 3.785 liter (L) gallon (gal) 3.785 cubic decimeter (dm3) million gallons (Mgal) 3,785 cubic meter (m3)million gallons (Mgal) 3.07 acre-feet (acre-ft)
Flow rateacre-foot per year (acre-ft/yr) 1,233 cubic meter per year (m3/yr)billion gallons per day (Bgal/d) 1.3185 billion cubic meters per yeargallon per day (gal/d) 3.785 liter per day (L/d)million gallons per day (Mgal/d) 0.04381 cubic meter per second (m3/s)million gallons per day (Mgal/d) 1.547 cubic feet per second (ft3/sec)million gallons per day (Mgal/d) 1.121 thousand acre-feet per year
(acre-ft/yr)million gallons per day (Mgal/d) 1.3185 million cubic meters per yearthousand acre-feet per year (acre-ft/yr) 0.8921 million gallons per day (Mgal/d)
Energygigawatthour (gWh) 3,600,000 Megajoule (MJ)kilowatt-hour (kWh) 3,600,000 joule (J)
Othercubic foot (ft3) 62.4 pounds (lb)gallon (gal) 8.34 pounds (lb)gallons per day per square mile
[(gal/d)/mi2]1.4614 cubic meter per day per square
kilometer [(m3/d)/km2]inch of rain (in) 27,200 gallons per acre (gal/ac)
Acronyms Used in this ReportSDWIS Safe Drinking Water Information System
USDA ARS U.S. Department of Agriculture, Agricultural Research Service
USDA NASS U.S. Department of Agriculture, National Agricultural Statistics Service
USDA NRCS U.S. Department of Agriculture, Natural Resources Conservation Service
USDOE EIA U.S. Department of Energy, Energy Information Administration
USEPA U.S. Environmental Protection Agency
USGS U.S. Geological Survey
Estimated Use of Water in the United States in 2005
By Joan F. Kenny, Nancy L. Barber, Susan S. Hutson, Kristin S. Linsey, John K. Lovelace, and Molly A. Maupin
AbstractEstimates of water use in the United States indicate that
about 410 billion gallons per day (Bgal/d) were withdrawn in 2005 for all categories summarized in this report. This total is slightly less than the estimate for 2000, and about 5 percent less than total withdrawals in the peak year of 1980. Fresh-water withdrawals in 2005 were 349 Bgal/d, or 85 percent of the total freshwater and saline-water withdrawals. Fresh groundwater withdrawals of 79.6 Bgal/day in 2005 were about 5 percent less than in 2000, and fresh surface-water withdrawals of 270 Bgal/day were about the same as in 2000. Withdrawals for thermoelectric-power generation and irriga-tion, the two largest uses of water, have stabilized or decreased since 1980. Withdrawals for public-supply and domestic uses have increased steadily since estimates began.
Thermoelectric-power generation water withdrawals were an estimated 201 Bgal/d in 2005, about 3 percent more than in 2000. In 2005, thermoelectric freshwater withdrawals accounted for 41 percent of all freshwater withdrawals. Nearly all of the water withdrawn for thermoelectric power was surface water used for once-through cooling at power plants. Twenty-nine percent of thermoelectric-power withdrawals were saline water from oceans and brackish coastal water bodies.
Withdrawals for irrigation in 2005 were 128 Bgal/d, about 8 percent less than in 2000 and approximately equal to estimates of irrigation water use in 1970. In 2005, irriga-tion withdrawals accounted for 37 percent of all freshwater withdrawals and 62 percent of all freshwater withdrawals excluding thermoelectric withdrawals. Irrigated acreage increased from 25 million acres in 1950 to 58 million acres in 1980, then remained fairly constant before increasing in 2000 and 2005 to more than 60 million acres. The number of acres irrigated using sprinkler and microirrigation systems has continued to increase and in 2005 accounted for 56 percent of the total irrigated acreage.
Water withdrawals for public supply were 44.2 Bgal/d in 2005, which is 2 percent more than in 2000, although the population increased by more than 5 percent during that time.
Public supply accounted for 13 percent of all freshwater withdrawals in 2005 and 21 percent of all freshwater with-drawals excluding thermoelectric withdrawals. The percentage of the U.S. population obtaining drinking water from public suppliers has increased steadily from 62 percent in 1950 to 86 percent in 2005. Most of the population providing their own household water obtained their supplies from ground-water sources.
Self-supplied industrial water withdrawals continued to decline in 2005, as they have since their peak in 1970. Self-supplied industrial withdrawals were an estimated 18.2 Bgal/d in 2005, a 30-percent decrease from 1985. An estimated 4.02 Bgal/d were withdrawn for mining in 2005, which is 11 percent less than in 2000, and 18 percent less than in 1990. Withdrawals for mining were only 58 percent freshwater.
Livestock water use was estimated to be 2.14 Bgal/d in 2005, which is the smallest estimate since 1975, possibly due to the use of standardized coefficients for estimation of animal water needs. Water use for aquaculture was an estimated 8.78 Bgal/d in 2005, nearly four times the amount estimated in 1985. Part of this increase is due to the inclusion of more facilities in the estimates in 2005, and the use of standardized coefficients for estimating aquaculture use from other data.
Fresh surface water was the source for a majority of the public-supply, irrigation, aquaculture, thermoelectric, and industrial withdrawals. Nearly 30 percent of all fresh surface-water withdrawals in 2005 occurred in five States. In California, Idaho, and Colorado, most of the fresh sur-face-water withdrawals were for irrigation. In Texas and Illinois, most of the fresh surface-water withdrawals were for thermoelectric power generation.
About 67 percent of fresh groundwater withdrawals in 2005 were for irrigation, and 18 percent were for public supply. More than half of fresh groundwater withdrawals in the United States in 2005 occurred in six States. In California, Texas, Nebraska, Arkansas, and Idaho, most of the fresh groundwater withdrawals were for irrigation. In Florida, 52 percent of all fresh groundwater withdrawals were for public supply, and 34 percent were for irrigation.

2 Estimated Use of Water in the United States in 2005
IntroductionThis report, “Estimated use of water in the United States
in 2005,” is the twelfth in a series of reports that has been compiled and published by the U.S. Geological Survey (USGS) every 5 years since 1950. These reports include estimates of water withdrawals by State, source of water, and category of use. Data from 2005 and earlier years can be used to indicate changes in water use over time, among different geographic areas, and from different sources. Water-use information complements the study of surface-water and groundwater availability, and is essential to understanding how future water demands will be met while maintaining adequate water quality and quantities for human and eco-system needs.
Water supplies and their uses are affected by factors such as demographics, economic trends, legal decisions, and climatic fluctuations. From 1950 to 2005 the population of the United States doubled, and also shifted from rural to urban areas. Southern and Western States have experienced the greatest increases in population, with concurrent expan-sion of public water supplies. In response to increased demands and limits on supplies, communities have sought additional water sources or instituted water-conservation measures.
Irrigation practices and crop types also have changed with time, technology, and the economy. In some geographic areas, increased costs and reduced water availability have led to the use of more efficient irrigation practices and a reduction in irrigation water use. In other areas, increases in both water use and irrigated acreage have occurred because of water availability, demand for certain crops, and the desire to improve crop yield by using irrigation to supplement rainfall.
Changes in technology and economic conditions have affected industrial and thermoelectric power water uses and spurred interest in water reuse and reclamation. In response to regulation of the quality and temperature of discharged water, withdrawals for some thermoelectric and industrial facilities have decreased. Cooling water is essential for producing most of the thermoelectric power generated in the United States, and increased electric energy usage has resulted in additional demands for water. Limitations on water supplies have led to the use of less water-intensive cooling technologies for producing thermoelectric power in newer plants.
Climatic fluctuations have a prominent effect on water withdrawals, particularly those for irrigation, thermoelectric power generation, and public supply. Periodic droughts have drawn attention to the limits of local and regional water supplies. However, the effects of climatic conditions in any particular year cannot be associated readily with the aggre-gate data presented in these reports. The effects of tempera-ture and precipitation extremes often are difficult to isolate from other factors that affect water use. Also, because of the nature of reporting programs, water-use estimates for some categories of use may be based on ancillary data from several different years.
Purpose and ScopeThis report presents water-use estimates by source and
by State for eight categories of water use for 2005. Sources include surface water and groundwater, both fresh and saline. Categories include public supply, domestic, irrigation, livestock, aquaculture, industrial, mining, and thermoelectric power. All withdrawals for the public-supply, domestic, irrigation, and livestock categories are shown as freshwater, although in some areas water is treated to reduce salinity for these uses. Both fresh and saline withdrawals are shown for industrial, mining, and thermoelectric-power generation uses. Geographic areas include the 50 States, the District of Columbia, Puerto Rico, and the U.S. Virgin Islands, which are hereafter referred to as “States” for brevity.
The USGS series of 5-year national water-use estimates serves as one of the few sources of information about regional and national trends in water withdrawals. Earlier reports (MacKichan, 1951, 1957; MacKichan and Kammerer, 1961; Murray, 1968; Murray and Reeves, 1972, 1977; Solley and others, 1983, 1988, 1993, 1998; Hutson and others, 2004) are available on the Internet at http://water.usgs.gov/watuse/. County-level data for all published categories of use for the years 1985, 1990, 1995, 2000, and 2005 may be downloaded from this site.
Terminology The terms and units used in this report are similar to those
used in previous USGS water-use Circulars; terms are defined in the Glossary at the end of this report. Withdrawal estimates for each category represent the total amount of water removed from the water source, regardless of how much of that total is consumptively used. In most cases, some fraction of the total withdrawal will be returned to the same or a different water source after use and is available for other withdrawals. Because of the uncertainty of estimating consumptive use and return flows on a category and State basis, estimates of consumptive use are not provided in this report. Saline water is defined as water containing dissolved solids of 1,000 milli-grams per liter or more. Estimates of wastewater reuse were compiled by some States for the industrial, thermoelectric, and irrigation categories, but were not shown in the tables because of the small volumes of water compared to the totals.
Annual water-use data are expressed in this report in terms of million gallons per day (abbreviated as Mgal/d) and thousand acre-feet per year. The term billion gallons per day (abbreviated as Bgal/d) is used in the Abstract and Trends sections to more simply express large numbers for total uses. Units of millions or billions of gallons per day do not represent actual daily rates, but rather are used to express total amounts as an average daily rate for 1 year. For example, irrigation water may be applied only during parts of the year and at variable rates; therefore, the actual rate of application at any given time during the growing season is different from the average daily rate based on 365 days in a year.

Introduction 3
The water-use data in this report are rounded to three sig-nificant figures. All values are rounded independently, so the sums of individual rounded numbers may not equal the totals. Percentage changes discussed in the text are calculated from the unrounded data and are expressed as integers. All popula-tion data are rounded to three significant figures.
Changes for the 2005 ReportFor 2005, the reported categories of water use are the
same as for 2000, but every category includes data from every State. Estimates for the livestock, aquaculture, and mining categories, which were optional for some States in 2000, are reported for all States, some of which chose to use national datasets generated using methods described by Lovelace (2009a, b, c). Deliveries from public supply for domestic use, last reported for 1995, were compiled for 2005, but public-supply deliveries for commercial, industrial, and thermo-electric-power generation use were not. The amount of power generated by thermoelectric power plants, which was not reported for 2000, has been included for 2005.
Changes that were made to the presentation of livestock, aquaculture, and thermoelectric-power generation data in 2000 were continued for 2005. Livestock and aquaculture remain separate categories, with aquaculture including withdrawals for both fish farms, formerly reported with the animal-specialties category, and fish hatcheries, formerly reported with commercial use. Thermoelectric-power generation water use remains subdivided by cooling type (thermoelectric with drawals by once-through and recirculating cooling types were first presented for 2000).
The Trends section of this report includes national totals for withdrawals by category and source of water from 1950 to 2005. These totals may have changed for some categories and years due to corrections or revisions to individual State data. Because of these changes, some of the percentage changes in this report may be slightly different from calculations made using data previously published in Hutson and others (2004). In addition, industrial and mining water withdrawals (formerly termed “other industrial” uses to distinguish them from thermoelectric-power water uses) are shown as separate categories. Estimates of livestock, aquaculture, and mining water uses for the States that did not report those uses in 2000 are included in category totals for this report so that national totals could be provided for all categories for that year.
As in the 2000 report, water-use estimates were not compiled on the basis of hydrologic unit (watershed) for 2005. Also, no data are presented for the commercial category. Instream use for hydroelectric-power generation was not compiled for 2005. Some of these additional water data may have been collected by individual States, but are not compiled as a national dataset or included in this report.
Sources of Data and Methods of AnalysisThe data presented in this report were compiled from vari-
ous sources, depending on the category and the data available for each State. USGS personnel in each State determined
the best sources of information available, compiled or esti-mated the data, and prepared documentation of the sources and methods used to determine water use. Values calculated using different sources and methods have varying levels of precision, and therefore some estimates are more reliable than others. Because the largest users and the most prominent categories of use within each State have the greatest effect on the totals, obtaining reliable estimates for these large users and categories was the primary focus of the compilation effort.
Sources of information include national datasets, State agencies, individual questionnaires, and local contacts. National datasets available to each State included the U.S. Environmental Protection Agency (USEPA) Safe Drinking Water Information System (SDWIS), U.S. Census Bureau population estimates, U.S. Department of Agriculture (USDA) Farm and Ranch Irrigation Survey, USDA Census of Agricul-ture, USDA National Agricultural Statistics Service (NASS) crop and livestock estimates, and U.S. Department of Energy (USDOE) Energy Information Administration (EIA) facility reports. Datasets and sources of information used to produce the national estimates for the livestock, aquaculture, and mining categories included the USDA NASS, county extension agents, USGS Minerals Information Team, USDOE EIA, and U.S. Bureau of Mines. Sources of information are discussed in greater detail in the individual category sections of this report.
Many of these data, such as those from NASS and EIA, are collected annually. Other data are provided for years other than 2005, but are used to develop the 2005 estimates in some States because they are the most complete data available. For example, the USDA Census of Agriculture is produced in years ending in “2” and “7,” and the USDA Farm and Ranch Irrigation Survey is produced in years ending in “3” and “8.” For several States, the 2005 water-use estimates were based on 2004 information from State water-use reporting programs.
Guidelines for preparing the 2005 water-use estimates were developed and distributed to water-use personnel in each USGS Water Science Center. These guidelines have been published as USGS Techniques and Methods Book 4, Chapter E1, “Guidelines for preparation of State water-use estimates for 2005” (Hutson, 2007) which is available on the Internet at http://pubs.usgs.gov/tm/2007/tm4e1/. Reports published by individual States as part of the National Water-Use Information Program, as well as a list of contact personnel in each USGS Water Science Center, also are available on the Internet at http://water.usgs.gov/watuse/.
AcknowledgmentsThis national compilation of water use would not be
possible without the assistance and data provided by the many State and local agencies that manage water resources, operate data-collection programs, and administer regulations for use of water and other natural resources. The agencies and other organizations that provided assistance are listed for each State at the end of this report. The authors also gratefully acknowledge the USGS personnel in each State who compiled the data for this report.

410,000 million gallons per day
4 Estimated Use of Water in the United States in 2005
Total Water Use
Total water withdrawals in the United States for 2005 were estimated for eight categories of use: public supply, domestic, irrigation, livestock, aquaculture, industrial, mining, and thermo electric-power generation (fig. 1). Thermoelectric power was the largest category of water use, followed by irrigation and public supply. The remaining categories of self-supplied industrial, aquaculture, mining, self-supplied domestic, and livestock water uses together were less than 10 percent of total water withdrawals estimated in this report.
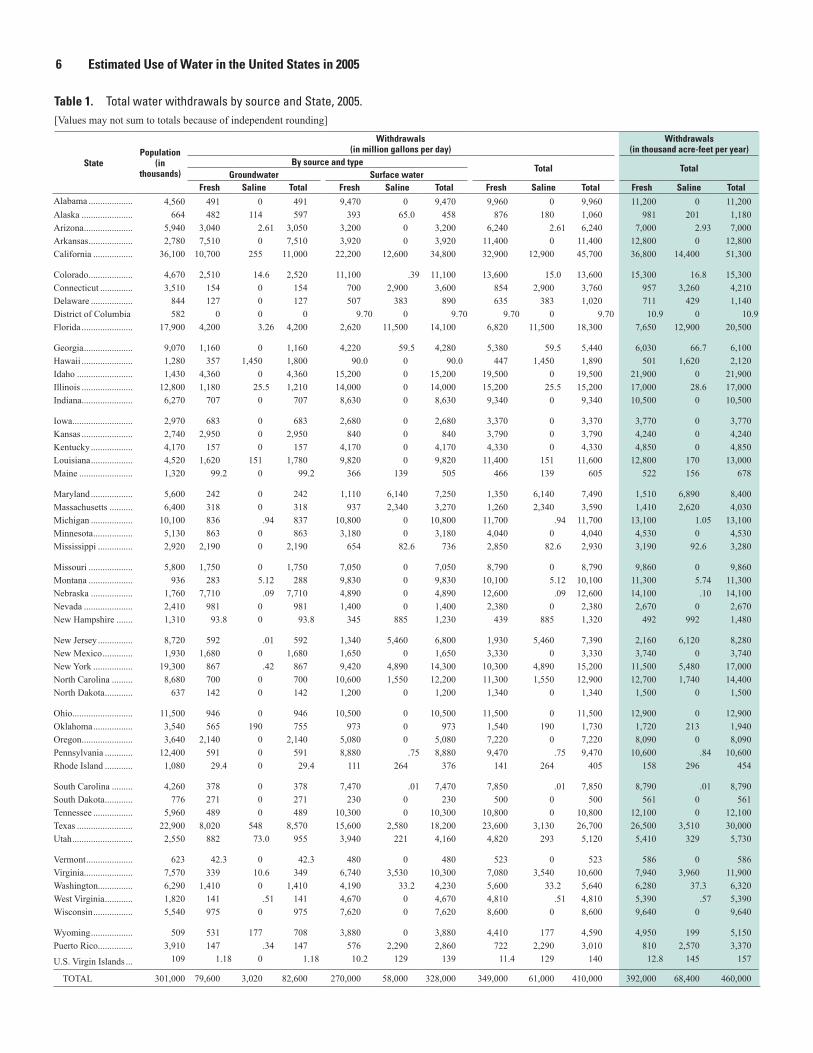
Total State populations and withdrawals by source for 2005 are listed in table 1. Total freshwater and saline-water withdrawals were estimated to be 410,000 Mgal/d, or 460,000 thousand acre-feet per year. Freshwater withdrawals of 349,000 Mgal/d made up 85 percent of the total, and the remaining 61,000 Mgal/d (15 percent) were saline water. Most saline-water withdrawals were seawater and brackish coastal water used to cool thermoelectric power plants. Total surface-water withdrawals were estimated to be 328,000 Mgal/d, or 80 percent of the total. About 82 percent of surface water withdrawn was freshwater. Total ground-water withdrawals were estimated to be 82,600 Mgal/d, of which 96 percent was freshwater.
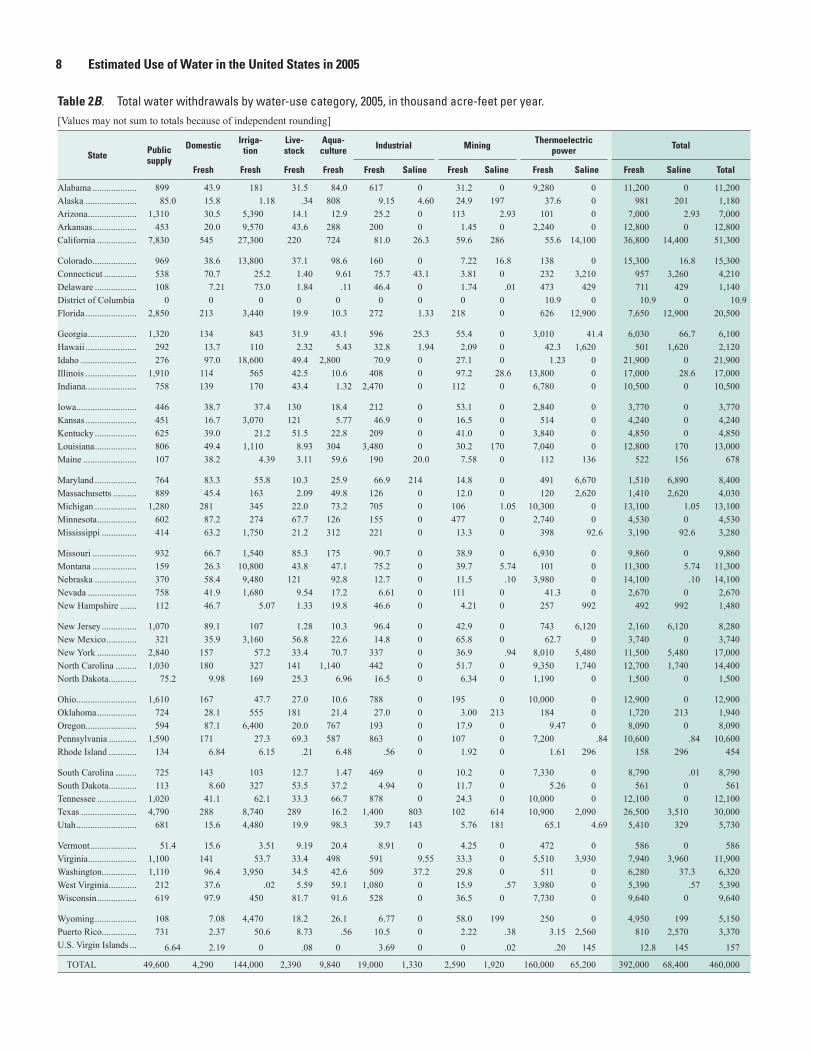
Total withdrawals by category and State are listed in table 2A in million gallons per day and in table 2B in thousand acre-feet per year. In 2005, nearly one-half the total with drawals (201,000 Mgal/d) were for thermoelectric-power generation. Withdrawals for thermoelectric-power generation represented 41 percent of all freshwater, 61 percent of all surface water, and 95 percent of all saline-water withdrawals in 2005. Withdrawals for irrigation of crops and other lands totaled 128,000 Mgal/d and were the second-largest category of water use. Irrigation withdrawals represented 31 percent of all water withdrawals, and 37 percent of all freshwater withdrawals.
More than one-fourth of the total water used in the United States in 2005 was withdrawn in California, Texas, Idaho, and Florida. California accounted for 11 percent of all withdrawals in the United States in 2005. Nearly three-fourths of the freshwater withdrawn in California was for irrigation, and 98 percent of saline water withdrawn was for thermo electric-power generation. Withdrawals in Texas accounted for about 7 percent of the national total and were primarily for thermoelectric power and irrigation. Thermo electric power accounted for 41 percent of fresh-water withdrawals and 60 percent of saline withdrawals in Texas. Irrigation accounted for 33 percent of the freshwater withdrawals in Texas in 2005. Water withdrawals in Idaho
were primarily for irrigation (85 percent) and aquaculture (13 percent). Almost two-thirds of the total withdrawals in Florida were saline water for thermoelectric power. Of Florida’s freshwater withdrawals, 45 percent were for irrigation and 37 percent were for public supply.
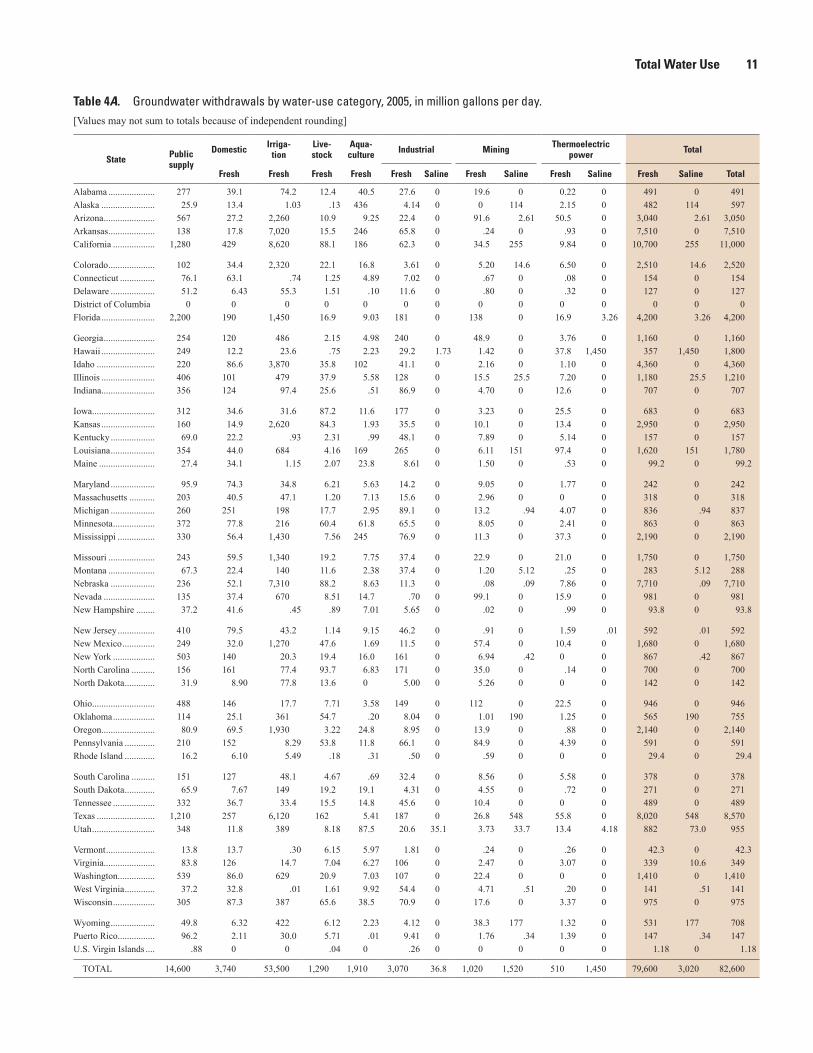
Water withdrawals by category and State are listed for surface water in tables 3A and B and for groundwater in tables 4A and B. In 2005, more surface water than ground-water was withdrawn for all categories except self-supplied domestic, livestock, and mining. Of the 270,000 Mgal/d fresh surface-water withdrawals, more than one-half were for thermoelectric power, and more than one-fourth were for irrigation. The largest surface-water withdrawals were in California, where irrigation was the largest use of fresh surface water. Large quantities of fresh surface water were withdrawn in 2005 for thermoelectric power in Illinois, Texas, and Michigan. The largest saline surface-water withdrawals were for thermoelectric-power generation in California and Florida.
Nearly two-thirds of the fresh groundwater withdrawals in 2005 were for irrigation, and more than one-half of the groundwater for irrigation was withdrawn in just four States: California, Nebraska, Arkansas, and Texas. Irrigation was the largest use of fresh groundwater in 25 States. Nationwide, groundwater withdrawals for irrigation were about 3.5 times larger than groundwater withdrawals for public supply. More than 96 percent of all groundwater withdrawals in 2005 were freshwater. The largest withdrawals of saline groundwater occurred in Hawaii for thermoelectric-power generation and in Texas for mining.
The geographic distribution of total, surface-water, and groundwater withdrawals is shown in figure 2. The geographic distribution of freshwater and saline-water withdrawals by State is shown in figure 3.
The total withdrawals for a State are, in part, a function of the size of the State—for example, a large State would have more irrigable land area and larger irrigation withdrawals than a small State if other factors such as climate, soils, and available water supply are the same. Figure 4 shows intensity of freshwater withdrawals by State in gallons per day per square mile, adjusting for the land area of the State. Some smaller and medium-sized States in the Eastern United States had a greater intensity of freshwater withdrawals than some Western and Southern States with the largest withdrawals, such as California, Texas, Colorado, and Nebraska. In Idaho, both freshwater withdrawals and intensity were high.

Figure 1. Total water withdrawals by category, 2005.
Public supply, 11 percent
Irrigation, 31 percent
Aquaculture, 2 percent
Mining, 1 percent
Dairy cows, central Maryland
Kitchen faucet
Microirrigation in an orchard, California
Catfish ready for harvest
Livestock, less than 1 percent
Domestic, 1 percent
Industrial, 4 percent
Thermoelectric power, 49 percent
Chemical manufacturing plant
Water tower, DeKalb County, Georgia
Nan
cy L
. Bar
ber,
USGS
Nan
cy L
. Bar
ber,
USGS
Nan
cy L
. Bar
ber,
USGS
Dragline bucket in kaolin mine, Wilkinson County, Georgia
USDA
NRC
S
Base of cooling tower, Bartow County, Georgia
Used
with
per
mis
sion
Total Water Use 5
Tim
McC
abe,
USD
A N
RCS
Pegg
y Gr
eb, U
SDA
ARS
Nan
cy L
. Bar
ber,
USGS
6 Estimated Use of Water in the United States in 2005
Table 1. Total water withdrawals by source and State, 2005. [Values may not sum to totals because of independent rounding]
StatePopulation
(in thousands)
Withdrawals (in million gallons per day)
Withdrawals (in thousand acre-feet per year)
By source and typeTotal Total
Groundwater Surface waterFresh Saline Total Fresh Saline Total Fresh Saline Total Fresh Saline Total
Alabama ................... 4,560 491 0 491 9,470 0 9,470 9,960 0 9,960 11,200 0 11,200Alaska ...................... 664 482 114 597 393 65.0 458 876 180 1,060 981 201 1,180Arizona ..................... 5,940 3,040 2.61 3,050 3,200 0 3,200 6,240 2.61 6,240 7,000 2.93 7,000Arkansas ................... 2,780 7,510 0 7,510 3,920 0 3,920 11,400 0 11,400 12,800 0 12,800California ................. 36,100 10,700 255 11,000 22,200 12,600 34,800 32,900 12,900 45,700 36,800 14,400 51,300
Colorado ................... 4,670 2,510 14.6 2,520 11,100 .39 11,100 13,600 15.0 13,600 15,300 16.8 15,300Connecticut .............. 3,510 154 0 154 700 2,900 3,600 854 2,900 3,760 957 3,260 4,210Delaware .................. 844 127 0 127 507 383 890 635 383 1,020 711 429 1,140District of Columbia 582 0 0 0 9.70 0 9.70 9.70 0 9.70 10.9 0 10.9Florida ...................... 17,900 4,200 3.26 4,200 2,620 11,500 14,100 6,820 11,500 18,300 7,650 12,900 20,500
Georgia ..................... 9,070 1,160 0 1,160 4,220 59.5 4,280 5,380 59.5 5,440 6,030 66.7 6,100Hawaii ...................... 1,280 357 1,450 1,800 90.0 0 90.0 447 1,450 1,890 501 1,620 2,120Idaho ........................ 1,430 4,360 0 4,360 15,200 0 15,200 19,500 0 19,500 21,900 0 21,900Illinois ...................... 12,800 1,180 25.5 1,210 14,000 0 14,000 15,200 25.5 15,200 17,000 28.6 17,000Indiana ...................... 6,270 707 0 707 8,630 0 8,630 9,340 0 9,340 10,500 0 10,500
Iowa .......................... 2,970 683 0 683 2,680 0 2,680 3,370 0 3,370 3,770 0 3,770Kansas ...................... 2,740 2,950 0 2,950 840 0 840 3,790 0 3,790 4,240 0 4,240Kentucky .................. 4,170 157 0 157 4,170 0 4,170 4,330 0 4,330 4,850 0 4,850Louisiana .................. 4,520 1,620 151 1,780 9,820 0 9,820 11,400 151 11,600 12,800 170 13,000Maine ....................... 1,320 99.2 0 99.2 366 139 505 466 139 605 522 156 678
Maryland .................. 5,600 242 0 242 1,110 6,140 7,250 1,350 6,140 7,490 1,510 6,890 8,400Massachusetts .......... 6,400 318 0 318 937 2,340 3,270 1,260 2,340 3,590 1,410 2,620 4,030Michigan .................. 10,100 836 .94 837 10,800 0 10,800 11,700 .94 11,700 13,100 1.05 13,100Minnesota ................. 5,130 863 0 863 3,180 0 3,180 4,040 0 4,040 4,530 0 4,530Mississippi ............... 2,920 2,190 0 2,190 654 82.6 736 2,850 82.6 2,930 3,190 92.6 3,280
Missouri ................... 5,800 1,750 0 1,750 7,050 0 7,050 8,790 0 8,790 9,860 0 9,860Montana ................... 936 283 5.12 288 9,830 0 9,830 10,100 5.12 10,100 11,300 5.74 11,300Nebraska .................. 1,760 7,710 .09 7,710 4,890 0 4,890 12,600 .09 12,600 14,100 .10 14,100Nevada ..................... 2,410 981 0 981 1,400 0 1,400 2,380 0 2,380 2,670 0 2,670New Hampshire ....... 1,310 93.8 0 93.8 345 885 1,230 439 885 1,320 492 992 1,480
New Jersey ............... 8,720 592 .01 592 1,340 5,460 6,800 1,930 5,460 7,390 2,160 6,120 8,280New Mexico ............. 1,930 1,680 0 1,680 1,650 0 1,650 3,330 0 3,330 3,740 0 3,740New York ................. 19,300 867 .42 867 9,420 4,890 14,300 10,300 4,890 15,200 11,500 5,480 17,000North Carolina ......... 8,680 700 0 700 10,600 1,550 12,200 11,300 1,550 12,900 12,700 1,740 14,400North Dakota ............ 637 142 0 142 1,200 0 1,200 1,340 0 1,340 1,500 0 1,500
Ohio.......................... 11,500 946 0 946 10,500 0 10,500 11,500 0 11,500 12,900 0 12,900Oklahoma ................. 3,540 565 190 755 973 0 973 1,540 190 1,730 1,720 213 1,940Oregon ...................... 3,640 2,140 0 2,140 5,080 0 5,080 7,220 0 7,220 8,090 0 8,090Pennsylvania ............ 12,400 591 0 591 8,880 .75 8,880 9,470 .75 9,470 10,600 .84 10,600Rhode Island ............ 1,080 29.4 0 29.4 111 264 376 141 264 405 158 296 454
South Carolina ......... 4,260 378 0 378 7,470 .01 7,470 7,850 .01 7,850 8,790 .01 8,790South Dakota ............ 776 271 0 271 230 0 230 500 0 500 561 0 561Tennessee ................. 5,960 489 0 489 10,300 0 10,300 10,800 0 10,800 12,100 0 12,100Texas ........................ 22,900 8,020 548 8,570 15,600 2,580 18,200 23,600 3,130 26,700 26,500 3,510 30,000Utah .......................... 2,550 882 73.0 955 3,940 221 4,160 4,820 293 5,120 5,410 329 5,730
Vermont .................... 623 42.3 0 42.3 480 0 480 523 0 523 586 0 586Virginia..................... 7,570 339 10.6 349 6,740 3,530 10,300 7,080 3,540 10,600 7,940 3,960 11,900Washington............... 6,290 1,410 0 1,410 4,190 33.2 4,230 5,600 33.2 5,640 6,280 37.3 6,320West Virginia ............ 1,820 141 .51 141 4,670 0 4,670 4,810 .51 4,810 5,390 .57 5,390Wisconsin ................. 5,540 975 0 975 7,620 0 7,620 8,600 0 8,600 9,640 0 9,640
Wyoming .................. 509 531 177 708 3,880 0 3,880 4,410 177 4,590 4,950 199 5,150Puerto Rico ............... 3,910 147 .34 147 576 2,290 2,860 722 2,290 3,010 810 2,570 3,370
U.S. Virgin Islands ... 109 1.18 0 1.18 10.2 129 139 11.4 129 140 12.8 145 157
TOTAL 301,000 79,600 3,020 82,600 270,000 58,000 328,000 349,000 61,000 410,000 392,000 68,400 460,000

Total Water Use 7
Table 2A. Total water withdrawals by water-use category, 2005, in million gallons per day. [Values may not sum to totals because of independent rounding]
State Public supply
Domestic Irriga- tion
Live-stock
Aqua- culture Industrial Mining Thermoelectric
power Total
Fresh Fresh Fresh Fresh Fresh Saline Fresh Saline Fresh Saline Fresh Saline Total
Alabama ................... 802 39.1 161 28.1 74.9 550 0 27.8 0 8,270 0 9,960 0 9,960Alaska ...................... 75.8 14.1 1.05 .30 720 8.16 4.10 22.2 175 33.6 0 876 180 1,060Arizona ..................... 1,170 27.2 4,810 12.6 11.5 22.4 0 101 2.61 89.9 0 6,240 2.61 6,240Arkansas ................... 404 17.8 8,530 38.8 256 178 0 1.29 0 2,000 0 11,400 0 11,400California ................. 6,990 486 24,400 197 646 72.2 23.4 53.1 255 49.6 12,600 32,900 12,900 45,700
Colorado ................... 864 34.4 12,300 33.1 88.0 142 0 6.44 15.0 123 0 13,600 15.0 13,600Connecticut .............. 480 63.1 22.5 1.25 8.57 67.6 38.5 3.40 0 207 2,870 854 2,900 3,760Delaware .................. 96.2 6.43 65.1 1.64 .10 41.4 0 1.55 .01 422 383 635 383 1,020District of Columbia 0 0 0 0 0 0 0 0 0 9.70 0 9.70 0 9.70Florida ...................... 2,540 190 3,070 17.8 9.19 243 1.19 195 0 558 11,500 6,820 11,500 18,300
Georgia ..................... 1,180 120 752 28.4 38.4 532 22.6 49.4 0 2,680 36.9 5,380 59.5 5,440Hawaii ...................... 261 12.2 97.8 2.07 4.84 29.2 1.73 1.86 0 37.8 1,450 447 1,450 1,890Idaho ........................ 246 86.6 16,600 44.1 2,490 63.2 0 24.2 0 1.10 0 19,500 0 19,500Illinois ...................... 1,700 101 504 37.9 9.44 364 0 86.7 25.5 12,400 0 15,200 25.5 15,200Indiana ...................... 676 124 151 38.7 1.18 2,200 0 100 0 6,050 0 9,340 0 9,340
Iowa .......................... 398 34.6 33.3 116 16.4 190 0 47.4 0 2,530 0 3,370 0 3,370Kansas ...................... 403 14.9 2,740 108 5.15 41.9 0 14.8 0 459 0 3,790 0 3,790Kentucky .................. 558 34.8 18.9 45.9 20.4 186 0 36.6 0 3,430 0 4,330 0 4,330Louisiana .................. 719 44.0 992 7.97 271 3,110 0 26.9 151 6,280 0 11,400 151 11,600Maine ....................... 95.9 34.1 3.92 2.77 53.1 170 17.8 6.76 0 99.5 121 466 139 605
Maryland .................. 681 74.3 49.8 9.16 23.1 59.7 191 13.2 0 438 5,950 1,350 6,140 7,490Massachusetts .......... 793 40.5 145 1.86 44.4 112 0 10.7 0 107 2,340 1,260 2,340 3,590Michigan .................. 1,140 251 308 19.6 65.3 629 0 94.6 .94 9,150 0 11,700 .94 11,700Minnesota ................. 537 77.8 244 60.4 113 139 0 426 0 2,450 0 4,040 0 4,040Mississippi ............... 369 56.4 1,560 18.9 279 197 0 11.9 0 355 82.6 2,850 82.6 2,930
Missouri ................... 831 59.5 1,370 76.1 156 80.9 0 34.7 0 6,180 0 8,790 0 8,790Montana ................... 142 23.5 9,670 39.0 42.0 67.0 0 35.4 5.12 89.9 0 10,100 5.12 10,100Nebraska .................. 330 52.1 8,460 108 82.7 11.3 0 10.3 .09 3,550 0 12,600 .09 12,600Nevada ..................... 676 37.4 1,500 8.51 15.3 5.90 0 99.1 0 36.8 0 2,380 0 2,380New Hampshire ....... 99.8 41.6 4.52 1.19 17.7 41.5 0 3.76 0 229 885 439 885 1,320
New Jersey ............... 958 79.5 95.1 1.14 9.15 86.0 0 38.3 0 663 5,460 1,930 5,460 7,390New Mexico ............. 286 32.0 2,810 50.7 20.2 13.2 0 58.7 0 55.9 0 3,330 0 3,330New York ................. 2,530 140 51.1 29.8 63.1 301 0 32.9 .84 7,140 4,880 10,300 4,890 15,200North Carolina ......... 921 161 292 126 1,020 394 0 46.1 0 8,350 1,550 11,300 1,550 12,900North Dakota ............ 67.1 8.90 151 22.6 6.21 14.7 0 5.66 0 1,060 0 1,340 0 1,340
Ohio.......................... 1,430 149 42.6 24.1 9.47 703 0 174 0 8,930 0 11,500 0 11,500Oklahoma ................. 646 25.1 495 162 19.1 24.1 0 2.68 190 164 0 1,540 190 1,730Oregon ...................... 530 77.7 5,710 17.8 685 172 0 16.0 0 8.45 0 7,220 0 7,220Pennsylvania ............ 1,420 152 24.3 61.8 524 770 0 95.7 0 6,430 .75 9,470 .75 9,470Rhode Island ............ 120 6.10 5.49 .19 5.78 .50 0 1.71 0 1.44 264 141 264 405
South Carolina ......... 647 127 91.6 11.3 1.31 419 0 9.06 0 6,540 0 7,850 .01 7,850South Dakota ............ 100 7.67 292 47.7 33.2 4.41 0 10.5 0 4.69 0 500 0 500Tennessee ................. 914 36.7 55.4 29.7 59.5 783 0 21.7 0 8,940 0 10,800 0 10,800Texas ........................ 4,270 257 7,800 258 14.5 1,250 716 91.0 548 9,680 1,860 23,600 3,130 26,700Utah .......................... 607 13.9 4,000 17.8 87.7 35.4 127 5.14 162 58.0 4.18 4,820 293 5,120
Vermont .................... 45.9 13.9 3.13 8.20 18.2 7.95 0 3.79 0 421 0 523 0 523Virginia..................... 982 126 47.9 29.8 444 527 8.52 29.8 0 4,920 3,510 7,080 3,540 10,600Washington............... 990 86.0 3,520 30.7 38.0 454 33.2 26.6 0 456 0 5,600 33.2 5,640West Virginia ............ 189 33.5 .02 4.99 52.7 966 0 14.2 .51 3,550 0 4,810 .51 4,810Wisconsin ................. 552 87.3 402 72.8 81.7 471 0 32.5 0 6,900 0 8,600 0 8,600
Wyoming .................. 96.3 6.32 3,990 16.2 23.3 6.04 0 51.8 177 223 0 4,410 177 4,590Puerto Rico ............... 652 2.11 45.2 7.79 .50 9.41 0 1.98 .34 2.81 2,290 722 2,290 3,010U.S. Virgin Islands ... 5.92 1.95 0 .07 0 3.29 0 0 .02 .18 129 11.4 129 140
TOTAL 44,200 3,830 128,000 2,140 8,780 17,000 1,190 2,310 1,710 143,000 58,100 349,000 61,000 410,000
8 Estimated Use of Water in the United States in 2005
Table 2B. Total water withdrawals by water-use category, 2005, in thousand acre-feet per year. [Values may not sum to totals because of independent rounding]
State Public supply
Domestic Irriga- tion
Live- stock
Aqua- culture Industrial Mining Thermoelectric
power Total
Fresh Fresh Fresh Fresh Fresh Saline Fresh Saline Fresh Saline Fresh Saline Total
Alabama ................... 899 43.9 181 31.5 84.0 617 0 31.2 0 9,280 0 11,200 0 11,200Alaska ...................... 85.0 15.8 1.18 .34 808 9.15 4.60 24.9 197 37.6 0 981 201 1,180Arizona ..................... 1,310 30.5 5,390 14.1 12.9 25.2 0 113 2.93 101 0 7,000 2.93 7,000Arkansas ................... 453 20.0 9,570 43.6 288 200 0 1.45 0 2,240 0 12,800 0 12,800California ................. 7,830 545 27,300 220 724 81.0 26.3 59.6 286 55.6 14,100 36,800 14,400 51,300
Colorado ................... 969 38.6 13,800 37.1 98.6 160 0 7.22 16.8 138 0 15,300 16.8 15,300Connecticut .............. 538 70.7 25.2 1.40 9.61 75.7 43.1 3.81 0 232 3,210 957 3,260 4,210Delaware .................. 108 7.21 73.0 1.84 .11 46.4 0 1.74 .01 473 429 711 429 1,140District of Columbia 0 0 0 0 0 0 0 0 0 10.9 0 10.9 0 10.9Florida ...................... 2,850 213 3,440 19.9 10.3 272 1.33 218 0 626 12,900 7,650 12,900 20,500
Georgia ..................... 1,320 134 843 31.9 43.1 596 25.3 55.4 0 3,010 41.4 6,030 66.7 6,100Hawaii ...................... 292 13.7 110 2.32 5.43 32.8 1.94 2.09 0 42.3 1,620 501 1,620 2,120Idaho ........................ 276 97.0 18,600 49.4 2,800 70.9 0 27.1 0 1.23 0 21,900 0 21,900Illinois ...................... 1,910 114 565 42.5 10.6 408 0 97.2 28.6 13,800 0 17,000 28.6 17,000Indiana ...................... 758 139 170 43.4 1.32 2,470 0 112 0 6,780 0 10,500 0 10,500
Iowa .......................... 446 38.7 37.4 130 18.4 212 0 53.1 0 2,840 0 3,770 0 3,770Kansas ...................... 451 16.7 3,070 121 5.77 46.9 0 16.5 0 514 0 4,240 0 4,240Kentucky .................. 625 39.0 21.2 51.5 22.8 209 0 41.0 0 3,840 0 4,850 0 4,850Louisiana .................. 806 49.4 1,110 8.93 304 3,480 0 30.2 170 7,040 0 12,800 170 13,000Maine ....................... 107 38.2 4.39 3.11 59.6 190 20.0 7.58 0 112 136 522 156 678
Maryland .................. 764 83.3 55.8 10.3 25.9 66.9 214 14.8 0 491 6,670 1,510 6,890 8,400Massachusetts .......... 889 45.4 163 2.09 49.8 126 0 12.0 0 120 2,620 1,410 2,620 4,030Michigan .................. 1,280 281 345 22.0 73.2 705 0 106 1.05 10,300 0 13,100 1.05 13,100Minnesota ................. 602 87.2 274 67.7 126 155 0 477 0 2,740 0 4,530 0 4,530Mississippi ............... 414 63.2 1,750 21.2 312 221 0 13.3 0 398 92.6 3,190 92.6 3,280
Missouri ................... 932 66.7 1,540 85.3 175 90.7 0 38.9 0 6,930 0 9,860 0 9,860Montana ................... 159 26.3 10,800 43.8 47.1 75.2 0 39.7 5.74 101 0 11,300 5.74 11,300Nebraska .................. 370 58.4 9,480 121 92.8 12.7 0 11.5 .10 3,980 0 14,100 .10 14,100Nevada ..................... 758 41.9 1,680 9.54 17.2 6.61 0 111 0 41.3 0 2,670 0 2,670New Hampshire ....... 112 46.7 5.07 1.33 19.8 46.6 0 4.21 0 257 992 492 992 1,480
New Jersey ............... 1,070 89.1 107 1.28 10.3 96.4 0 42.9 0 743 6,120 2,160 6,120 8,280New Mexico ............. 321 35.9 3,160 56.8 22.6 14.8 0 65.8 0 62.7 0 3,740 0 3,740New York ................. 2,840 157 57.2 33.4 70.7 337 0 36.9 .94 8,010 5,480 11,500 5,480 17,000North Carolina ......... 1,030 180 327 141 1,140 442 0 51.7 0 9,350 1,740 12,700 1,740 14,400North Dakota ............ 75.2 9.98 169 25.3 6.96 16.5 0 6.34 0 1,190 0 1,500 0 1,500
Ohio.......................... 1,610 167 47.7 27.0 10.6 788 0 195 0 10,000 0 12,900 0 12,900Oklahoma ................. 724 28.1 555 181 21.4 27.0 0 3.00 213 184 0 1,720 213 1,940Oregon ...................... 594 87.1 6,400 20.0 767 193 0 17.9 0 9.47 0 8,090 0 8,090Pennsylvania ............ 1,590 171 27.3 69.3 587 863 0 107 0 7,200 .84 10,600 .84 10,600Rhode Island ............ 134 6.84 6.15 .21 6.48 .56 0 1.92 0 1.61 296 158 296 454
South Carolina ......... 725 143 103 12.7 1.47 469 0 10.2 0 7,330 0 8,790 .01 8,790South Dakota ............ 113 8.60 327 53.5 37.2 4.94 0 11.7 0 5.26 0 561 0 561Tennessee ................. 1,020 41.1 62.1 33.3 66.7 878 0 24.3 0 10,000 0 12,100 0 12,100Texas ........................ 4,790 288 8,740 289 16.2 1,400 803 102 614 10,900 2,090 26,500 3,510 30,000Utah .......................... 681 15.6 4,480 19.9 98.3 39.7 143 5.76 181 65.1 4.69 5,410 329 5,730
Vermont .................... 51.4 15.6 3.51 9.19 20.4 8.91 0 4.25 0 472 0 586 0 586Virginia..................... 1,100 141 53.7 33.4 498 591 9.55 33.3 0 5,510 3,930 7,940 3,960 11,900Washington............... 1,110 96.4 3,950 34.5 42.6 509 37.2 29.8 0 511 0 6,280 37.3 6,320West Virginia ............ 212 37.6 .02 5.59 59.1 1,080 0 15.9 .57 3,980 0 5,390 .57 5,390Wisconsin ................. 619 97.9 450 81.7 91.6 528 0 36.5 0 7,730 0 9,640 0 9,640
Wyoming .................. 108 7.08 4,470 18.2 26.1 6.77 0 58.0 199 250 0 4,950 199 5,150Puerto Rico ............... 731 2.37 50.6 8.73 .56 10.5 0 2.22 .38 3.15 2,560 810 2,570 3,370U.S. Virgin Islands ... 6.64 2.19 0 .08 0 3.69 0 0 .02 .20 145 12.8 145 157
TOTAL 49,600 4,290 144,000 2,390 9,840 19,000 1,330 2,590 1,920 160,000 65,200 392,000 68,400 460,000

Total Water Use 9
Table 3A. Surface-water withdrawals by water-use category, 2005, in million gallons per day. [Values may not sum to totals because of independent rounding]
State Public supply
Domestic Irriga- tion
Live- stock
Aqua- culture Industrial Mining Thermoelectric
power Total
Fresh Fresh Fresh Fresh Fresh Saline Fresh Saline Fresh Saline Fresh Saline Total
Alabama .................. 524 0 87.0 15.7 34.4 523 0 8.26 0 8,270 0 9,470 0 9,470Alaska ..................... 49.9 .68 .02 .17 285 4.02 4.10 22.2 60.9 31.4 0 393 65.0 458Arizona .................... 602 0 2,540 1.67 2.25 0 0 9.05 0 39.4 0 3,200 0 3,200Arkansas .................. 266 0 1,510 23.3 10.6 113 0 1.05 0 2,000 0 3,920 0 3,920California ................ 5,710 57.2 15,700 109 459 9.90 23.4 18.6 .29 39.7 12,600 22,200 12,600 34,800
Colorado .................. 762 0 10,000 11.0 71.2 139 0 1.24 .39 117 0 11,100 .39 11,100Connecticut ............. 404 0 21.8 0 3.68 60.6 38.5 2.73 0 207 2,870 700 2,900 3,600Delaware ................. 45.0 0 9.77 .13 0 29.7 0 .75 .01 422 383 507 383 890District of Columbia 0 0 0 0 0 0 0 0 0 9.70 0 9.70 0 9.70Florida ..................... 339 0 1,620 .90 .16 62.5 1.19 56.9 0 541 11,500 2,620 11,500 14,100
Georgia .................... 926 0 265 26.3 33.4 291 22.6 .47 0 2,680 36.9 4,220 59.5 4,280Hawaii ..................... 11.4 0 74.2 1.32 2.61 0 0 .44 0 0 0 90.0 0 90.0Idaho ....................... 26.7 0 12,700 8.34 2,390 22.1 0 22.0 0 0 0 15,200 0 15,200Illinois ..................... 1,300 0 24.5 0 3.86 236 0 71.2 0 12,300 0 14,000 0 14,000Indiana ..................... 320 0 54.0 13.1 .67 2,110 0 95.5 0 6,040 0 8,630 0 8,630
Iowa ......................... 86.0 0 1.69 28.9 4.84 12.3 0 44.2 0 2,510 0 2,680 0 2,680Kansas ..................... 242 0 114 23.8 3.22 6.34 0 4.64 0 445 0 840 0 840Kentucky ................. 489 12.6 18.0 43.6 19.4 138 0 28.7 0 3,420 0 4,170 0 4,170Louisiana ................. 365 0 308 3.81 102 2,840 0 20.8 0 6,180 0 9,820 0 9,820Maine ...................... 68.5 0 2.77 .70 29.3 161 17.8 5.26 0 99.0 121 366 139 505
Maryland ................. 585 0 15.0 2.95 17.5 45.5 191 4.17 0 436 5,950 1,110 6,140 7,250Massachusetts ......... 590 0 98.0 .66 37.3 96.7 0 7.77 0 107 2,340 937 2,340 3,270Michigan ................. 883 0 110 1.89 62.4 540 0 81.4 0 9,140 0 10,800 0 10,800Minnesota ................ 165 0 28.4 0 50.8 73.0 0 418 0 2,440 0 3,180 0 3,180Mississippi .............. 39.5 0 131 11.3 33.7 120 0 .61 0 317 82.6 654 82.6 736
Missouri .................. 588 0 38.9 56.8 148 43.6 0 11.8 0 6,160 0 7,050 0 7,050Montana .................. 74.8 1.06 9,530 27.4 39.6 29.6 0 34.2 0 89.6 0 9,830 0 9,830Nebraska ................. 94.2 0 1,150 20.1 74.1 .01 0 10.2 0 3,540 0 4,890 0 4,890Nevada .................... 541 0 828 0 .67 5.20 0 0 0 21.0 0 1,400 0 1,400New Hampshire ...... 62.6 .09 4.07 .30 10.7 35.9 0 3.74 0 228 885 345 885 1,230
New Jersey .............. 548 0 51.9 0 0 39.8 0 37.4 0 662 5,460 1,340 5,460 6,800New Mexico ............ 37.3 0 1,550 3.05 18.5 1.72 0 1.29 0 45.5 0 1,650 0 1,650New York ................ 2,030 0 30.8 10.4 47.1 140 0 25.9 .42 7,140 4,880 9,420 4,890 14,300North Carolina ........ 765 0 214 32.3 1,010 223 0 11.0 0 8,340 1,550 10,600 1,550 12,200North Dakota ........... 35.2 0 73.0 9.01 6.21 9.70 0 .40 0 1,060 0 1,200 0 1,200
Ohio......................... 947 3.00 24.9 16.4 5.89 554 0 61.7 0 8,910 0 10,500 0 10,500Oklahoma ................ 532 0 134 107 18.9 16.0 0 1.67 0 163 0 973 0 973Oregon ..................... 449 8.22 3,780 14.6 660 164 0 2.09 0 7.57 0 5,080 0 5,080Pennsylvania ........... 1,210 0 16.0 7.97 512 704 0 10.8 0 6,420 .75 8,880 .75 8,880Rhode Island ........... 103 0 0 .01 5.47 0 0 1.12 0 1.44 264 111 264 376
South Carolina ........ 496 0 43.4 6.65 .62 386 0 .50 0 6,530 0 7,470 .01 7,470South Dakota ........... 34.6 0 143 28.5 14.0 .10 0 5.93 0 3.97 0 230 0 230Tennessee ................ 581 0 22.0 14.2 44.7 738 0 11.4 0 8,940 0 10,300 0 10,300Texas ....................... 3,070 0 1,680 95.9 9.06 1,060 716 64.2 0 9,620 1,860 15,600 2,580 18,200Utah ......................... 259 2.11 3,610 9.59 .18 14.7 92.4 1.41 128 44.6 0 3,940 221 4,160
Vermont ................... 32.0 .17 2.83 2.05 12.2 6.14 0 3.55 0 421 0 480 0 480Virginia.................... 898 0 33.2 22.8 438 421 8.52 27.3 0 4,910 3,510 6,740 3,530 10,300Washington.............. 451 .02 2,890 9.82 31.0 346 33.2 4.14 0 456 0 4,190 33.2 4,230West Virginia ........... 152 .66 .01 3.38 42.8 911 0 9.44 0 3,550 0 4,670 0 4,670Wisconsin ................ 247 0 15.2 7.27 43.2 400 0 14.9 0 6,890 0 7,620 0 7,620
Wyoming ................. 46.5 0 3,570 10.1 21.1 1.92 0 13.5 0 221 0 3,880 0 3,880Puerto Rico .............. 556 0 15.2 2.08 .49 0 0 .22 0 1.42 2,290 576 2,290 2,860U.S. Virgin Islands .. 5.04 1.95 0 .03 0 3.03 0 0 .02 .18 129 10.2 129 139
TOTAL 29,600 87.7 74,900 846 6,870 13,900 1,150 1,300 190 142,000 56,700 270,000 58,000 328,000

10 Estimated Use of Water in the United States in 2005
Table 3B. Surface-water withdrawals by water-use category, 2005, in thousand acre-feet per year. [Values may not sum to totals because of independent rounding]
State Public supply
Domestic Irriga- tion
Live- stock
Aqua- culture Industrial Mining Thermoelectric
power Total
Fresh Fresh Fresh Fresh Fresh Saline Fresh Saline Fresh Saline Fresh Saline Total
Alabama .................. 588 0 97.5 17.6 38.5 586 0 9.26 0 9,280 0 10,600 0 10,600Alaska ..................... 55.9 .76 .02 .19 319 4.51 4.60 24.9 68.3 35.2 0 441 72.9 514Arizona .................... 674 0 2,850 1.87 2.52 0 0 10.1 0 44.2 0 3,590 0 3,590Arkansas .................. 299 0 1,690 26.1 11.9 126 0 1.18 0 2,240 0 4,400 0 4,400California ................ 6,400 64.1 17,700 122 515 11.1 26.3 20.9 .33 44.5 14,100 24,800 14,100 39,000
Colorado .................. 855 0 11,200 12.3 79.8 156 0 1.39 .44 131 0 12,400 .44 12,400Connecticut ............. 453 0 24.4 0 4.13 67.9 43.1 3.06 0 232 3,210 785 3,260 4,040Delaware ................. 50.4 0 11.0 .15 0 33.3 0 .84 .01 473 429 569 429 998District of Columbia 0 0 0 0 0 0 0 0 0 10.9 0 10.9 0 10.9Florida ..................... 380 0 1,820 1.01 .18 70.0 1.33 63.8 0 607 12,900 2,940 12,900 15,800
Georgia .................... 1,040 0 297 29.5 37.5 327 25.3 .53 0 3,000 41.4 4,730 66.7 4,800Hawaii ..................... 12.8 0 83.2 1.48 2.93 0 0 .49 0 0 0 101 0 101Idaho ....................... 29.9 0 14,200 9.35 2,680 24.8 0 24.7 0 0 0 17,000 0 17,000Illinois ..................... 1,450 0 27.5 0 4.33 264 0 79.8 0 13,800 0 15,700 0 15,700Indiana ..................... 359 0 60.5 14.7 .75 2,370 0 107 0 6,770 0 9,680 0 9,680
Iowa ......................... 96.4 0 1.89 32.4 5.43 13.8 0 49.5 0 2,810 0 3,010 0 3,010Kansas ..................... 272 0 128 26.7 3.61 7.11 0 5.20 0 499 0 942 0 942Kentucky ................. 548 14.1 20.1 48.9 21.7 155 0 32.2 0 3,840 0 4,680 0 4,680Louisiana ................. 410 0 345 4.27 114 3,190 0 23.3 0 6,930 0 11,000 0 11,000Maine ...................... 76.8 0 3.11 .79 32.9 180 20.0 5.90 0 111 136 411 156 567
Maryland ................. 656 0 16.8 3.31 19.6 51.0 214 4.67 0 489 6,670 1,240 6,890 8,130Massachusetts ......... 661 0 110 .74 41.8 108 0 8.71 0 120 2,620 1,050 2,620 3,670Michigan ................. 989 0 124 2.12 69.9 605 0 91.2 0 10,300 0 12,100 0 12,100Minnesota ................ 185 0 31.8 0 57.0 81.9 0 468 0 2,740 0 3,560 0 3,560Mississippi .............. 44.2 0 147 12.7 37.8 135 0 .68 0 356 92.6 733 92.6 825
Missouri .................. 659 0 43.6 63.7 166 48.9 0 13.2 0 6,910 0 7,900 0 7,900Montana .................. 83.9 1.19 10,700 30.7 44.4 33.2 0 38.3 0 100 0 11,000 0 11,000Nebraska ................. 106 0 1,290 22.5 83.1 .01 0 11.4 0 3,970 0 5,480 0 5,480Nevada .................... 607 0 928 0 .75 5.83 0 0 0 23.5 0 1,570 0 1,570New Hampshire ...... 70.2 .10 4.56 .34 12.0 40.2 0 4.19 0 256 992 387 992 1,380
New Jersey .............. 614 0 58.2 0 0 44.6 0 41.9 0 742 6,120 1,500 6,120 7,620New Mexico ............ 41.8 0 1,730 3.42 20.7 1.93 0 1.45 0 51.0 0 1,860 0 1,860New York ................ 2,270 0 34.5 11.7 52.8 157 0 29.1 .47 8,010 5,480 10,600 5,480 16,000North Carolina ........ 858 0 240 36.2 1,130 250 0 12.4 0 9,350 1,740 11,900 1,740 13,600North Dakota ........... 39.4 0 81.8 10.1 6.96 10.9 0 .45 0 1,190 0 1,340 0 1,340
Ohio......................... 1,060 3.36 27.9 18.4 6.60 621 0 69.1 0 9,990 0 11,800 0 11,800Oklahoma ................ 597 0 150 120 21.2 18.0 0 1.87 0 183 0 1,090 0 1,090Oregon ..................... 504 9.21 4,230 16.3 740 183 0 2.34 0 8.49 0 5,700 0 5,700Pennsylvania ........... 1,350 0 18.0 8.93 574 789 0 12.2 0 7,200 .84 9,950 .84 9,960Rhode Island ........... 116 0 0 .01 6.13 0 0 1.26 0 1.61 296 125 296 421
South Carolina ........ 556 0 48.7 7.45 .70 433 0 .56 0 7,320 0 8,370 .01 8,370South Dakota ........... 38.8 0 160 31.9 15.8 .11 0 6.65 0 4.45 0 258 0 258Tennessee ................ 652 0 24.7 15.9 50.1 827 0 12.7 0 10,000 0 11,600 0 11,600Texas ....................... 3,440 0 1,890 108 10.2 1,190 803 71.9 0 10,800 2,090 17,500 2,890 20,400Utah ......................... 291 2.37 4,040 10.8 .20 16.5 104 1.58 144 50.1 0 4,420 247 4,660
Vermont ................... 35.9 .19 3.17 2.30 13.7 6.88 0 3.98 0 472 0 538 0 538Virginia.................... 1,010 0 37.2 25.5 491 472 9.55 30.6 0 5,510 3,930 7,560 3,950 11,500Washington.............. 505 .02 3,240 11.0 34.7 388 37.2 4.64 0 511 0 4,700 37.3 4,740West Virginia ........... 170 .74 .01 3.79 48.0 1,020 0 10.6 0 3,980 0 5,240 0 5,240Wisconsin ................ 277 0 17.1 8.15 48.5 448 0 16.7 0 7,730 0 8,540 0 8,540
Wyoming ................. 52.1 0 4,000 11.3 23.6 2.15 0 15.1 0 248 0 4,350 0 4,350Puerto Rico .............. 624 0 17.0 2.33 .55 0 0 .25 0 1.59 2,560 645 2,560 3,210U.S. Virgin Islands .. 5.65 2.19 0 .03 0 3.40 0 0 .02 .20 145 11.5 145 156
TOTAL 33,200 98.3 84,000 948 7,710 15,600 1,290 1,450 213 159,000 63,500 302,000 65,000 367,000
Total Water Use 11
Table 4A. Groundwater withdrawals by water-use category, 2005, in million gallons per day. [Values may not sum to totals because of independent rounding]
State Public supply
Domestic Irriga- tion
Live- stock
Aqua- culture Industrial Mining Thermoelectric
power Total
Fresh Fresh Fresh Fresh Fresh Saline Fresh Saline Fresh Saline Fresh Saline Total
Alabama .................... 277 39.1 74.2 12.4 40.5 27.6 0 19.6 0 0.22 0 491 0 491Alaska ....................... 25.9 13.4 1.03 .13 436 4.14 0 0 114 2.15 0 482 114 597Arizona ...................... 567 27.2 2,260 10.9 9.25 22.4 0 91.6 2.61 50.5 0 3,040 2.61 3,050Arkansas .................... 138 17.8 7,020 15.5 246 65.8 0 .24 0 .93 0 7,510 0 7,510California .................. 1,280 429 8,620 88.1 186 62.3 0 34.5 255 9.84 0 10,700 255 11,000
Colorado .................... 102 34.4 2,320 22.1 16.8 3.61 0 5.20 14.6 6.50 0 2,510 14.6 2,520Connecticut ............... 76.1 63.1 .74 1.25 4.89 7.02 0 .67 0 .08 0 154 0 154Delaware ................... 51.2 6.43 55.3 1.51 .10 11.6 0 .80 0 .32 0 127 0 127District of Columbia 0 0 0 0 0 0 0 0 0 0 0 0 0 0Florida ....................... 2,200 190 1,450 16.9 9.03 181 0 138 0 16.9 3.26 4,200 3.26 4,200
Georgia ...................... 254 120 486 2.15 4.98 240 0 48.9 0 3.76 0 1,160 0 1,160Hawaii ....................... 249 12.2 23.6 .75 2.23 29.2 1.73 1.42 0 37.8 1,450 357 1,450 1,800Idaho ......................... 220 86.6 3,870 35.8 102 41.1 0 2.16 0 1.10 0 4,360 0 4,360Illinois ....................... 406 101 479 37.9 5.58 128 0 15.5 25.5 7.20 0 1,180 25.5 1,210Indiana ....................... 356 124 97.4 25.6 .51 86.9 0 4.70 0 12.6 0 707 0 707
Iowa ........................... 312 34.6 31.6 87.2 11.6 177 0 3.23 0 25.5 0 683 0 683Kansas ....................... 160 14.9 2,620 84.3 1.93 35.5 0 10.1 0 13.4 0 2,950 0 2,950Kentucky ................... 69.0 22.2 .93 2.31 .99 48.1 0 7.89 0 5.14 0 157 0 157Louisiana ................... 354 44.0 684 4.16 169 265 0 6.11 151 97.4 0 1,620 151 1,780Maine ........................ 27.4 34.1 1.15 2.07 23.8 8.61 0 1.50 0 .53 0 99.2 0 99.2
Maryland ................... 95.9 74.3 34.8 6.21 5.63 14.2 0 9.05 0 1.77 0 242 0 242Massachusetts ........... 203 40.5 47.1 1.20 7.13 15.6 0 2.96 0 0 0 318 0 318Michigan ................... 260 251 198 17.7 2.95 89.1 0 13.2 .94 4.07 0 836 .94 837Minnesota .................. 372 77.8 216 60.4 61.8 65.5 0 8.05 0 2.41 0 863 0 863Mississippi ................ 330 56.4 1,430 7.56 245 76.9 0 11.3 0 37.3 0 2,190 0 2,190
Missouri .................... 243 59.5 1,340 19.2 7.75 37.4 0 22.9 0 21.0 0 1,750 0 1,750Montana .................... 67.3 22.4 140 11.6 2.38 37.4 0 1.20 5.12 .25 0 283 5.12 288Nebraska ................... 236 52.1 7,310 88.2 8.63 11.3 0 .08 .09 7.86 0 7,710 .09 7,710Nevada ...................... 135 37.4 670 8.51 14.7 .70 0 99.1 0 15.9 0 981 0 981New Hampshire ........ 37.2 41.6 .45 .89 7.01 5.65 0 .02 0 .99 0 93.8 0 93.8
New Jersey ................ 410 79.5 43.2 1.14 9.15 46.2 0 .91 0 1.59 .01 592 .01 592New Mexico .............. 249 32.0 1,270 47.6 1.69 11.5 0 57.4 0 10.4 0 1,680 0 1,680New York .................. 503 140 20.3 19.4 16.0 161 0 6.94 .42 0 0 867 .42 867North Carolina .......... 156 161 77.4 93.7 6.83 171 0 35.0 0 .14 0 700 0 700North Dakota ............. 31.9 8.90 77.8 13.6 0 5.00 0 5.26 0 0 0 142 0 142
Ohio........................... 488 146 17.7 7.71 3.58 149 0 112 0 22.5 0 946 0 946Oklahoma .................. 114 25.1 361 54.7 .20 8.04 0 1.01 190 1.25 0 565 190 755Oregon ....................... 80.9 69.5 1,930 3.22 24.8 8.95 0 13.9 0 .88 0 2,140 0 2,140Pennsylvania ............. 210 152 8.29 53.8 11.8 66.1 0 84.9 0 4.39 0 591 0 591Rhode Island ............. 16.2 6.10 5.49 .18 .31 .50 0 .59 0 0 0 29.4 0 29.4
South Carolina .......... 151 127 48.1 4.67 .69 32.4 0 8.56 0 5.58 0 378 0 378South Dakota ............. 65.9 7.67 149 19.2 19.1 4.31 0 4.55 0 .72 0 271 0 271Tennessee .................. 332 36.7 33.4 15.5 14.8 45.6 0 10.4 0 0 0 489 0 489Texas ......................... 1,210 257 6,120 162 5.41 187 0 26.8 548 55.8 0 8,020 548 8,570Utah ........................... 348 11.8 389 8.18 87.5 20.6 35.1 3.73 33.7 13.4 4.18 882 73.0 955
Vermont ..................... 13.8 13.7 .30 6.15 5.97 1.81 0 .24 0 .26 0 42.3 0 42.3Virginia...................... 83.8 126 14.7 7.04 6.27 106 0 2.47 0 3.07 0 339 10.6 349Washington................ 539 86.0 629 20.9 7.03 107 0 22.4 0 0 0 1,410 0 1,410West Virginia ............. 37.2 32.8 .01 1.61 9.92 54.4 0 4.71 .51 .20 0 141 .51 141Wisconsin .................. 305 87.3 387 65.6 38.5 70.9 0 17.6 0 3.37 0 975 0 975
Wyoming ................... 49.8 6.32 422 6.12 2.23 4.12 0 38.3 177 1.32 0 531 177 708Puerto Rico ................ 96.2 2.11 30.0 5.71 .01 9.41 0 1.76 .34 1.39 0 147 .34 147U.S. Virgin Islands .... .88 0 0 .04 0 .26 0 0 0 0 0 1.18 0 1.18
TOTAL 14,600 3,740 53,500 1,290 1,910 3,070 36.8 1,020 1,520 510 1,450 79,600 3,020 82,600

12 Estimated Use of Water in the United States in 2005 Total Water Use 12
Table 4B. Groundwater withdrawals by water-use category, 2005, in thousand acre-feet per year. [Values may not sum to totals because of independent rounding]
State Public supply
Domestic Irriga- tion
Live- stock
Aqua- culture Industrial Mining Thermoelectric
power Total
Fresh Fresh Fresh Fresh Fresh Saline Fresh Saline Fresh Saline Fresh Saline Total
Alabama .................... 311 43.9 83.2 13.9 45.4 31.0 0 21.9 0 0.25 0 550 0 550Alaska ....................... 29.0 15.0 1.15 .15 488 4.64 0 0 128 2.41 0 541 128 669Arizona ...................... 636 30.5 2,540 12.2 10.4 25.2 0 103 2.93 56.6 0 3,410 2.93 3,420Arkansas .................... 154 20.0 7,870 17.4 276 73.7 0 .27 0 1.04 0 8,420 0 8,420California .................. 1,430 480 9,660 98.8 209 69.9 0 38.7 285 11.0 0 12,000 285 12,300
Colorado .................... 114 38.6 2,600 24.8 18.9 4.05 0 5.83 16.4 7.29 0 2,810 16.4 2,830Connecticut ............... 85.3 70.7 .83 1.40 5.48 7.87 0 .75 0 .09 0 172 0 172Delaware ................... 57.4 7.21 62.0 1.69 .11 13.0 0 .90 0 .36 0 143 0 143District of Columbia 0 0 0 0 0 0 0 0 0 0 0 0 0 0Florida ....................... 2,470 213 1,620 18.9 10.1 202 0 154 0 19.0 3.65 4,710 3.65 4,710
Georgia ...................... 285 134 545 2.41 5.58 269 0 54.9 0 4.21 0 1,300 0 1,300Hawaii ....................... 280 13.7 26.5 .84 2.50 32.8 1.94 1.59 0 42.3 1,620 400 1,620 2,020Idaho ......................... 246 97.0 4,340 40.1 114 46.1 0 2.42 0 1.23 0 4,890 0 4,890Illinois ....................... 455 114 537 42.5 6.26 143 0 17.4 28.6 8.07 0 1,320 28.6 1,350Indiana ....................... 399 139 109 28.7 .57 97.4 0 5.27 0 14.2 0 793 0 793
Iowa ........................... 350 38.7 35.5 97.8 13.0 199 0 3.62 0 28.6 0 766 0 766Kansas ....................... 180 16.7 2,940 94.5 2.16 39.8 0 11.3 0 15.0 0 3,300 0 3,300Kentucky ................... 77.4 24.9 1.04 2.59 1.11 53.9 0 8.84 0 5.76 0 176 0 176Louisiana ................... 396 49.4 767 4.66 190 297 0 6.85 170 109 0 1,820 170 1,990Maine ........................ 30.7 38.2 1.29 2.32 26.7 9.65 0 1.68 0 .59 0 111 0 111
Maryland ................... 108 83.3 39.0 6.96 6.31 15.9 0 10.1 0 1.98 0 271 0 271Massachusetts ........... 228 45.4 52.8 1.35 7.99 17.5 0 3.32 0 0 0 356 0 356Michigan ................... 292 281 222 19.8 3.31 99.9 0 14.8 1.05 4.56 0 937 1.05 938Minnesota .................. 417 87.2 242 67.7 69.3 73.5 0 9.02 0 2.70 0 968 0 968Mississippi ................ 370 63.2 1,600 8.47 274 86.2 0 12.6 0 41.8 0 2,460 0 2,460
Missouri .................... 273 66.7 1,500 21.6 8.69 41.9 0 25.6 0 23.5 0 1,960 0 1,960Montana .................... 75.4 25.1 157 13.1 2.67 41.9 0 1.35 5.74 .28 0 317 5.74 323Nebraska ................... 264 58.4 8,190 98.9 9.67 12.7 0 .09 .10 8.81 0 8,650 .10 8,650Nevada ...................... 151 41.9 751 9.54 16.4 .79 0 111 0 17.8 0 1,100 0 1,100New Hampshire ........ 41.7 46.6 .50 1.00 7.86 6.33 0 .02 0 1.11 0 105 0 105
New Jersey ................ 460 89.1 48.4 1.28 10.3 51.8 0 1.02 0 1.78 .01 664 .01 664New Mexico .............. 279 35.9 1,420 53.4 1.89 12.9 0 64.3 0 11.7 0 1,880 0 1,880New York .................. 564 157 22.8 21.7 18.0 181 0 7.78 .47 0 0 972 .47 972North Carolina .......... 174 180 86.8 105 7.66 191 0 39.3 0 .16 0 785 0 785North Dakota ............. 35.7 9.98 87.3 15.2 0 5.60 0 5.90 0 0 0 160 0 160
Ohio........................... 547 164 19.8 8.64 4.01 167 0 126 0 25.2 0 1,060 0 1,060Oklahoma .................. 127 28.1 405 61.3 .22 9.01 0 1.13 213 1.40 0 634 213 847Oregon ....................... 90.7 77.9 2,170 3.61 27.8 10.0 0 15.6 0 .99 0 2,390 0 2,390Pennsylvania ............. 235 171 9.29 60.3 13.2 74.1 0 95.2 0 4.92 0 662 0 662Rhode Island ............. 18.1 6.84 6.15 .20 .35 .56 0 .66 0 0 0 32.9 0 32.9
South Carolina .......... 169 143 54.0 5.24 .77 36.3 0 9.60 0 6.26 0 424 0 424South Dakota ............. 73.9 8.60 167 21.6 21.4 4.83 0 5.10 0 .81 0 303 0 303Tennessee .................. 373 41.1 37.5 17.3 16.6 51.2 0 11.6 0 0 0 548 0 548Texas ......................... 1,350 288 6,860 182 6.06 210 0 30.0 614 62.5 0 8,990 614 9,600Utah ........................... 390 13.2 436 9.17 98.1 23.1 39.3 4.18 37.8 15.0 4.69 989 81.8 1,070
Vermont ..................... 15.5 15.4 .34 6.89 6.69 2.03 0 .27 0 .29 0 47.4 0 47.4Virginia...................... 94.0 141 16.5 7.89 7.03 119 0 2.77 0 3.44 0 380 11.8 391Washington................ 605 96.4 705 23.5 7.88 120 0 25.1 0 0 0 1,580 0 1,580West Virginia ............. 41.7 36.8 .01 1.80 11.1 60.9 0 5.28 .57 .22 0 158 .57 158Wisconsin .................. 342 97.9 433 73.5 43.1 79.5 0 19.7 0 3.78 0 1,090 0 1,090
Wyoming ................... 55.8 7.08 474 6.86 2.50 4.62 0 42.9 199 1.48 0 595 199 793Puerto Rico ................ 108 2.37 33.6 6.40 .01 10.5 0 1.97 .38 1.56 0 164 .38 165U.S. Virgin Islands .... .99 0 0 .05 0 .29 0 0 0 0 0 1.32 0 1.32
TOTAL 16,400 4,190 60,000 1,450 2,140 3,440 41.2 1,140 1,700 571 1,630 89,300 3,380 92,600

EXPLANATIONWater withdrawals, in million gallons per day
0 to 2,0002,000 to 5,0005,000 to 10,00010,000 to 20,00020,000 to 46,000
Louisiana
New Hampshire
FloridaIdaho
Washington
Oregon
Nevada
California
New Mexico
Texas
Utah
Arizona
Nebraska
North DakotaMontana
Wyoming
Colorado
Oklahoma
Kansas
South Dakota
Arkansas
Missouri
Georgia
Michigan
Iowa
Alabama
Tennessee
Mis
siss
ippi
NorthCarolina
Wisconsin
Minnesota
IndianaIllinois
Kentucky
SouthCarolina
Ohio
WestVirginia
VirginiaMaryland
District of ColumbiaDelaware
Massachusetts
Maine
New York
PennsylvaniaNew Jersey
ConnecticutRhode Island
Vermont
Alaska
Hawaii
Puerto Rico
Lake Superior
Lake
Mic
higa
n
Lake Ontario
Lake Erie
Lake Huron
U.S.Virgin Islands
Total withdrawals
Surface-water withdrawals Groundwater withdrawals
0
20,000
40,000
60,000
Hawaii
Alaska
Oregon
Wash
ington
California
Nevada
Idaho
Arizona
Utah
Montana
Wyo
ming
New Mexic
o
Colorado
North Dako
ta
South Dakota
NebraskaTexa
s
Kansas
Oklahoma
Minnesota
Iowa
Missouri
Louisi
ana
Arkansa
s
Wisc
onsin
Mississ
ippi
Illinois
Alabama
Tennessee
Indiana
Kentucky
Michigan
GeorgiaOhio
Florid
a
South Carolina
West
Virginia
North Carolin
a
Virginia
Pennsylva
nia
Maryland
D.C.
New York
Delaware
New Jersey
Connecticut
Vermont
Massachuse
tts
Rhode Island
New HampshireMaine
Puerto Rico
U.S. Virg
in Islands
TOTA
L W
ITHD
RAW
ALS,
INM
ILLI
ON G
ALLO
NS
PER
DAY
WEST EAST
Figure 2. Total, surface-water, and groundwater withdrawals, 2005.
Total Water Use 13

Figure 3. Freshwater and saline-water withdrawals, 2005.
Louisiana
New Hampshire
Florida
Idaho
Washington
Oregon
Nevada
California
New Mexico
Texas
Utah
Arizona
Nebraska
North DakotaMontana
Wyoming
Colorado
Oklahoma
Kansas
South Dakota
Arkansas
Missouri
Georgia
Michigan
Iowa
Alabama
Tennessee
Mis
siss
ippi
NorthCarolina
Wisconsin
Minnesota
IndianaIllinois
Kentucky
SouthCarolina
Ohio
WestVirginia
Virginia
Massachusetts
Maine
New York
PennsylvaniaConnecticutRhode Island
Vermont
Alaska
Hawaii
Maryland
District of ColumbiaDelaware
New Jersey
Lake Superior
Lake
Mic
higa
n
Lake Ontario
Lake Erie
Lake Huron
Puerto Rico
U.S.Virgin Islands
Puerto Rico
U.S.Virgin Islands
Louisiana
New Hampshire
Florida
Idaho
Washington
Oregon
Nevada
California
New Mexico
Texas
Utah
Arizona
Nebraska
North DakotaMontana
Wyoming
Colorado
Oklahoma
Kansas
South Dakota
Arkansas
Missouri
Georgia
Michigan
Iowa
Alabama
Tennessee
Mis
siss
ippi
NorthCarolina
Wisconsin
Minnesota
IndianaIllinois
Kentucky
SouthCarolina
Ohio
WestVirginia
Virginia
Massachusetts
Maine
New York
PennsylvaniaConnecticutRhode Island
Vermont
Alaska
Hawaii
Maryland
District of ColumbiaDelaware
New Jersey
Lake Superior
Lake
Mic
higa
n
Lake Ontario
Lake Erie
Lake Huron
Freshwater withdrawals
Saline-water withdrawals
EXPLANATIONWater withdrawals, in million gallons per day
0Greater than 0 to 2,0002,000 to 5,0005,000 to 10,00010,000 to 20,00020,000 to 33,000
14 Estimated Use of Water in the United States in 2005
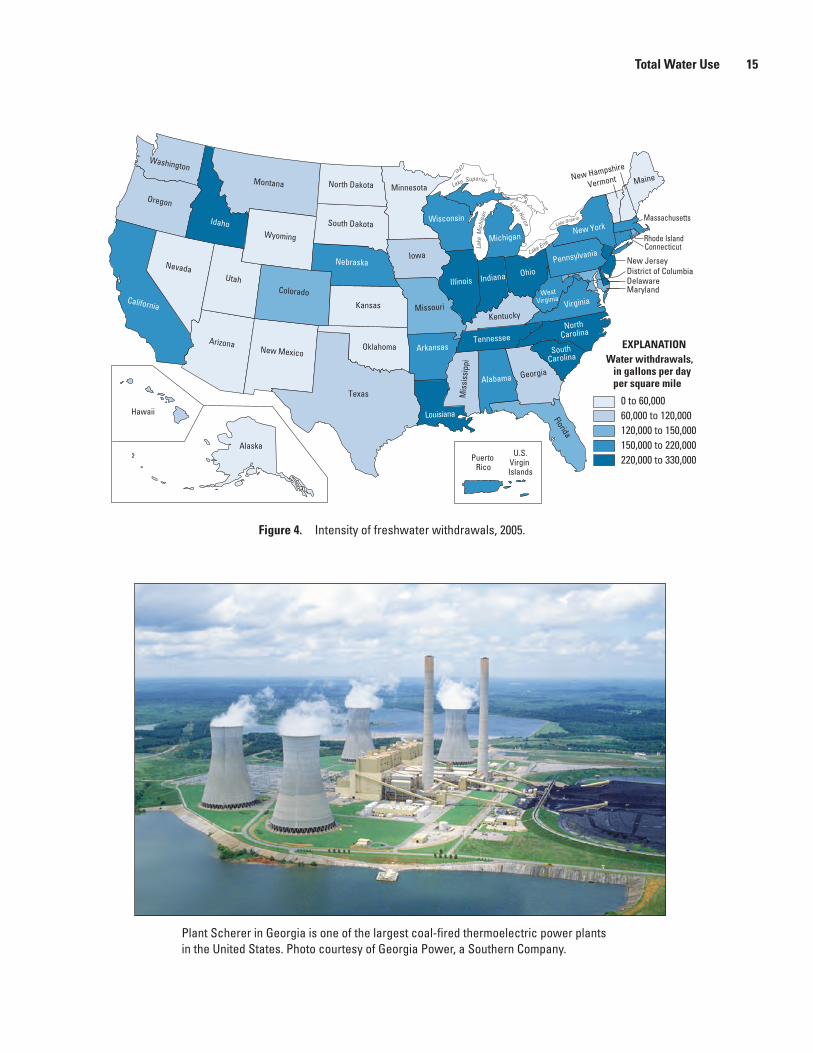
Plant Scherer in Georgia is one of the largest coal-fired thermoelectric power plants in the United States. Photo courtesy of Georgia Power, a Southern Company.
Figure 4. Intensity of freshwater withdrawals, 2005.
0 to 60,00060,000 to 120,000120,000 to 150,000150,000 to 220,000220,000 to 330,000
EXPLANATIONWater withdrawals, in gallons per day per square mile
Louisiana
New Hampshire
Florida
Idaho
Washington
Oregon
Nevada
California
New Mexico
Texas
Utah
Arizona
Nebraska
North DakotaMontana
Wyoming
Colorado
Oklahoma
Kansas
South Dakota
Arkansas
Missouri
Georgia
Michigan
Iowa
Alabama
Tennessee
Mis
siss
ippi
NorthCarolina
Wisconsin
Minnesota
IndianaIllinois
Kentucky
SouthCarolina
Ohio
WestVirginia
Virginia
Massachusetts
Maine
New York
PennsylvaniaConnecticutRhode Island
Vermont
Alaska
Hawaii
Maryland
District of ColumbiaDelaware
New Jersey
Lake Superior
Lake
Mic
higa
n
Lake Ontario
Lake Erie
Lake Huron
Puerto Rico
U.S.Virgin Islands
Total Water Use 15

Chattahoochee Water Treatment Plant, City of Atlanta, Georgia. Photo by Nancy L. Barber, USGS.
11 p
erce
nt
16 Estimated Use of Water in the United States in 2005
44,200 million gallons per dayPublic Supply
Public supply refers to water withdrawn by public and private water suppliers that provide water to at least 25 people or have a minimum of 15 connections. Public-supply water is delivered to users for domestic, commercial, and industrial purposes, and also is used for public services and system losses.
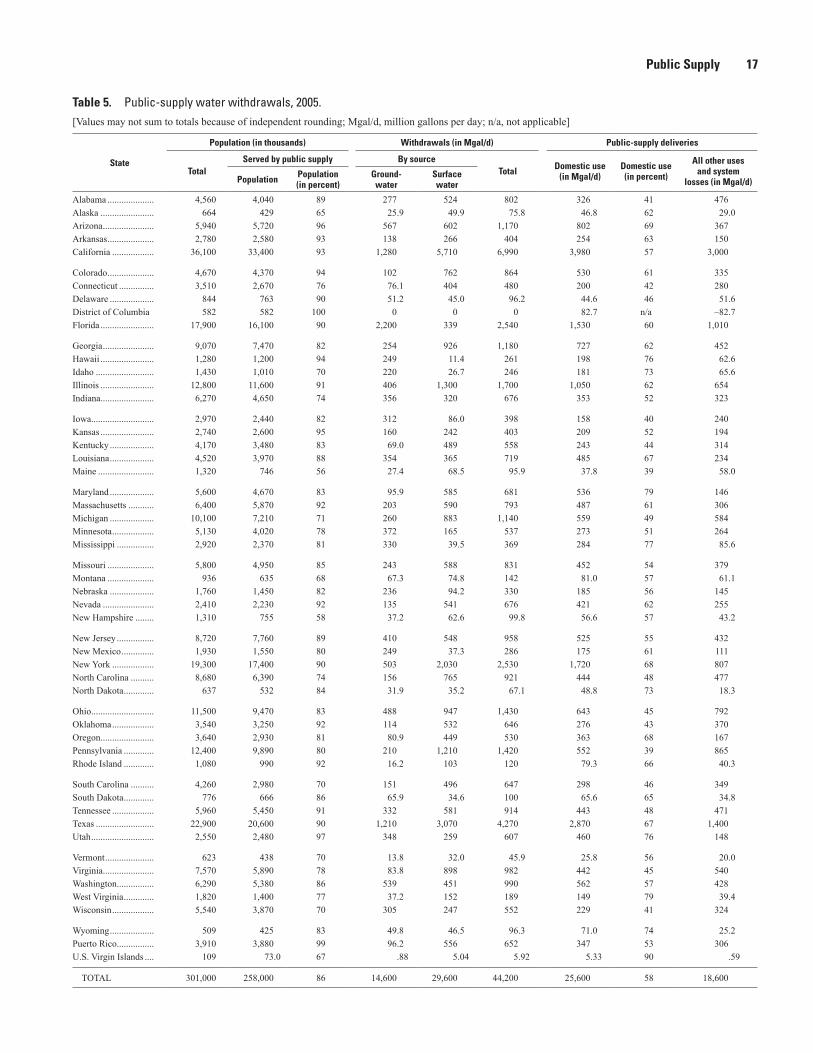
Approximately 44,200 Mgal/d (table 5), or 49,600 thou-sand acre-feet per year (table 2B), of water were withdrawn for public supply in 2005. This amount is 2 percent more than the estimated amount of water withdrawn for public supply in 2000. Public supply represents about 13 percent of total fresh-water withdrawals, and 21 percent of all with drawals, not including thermoelectric power. Some public-supply water sources are desalinated seawater or brackish groundwater that has been treated to reduce dissolved solids. These saline water sources currently represent a relatively small proportion of total public-supply water withdrawals in the United States and, thus, are not identified separately in table 5.
An estimated 258 million people relied on public water supplies for their household use. This number represents about 86 percent of the total U.S. population. States with the largest populations (California, Texas, New York, and Florida) withdrew the largest amounts of water for public supply (fig. 5). Two-thirds of water withdrawn for public supply in 2005 was from surface sources, such as lakes and streams; the other third was from groundwater. A total of 38 States (including the District of Columbia, which obtains its water from Maryland) relied on surface water for more than half their public supplies, whereas only 15 States obtained more than half their public water supplies from groundwater. California, Texas, New York, Illinois, and Pennsylvania each withdrew more than 1,000 Mgal/d of surface water for public supply in 2005, and 45 percent of the total surface-water withdrawals for public supply occurred
in these five States. Three States—Florida, California, and Texas—each withdrew more than 1,000 Mgal/d of ground-water for public supply in 2005 and together accounted for 32 percent of total groundwater withdrawals for this category.
Of the total public-supply water, most is delivered to customers for domestic, commercial, and industrial needs. Part of the total, often unbilled, is used for public services, such as pools, parks, firefighting, water and wastewater treat-ment, and municipal buildings. A certain amount of public-supply water is unaccounted for because of leaks, flushing, tower maintenance, and other system losses. Estimates of domestic deliveries, which represent indoor and outdoor water uses at occupied residences, are given in table 5. Domestic deliveries averaged 58 percent of total public-supply use, but this percentage varies from State to State. Estimates for commercial and industrial deliveries, public use, and system losses were not available for all States and, therefore, are included in table 5 as an aggregate number.
Methods varied by State for estimating public-supply withdrawals, source of water, population served, and domestic deliveries. Common sources of information about with drawals by source included data collected from water suppliers by State water regulatory agencies or surveys. Population served estimates were derived using various sources, including reports from State agencies, the USEPA SDWIS database, Census data, and information on service connections from public suppliers. Domestic deliveries for each State were estimated by various methods including surveys of public-supply sales information, calculations using coefficients for per capita use along with population served, and development of average percentages of deliveries to various customer categories.
Public Supply 17
Table 5. Public-supply water withdrawals, 2005. [Values may not sum to totals because of independent rounding; Mgal/d, million gallons per day; n/a, not applicable]
State
Population (in thousands) Withdrawals (in Mgal/d) Public-supply deliveries
TotalServed by public supply By source
Total Domestic use (in Mgal/d)
Domestic use (in percent)
All other uses and system
losses (in Mgal/d)Population Population (in percent)
Ground- water
Surface water
Alabama .................... 4,560 4,040 89 277 524 802 326 41 476Alaska ....................... 664 429 65 25.9 49.9 75.8 46.8 62 29.0Arizona ...................... 5,940 5,720 96 567 602 1,170 802 69 367Arkansas .................... 2,780 2,580 93 138 266 404 254 63 150California .................. 36,100 33,400 93 1,280 5,710 6,990 3,980 57 3,000
Colorado .................... 4,670 4,370 94 102 762 864 530 61 335Connecticut ............... 3,510 2,670 76 76.1 404 480 200 42 280Delaware ................... 844 763 90 51.2 45.0 96.2 44.6 46 51.6District of Columbia 582 582 100 0 0 0 82.7 n/a –82.7Florida ....................... 17,900 16,100 90 2,200 339 2,540 1,530 60 1,010
Georgia ...................... 9,070 7,470 82 254 926 1,180 727 62 452Hawaii ....................... 1,280 1,200 94 249 11.4 261 198 76 62.6Idaho ......................... 1,430 1,010 70 220 26.7 246 181 73 65.6Illinois ....................... 12,800 11,600 91 406 1,300 1,700 1,050 62 654Indiana ....................... 6,270 4,650 74 356 320 676 353 52 323
Iowa ........................... 2,970 2,440 82 312 86.0 398 158 40 240Kansas ....................... 2,740 2,600 95 160 242 403 209 52 194Kentucky ................... 4,170 3,480 83 69.0 489 558 243 44 314Louisiana ................... 4,520 3,970 88 354 365 719 485 67 234Maine ........................ 1,320 746 56 27.4 68.5 95.9 37.8 39 58.0
Maryland ................... 5,600 4,670 83 95.9 585 681 536 79 146Massachusetts ........... 6,400 5,870 92 203 590 793 487 61 306Michigan ................... 10,100 7,210 71 260 883 1,140 559 49 584Minnesota .................. 5,130 4,020 78 372 165 537 273 51 264Mississippi ................ 2,920 2,370 81 330 39.5 369 284 77 85.6
Missouri .................... 5,800 4,950 85 243 588 831 452 54 379Montana .................... 936 635 68 67.3 74.8 142 81.0 57 61.1Nebraska ................... 1,760 1,450 82 236 94.2 330 185 56 145Nevada ...................... 2,410 2,230 92 135 541 676 421 62 255New Hampshire ........ 1,310 755 58 37.2 62.6 99.8 56.6 57 43.2
New Jersey ................ 8,720 7,760 89 410 548 958 525 55 432New Mexico .............. 1,930 1,550 80 249 37.3 286 175 61 111New York .................. 19,300 17,400 90 503 2,030 2,530 1,720 68 807North Carolina .......... 8,680 6,390 74 156 765 921 444 48 477North Dakota ............. 637 532 84 31.9 35.2 67.1 48.8 73 18.3
Ohio........................... 11,500 9,470 83 488 947 1,430 643 45 792Oklahoma .................. 3,540 3,250 92 114 532 646 276 43 370Oregon ....................... 3,640 2,930 81 80.9 449 530 363 68 167Pennsylvania ............. 12,400 9,890 80 210 1,210 1,420 552 39 865Rhode Island ............. 1,080 990 92 16.2 103 120 79.3 66 40.3
South Carolina .......... 4,260 2,980 70 151 496 647 298 46 349South Dakota ............. 776 666 86 65.9 34.6 100 65.6 65 34.8Tennessee .................. 5,960 5,450 91 332 581 914 443 48 471Texas ......................... 22,900 20,600 90 1,210 3,070 4,270 2,870 67 1,400Utah ........................... 2,550 2,480 97 348 259 607 460 76 148
Vermont ..................... 623 438 70 13.8 32.0 45.9 25.8 56 20.0Virginia...................... 7,570 5,890 78 83.8 898 982 442 45 540Washington................ 6,290 5,380 86 539 451 990 562 57 428West Virginia ............. 1,820 1,400 77 37.2 152 189 149 79 39.4Wisconsin .................. 5,540 3,870 70 305 247 552 229 41 324
Wyoming ................... 509 425 83 49.8 46.5 96.3 71.0 74 25.2Puerto Rico ................ 3,910 3,880 99 96.2 556 652 347 53 306U.S. Virgin Islands .... 109 73.0 67 .88 5.04 5.92 5.33 90 .59
TOTAL 301,000 258,000 86 14,600 29,600 44,200 25,600 58 18,600

Figure 5. Public-supply withdrawals by source and State, 2005.
EXPLANATIONWater withdrawals, in million gallons per day
0 to 200200 to 500500 to 1,0001,000 to 2,0002,000 to 7,000
Louisiana
New Hampshire
FloridaIdaho
Washington
Oregon
Nevada
California
New Mexico
Texas
Utah
Arizona
Nebraska
North DakotaMontana
Wyoming
Colorado
Oklahoma
Kansas
South Dakota
Arkansas
Missouri
Georgia
Michigan
Iowa
Alabama
Tennessee
Mis
siss
ippi
NorthCarolina
Wisconsin
Minnesota
IndianaIllinois
Kentucky
SouthCarolina
Ohio
WestVirginia
Virginia
Massachusetts
Maine
New York
PennsylvaniaConnecticutRhode Island
Vermont
Alaska
Hawaii
MarylandDelaware
New JerseyDistrict of Columbia
Lake Superior
Lake
Mic
higa
n
Lake Ontario
Lake Erie
Lake Huron
Puerto Rico
U.S.Virgin Islands
Total withdrawals
Surface-water withdrawals Groundwater withdrawals
TOTA
L W
ITHD
RAW
ALS,
INM
ILLI
ON G
ALLO
NS
PER
DAY
0
1,000
2,000
3,000
4,000
5,000
6,000
7,000
Hawaii
Alaska
Oregon
Wash
ington
California
Nevada
Idaho
Arizona
Utah
Montana
Wyo
ming
New Mexic
o
Colorado
North Dako
ta
South Dakota
NebraskaTexa
s
Kansas
Oklahoma
Minnesota
Iowa
Missouri
Louisi
ana
Arkansa
s
Wisc
onsin
Mississ
ippi
Illinois
Alabama
Tennessee
Indiana
Kentucky
Michigan
GeorgiaOhio
Florid
a
South Carolina
West
Virginia
North Carolin
a
Virginia
Pennsylva
nia
Maryland
D.C.
New York
Delaware
New Jersey
Connecticut
Vermont
Massachuse
tts
Rhode Island
New HampshireMaine
Puerto Rico
U.S. Virg
in Islands
WEST EAST
18 Estimated Use of Water in the United States in 2005

Domestic water use includes drinking water, bathing, and watering the lawn. Photos by Nancy L. Barber.
1 pe
rcen
t
Domestic 19
Domestic 3,830 million gallons per day
Domestic water use includes indoor and outdoor uses at residences. Common indoor water uses are drinking, food preparation, washing clothes and dishes, and flushing toilets. Common outdoor uses are watering lawns and gardens and washing cars. Domestic water is either self-supplied or pro-vided by public suppliers. Self-supplied domestic water use is usually withdrawn from a private source, such as a well, or captured as rainwater in a cistern. Domestic deliveries are provided to homes by public suppliers. Table 6 lists the estimated self-supplied and public-supplied population in each State, along with the amounts used by each segment of the population for domestic needs and the respective per capita use in gallons per day. Domestic self-supplied withdrawals anddeliver-ies also are combined in table 6 to show the entire estimated amount of domestic use in 2005 and the weighted per capita use in gallons per day calculated for all domestic use.
An estimated 42.9 million people in the United States, or 14 percent of the population, supplied their own water for domestic use in 2005. These self-supplied withdrawals totaled 3,830 Mgal/day, or about 1 percent of estimated with-drawals for all uses in 2005. Nearly all (98 percent) of these self-supplied withdrawals were from fresh ground water. Domestic self-supplied water use was calculated using an estimate of the population that was not served by public supply and a coefficient for daily per capita use. For some States, these coef ficients were county averages derived from observed residential water use and population estimates in nearby areas served by public suppliers. Other States used the same coefficient for all counties, often one used by State regulatory or planning agencies. Per capita self-supplied domestic usage ranged from 50 gallons per day (gal/d) in Kentucky to 206 gal/d in Nevada, and generally was lowest in the Northern and Eastern States and largest in the mountain and Western States. Outdoor watering in the drier climates causes domestic per capita use to increase. The national average in 2005 was 89 gal/d for self-supplied domestic use. In comparison, the national average per capita
use for self-supplied domestic water use was 80 gal/d in 1995 and 83 gal/d in 2000.
The majority of people in the United States used water provided by public suppliers in 2005. These domestic deliveries totaled 25,600 Mgal/d. The most common method for estimating the quantity of water delivered by public water suppliers for domestic use was to use sales information from reports or surveys of public suppliers. Although complete
surveys were uncommon, sample data could be used to develop coefficients for estimating the deliveries for all public suppliers. Typical coefficients used include percentage of the total with- drawals that were for domestic use, and per capita use derived from residential sales and the estimated population served.
Per capita water use for domestic deliveries ranged from 51 gal/d in Maine to 189 gal/d in Nevada. The national average was 99 gal/d for public-supplied domestic water use. This per capita usage is similar to the rate of 101 gal/d observed in 1995, the last year for which domestic delivery information was compiled for all States.
Combined domestic self-supplied withdrawals and public-supplied deliveries totaled 29,400 Mgal/d in 2005, and the weighted average per capita usage was 98 gal/d. The geographic distribution of total domestic water use, self-supplied withdrawals, and domestic deliveries by State is shown in figure 6A. States with
the largest domestic use (public supplied and self supplied) and the largest domestic deliveries from public supply were those with the largest populations: California, Texas, New York, Florida, and Illinois. California, Texas, and Michigan had the largest self-supplied withdrawals.
Self-supplied domestic population in each State, in thou-sands of people and as a percentage of total State population, is shown in figure 6B. Self-supplied domestic populations were largest in Michigan, California, Pennsylvania, North Carolina, and Texas. States with the largest percentages of their population that were self-supplied were Maine, New Hampshire, Alaska, and the U.S. Virgin Islands.
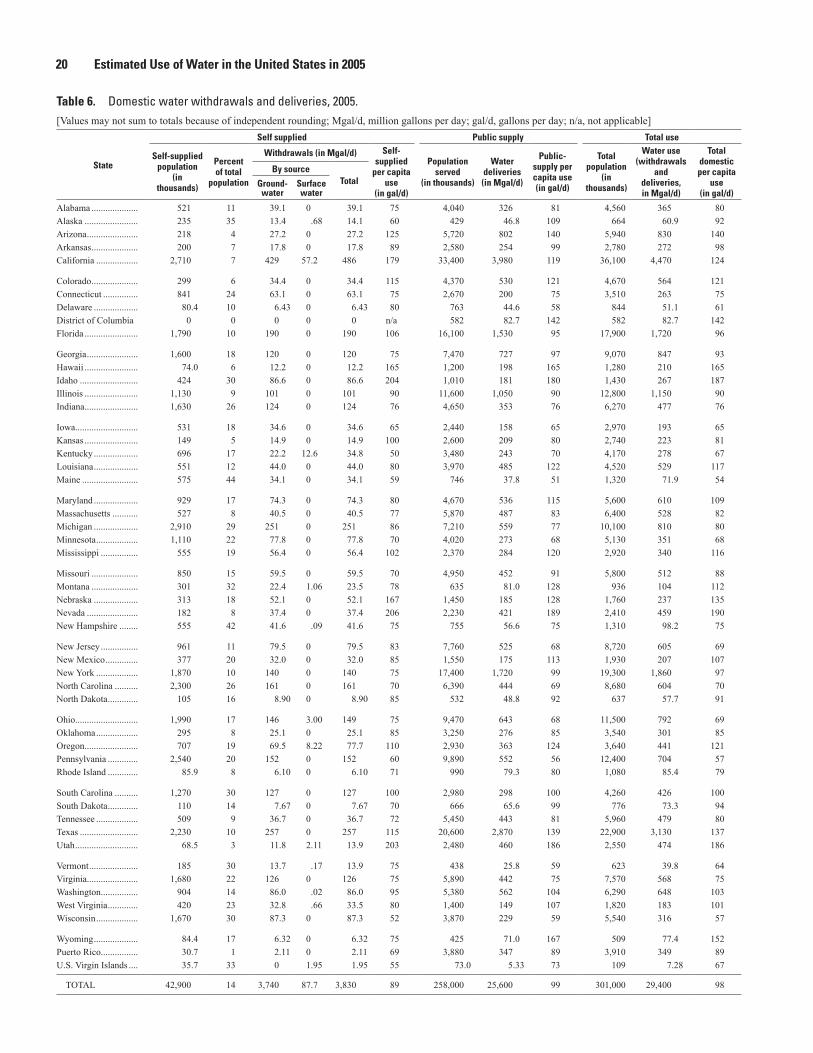
20 Estimated Use of Water in the United States in 2005
Table 6. Domestic water withdrawals and deliveries, 2005.[Values may not sum to totals because of independent rounding; Mgal/d, million gallons per day; gal/d, gallons per day; n/a, not applicable]
State
Self supplied Public supply Total use
Self-supplied population
(in thousands)
Percent of total
population
Withdrawals (in Mgal/d) Self- supplied
per capita use
(in gal/d)
Population served
(in thousands)
Water deliveries (in Mgal/d)
Public- supply per capita use (in gal/d)
Total population
(in thousands)
Water use (withdrawals
and deliveries, in Mgal/d)
Total domestic per capita
use (in gal/d)
By sourceTotalGround-
waterSurface water
Alabama .................... 521 11 39.1 0 39.1 75 4,040 326 81 4,560 365 80Alaska ....................... 235 35 13.4 .68 14.1 60 429 46.8 109 664 60.9 92Arizona ...................... 218 4 27.2 0 27.2 125 5,720 802 140 5,940 830 140Arkansas .................... 200 7 17.8 0 17.8 89 2,580 254 99 2,780 272 98California .................. 2,710 7 429 57.2 486 179 33,400 3,980 119 36,100 4,470 124
Colorado .................... 299 6 34.4 0 34.4 115 4,370 530 121 4,670 564 121Connecticut ............... 841 24 63.1 0 63.1 75 2,670 200 75 3,510 263 75Delaware ................... 80.4 10 6.43 0 6.43 80 763 44.6 58 844 51.1 61District of Columbia 0 0 0 0 0 n/a 582 82.7 142 582 82.7 142Florida ....................... 1,790 10 190 0 190 106 16,100 1,530 95 17,900 1,720 96
Georgia ...................... 1,600 18 120 0 120 75 7,470 727 97 9,070 847 93Hawaii ....................... 74.0 6 12.2 0 12.2 165 1,200 198 165 1,280 210 165Idaho ......................... 424 30 86.6 0 86.6 204 1,010 181 180 1,430 267 187Illinois ....................... 1,130 9 101 0 101 90 11,600 1,050 90 12,800 1,150 90Indiana ....................... 1,630 26 124 0 124 76 4,650 353 76 6,270 477 76
Iowa ........................... 531 18 34.6 0 34.6 65 2,440 158 65 2,970 193 65Kansas ....................... 149 5 14.9 0 14.9 100 2,600 209 80 2,740 223 81Kentucky ................... 696 17 22.2 12.6 34.8 50 3,480 243 70 4,170 278 67Louisiana ................... 551 12 44.0 0 44.0 80 3,970 485 122 4,520 529 117Maine ........................ 575 44 34.1 0 34.1 59 746 37.8 51 1,320 71.9 54
Maryland ................... 929 17 74.3 0 74.3 80 4,670 536 115 5,600 610 109Massachusetts ........... 527 8 40.5 0 40.5 77 5,870 487 83 6,400 528 82Michigan ................... 2,910 29 251 0 251 86 7,210 559 77 10,100 810 80Minnesota .................. 1,110 22 77.8 0 77.8 70 4,020 273 68 5,130 351 68Mississippi ................ 555 19 56.4 0 56.4 102 2,370 284 120 2,920 340 116
Missouri .................... 850 15 59.5 0 59.5 70 4,950 452 91 5,800 512 88Montana .................... 301 32 22.4 1.06 23.5 78 635 81.0 128 936 104 112Nebraska ................... 313 18 52.1 0 52.1 167 1,450 185 128 1,760 237 135Nevada ...................... 182 8 37.4 0 37.4 206 2,230 421 189 2,410 459 190New Hampshire ........ 555 42 41.6 .09 41.6 75 755 56.6 75 1,310 98.2 75
New Jersey ................ 961 11 79.5 0 79.5 83 7,760 525 68 8,720 605 69New Mexico .............. 377 20 32.0 0 32.0 85 1,550 175 113 1,930 207 107New York .................. 1,870 10 140 0 140 75 17,400 1,720 99 19,300 1,860 97North Carolina .......... 2,300 26 161 0 161 70 6,390 444 69 8,680 604 70North Dakota ............. 105 16 8.90 0 8.90 85 532 48.8 92 637 57.7 91
Ohio........................... 1,990 17 146 3.00 149 75 9,470 643 68 11,500 792 69Oklahoma .................. 295 8 25.1 0 25.1 85 3,250 276 85 3,540 301 85Oregon ....................... 707 19 69.5 8.22 77.7 110 2,930 363 124 3,640 441 121Pennsylvania ............. 2,540 20 152 0 152 60 9,890 552 56 12,400 704 57Rhode Island ............. 85.9 8 6.10 0 6.10 71 990 79.3 80 1,080 85.4 79
South Carolina .......... 1,270 30 127 0 127 100 2,980 298 100 4,260 426 100South Dakota ............. 110 14 7.67 0 7.67 70 666 65.6 99 776 73.3 94Tennessee .................. 509 9 36.7 0 36.7 72 5,450 443 81 5,960 479 80Texas ......................... 2,230 10 257 0 257 115 20,600 2,870 139 22,900 3,130 137Utah ........................... 68.5 3 11.8 2.11 13.9 203 2,480 460 186 2,550 474 186
Vermont ..................... 185 30 13.7 .17 13.9 75 438 25.8 59 623 39.8 64Virginia...................... 1,680 22 126 0 126 75 5,890 442 75 7,570 568 75Washington................ 904 14 86.0 .02 86.0 95 5,380 562 104 6,290 648 103West Virginia ............. 420 23 32.8 .66 33.5 80 1,400 149 107 1,820 183 101Wisconsin .................. 1,670 30 87.3 0 87.3 52 3,870 229 59 5,540 316 57
Wyoming ................... 84.4 17 6.32 0 6.32 75 425 71.0 167 509 77.4 152Puerto Rico ................ 30.7 1 2.11 0 2.11 69 3,880 347 89 3,910 349 89U.S. Virgin Islands .... 35.7 33 0 1.95 1.95 55 73.0 5.33 73 109 7.28 67
TOTAL 42,900 14 3,740 87.7 3,830 89 258,000 25,600 99 301,000 29,400 98
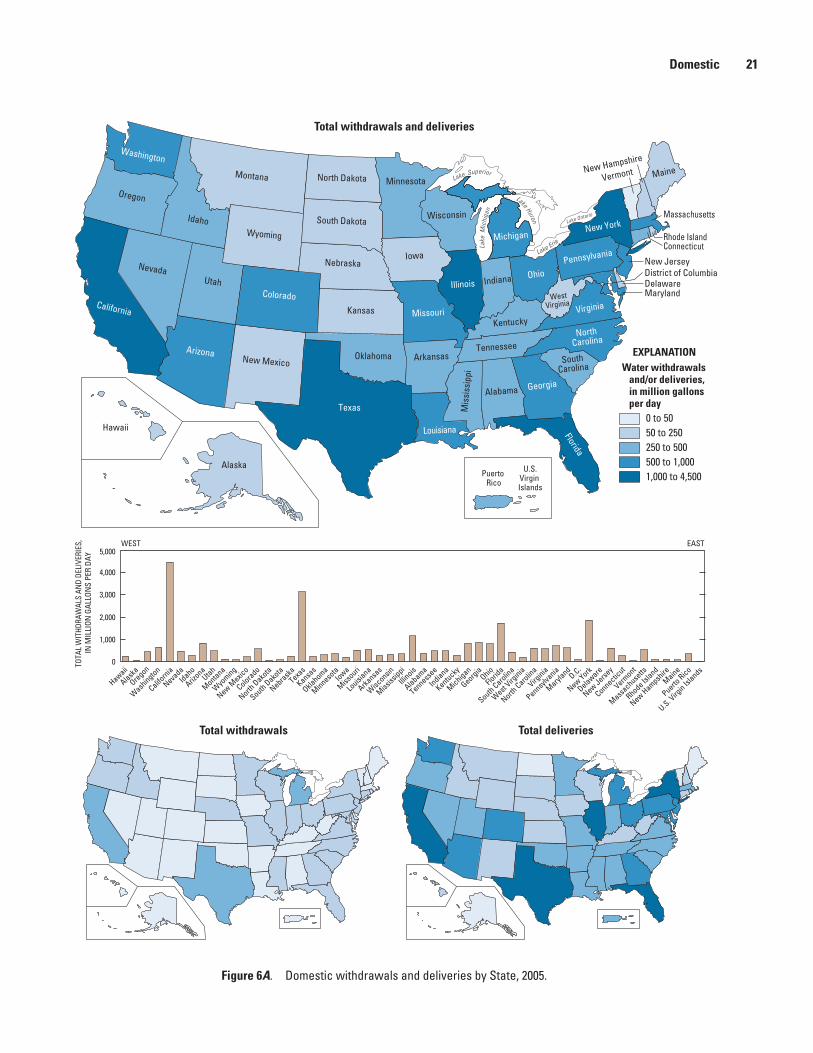
EXPLANATIONWater withdrawals and/or deliveries, in million gallons per day
0 to 5050 to 250250 to 500500 to 1,0001,000 to 4,500
Total withdrawals Total deliveries
Louisiana
New Hampshire
Florida
Idaho
Washington
Oregon
Nevada
California
New Mexico
Texas
Utah
Arizona
Nebraska
North DakotaMontana
Wyoming
Colorado
Oklahoma
Kansas
South Dakota
Arkansas
Missouri
Georgia
Michigan
Iowa
Alabama
Tennessee
Mis
siss
ippi
NorthCarolina
Wisconsin
Minnesota
IndianaIllinois
Kentucky
SouthCarolina
Ohio
WestVirginia
VirginiaMaryland
District of ColumbiaDelaware
Massachusetts
Maine
New York
PennsylvaniaNew Jersey
ConnecticutRhode Island
Vermont
Alaska
Hawaii
Lake Superior
Lake
Mic
higa
n
Lake Ontario
Lake Erie
Lake Huron
Puerto Rico
U.S.Virgin Islands
Total withdrawals and deliveries
TOTA
L W
ITHD
RAW
ALS
AND
DELI
VERI
ES,
IN M
ILLI
ON G
ALLO
NS
PER
DAY
Hawaii
Alaska
Oregon
Wash
ington
California
Nevada
Idaho
Arizona
Utah
Montana
Wyo
ming
New Mexic
o
Colorado
North Dako
ta
South Dakota
NebraskaTexa
s
Kansas
Oklahoma
Minnesota
Iowa
Missouri
Louisi
ana
Arkansa
s
Wisc
onsin
Mississ
ippi
Illinois
Alabama
Tennessee
Indiana
Kentucky
Michigan
GeorgiaOhio
Florid
a
South Carolina
West
Virginia
North Carolin
a
Virginia
Pennsylva
nia
Maryland
D.C.
New York
Delaware
New Jersey
Connecticut
Vermont
Massachuse
tts
Rhode Island
New HampshireMaine
Puerto Rico
U.S. Virg
in Islands
WEST EAST
0
1,000
2,000
3,000
4,000
5,000
Figure 6A. Domestic withdrawals and deliveries by State, 2005.
Domestic 21

EXPLANATION
Domestic self-supplied population, in thousands
0 to 100 100 to 500500 to 1,0001,000 to 3,000
EXPLANATIONDomestic self-supplied population, as a percentage of total State population
0 to 1010 to 3030 to 44
Domestic self-supplied population
Domestic self-supplied population as a percentage of the total State population
Louisiana
New Hampshire
Florida
Idaho
Washington
Oregon
Nevada
California
New Mexico
Texas
Utah
Arizona
Nebraska
North DakotaMontana
Wyoming
Colorado
Oklahoma
Kansas
South Dakota
Arkansas
Missouri
Georgia
Michigan
Iowa
Alabama
Tennessee
Mis
siss
ippi
NorthCarolina
Wisconsin
Minnesota
IndianaIllinois
Kentucky
SouthCarolina
Ohio
WestVirginia
VirginiaMaryland
District of ColumbiaDelaware
Massachusetts
Maine
New York
PennsylvaniaNew Jersey
ConnecticutRhode Island
Vermont
Alaska
Hawaii
Lake Superior
Lake
Mic
higa
n
Lake Ontario
Lake Erie
Lake Huron
Puerto Rico
U.S.Virgin Islands
Puerto Rico
U.S.Virgin Islands
Figure 6B. Self-supplied domestic population and percentage of total population by State, 2005.
22 Estimated Use of Water in the United States in 2005
31 p
erce
nt
Irrigation 23
128,000 million gallons per dayIrrigation
acres decreased in the West by 4 percent and increased in the East by 5 percent. In the West, acres irrigated by surface irrigation methods declined by 16 percent, and acres irri-gated by sprinkler methods increased by 9 percent. Irrigated acres in the East increased for all type of systems; the largest percentage increase was in microirrigation systems.
Total irrigation withdrawals of 128,000 Mgal/d for 2005 were almost 8 percent less than the estimated 139,000 Mgal/d withdrawn during 2000. Surface-water withdrawals of 74,900 Mgal/d in 2005 were 9 percent less than in 2000, when an estimated 82,400 Mgal/d were withdrawn. Ground-water withdrawals of 53,500 Mgal/d in 2005 were about 5 percent less than the 56,600 mgal/d withdrawn in 2000. Total irrigated acres in 2005 were 2 percent less than 2000. Acres irrigated with surface (flood) irrigation systems declined by 10 percent, from 29.7 million acres in 2000 to 26.6 million acres in 2005. Acres irrigated with sprinkler irrigation systems increased almost 7 percent, from 28.5 million acres in 2000 to 30.5 million acres in 2005.
Five States—California, Nebraska, Texas, Arkansas, and Idaho—accounted for 52 percent of total irrigated acreage. Nebraska, Texas, and California accounted for 41 percent of the irrigated acreage using sprinkler and microirrigation systems. California alone accounted for 65 percent of the irrigated acreage with microirrigation systems. Sprinkler and microirrigation systems combined were associated with more than 56 percent of total irrigated acreage.
Generally, application rates were greatest in the arid West and Mountain States where surface water was the predomi-nant source of water used for irrigation, and surface (flood) application was the predominant method of irrigation. Massachusetts is the exception with the highest application rate in the United States (6.9 acre-feet per acre), likely due to water-management practices in the many cranberry bogs in that State. In Arizona and Idaho, application rates exceeded 5 acre-feet per acre. Many States that typically use large quantities of water for irrigation, such as California, Montana, Florida, Kansas, and Nevada, showed declines in application rates in 2005 compared to 2000.
Sources of data for irrigation withdrawals and irrigated acres included State and Federal crop reporting programs. Withdrawals also were estimated using information on irrigated crop acreages along with specific crop water-consumption coefficients or irrigation-system application rates. Estimation methods ideally included adjustments for climatic variables, system efficiencies, conveyance losses, and other irrigation practices such as pre-irrigation. Other methods of estimating irrigation withdrawals included extrapolation of sample data on crop water-application rates or power-consumption coefficients.
Irrigation water use includes water that is applied by an irrigation system to sustain plant growth in all agricultural and horticultural practices. Irrigation also includes water that is applied for pre-irrigation, frost protection, application of chemicals, weed control, field preparation, crop cooling, harvesting, dust suppression, leaching salts from the root zone, and water lost in conveyance. Irrigation of golf courses, parks, nurseries, turf farms, cemeteries, and other self-supplied landscape-watering uses also are included. Irrigation water use includes self-supplied withdrawals and deliveries from irrigation companies, irrigation districts, cooperatives, or governmental entities. All irrigation withdrawals were consid-ered freshwater. Irrigated acres were reported by three types of irrigation methods: sprinkler, microirrigation, and surface (flood) systems.
Irrigation withdrawals and irrigated acres by irrigation system are listed by State in table 7. For 2005, total irrigation withdrawals were about 128,000 Mgal/d, or 144,000 thousand acre-feet per year. Irrigation withdrawals were 37 percent of total freshwater withdrawals and 62 percent of total freshwater withdrawals for all categories excluding thermoelectric power. Surface water accounted for 58 percent of the total irrigation withdrawals. About 61.1 million acres were irrigated in 2005.
About 26.6 million acres were irrigated with surface (flood) systems, 4.05 million acres with microirrigation systems, and 30.5 million acres with sprinkler systems. The national average application rate was 2.35 acre-feet per acre.
The geographic distribution of total, surface-water, and groundwater withdrawals for irrigation is shown in figure 7. The majority of withdrawals (85 percent) and irrigated acres (74 percent) were in the 17 conterminous Western States. The 17 Western States are located in areas where average annual precipitation typically is less than 20 inches and is insuffi-cient to support crops without supplemental water. Surface water was the primary source of water in the arid West and the Mountain States. California, Idaho, Colorado, and Mon-tana combined accounted for 49 percent of the total irriga-tion withdrawals and 64 percent of surface-water irrigation withdrawals. Nearly 90 percent of the ground water used for irrigation was withdrawn in 13 States, and each of these States withdrew more than 1,000 Mgal/d (1,120 thousand acre-feet per year) of groundwater for irrigation in 2005. Among these 13 States, groundwater was the primary source for irrigation in Nebraska, Arkansas, Texas, Kansas, Mississippi, and Missouri.
Total irrigation withdrawals in both Eastern and Western States were smaller in 2005 than in 2000, but because the West accounts for such a large majority of the total, changes in those States have a greater effect on the total. Ground water withdrawals increased slightly in the East, and surface-water withdrawals declined in both the East and West. Total irrigated
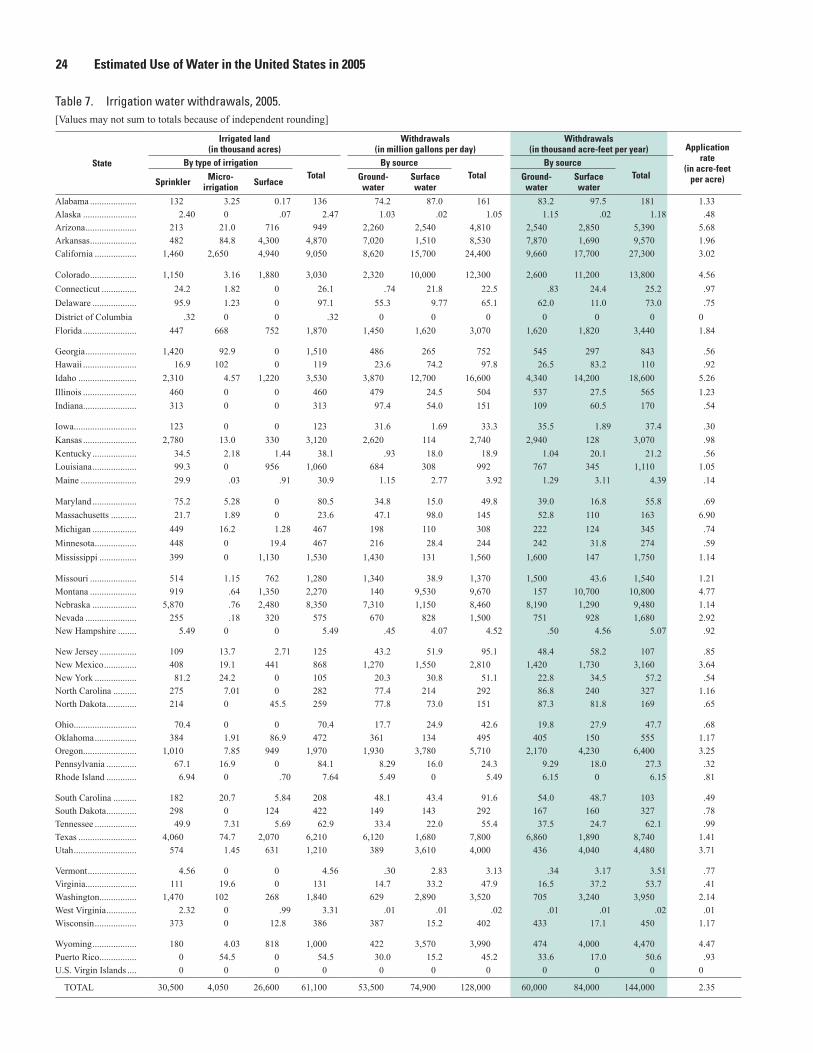
24 Estimated Use of Water in the United States in 2005
Table 7. Irrigation water withdrawals, 2005. [Values may not sum to totals because of independent rounding]
State
Irrigated land (in thousand acres)
Withdrawals (in million gallons per day)
Withdrawals (in thousand acre-feet per year) Application
rate (in acre-feet
per acre)
By type of irrigationTotal
By sourceTotal
By sourceTotal
Sprinkler Micro- irrigation Surface Ground-
waterSurface water
Ground- water
Surface water
Alabama .................... 132 3.25 0.17 136 74.2 87.0 161 83.2 97.5 181 1.33Alaska ....................... 2.40 0 .07 2.47 1.03 .02 1.05 1.15 .02 1.18 .48Arizona ...................... 213 21.0 716 949 2,260 2,540 4,810 2,540 2,850 5,390 5.68Arkansas .................... 482 84.8 4,300 4,870 7,020 1,510 8,530 7,870 1,690 9,570 1.96California .................. 1,460 2,650 4,940 9,050 8,620 15,700 24,400 9,660 17,700 27,300 3.02
Colorado .................... 1,150 3.16 1,880 3,030 2,320 10,000 12,300 2,600 11,200 13,800 4.56Connecticut ............... 24.2 1.82 0 26.1 .74 21.8 22.5 .83 24.4 25.2 .97Delaware ................... 95.9 1.23 0 97.1 55.3 9.77 65.1 62.0 11.0 73.0 .75District of Columbia .32 0 0 .32 0 0 0 0 0 0 0Florida ....................... 447 668 752 1,870 1,450 1,620 3,070 1,620 1,820 3,440 1.84
Georgia ...................... 1,420 92.9 0 1,510 486 265 752 545 297 843 .56Hawaii ....................... 16.9 102 0 119 23.6 74.2 97.8 26.5 83.2 110 .92Idaho ......................... 2,310 4.57 1,220 3,530 3,870 12,700 16,600 4,340 14,200 18,600 5.26Illinois ....................... 460 0 0 460 479 24.5 504 537 27.5 565 1.23Indiana ....................... 313 0 0 313 97.4 54.0 151 109 60.5 170 .54
Iowa ........................... 123 0 0 123 31.6 1.69 33.3 35.5 1.89 37.4 .30Kansas ....................... 2,780 13.0 330 3,120 2,620 114 2,740 2,940 128 3,070 .98Kentucky ................... 34.5 2.18 1.44 38.1 .93 18.0 18.9 1.04 20.1 21.2 .56Louisiana ................... 99.3 0 956 1,060 684 308 992 767 345 1,110 1.05Maine ........................ 29.9 .03 .91 30.9 1.15 2.77 3.92 1.29 3.11 4.39 .14
Maryland ................... 75.2 5.28 0 80.5 34.8 15.0 49.8 39.0 16.8 55.8 .69Massachusetts ........... 21.7 1.89 0 23.6 47.1 98.0 145 52.8 110 163 6.90Michigan ................... 449 16.2 1.28 467 198 110 308 222 124 345 .74Minnesota .................. 448 0 19.4 467 216 28.4 244 242 31.8 274 .59Mississippi ................ 399 0 1,130 1,530 1,430 131 1,560 1,600 147 1,750 1.14
Missouri .................... 514 1.15 762 1,280 1,340 38.9 1,370 1,500 43.6 1,540 1.21Montana .................... 919 .64 1,350 2,270 140 9,530 9,670 157 10,700 10,800 4.77Nebraska ................... 5,870 .76 2,480 8,350 7,310 1,150 8,460 8,190 1,290 9,480 1.14Nevada ...................... 255 .18 320 575 670 828 1,500 751 928 1,680 2.92New Hampshire ........ 5.49 0 0 5.49 .45 4.07 4.52 .50 4.56 5.07 .92
New Jersey ................ 109 13.7 2.71 125 43.2 51.9 95.1 48.4 58.2 107 .85New Mexico .............. 408 19.1 441 868 1,270 1,550 2,810 1,420 1,730 3,160 3.64New York .................. 81.2 24.2 0 105 20.3 30.8 51.1 22.8 34.5 57.2 .54North Carolina .......... 275 7.01 0 282 77.4 214 292 86.8 240 327 1.16North Dakota ............. 214 0 45.5 259 77.8 73.0 151 87.3 81.8 169 .65
Ohio........................... 70.4 0 0 70.4 17.7 24.9 42.6 19.8 27.9 47.7 .68Oklahoma .................. 384 1.91 86.9 472 361 134 495 405 150 555 1.17Oregon ....................... 1,010 7.85 949 1,970 1,930 3,780 5,710 2,170 4,230 6,400 3.25Pennsylvania ............. 67.1 16.9 0 84.1 8.29 16.0 24.3 9.29 18.0 27.3 .32Rhode Island ............. 6.94 0 .70 7.64 5.49 0 5.49 6.15 0 6.15 .81
South Carolina .......... 182 20.7 5.84 208 48.1 43.4 91.6 54.0 48.7 103 .49South Dakota ............. 298 0 124 422 149 143 292 167 160 327 .78Tennessee .................. 49.9 7.31 5.69 62.9 33.4 22.0 55.4 37.5 24.7 62.1 .99Texas ......................... 4,060 74.7 2,070 6,210 6,120 1,680 7,800 6,860 1,890 8,740 1.41Utah ........................... 574 1.45 631 1,210 389 3,610 4,000 436 4,040 4,480 3.71
Vermont ..................... 4.56 0 0 4.56 .30 2.83 3.13 .34 3.17 3.51 .77Virginia...................... 111 19.6 0 131 14.7 33.2 47.9 16.5 37.2 53.7 .41Washington................ 1,470 102 268 1,840 629 2,890 3,520 705 3,240 3,950 2.14West Virginia ............. 2.32 0 .99 3.31 .01 .01 .02 .01 .01 .02 .01Wisconsin .................. 373 0 12.8 386 387 15.2 402 433 17.1 450 1.17
Wyoming ................... 180 4.03 818 1,000 422 3,570 3,990 474 4,000 4,470 4.47Puerto Rico ................ 0 54.5 0 54.5 30.0 15.2 45.2 33.6 17.0 50.6 .93U.S. Virgin Islands .... 0 0 0 0 0 0 0 0 0 0 0
TOTAL 30,500 4,050 26,600 61,100 53,500 74,900 128,000 60,000 84,000 144,000 2.35
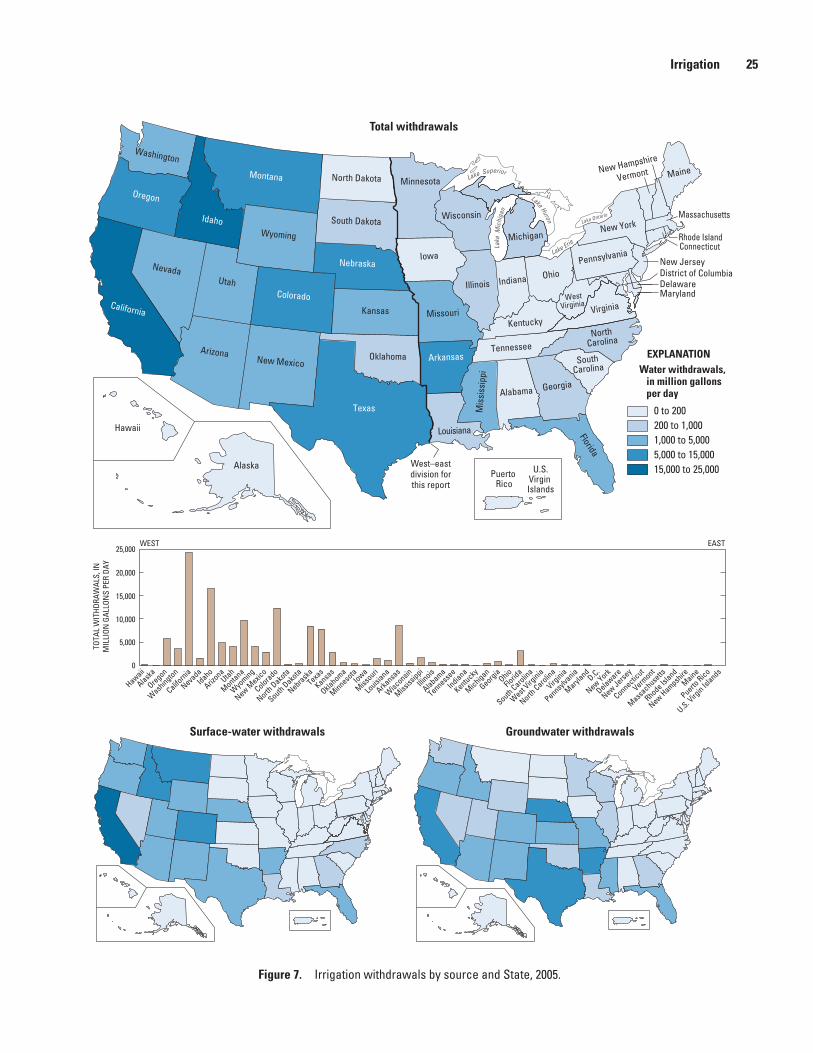
EXPLANATIONWater withdrawals, in million gallons per day
0 to 200200 to 1,0001,000 to 5,0005,000 to 15,00015,000 to 25,000
Louisiana
New Hampshire
FloridaIdaho
Washington
Oregon
Nevada
California
New Mexico
Texas
Utah
Arizona
Nebraska
North DakotaMontana
Wyoming
Colorado
Oklahoma
Kansas
South Dakota
Arkansas
Missouri
Georgia
Michigan
Iowa
Alabama
Tennessee
Mis
siss
ippi
NorthCarolina
Wisconsin
Minnesota
IndianaIllinois
Kentucky
SouthCarolina
Ohio
WestVirginia
Virginia
Massachusetts
Maine
New York
PennsylvaniaConnecticutRhode Island
Vermont
Alaska
Hawaii
MarylandDelaware
New JerseyDistrict of Columbia
Lake Superior
Lake
Mic
higa
n
Lake Ontario
Lake Erie
Lake Huron
Puerto Rico
U.S.Virgin Islands
Total withdrawals
Surface-water withdrawals Groundwater withdrawals
West–eastdivision forthis report
TOTA
L W
ITHD
RAW
ALS,
INM
ILLI
ON G
ALLO
NS
PER
DAY
WEST EAST
0
5,000
10,000
15,000
20,000
25,000
Hawaii
Alaska
Oregon
Wash
ington
California
Nevada
Idaho
Arizona
Utah
Montana
Wyo
ming
New Mexic
o
Colorado
North Dako
ta
South Dakota
NebraskaTexa
s
Kansas
Oklahoma
Minnesota
Iowa
Missouri
Louisi
ana
Arkansa
s
Wisc
onsin
Mississ
ippi
Illinois
Alabama
Tennessee
Indiana
Kentucky
Michigan
GeorgiaOhio
Florid
a
South Carolina
West
Virginia
North Carolin
a
Virginia
Pennsylva
nia
Maryland
D.C.
New York
Delaware
New Jersey
Connecticut
Vermont
Massachuse
tts
Rhode Island
New HampshireMaine
Puerto Rico
U.S. Virg
in Islands
Figure 7. Irrigation withdrawals by source and State, 2005.
Irrigation 25

(Above) Holstein dairy cattle, Washington County, Virginia. Photo by Jeff Vanuga, USDA NRCS. (Right) Hogs being fed in Iowa hoglot. Photo by Lynn Betts, USDA NRCS. (Far right) Breeder chickens, Cleburne County, Alabama. Photo by Michael J. Harper, Alabama Office of Water Resources.
Less
than
1 p
erce
nt
26 Estimated Use of Water in the United States in 2005
2,140 million gallons per dayLivestock
The geographic distribution of total, surface-water, and groundwater livestock withdrawals is shown in figure 8. Texas, California, Oklahoma, and North Carolina each used more than 125 Mgal/d for livestock and accounted for 35 percent of total livestock withdrawals in 2005. Texas, North Carolina, Nebraska, California, Iowa, and Kansas each used more than 80 Mgal/d of groundwater for livestock and accounted for 47 percent of groundwater withdrawals for this use. California, Oklahoma, and Texas each used more than 95 Mgal/d of surface water for livestock and accounted for 37 percent of surface-water withdrawals for this use.
Few State agencies require livestock operations to report water withdrawals; therefore, most estimates of livestock withdrawals were derived using animal population data and water-use coefficients, in gallons per head per day for each animal type. Animal population data generally are available from State agricultural agencies and the NASS. Coefficients vary by State and, for many States, were provided by agricultural extension agents or water-permitting agencies. Coefficients may reflect facility maintenance needs and effects of climate on animal watering.
Many of the 2005 withdrawals for livestock were esti-mated according to methods described by Lovelace (2009b), using livestock population data compiled for the NASS 2002 Census of Agriculture and water-use coefficients. In some States, such as California, these withdrawal estimates were substantially different than estimates from previous years, in part because different water-use coefficients were used.
Livestock water use is water associated with livestock watering, feedlots, dairy operations, and other on-farm needs. Livestock includes dairy cows and heifers, beef cattle and calves, sheep and lambs, goats, hogs and pigs, horses, and poultry. Other livestock water uses include cooling of facilities for the animals and animal products such as milk, dairy sanitation and wash down of facilities, animal waste-disposal systems, and incidental water losses. All withdrawals were considered freshwater and self-supplied. The livestock category excludes on-farm domestic use, lawn and garden watering, and irrigation water use.
Livestock withdrawals for 2005 are listed by State in table 8. During 2005, withdrawals were an estimated 2,140 Mgal/d, or 2,390 thousand acre-feet per year (table 2B). Livestock withdrawals were less than 1 percent of total freshwater withdrawals and 1 percent of total fresh water withdrawals excluding thermoelectric power. Groundwater was the source for 60 percent of total livestock withdrawals. Estimated total livestock withdrawals for 2005 were 8 percent less than in 2000. This comparison is based on total livestock with drawals for 2000 that included estimates for all States. Livestock water use data for the States that did not provide data for the 2000 report (Hutson and others, 2004) were estimated as the average of 1995 and 2005 data. The revised estimate of total livestock use for 2000 was 2,330 Mgal/d, of which 1,300 Mgal/d (56 percent) was groundwater and 1,030 Mgal/d was surface water.

Livestock 27
Table 8. Livestock water withdrawals, 2005. [Values may not sum to totals because of independent rounding]
State
Withdrawals (in million gallons per day)
By source
Groundwater Surface waterTotal
Alabama ....................Alaska .......................Arizona ......................Arkansas ....................California ..................
Colorado ....................Connecticut ...............Delaware ...................District of ColumbiaFlorida .......................
Georgia ......................Hawaii .......................Idaho .........................Illinois .......................Indiana .......................
Iowa ...........................Kansas .......................Kentucky ...................Louisiana ...................Maine ........................
Maryland ...................Massachusetts ...........Michigan ...................Minnesota ..................Mississippi ................
Missouri ....................Montana ....................Nebraska ...................Nevada ......................New Hampshire ........
New Jersey ................New Mexico ..............New York ..................North Carolina ..........North Dakota .............
Ohio...........................Oklahoma ..................Oregon .......................Pennsylvania .............Rhode Island .............
South Carolina ..........South Dakota .............Tennessee ..................Texas .........................Utah ...........................
Vermont .....................Virginia......................Washington................West Virginia .............Wisconsin ..................
Wyoming ...................Puerto Rico ................U.S. Virgin Islands ....
12.4.13
10.915.588.1
22.11.251.510
16.9
2.15 .75
35.837.925.6
87.284.32.314.162.07
6.211.20
17.760.47.56
19.211.688.28.51 .89
1.1447.619.493.713.6
7.7154.73.22
53.8 .18
4.6719.215.5
1628.18
6.157.04
20.91.61
65.6
6.125.71 .04
15.7 .171.67
23.3109
11.00 .130 .90
26.31.328.340
13.1
28.923.843.63.81 .70
2.95 .661.890
11.3
56.827.420.10 .30
03.05
10.432.39.01
16.410714.67.97 .01
6.6528.514.295.99.59
2.0522.89.823.387.27
10.12.08 .03
28.1 .30
12.638.8
197
33.11.251.640
17.8
28.42.07
44.137.938.7
11610845.97.972.77
9.161.86
19.660.418.9
76.139.0
1088.511.19
1.1450.729.8
12622.6
24.116217.861.8
.19
11.347.729.7
25817.8
8.2029.830.74.99
72.8
16.27.79 .07
TOTAL 1,290 846 2,140

EXPLANATION
Water withdrawals, in million gallons per day
0 to 10 10 to 5050 to 100100 to 250250 to 260
Louisiana
New Hampshire
Florida
Idaho
Washington
Oregon
Nevada
California
New Mexico
Texas
Utah
Arizona
Nebraska
North DakotaMontana
Wyoming
Colorado
Oklahoma
Kansas
South Dakota
Arkansas
Missouri
Georgia
Michigan
Iowa
Alabama
Tennessee
Mis
siss
ippi
NorthCarolina
Wisconsin
Minnesota
IndianaIllinois
Kentucky
SouthCarolina
Ohio
WestVirginia
Virginia
Massachusetts
Maine
New York
PennsylvaniaConnecticutRhode Island
Vermont
Alaska
Hawaii
MarylandDelaware
New JerseyDistrict of Columbia
Lake Superior
Lake
Mic
higa
n
Lake Ontario
Lake Erie
Lake Huron
Puerto Rico
U.S.Virgin Islands
Total withdrawals
Surface-water withdrawals Groundwater withdrawals
TOTA
L W
ITHD
RAW
ALS,
INM
ILLI
ON G
ALLO
NS
PER
DAY
WEST EAST
0
50
100
150
200
250
300
Hawaii
Alaska
Oregon
Wash
ington
California
Nevada
Idaho
Arizona
Utah
Montana
Wyo
ming
New Mexic
o
Colorado
North Dako
ta
South Dakota
NebraskaTexa
s
Kansas
Oklahoma
Minnesota
Iowa
Missouri
Louisi
ana
Arkansa
s
Wisc
onsin
Mississ
ippi
Illinois
Alabama
Tennessee
Indiana
Kentucky
Michigan
GeorgiaOhio
Florid
a
South Carolina
West
Virginia
North Carolin
a
Virginia
Pennsylva
nia
Maryland
D.C.
New York
Delaware
New Jersey
Connecticut
Vermont
Massachuse
tts
Rhode Island
New HampshireMaine
Puerto Rico
U.S. Virg
in Islands
Figure 8. Livestock withdrawals by source and State, 2005.
28 Estimated Use of Water in the United States in 2005

(Right) Trout fingerlings in hatchery on Pyramid Lake Indian Reservation, Washoe County, Nevada. Photo by Ron Nichols, USDA NRCS. (Next page) Mosaic of catfish ponds in Arkansas. Photo by Roger Bright, USDA ARS.
2 pe
rcen
t
Aquaculture 29
8,780 million gallons per dayAquaculture
Aquaculture water use is water associated with raising organisms that live in water—such as finfish and shellfish—for food, restoration, conservation, or sport. Aquaculture production occurs under controlled feed-ing, sanitation, and harvesting procedures primarily in ponds, flowthrough race-ways, and, to a lesser extent, cages, net pens, and closed-recirculation tanks. All
withdrawals were considered self-supplied. Only freshwater withdrawals were compiled as part of the total.
Freshwater withdrawals for aquaculture during 2005 are listed by State in table 9. During 2005, the estimated rate of freshwater withdrawn for aquaculture was 8,780 Mgal/d, or 9,840 thousand acre-feet per year (table 2B). Surface water was the source for about 78 percent of the with drawals for this category. Much of the surface water was used for flowthrough raceways and was returned to the source after use. Aqua-culture withdrawals were 2 percent of total water with-drawals and 4 percent of total withdrawals for all categories excluding thermoelectric power. Aquaculture withdrawals for 2000 were revised to include estimates for States that did not provide data for that year (Hutson and others, 2004). Missing data were estimated as the average of 1995 and 2005 aqua-culture estimates. The revised estimate of total aquaculture use for 2000 was 5,410 Mgal/d, of which 1,470 Mgal/d was groundwater and 3,940 Mgal/d was surface water. Estimated aquaculture withdrawals in 2005 were 62 percent larger than estimates for 2000; however, this apparent increase may be
the result of the difference in estimation methods used rather than an actual increase in withdrawals.
The geographic distribution of total, surface-water, and groundwater withdrawals for aquaculture is shown in figure 9. Idaho and North Carolina used the most water for aquaculture, about 40 percent of the total and about 50 percent of the surface-water withdrawals for aquaculture. The States of Alaska, Arkansas, Mississippi, California, Louisiana, and Idaho together accounted for 73 percent of the groundwater withdrawals for aquaculture.
Several sources of information were used to estimate 2005 aquaculture withdrawals. Some estimates of aquaculture with-drawals were derived from State permits that reported water withdrawals or return flows for aquaculture facilities. The USEPA Permit Compliance System database also was a source of return-flow data that were used to estimate water withdraw-als. State regulatory agencies, State offices of the NASS, and Cooperative Extension Service offices also provided informa-tion used to estimate aqua culture withdrawals in some States.
Many of the 2005 withdrawals for aquaculture were estimated according to methods described by Lovelace (2009a), using aquaculture data compiled for the NASS 2005 Census of Aquaculture with standardized water-use coefficients and water-replacement rates. The data included statistics for various aquacultured species and aquaculture ponds, raceways, tanks, egg incubators, pens, and cages at commercial and non-commercial aquaculture operations. In some States, such as North Carolina, these withdrawal estimates were substantially larger than estimates from previous years, in part because more aquaculture operations were included in the 2005 estimates.
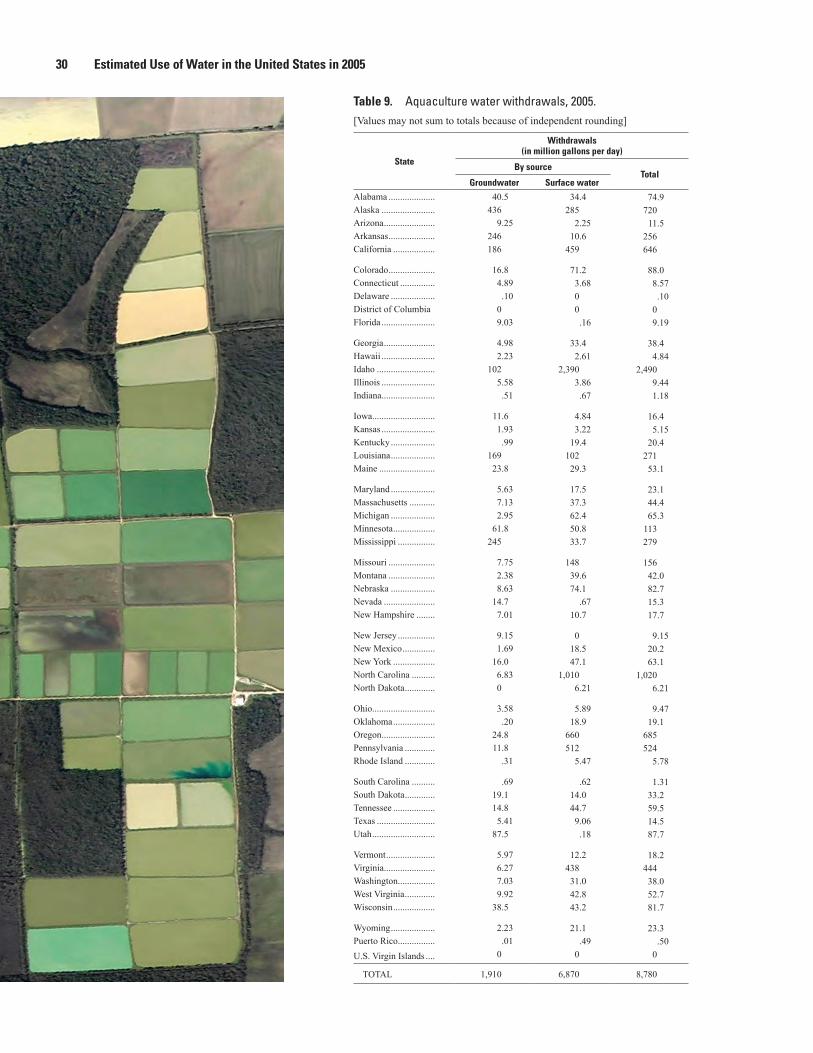
30 Estimated Use of Water in the United States in 2005
Table 9. Aquaculture water withdrawals, 2005. [Values may not sum to totals because of independent rounding]
State
Withdrawals (in million gallons per day)
By source
Groundwater Surface waterTotal
Alabama ....................Alaska .......................Arizona ......................Arkansas ....................California ..................
Colorado ....................Connecticut ...............Delaware ...................District of ColumbiaFlorida .......................
Georgia ......................Hawaii .......................Idaho .........................Illinois .......................Indiana .......................
Iowa ...........................Kansas .......................Kentucky ...................Louisiana ...................Maine ........................
Maryland ...................Massachusetts ...........Michigan ...................Minnesota ..................Mississippi ................
Missouri ....................Montana ....................Nebraska ...................Nevada ......................New Hampshire ........
New Jersey ................New Mexico ..............New York ..................North Carolina ..........North Dakota .............
Ohio...........................Oklahoma ..................Oregon .......................Pennsylvania .............Rhode Island .............
South Carolina ..........South Dakota .............Tennessee ..................Texas .........................Utah ...........................
Vermont .....................Virginia......................Washington................West Virginia .............Wisconsin ..................
Wyoming ...................Puerto Rico ................U.S. Virgin Islands ....
40.5436
9.25246186
16.84.89 .1009.03
4.982.23
1025.58 .51
11.61.93 .99
16923.8
5.637.132.95
61.8245
7.752.388.63
14.77.01
9.151.69
16.06.830
3.58 .20
24.811.8
.31
.6919.114.85.41
87.5
5.976.277.039.92
38.5
2.23 .010
34.4285
2.2510.6
459
71.23.6800 .16
33.42.61
2,3903.86 .67
4.843.22
19.410229.3
17.537.362.450.833.7
14839.674.1
.6710.7
018.547.1
1,0106.21
5.8918.9
660512
5.47
.6214.044.79.06 .18
12.243831.042.843.2
21.1 .490
74.9720
11.5256646
88.08.57 .1009.19
38.44.84
2,4909.441.18
16.45.15
20.427153.1
23.144.465.3
113279
15642.082.715.317.7
9.1520.263.1
1,0206.21
9.4719.1
685524
5.78
1.3133.259.514.587.7
18.244438.052.781.7
23.3 .500
TOTAL 1,910 6,870 8,780

EXPLANATION
Water withdrawals, in million gallons per day
0 to 1010 to 5050 to 100100 to 500500 to 2,500
Louisiana
New Hampshire
FloridaIdaho
Washington
Oregon
Nevada
California
New Mexico
Texas
Utah
Arizona
Nebraska
North DakotaMontana
Wyoming
Colorado
Oklahoma
Kansas
South Dakota
Arkansas
Missouri
Georgia
Michigan
Iowa
Alabama
Tennessee
Mis
siss
ippi
NorthCarolina
Wisconsin
Minnesota
IndianaIllinois
Kentucky
SouthCarolina
Ohio
WestVirginia
Virginia
Massachusetts
Maine
New York
PennsylvaniaConnecticutRhode Island
Vermont
Alaska
Hawaii
MarylandDelaware
New JerseyDistrict of Columbia
Lake Superior
Lake
Mic
higa
n
Lake Ontario
Lake Erie
Lake Huron
Puerto Rico
U.S.Virgin Islands
Total withdrawals
Surface-water withdrawals Groundwater withdrawals
TOTA
L W
ITHD
RAW
ALS,
INM
ILLI
ON G
ALLO
NS
PER
DAY
WEST EAST
0
500
1,000
1,500
2,000
2,500
Hawaii
Alaska
Oregon
Wash
ington
California
Nevada
Idaho
Arizona
Utah
Montana
Wyo
ming
New Mexic
o
Colorado
North Dako
ta
South Dakota
NebraskaTexa
s
Kansas
Oklahoma
Minnesota
Iowa
Missouri
Louisi
ana
Arkansa
s
Wisc
onsin
Mississ
ippi
Illinois
Alabama
Tennessee
Indiana
Kentucky
Michigan
GeorgiaOhio
Florid
a
South Carolina
West
Virginia
North Carolin
a
Virginia
Pennsylva
nia
Maryland
D.C.
New York
Delaware
New Jersey
Connecticut
Vermont
Massachuse
tts
Rhode Island
New HampshireMaine
Puerto Rico
U.S. Virg
in Islands
Figure 9. Aquaculture withdrawals by source and State, 2005.
Aquaculture 31

Large capacity well at a paper mill, St. Marys, Georgia. Photo by Alan M. Cressler, USGS.
4 pe
rcen
t
32 Estimated Use of Water in the United States in 2005
18,200 million gallons per dayIndustrial
Industrial water use includes water used for such purposes as fabricating, processing, washing, diluting, cooling, or transporting a product; incorporating water into a product; or for sanitation needs within the manufacturing facility. Some industries that use large amounts of water produce such commodities as food, paper, chemicals, refined petro-leum, or primary metals. Water for industrial use may be delivered from a public supplier or be self-supplied. In this report, industrial use refers to self-supplied industrial with-drawals only. Withdrawals were reported as freshwater or saline water. As in the 2000 report, public-supply deliveries to industrial users and consumptive use were not reported for 2005.
Industrial withdrawals are listed by State in table 10. For 2005, withdrawals were an estimated 18,200 Mgal/d, or 20,400 thousand acre-feet per year (table 2B). Industrial with-drawals were about 4 percent of total withdrawals and about 9 percent of total withdrawals for all categories excluding thermoelectric power. Surface water was the source for 83 percent of total industrial withdrawals, and 92 percent of the surface-water withdrawals for industrial use was
fresh water. Nearly all (99 percent) of the ground water with-drawals for industrial use also were freshwater. For 2005, total industrial with drawals were 8 percent less than during 2000.
The geographic distribution of total, total surface-water, and total groundwater withdrawals for industrial use is shown in figure 10. Louisiana, Indiana, and Texas accounted for 40 percent of total industrial withdrawals and 43 percent of the total fresh surface-water withdrawals. Texas accounted for 62 percent of the saline surface-water withdrawals for industry, mostly from areas along the Gulf coast. The largest fresh groundwater withdrawals were in Louisiana and Georgia, which together accounted for 16 percent of the total fresh groundwater withdrawals for industrial use. Most of the saline groundwater used for industry was from counties in the vicinity of the Great Salt Lake in Utah.
Sources of data for industrial water use included individual facilities and State or Federal permit programs that require reporting of industrial withdrawals or return flows. Industrial withdrawals also were estimated using employment numbers classified by industry group and per employee water-use coefficients.

Industrial 33
Table 10. Industrial self-supplied water withdrawals, 2005. [Values may not sum to totals because of independent rounding]
State
Withdrawals (in million gallons per day)By source and type
TotalGroundwater Surface water
Fresh Saline Total Fresh Saline Total Fresh Saline TotalAlabama .................... 27.6 0 27.6 523 0 523 550 0 550Alaska ....................... 4.14 0 4.14 4.02 4.10 8.12 8.16 4.10 12.3Arizona ...................... 22.4 0 22.4 0 0 0 22.4 0 22.4Arkansas .................... 65.8 0 65.8 113 0 113 178 0 178California .................. 62.3 0 62.3 9.90 23.4 33.3 72.2 23.4 95.7
Colorado .................... 3.61 0 3.61 139 0 139 142 0 142Connecticut ............... 7.02 0 7.02 60.6 38.5 99.0 67.6 38.5 106Delaware ................... 11.6 0 11.6 29.7 0 29.7 41.4 0 41.4District of Columbia 0 0 0 0 0 0 0 0 0Florida ....................... 181 0 181 62.5 1.19 63.6 243 1.19 244
Georgia ...................... 240 0 240 291 22.6 314 532 22.6 554Hawaii ....................... 29.2 1.73 31.0 0 0 0 29.2 1.73 31.0Idaho ......................... 41.1 0 41.1 22.1 0 22.1 63.2 0 63.2Illinois ....................... 128 0 128 236 0 236 364 0 364Indiana ....................... 86.9 0 86.9 2,110 0 2,110 2,200 0 2,200
Iowa ........................... 177 0 177 12.3 0 12.3 190 0 190Kansas ....................... 35.5 0 35.5 6.34 0 6.34 41.9 0 41.9Kentucky ................... 48.1 0 48.1 138 0 138 186 0 186Louisiana ................... 265 0 265 2,840 0 2,840 3,110 0 3,110Maine ........................ 8.61 0 8.61 161 17.8 179 170 17.8 187
Maryland ................... 14.2 0 14.2 45.5 191 237 59.7 191 251Massachusetts ........... 15.6 0 15.6 96.7 0 96.7 112 0 112Michigan ................... 89.1 0 89.1 540 0 540 629 0 629Minnesota .................. 65.5 0 65.5 73.0 0 73.0 139 0 139Mississippi ................ 76.9 0 76.9 120 0 120 197 0 197
Missouri .................... 37.4 0 37.4 43.6 0 43.6 80.9 0 80.9Montana .................... 37.4 0 37.4 29.6 0 29.6 67.0 0 67.0Nebraska ................... 11.3 0 11.3 .01 0 .01 11.3 0 11.3Nevada ...................... .70 0 .70 5.20 0 5.20 5.90 0 5.90New Hampshire ........ 5.65 0 5.65 35.9 0 35.9 41.5 0 41.5
New Jersey ................ 46.2 0 46.2 39.8 0 39.8 86.0 0 86.0New Mexico .............. 11.5 0 11.5 1.72 0 1.72 13.2 0 13.2New York .................. 161 0 161 140 0 140 301 0 301North Carolina .......... 171 0 171 223 0 223 394 0 394North Dakota ............. 5.00 0 5.00 9.70 0 9.70 14.7 0 14.7
Ohio........................... 149 0 149 554 0 554 703 0 703Oklahoma .................. 8.04 0 8.04 16.0 0 16.0 24.1 0 24.1Oregon ....................... 8.95 0 8.95 164 0 164 172 0 172Pennsylvania ............. 66.1 0 66.1 704 0 704 770 0 770Rhode Island ............. .50 0 .50 0 0 0 .50 0 .50
South Carolina .......... 32.4 0 32.4 386 0 386 419 0 419South Dakota ............. 4.31 0 4.31 .10 0 .10 4.41 0 4.41Tennessee .................. 45.6 0 45.6 738 0 738 783 0 783Texas ......................... 187 0 187 1,060 716 1,780 1,250 716 1,960Utah ........................... 20.6 35.1 55.7 14.7 92.4 107 35.4 127 163
Vermont ..................... 1.81 0 1.81 6.14 0 6.14 7.95 0 7.95Virginia...................... 106 0 106 421 8.52 430 527 8.52 536Washington................ 107 0 107 346 33.2 379 454 33.2 487West Virginia ............. 54.4 0 54.4 911 0 911 966 0 966Wisconsin .................. 70.9 0 70.9 400 0 400 471 0 471
Wyoming ................... 4.12 0 4.12 1.92 0 1.92 6.04 0 6.04Puerto Rico ................ 9.41 0 9.41 0 0 0 9.41 0 9.41U.S. Virgin Islands .... .26 0 .26 3.03 0 3.03 3.29 0 3.29
TOTAL 3,070 36.8 3,110 13,900 1,150 15,000 17,000 1,190 18,200

Figure 10. Industrial withdrawals by source and State, 2005.
EXPLANATION
Water withdrawals, in million gallons per day
0 to 100100 to 300300 to 600600 to 1,5001,500 to 3,200
Louisiana
New Hampshire
FloridaIdaho
Washington
Oregon
Nevada
California
New Mexico
Texas
Utah
Arizona
Nebraska
North DakotaMontana
Wyoming
Colorado
Oklahoma
Kansas
South Dakota
Arkansas
Missouri
Georgia
Michigan
Iowa
Alabama
Tennessee
Mis
siss
ippi
NorthCarolina
Wisconsin
Minnesota
IndianaIllinois
Kentucky
SouthCarolina
Ohio
WestVirginia
Virginia
Massachusetts
Maine
New York
PennsylvaniaConnecticutRhode Island
Vermont
Alaska
Hawaii
Maryland
District of ColumbiaDelaware
New Jersey
Lake Superior
Lake
Mic
higa
n
Lake Ontario
Lake Erie
Lake Huron
Puerto Rico
U.S.Virgin Islands
Total withdrawals
Surface-water withdrawals Groundwater withdrawals
WEST EAST
Hawaii
Alaska
Oregon
Wash
ington
California
Nevada
Idaho
Arizona
Utah
Montana
Wyo
ming
New Mexic
o
Colorado
North Dako
ta
South Dakota
NebraskaTexa
s
Kansas
Oklahoma
Minnesota
Iowa
Missouri
Louisi
ana
Arkansa
s
Wisc
onsin
Mississ
ippi
Illinois
Alabama
Tennessee
Indiana
Kentucky
Michigan
GeorgiaOhio
Florid
a
South Carolina
West
Virginia
North Carolin
a
Virginia
Pennsylva
nia
Maryland
D.C.
New York
Delaware
New Jersey
Connecticut
Vermont
Massachuse
tts
Rhode Island
New HampshireMaine
Puerto Rico
U.S. Virg
in Islands
TOTA
L W
ITHD
RAW
ALS,
INM
ILLI
ON G
ALLO
NS
PER
DAY
0
500
1,000
1,500
2,000
2,500
3,000
3,500
34 Estimated Use of Water in the United States in 2005

Dredge in limerock quarry, Miami–Dade County, Florida. Photo by Richard L. Marella, USGS.
1 pe
rcen
t
Mining 35
4,020 million gallons per dayMining
Mining water use is water used for the extraction of minerals that may be in the form of solids, such as coal, iron, sand, and gravel; liquids, such as crude petroleum; and gases, such as natural gas. The category includes quarrying, milling (crushing, screening, washing, and flotation of mined mate-rials), re-injecting extracted water for secondary oil recovery, and other operations associated with mining activities. All mining withdrawals were considered self-supplied. Water withdrawals were reported as freshwater or saline water. Dewatering was not reported as a mining withdrawal unless the water was used beneficially, such as damp-ening roads for dust control.
Mining withdrawals during 2005 are listed by State in table 11. During 2005, an estimated 4,020 Mgal/d, or 4,510 thousand acre-feet per year (table 2B), were withdrawn. Mining withdrawals were about 1 percent of total with drawals and about 2 percent of total withdrawals for all categories excluding thermoelectric power. Ground water was the source for 63 percent of total with drawals for mining. Sixty percent of the ground-water withdrawals for mining were saline. Most of the surface-water with-drawals (87 percent) were fresh water. Saline groundwater with drawals and fresh surface-water withdrawals together represented 70 percent of the total with drawals for mining.
Mining withdrawals for 2000 were revised to include estimates for States that did not provide data for that year (Hutson and others, 2004). Missing data were estimated as the average of 1995 and 2005 mining estimates. The revised estimate of total mining use for 2000 was 4,500 Mgal/d, of which 2,700 Mgal/d was groundwater and 1,800 Mgal/d was surface water.
Total mining withdrawals in 2005 were 11 percent smaller than in 2000. Groundwater withdrawals were 6 percent smaller, and surface-water withdrawals were 18 percent smaller. Freshwater mining withdrawals of 2,310 Mgal/d in 2005 were almost 20 percent smaller than the 2,870 Mgal/d estimated for 2000. Saline-water mining withdrawals of 1,710 Mgal/d in 2005 were almost 5 percent larger than the 1,630 Mgal/d estimated for 2000.
About 52 percent (1,390 Mgal/d) of groundwater mining withdrawals were considered saline in 2000; in 2005 about
60 percent (1,520 Mgal/d) of groundwater mining with-drawals were considered saline. Estimated surface-water mining withdrawals that were considered saline decreased from 238 Mgal/d in 2000 to 190 Mgal/d in 2005, but in both years saline surface water represented 13 percent of the total surface water used for mining.
The geographic distribution of total, total freshwater, and total saline-water with drawals for mining water use is shown in figure 11. Texas, Minnesota, and California accounted for 34 percent of the total with drawals for mining. Sand and gravel operations in Indiana and iron ore mining in Michigan and Minnesota accounted for the largest fresh surface-water with-drawals. Mineral salt extraction from the Great Salt Lake in Utah accounted for the largest saline surface-water with drawals for mining in the United States. Florida, Ohio, Nevada, Arizona, and Pennsylvania accounted for 52 percent of fresh groundwater withdrawals. Gas and oil operations in Texas, California, Oklahoma, Wyoming, and Louisiana were responsible for the large saline groundwater withdrawals in those States, because saline water is a byproduct of mining operations.
Sources of data used to estimate water use for mining included surveys of mining operations and State and Federal agencies that collect water withdrawal, discharge, or mineral production data for
mining operations. Many of the 2005 withdrawals for mining were estimated using mineral production data and water-use coefficients in gallons per weight or volume of minerals produced. Production data for nonfuel minerals, including metals and nonmetallic minerals, were obtained from the USGS Minerals Information Team. Production or water-injection data for fuel minerals, including coal, petroleum, and natural gas, were obtained from the Energy Information Adminis tration and various State agencies. In some States, these withdrawal estimates were substantially different from estimates from previous years because of the estimation techniques used. Additional information on these data sources and estimation methods is given in the report “Methods for estimating water withdrawals for mining in the United States, 2005” (Lovelace, 2009c).

36 Estimated Use of Water in the United States in 2005
Table 11. Mining water withdrawals, 2005. [Values may not sum to totals because of independent rounding]
State
Withdrawals (in million gallons per day)By source and type
TotalGroundwater Surface water
Fresh Saline Total Fresh Saline Total Fresh Saline TotalAlabama .................... 19.6 0 19.6 8.26 0 8.26 27.8 0 27.8Alaska ....................... 0 114 114 22.2 60.9 83.1 22.2 175 198Arizona ...................... 91.6 2.61 94.2 9.05 0 9.05 101 2.61 103Arkansas .................... .24 0 .24 1.05 0 1.05 1.29 0 1.29California .................. 34.5 255 289 18.6 .29 18.9 53.1 255 308
Colorado .................... 5.20 14.6 19.8 1.24 .39 1.63 6.44 15.0 21.4Connecticut ............... .67 0 .67 2.73 0 2.73 3.40 0 3.40Delaware ................... .80 0 .80 .75 .01 .76 1.55 .01 1.56District of Columbia 0 0 0 0 0 0 0 0 0Florida ....................... 138 0 138 56.9 0 56.9 195 0 195
Georgia ...................... 48.9 0 48.9 .47 0 .47 49.4 0 49.4Hawaii ....................... 1.42 0 1.42 .44 0 .44 1.86 0 1.86Idaho ......................... 2.16 0 2.16 22.0 0 22.0 24.2 0 24.2Illinois ....................... 15.5 25.5 41.0 71.2 0 71.2 86.7 25.5 112Indiana ....................... 4.70 0 4.70 95.5 0 95.5 100 0 100
Iowa ........................... 3.23 0 3.23 44.2 0 44.2 47.4 0 47.4Kansas ....................... 10.1 0 10.1 4.64 0 4.64 14.8 0 14.8Kentucky ................... 7.89 0 7.89 28.7 0 28.7 36.6 0 36.6Louisiana ................... 6.11 151 157 20.8 0 20.8 26.9 151 178Maine ........................ 1.50 0 1.50 5.26 0 5.26 6.76 0 6.76
Maryland ................... 9.05 0 9.05 4.17 0 4.17 13.2 0 13.2Massachusetts ........... 2.96 0 2.96 7.77 0 7.77 10.7 0 10.7Michigan ................... 13.2 .94 14.1 81.4 0 81.4 94.6 .94 95.5Minnesota .................. 8.05 0 8.05 418 0 418 426 0 426Mississippi ................ 11.3 0 11.3 .61 0 .61 11.9 0 11.9
Missouri .................... 22.9 0 22.9 11.8 0 11.8 34.7 0 34.7Montana .................... 1.20 5.12 6.32 34.2 0 34.2 35.4 5.12 40.5Nebraska ................... .08 .09 .17 10.2 0 10.2 10.3 .09 10.4Nevada ...................... 99.1 0 99.1 0 0 0 99.1 0 99.1New Hampshire ........ .02 0 .02 3.74 0 3.74 3.76 0 3.76
New Jersey ................ .91 0 .91 37.4 0 37.4 38.3 0 38.3New Mexico .............. 57.4 0 57.4 1.29 0 1.29 58.7 0 58.7New York .................. 6.94 .42 7.36 25.9 .42 26.4 32.9 .84 33.7North Carolina .......... 35.0 0 35.0 11.0 0 11.0 46.1 0 46.1North Dakota ............. 5.26 0 5.26 .40 0 .40 5.66 0 5.66
Ohio........................... 112 0 112 61.7 0 61.7 174 0 174Oklahoma .................. 1.01 190 191 1.67 0 1.67 2.68 190 193Oregon ....................... 13.9 0 13.9 2.09 0 2.09 16.0 0 16.0Pennsylvania ............. 84.9 0 84.9 10.8 0 10.8 95.7 0 95.7Rhode Island ............. .59 0 .59 1.12 0 1.12 1.71 0 1.71
South Carolina .......... 8.56 0 8.56 .50 0 .50 9.06 0 9.06South Dakota ............. 4.55 0 4.55 5.93 0 5.93 10.5 0 10.5Tennessee .................. 10.4 0 10.4 11.4 0 11.4 21.7 0 21.7Texas ......................... 26.8 548 575 64.2 0 64.2 91.0 548 639Utah ........................... 3.73 33.7 37.4 1.41 128 130 5.14 162 167
Vermont ..................... .24 0 .24 3.55 0 3.55 3.79 0 3.79Virginia...................... 2.47 0 2.47 27.3 0 27.3 29.8 0 29.8Washington................ 22.4 0 22.4 4.14 0 4.14 26.6 0 26.6West Virginia ............. 4.71 .51 5.22 9.44 0 9.44 14.2 .51 14.7Wisconsin .................. 17.6 0 17.6 14.9 0 14.9 32.5 0 32.5
Wyoming ................... 38.3 177 216 13.5 0 13.5 51.8 177 229Puerto Rico ................ 1.76 .34 2.10 .22 0 .22 1.98 .34 2.32
U.S. Virgin Islands .... 0 0 0 0 .02 .02 0 .02 .02
TOTAL 1,020 1,520 2,540 1,300 190 1,490 2,310 1,710 4,020

Figure 11. Mining withdrawals by water quality and State, 2005.
0 to 1010 to 5050 to 100100 to 200200 to 640
EXPLANATIONWater withdrawals, in million gallons per day
WEST EAST
Hawaii
Alaska
Oregon
Wash
ington
California
Nevada
Idaho
Arizona
Utah
Montana
Wyo
ming
New Mexic
o
Colorado
North Dako
ta
South Dakota
NebraskaTexa
s
Kansas
Oklahoma
Minnesota
Iowa
Missouri
Louisi
ana
Arkansa
s
Wisc
onsin
Mississ
ippi
Illinois
Alabama
Tennessee
Indiana
Kentucky
Michigan
GeorgiaOhio
Florid
a
South Carolina
West
Virginia
North Carolin
a
Virginia
Pennsylva
nia
Maryland
D.C.
New York
Delaware
New Jersey
Connecticut
Vermont
Massachuse
tts
Rhode Island
New HampshireMaine
Puerto Rico
U.S. Virg
in Islands
TOTA
L W
ITHD
RAW
ALS,
INM
ILLI
ON G
ALLO
NS
PER
DAY
0
100
200
300
400
500
600
700
Louisiana
New Hampshire
FloridaIdaho
Washington
Oregon
Nevada
California
New Mexico
Texas
Utah
Arizona
Nebraska
North DakotaMontana
Wyoming
Colorado
Oklahoma
Kansas
South Dakota
Arkansas
Missouri
Georgia
Michigan
Iowa
Alabama
Tennessee
Mis
siss
ippi
NorthCarolina
Wisconsin
Minnesota
IndianaIllinois
Kentucky
SouthCarolina
Ohio
WestVirginia
Virginia
Massachusetts
Maine
New York
PennsylvaniaConnecticutRhode Island
Vermont
Alaska
Hawaii
Maryland
District of ColumbiaDelaware
New Jersey
Lake Superior
Lake
Mic
higa
n
Lake Ontario
Lake Erie
Lake Huron
Puerto Rico
U.S.Virgin Islands
Total withdrawals
Freshwater withdrawals Saline-water withdrawals
Mining 37

49 p
erce
nt
38 Estimated Use of Water in the United States in 2005
201,000 million gallons per dayThermoelectric Power
Water for thermoelectric power is used in generating electricity with steam-driven turbine generators. Thermo-electric-power water withdrawals were compiled by cooling-system type rather than by fuel type as had been done in compilations previous to 2000. Cooling-system type is the primary determinant for the amount of consumptive use rela-tive to withdrawals. Once-through (also known as open-loop) cooling refers to cooling systems in which water is withdrawn from a source, circulated through heat exchangers, and then returned to a surface-water body. Large amounts of water are needed for once-through cooling, but consumptive use is a small percentage of the total withdrawn (Solley and others, 1998). Recirculation (also known as closed-loop) cooling refers to cooling systems in which water is withdrawn from a source, circulated through heat exchangers, cooled using ponds or towers, and then recirculated. Subsequent water withdrawals for a recirculation system are used to replace water lost to evaporation, blowdown, drift, and leakage. Smaller amounts of water are withdrawn for recirculation cooling than for once-through cooling, but the consumptive use is a larger percentage of the amount withdrawn. Thermo-electric-power with drawals were reported as freshwater or saline water. For 2005, public-supply deliveries to thermo-electric plants were not reported.
Thermoelectric-power withdrawals and net power genera-tion are listed by State in table 12. The total quantity of water withdrawn for thermoelectric power for 2005 was an esti-mated 201,000 Mgal/d or 225,000 thousand acre-feet per year (table 2B). Surface water was the source for 99 percent of total thermoelectric-power with drawals, and 28 percent of the surface water was saline. Saline surface-water with drawals accounted for 93 percent of total saline with drawals for all categories. Thermoelectric-power with drawals accounted for 49 percent of total water use, 41 percent of total freshwater withdrawals, and 53 percent of fresh surface-water with-drawals for all categories. Estimates of total withdrawals for thermoelectric-power generation were about 3 percent larger for 2005 than for 2000; however, freshwater withdrawals increased by 7 percent, whereas saline withdrawals decreased 4 percent. Net power generation associated with self-supplied thermoelectric-power water withdrawals amounted to 3,190,000 gigawatt-hours in 2005. On average, about 23 gal-lons of water were used to produce 1 kilowatt-hour of energy.
The geographic distribution of total, total freshwater, and total saline-water withdrawals for thermoelectric power is shown in figure 12. The largest total thermoelectric with-drawals were in California, where nearly all the water used for cooling purposes was saline. Illinois, Texas, Michigan, and Tennessee together accounted for 28 percent of fresh-water withdrawals for thermoelectric power. California and Florida accounted for 41 percent of saline withdrawals for
thermoelectric power. Hawaii accounted for nearly all of the saline groundwater used for thermoelectric power in 2005. Saline groundwater withdrawals for this category were not included in the tables for 2000, but the withdrawals have been restored to the national totals for 2005. Prior to 2000, saline thermoelectric withdrawals for Hawaii were classified as surface water.
The Eastern States (see division line in figure 12) accounted for 84 percent of total thermoelectric withdrawals. This pattern of withdrawals exists partly because the power-production infrastructure in these areas was established along major rivers, the Great Lakes, and the coast in order to meet electricity demand. Most of these withdrawals are associated with once-through thermoelectric power plants. In contrast, many Western States use hydroelectric-power generation to supply a substantial part of the demand for electricity. More than one-half of the 246,000 gigawatt-hours of hydroelectric power produced by public utilities in 2005 was in Washington, Oregon, and California (U.S. Department of Energy, 2009). Almost all of the energy produced in Idaho was from hydro-electric generation. Hydroelectric-power generation, an instream use, is not included in this report.
Thermoelectric-power withdrawals are listed by cooling-system type and by State in table 13. Power plants equipped with once-through cooling systems accounted for 92 percent of water withdrawals for thermoelectric power, and plants equipped with recirculating systems withdrew the remaining 8 percent of the water. Cooling technologies that require less water allow for the production of thermoelectric power in areas where water is scarce or strictly managed. Such water-scarce States as Nevada, New Mexico, and Utah used recir-culating cooling systems rather than the more water-intensive once-through cooling systems. During 2005, about 81 percent of the generating units using recirculating cooling systems reported consumptive-use rates of 50 percent or greater (U.S. Department of Energy, 2006a and 2006b).
Reclaimed wastewater is a source of water for thermo-electric-power generation, especially in States with arid climates or otherwise limited water resources. Arizona, California, Florida, and Texas are among the States that use significant quantities of reclaimed wastewater for thermo-electric-power generation (Veil, 2007). In Arizona, about 59 Mgal/d of reclaimed wastewater was associated with thermoelectric-power generation. Reclaimed wastewater is not included in the thermoelectric-power data tables or national totals for this report.
Sources of data for thermoelectric-power water use included individual facilities, State permitting or regula-tory agencies, and the USDOE EIA. Generally, relatively complete files on water withdrawals and power generation were maintained by these entities.

Thermoelectric Power 39
Table 12. Thermoelectric-power water withdrawals, 2005. [Values may not sum to totals because of independent rounding]
State
Withdrawals (in million gallons per day) Power generated (in million
kilowatt hours)
By source and typeTotal
Groundwater Surface waterFresh Saline Total Fresh Saline Total Fresh Saline Total
Alabama .................... 0.22 0 0.22 8,270 0 8,270 8,270 0 8,270 114,000Alaska ....................... 2.15 0 2.15 31.4 0 31.4 33.6 0 33.6 1,530Arizona ...................... 50.5 0 50.5 39.4 0 39.4 89.9 0 89.9 82,500Arkansas .................... .93 0 .93 2,000 0 2,000 2,000 0 2,000 41,300California .................. 9.84 0 9.84 39.7 12,600 12,600 49.6 12,600 12,600 56,200
Colorado .................... 6.50 0 6.50 117 0 117 123 0 123 38,200Connecticut ............... .08 0 .08 207 2,870 3,070 207 2,870 3,070 23,600Delaware ................... .32 0 .32 422 383 804 422 383 805 6,250District of Columbia 0 0 0 9.70 0 9.70 9.70 0 9.70 166Florida ....................... 16.9 3.26 20.2 541 11,500 12,000 558 11,500 12,000 186,000
Georgia ...................... 3.76 0 3.76 2,680 36.9 2,720 2,680 36.9 2,720 122,000Hawaii ....................... 37.8 1,450 1,480 0 0 0 37.8 1,450 1,480 7,300Idaho ......................... 1.10 0 1.10 0 0 0 1.10 0 1.10 462Illinois ....................... 7.20 0 7.20 12,300 0 12,300 12,400 0 12,400 188,000Indiana ....................... 12.6 0 12.6 6,040 0 6,040 6,050 0 6,050 120,000
Iowa ........................... 25.5 0 25.5 2,510 0 2,510 2,530 0 2,530 38,500Kansas ....................... 13.4 0 13.4 445 0 445 459 0 459 45,100Kentucky ................... 5.14 0 5.14 3,420 0 3,420 3,430 0 3,430 92,600Louisiana ................... 97.4 0 97.4 6,180 0 6,180 6,280 0 6,280 61,900Maine ........................ .53 0 .53 99.0 121 220 99.5 121 221 6,360
Maryland ................... 1.77 0 1.77 436 5,950 6,390 438 5,950 6,390 34,000Massachusetts ........... 0 0 0 107 2,340 2,440 107 2,340 2,440 23,800Michigan ................... 4.07 0 4.07 9,140 0 9,140 9,150 0 9,150 117,000Minnesota .................. 2.41 0 2.41 2,440 0 2,440 2,450 0 2,450 45,500Mississippi ................ 37.3 0 37.3 317 82.6 400 355 82.6 437 32,800
Missouri .................... 21.0 0 21.0 6,160 0 6,160 6,180 0 6,180 89,600Montana .................... .25 0 .25 89.6 0 89.6 89.9 0 89.9 18,400Nebraska ................... 7.86 0 7.86 3,540 0 3,540 3,550 0 3,550 30,400Nevada ...................... 15.9 0 15.9 21.0 0 21.0 36.8 0 36.8 22,400New Hampshire ........ .99 0 .99 228 885 1,110 229 885 1,110 15,500
New Jersey ................ 1.59 .01 1.60 662 5,460 6,120 663 5,460 6,120 47,000New Mexico .............. 10.4 0 10.4 45.5 0 45.5 55.9 0 55.9 33,600New York .................. 0 0 0 7,140 4,880 12,000 7,140 4,880 12,000 93,600North Carolina .......... .14 0 .14 8,340 1,550 9,890 8,350 1,550 9,890 115,000North Dakota ............. 0 0 0 1,060 0 1,060 1,060 0 1,060 30,200
Ohio........................... 22.5 0 22.5 8,910 0 8,910 8,930 0 8,930 147,000Oklahoma .................. 1.25 0 1.25 163 0 163 164 0 164 48,700Oregon ....................... .88 0 .88 7.57 0 7.57 8.45 0 8.45 8,410Pennsylvania ............. 4.39 0 4.39 6,420 .75 6,420 6,430 .75 6,430 202,000Rhode Island ............. 0 0 0 1.44 264 266 1.44 264 266 55,300
South Carolina .......... 5.58 0 5.58 6,530 0 6,530 6,540 0 6,540 90,500South Dakota ............. .72 0 .72 3.97 0 3.97 4.69 0 4.69 3,270Tennessee .................. 0 0 0 8,940 0 8,940 8,940 0 8,940 80,400Texas ......................... 55.8 0 55.8 9,620 1,860 11,500 9,680 1,860 11,500 222,000Utah ........................... 13.4 4.18 17.6 44.6 0 44.6 58.0 4.18 62.2 38,200
Vermont ..................... .26 0 .26 421 0 421 421 0 421 4,710Virginia...................... 3.07 0 3.07 4,910 3,510 8,420 4,920 3,510 8,420 78,500Washington................ 0 0 0 456 0 456 456 0 456 19,800West Virginia ............. .20 0 .20 3,550 0 3,550 3,550 0 3,550 86,800Wisconsin .................. 3.37 0 3.37 6,890 0 6,890 6,900 0 6,900 56,600
Wyoming ................... 1.32 0 1.32 221 0 221 223 0 223 46,300Puerto Rico ................ 1.39 0 1.39 1.42 2,290 2,290 2.81 2,290 2,290 21,300
U.S. Virgin Islands .... 0 0 0 .18 129 129 .18 129 129 921
TOTAL 510 1,450 1,960 142,000 56,700 199,000 143,000 58,100 201,000 3,190,000

Total withdrawals
Freshwater withdrawals Saline-water withdrawals
Louisiana
New Hampshire
Florida
Idaho
Washington
Oregon
Nevada
California
New Mexico
Texas
Utah
Arizona
Nebraska
North DakotaMontana
Wyoming
Colorado
Oklahoma
Kansas
South Dakota
Arkansas
Missouri
Georgia
Michigan
Iowa
Alabama
Tennessee
Mis
siss
ippi
NorthCarolina
Wisconsin
Minnesota
IndianaIllinois
Kentucky
SouthCarolina
Ohio
WestVirginia
Virginia
Massachusetts
Maine
New York
PennsylvaniaConnecticutRhode Island
Vermont
Alaska
Hawaii
MarylandDelaware
New JerseyDistrict of Columbia
Lake Superior
Lake
Mic
higa
n
Lake Ontario
Lake Erie
Lake Huron
Puerto Rico
U.S.Virgin Islands
West–eastdivision forthis report
TOTA
L W
ITHD
RAW
ALS,
INM
ILLI
ON G
ALLO
NS
PER
DAY
WEST EAST
Hawaii
Alaska
Oregon
Wash
ington
California
Nevada
Idaho
Arizona
Utah
Montana
Wyo
ming
New Mexic
o
Colorado
North Dako
ta
South Dakota
NebraskaTexa
s
Kansas
Oklahoma
Minnesota
Iowa
Missouri
Louisi
ana
Arkansa
s
Wisc
onsin
Mississ
ippi
Illinois
Alabama
Tennessee
Indiana
Kentucky
Michigan
GeorgiaOhio
Florid
a
South Carolina
West
Virginia
North Carolin
a
Virginia
Pennsylva
nia
Maryland
D.C.
New York
Delaware
New Jersey
Connecticut
Vermont
Massachuse
tts
Rhode Island
New HampshireMaine
Puerto Rico
U.S. Virg
in Islands
0
2,000
4,000
6,000
8,000
10,000
12,000
14,000
EXPLANATION
Water withdrawals, in million gallons per day
0Greater than 0 to 2,0002,000 to 4,0004,000 to 6,0006,000 to 9,0009,000 to 13,000
Figure 12. Thermoelectric-power withdrawals by water quality and State, 2005.
40 Estimated Use of Water in the United States in 2005

Thermoelectric Power 41
Table 13. Thermoelectric-power water withdrawals by cooling type, 2005. [Values may not sum to totals because of independent rounding. All values are in million gallons per day]
State
Withdrawals for once-through cooling Withdrawals for recirculation coolingBy source and type
TotalBy source and type
TotalGroundwater Surface water Groundwater Surface waterFresh Saline Fresh Saline Fresh Saline Fresh Saline
Alabama .................... 0.05 0 8,100 0 8,100 0.17 0 178 0 178Alaska ....................... 0 0 31.4 0 31.4 2.15 0 0 0 2.15Arizona ...................... 5.13 0 0 0 5.13 45.3 0 39.4 0 84.8Arkansas .................... .43 0 1,580 0 1,580 .50 0 420 0 420California .................. 0 0 0 12,600 12,600 9.84 0 39.7 0 49.6
Colorado .................... .01 0 71.2 0 71.2 6.49 0 45.5 0 52.0Connecticut ............... 0 0 196 2,870 3,060 .08 0 10.9 0 11.0Delaware ................... 0 0 417 374 791 .32 0 4.74 8.40 13.5District of Columbia 0 0 0 0 0 0 0 9.70 0 9.70Florida ....................... 2.15 3.26 492 11,300 11,800 14.8 0 49.1 140 204
Georgia ...................... 2.67 0 2,270 36.9 2,310 1.09 0 411 0 412Hawaii ....................... 25.3 1,450 0 0 1,470 12.5 0 0 0 12.5Idaho ......................... 0 0 0 0 0 1.10 0 0 0 1.10Illinois ....................... .66 0 11,800 0 11,800 6.54 0 594 0 601Indiana ....................... 4.27 0 5,360 0 5,360 8.36 0 675 0 683
Iowa ........................... 13.6 0 2,490 0 2,500 11.9 0 18.8 0 30.7Kansas ....................... .17 0 412 0 412 13.2 0 33.1 0 46.4Kentucky ................... 0 0 757 0 757 5.14 0 2,670 0 2,670Louisiana ................... 0 0 4,510 0 4,510 97.4 0 1,670 0 1,760Maine ........................ 0 0 97.3 121 219 .53 0 1.69 0 2.22
Maryland ................... 1.77 0 429 5,940 6,370 0 0 7.63 14.8 22.4Massachusetts ........... 0 0 107 2,340 2,440 0 0 0 .45 .45Michigan ................... 4.07 0 9,140 0 9,150 0 0 0 0 0Minnesota .................. 1.60 0 1,540 0 1,540 .81 0 906 0 907Mississippi ................ 1.87 0 315 82.6 400 35.4 0 2.17 0 37.6
Missouri .................... 3.29 0 6,140 0 6,140 17.7 0 23.0 0 40.8Montana .................... 0 0 61.1 0 61.1 .25 0 28.5 0 28.8Nebraska ................... 1.67 0 3,540 0 3,540 6.19 0 .01 0 6.20Nevada ...................... 0 0 0 0 0 15.9 0 21.0 0 36.8New Hampshire ........ .33 0 227 885 1,110 .66 0 .94 0 1.60
New Jersey ................ 1.26 0 662 5,190 5,850 .33 .01 0 273 273New Mexico .............. 0 0 0 0 0 10.4 0 45.5 0 55.9New York .................. 0 0 7,140 4,880 12,000 0 0 0 0 0North Carolina .......... 0 0 6,690 1,550 8,230 .14 0 1,660 0 1,660North Dakota ............. 0 0 1,040 0 1,040 0 0 26.5 0 26.5
Ohio........................... 16.7 0 8,550 0 8,570 5.81 0 360 0 366Oklahoma .................. 0 0 27.5 0 27.5 1.25 0 135 0 137Oregon ....................... 0 0 0 0 0 .88 0 7.57 0 8.45Pennsylvania ............. .40 0 4,100 .75 4,100 3.99 0 2,320 0 2,330Rhode Island ............. 0 0 0 264 264 0 0 1.44 0 1.44
South Carolina .......... .03 0 5,660 0 5,660 5.55 0 878 0 883South Dakota ............. 0 0 0 0 0 .72 0 3.97 0 4.69Tennessee .................. 0 0 8,750 0 8,750 0 0 188 0 188Texas ......................... 0 0 8,180 1,830 10,000 55.8 0 1,450 35.2 1,540Utah ........................... 0 0 0 0 0 13.4 4.18 44.6 0 62.2
Vermont ..................... 0 0 421 0 421 .26 0 .28 0 .54Virginia...................... 1.51 0 4,720 3,510 8,220 1.56 0 197 0 199Washington................ 0 0 425 0 425 0 0 30.2 0 30.2West Virginia ............. 0 0 3,410 0 3,410 .20 0 145 0 145Wisconsin .................. 0 0 6,890 0 6,890 3.37 0 0 0 3.37
Wyoming ................... 0 0 162 0 162 1.32 0 59.6 0 60.9Puerto Rico ................ 1.39 0 1.42 2,290 2,290 0 0 0 0 0
U.S. Virgin Islands .... 0 0 .18 129 129 0 0 0 0 0
TOTAL 90.3 1,450 127,000 56,200 185,000 419 4.19 15,400 472 16,300

The historic Chicago water tower housed a standpipe for the city water system from 1869 –1911 and survived the Great Chicago Fire of 1871. It now serves as a tourist information center. Photo by Nancy L. Barber, USGS.
42 Estimated Use of Water in the United States in 2005
Trends in Water Use, 1950 –2005
The USGS has conducted water-use compilations every 5 years since 1950. A summary of population growth and withdrawal estimates by category and source of water is given in table 14 for each 5-year period from 1950 through 2005. These trends are shown graphically for freshwater uses in figure 13 and total uses in figure 14.
Some categories of water use have been presented differently over the 55-year span of these compilations. To the extent possible, individual category with-drawals are shown in table 14. For example, self-supplied domestic and livestock with-drawals are shown separately for each year, although theses uses were combined as “rural” for the 1950 and 1955 compilations. The industrial water-use category included withdrawals for commercial, mining, and aquaculture uses until these uses were estimated separately beginning in 1985. Water use at fish hatcheries was reported as commercial use in 1990 and 1995, but is included in the aquaculture category for 2000 and 2005. Estimates of commercial with-drawals were not compiled nationally for 2000 or 2005.
Corrections and additions to previously published data are included in table 14 and in some cases have resulted in different national totals. The largest of these changes is reflected in the thermo electric and saline groundwater with-drawals for 2000, because of the exclusion of 1.2 Bgal/d of saline groundwater for once-through cooling in Hawaii that year. Revisions to Alabama thermoelectric withdrawals in 1995 added another 1.2 Bgal/d of fresh surface water to the total for 1995. Revisions to irrigation estimates for several States resulted in a slight increase in total irrigation use and total fresh surface-water use, and a slight decrease in fresh groundwater use. Withdrawals for livestock, aquaculture, and mining uses in 2000 were estimated for those States that did not compile data for those categories for that year, so
that a national total could be provided for these categories from 1985 through 2005. Unreported uses for these catego-ries in 2000 were estimated as the average of the 1995 and 2005 estimates. The percentage change in withdrawals for each category and source from 2000 to 2005 (table 14) was calculated from the revised data.
Total withdrawals in 2000 and 2005 were at their largest since 1975 and 1980, when water use was considered to have peaked. The increase in total water use between 1950 and 1980 primarily was related to the increasingly large amounts of water withdrawn for irrigation and thermoelectric-power generation. The largest increases in total withdrawals between the 5-year intervals occurred before 1980.
Thermoelectric power has been the category with the largest water withdrawals since 1965, and for 2005 made up 49 percent of total with-drawals. The largest total and fresh and saline surface-water withdrawals were during 1980. With drawals by thermoelectric-power plants increased from 40 Bgal/d in 1950 to 210 Bgal/d in 1980, declined to 187 Bgal/d in 1985, and have since increased to 201 Bgal/d in 2005.
Thermoelectric-power water withdrawals have been affected by limited water availability in some areas of the United States, and also by sections of the Clean Water Act (Amend-ments to the 1972 Federal Water Pollution Control Act) that regulate cooling system
thermal discharges and mandate the use of best available technology for minimizing environ mental effects of cooling water intakes (Michelletti and Burns, 2002). Consequently, since the 1970s, power plants have increasingly been built with or converted to using wet recirculating cooling systems (using cooling towers or cooling ponds) or dry recirculating (air-cooled) systems instead of using once-through cooling systems. Recent energy industry data indicate that about 43 percent of the generating capacity in the United States is
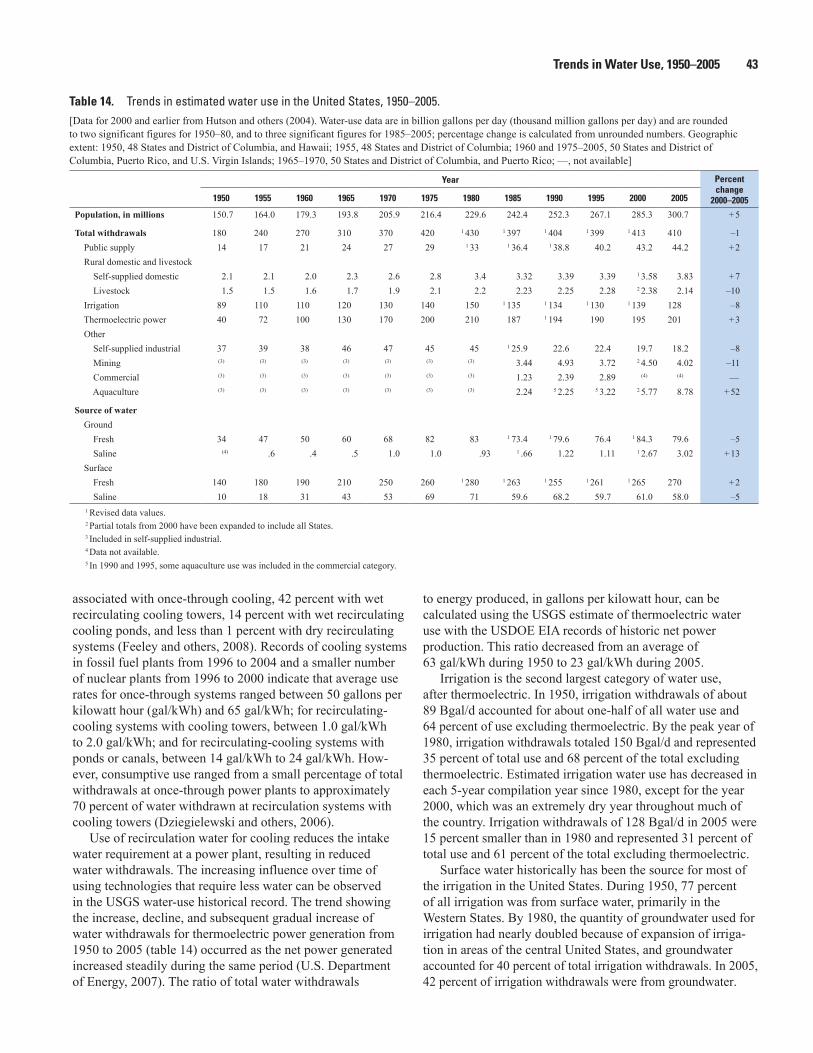
Trends in Water Use, 1950–2005 43
associated with once-through cooling, 42 percent with wet recirculating cooling towers, 14 percent with wet recirculating cooling ponds, and less than 1 percent with dry recirculating systems (Feeley and others, 2008). Records of cooling systems in fossil fuel plants from 1996 to 2004 and a smaller number of nuclear plants from 1996 to 2000 indicate that average use rates for once-through systems ranged between 50 gallons per kilowatt hour (gal/kWh) and 65 gal/kWh; for recirculating-cooling systems with cooling towers, between 1.0 gal/kWh to 2.0 gal/kWh; and for recirculating-cooling systems with ponds or canals, between 14 gal/kWh to 24 gal/kWh. How-ever, consumptive use ranged from a small percentage of total withdrawals at once-through power plants to approximately 70 percent of water withdrawn at recirculation systems with cooling towers (Dziegielewski and others, 2006).
Use of recirculation water for cooling reduces the intake water requirement at a power plant, resulting in reduced water withdrawals. The increasing influence over time of using technologies that require less water can be observed in the USGS water-use historical record. The trend showing the increase, decline, and subsequent gradual increase of water withdrawals for thermoelectric power generation from 1950 to 2005 (table 14) occurred as the net power generated increased steadily during the same period (U.S. Department of Energy, 2007). The ratio of total water withdrawals
to energy produced, in gallons per kilowatt hour, can be calculated using the USGS estimate of thermo electric water use with the USDOE EIA records of historic net power production. This ratio decreased from an average of 63 gal/kWh during 1950 to 23 gal/kWh during 2005.
Irrigation is the second largest category of water use, after thermoelectric. In 1950, irrigation withdrawals of about 89 Bgal/d accounted for about one-half of all water use and 64 percent of use excluding thermoelectric. By the peak year of 1980, irrigation withdrawals totaled 150 Bgal/d and represented 35 percent of total use and 68 percent of the total excluding thermoelectric. Estimated irrigation water use has decreased in each 5-year compilation year since 1980, except for the year 2000, which was an extremely dry year throughout much of the country. Irrigation withdrawals of 128 Bgal/d in 2005 were 15 percent smaller than in 1980 and represented 31 percent of total use and 61 percent of the total excluding thermoelectric.
Surface water historically has been the source for most of the irrigation in the United States. During 1950, 77 percent of all irrigation was from surface water, primarily in the Western States. By 1980, the quantity of groundwater used for irrigation had nearly doubled because of expansion of irriga-tion in areas of the central United States, and groundwater accounted for 40 percent of total irrigation withdrawals. In 2005, 42 percent of irrigation withdrawals were from groundwater.
Table 14. Trends in estimated water use in the United States, 1950–2005.[Data for 2000 and earlier from Hutson and others (2004). Water-use data are in billion gallons per day (thousand million gallons per day) and are rounded to two significant figures for 1950–80, and to three significant figures for 1985–2005; percentage change is calculated from unrounded numbers. Geographic extent: 1950, 48 States and District of Columbia, and Hawaii; 1955, 48 States and District of Columbia; 1960 and 1975–2005, 50 States and District of Columbia, Puerto Rico, and U.S. Virgin Islands; 1965–1970, 50 States and District of Columbia, and Puerto Rico; —, not available]
Year Percent change
2000–20051950 1955 1960 1965 1970 1975 1980 1985 1990 1995 2000 2005
Population, in millions 150.7 164.0 179.3 193.8 205.9 216.4 229.6 242.4 252.3 267.1 285.3 300.7 + 5
Total withdrawals 180 240 270 310 370 420 1 430 1 397 1 404 1 399 1 413 410 –1 Public supply 14 17 21 24 27 29 1 33 1 36.4 1 38.8 40.2 43.2 44.2 + 2 Rural domestic and livestock Self-supplied domestic 2.1 2.1 2.0 2.3 2.6 2.8 3.4 3.32 3.39 3.39 1 3.58 3.83 + 7 Livestock 1.5 1.5 1.6 1.7 1.9 2.1 2.2 2.23 2.25 2.28 2 2.38 2.14 –10 Irrigation 89 110 110 120 130 140 150 1 135 1 134 1 130 1 139 128 –8 Thermoelectric power 40 72 100 130 170 200 210 187 1 194 190 195 201 + 3 Other Self-supplied industrial 37 39 38 46 47 45 45 1 25.9 22.6 22.4 19.7 18.2 –8 Mining (3) (3) (3) (3) (3) (3) (3) 3.44 4.93 3.72 2 4.50 4.02 –11 Commercial (3) (3) (3) (3) (3) (3) (3) 1.23 2.39 2.89 (4) (4) — Aquaculture (3) (3) (3) (3) (3) (3) (3) 2.24 5 2.25 5 3.22 2 5.77 8.78 + 52
Source of water Ground Fresh 34 47 50 60 68 82 83 1 73.4 1 79.6 76.4 1 84.3 79.6 –5 Saline (4) .6 .4 .5 1.0 1.0 .93 1 .66 1.22 1.11 1 2.67 3.02 + 13 Surface Fresh 140 180 190 210 250 260 1 280 1 263 1 255 1 261 1 265 270 + 2 Saline 10 18 31 43 53 69 71 59.6 68.2 59.7 61.0 58.0 –5
1 Revised data values.2 Partial totals from 2000 have been expanded to include all States.3 Included in self-supplied industrial.4 Data not available.5 In 1990 and 1995, some aquaculture use was included in the commercial category.
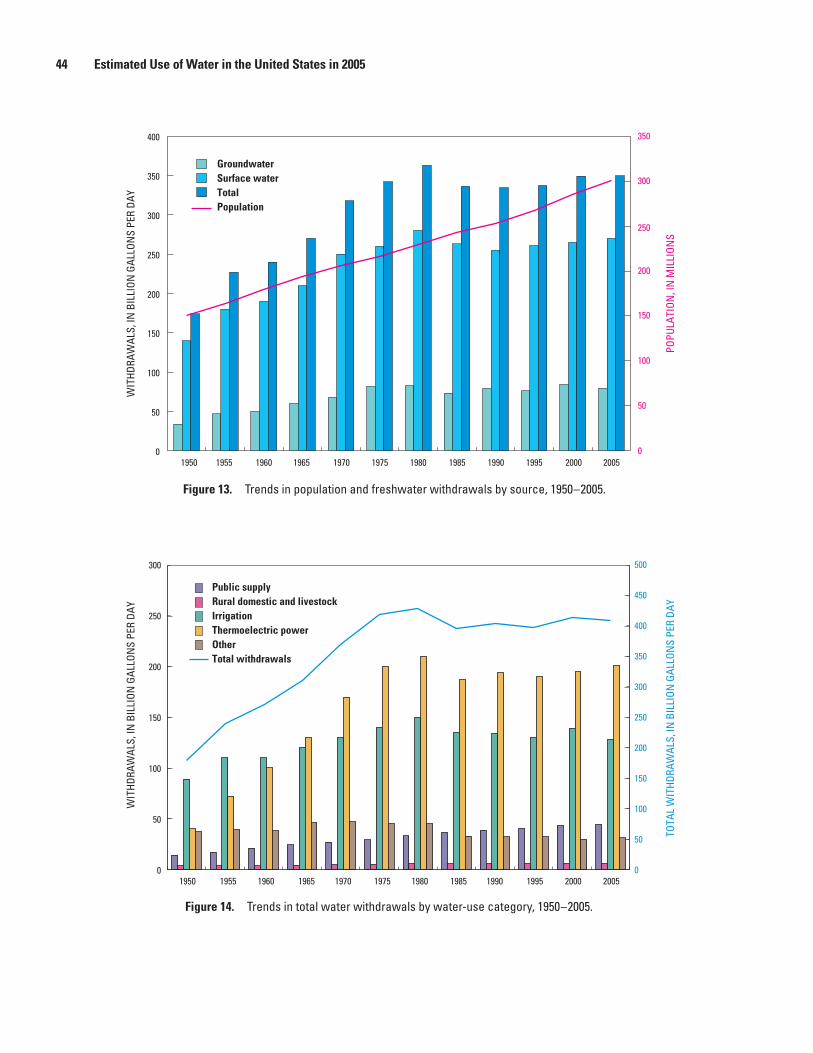
Figure 13. Trends in population and freshwater withdrawals by source, 1950–2005.
Figure 14. Trends in total water withdrawals by water-use category, 1950–2005.
GroundwaterSurface waterTotalPopulation
PO
PULA
TION
, IN
MIL
LION
S
0
50
100
150
200
250
300
350
400
1950 1955 1960 1965 1970 1975 1980 1985 1990 1995 2000 20050
50
100
150
200
250
350
300
W
ITHD
RAW
ALS,
IN B
ILLI
ON G
ALLO
NS
PER
DAY
Public supplyRural domestic and livestockIrrigationThermoelectric powerOtherTotal withdrawals
300
250
200
150
100
50
01950 1955 1960 1965 1970 1975 1980 1985 1990 1995 20052000
W
ITHD
RAW
ALS,
IN B
ILLI
ON G
ALLO
NS
PER
DAY
TO
TAL
WIT
HDRA
WAL
S, IN
BIL
LION
GAL
LON
S PE
R DA
Y
500
450
400
350
300
250
200
150
100
50
0
44 Estimated Use of Water in the United States in 2005

Trends in Water Use, 1950–2005 45
aquaculture. Self-supplied industrial use decreased almost 8 percent between 2000 and 2005, continuing the decline shown each year since 1985. Total industrial withdrawals decreased by almost 30 percent over this entire period, from 25.9 Bgal/d during 1985 to 18.2 Bgal/d during 2005. Groundwater provided 15 percent of the total industrial withdrawals during 1985; 18 percent of the total during 1990, 1995, and 2000; and 17 percent during 2005. Almost all of the groundwater withdrawn for industrial uses was freshwater. The percentage of industrial surface water that was freshwater increased from 84 percent during 1985 to 92 percent during 2005.
Changes in the economic profile of the United States and in environmental legislation have occurred as industrial water withdrawals have declined. Although overall U.S. employment increased 25 percent between 1990 and 2005, manufacturing employment declined almost 19 percent during the same period. Employment in several major water-using industries showed even larger declines: primary metal manufacturing employment declined 31 percent, employment in the paper manufacturing and petroleum and coal products manufacturing industries each declined 26 percent, and employment in the chemical manufacturing industry declined 12 percent (U.S. Department of Commerce, 2009). Stricter water-quality standards for water discharges, mandated by the Clean Water Act, may have encouraged conservation, greater efficiency, and shifts to technologies that use less water.
Estimates of livestock, aquaculture, and mining water uses were included with other categories prior to the 1985 estimates. Livestock water use initially was included with rural domestic, but since 1960 has been estimated as a separate category. During this time, water use for raising livestock has increased but is still one of the smaller individual categories of use at about 2 Bgal/d. Aquaculture water use was included with either the industrial, commercial, or animal specialties categories until 2000, when it was estimated separately in recognition of the growth of this industry. The apparent increase in aquaculture water use since 1985 is partly due to the increase in farm-raised fish and fishery stock, and partly due to an increase in the types of operations inventoried for the estimates. Mining water use was included with industrial use until 1985, and since then the estimates of water use for mining have varied little, averaging 4.13 Bgal/d.
Total water withdrawals more than doubled between 1950 and 2005. During this time period, the proportion of the total by source remained approximately 80 percent surface water and 20 percent groundwater. Most of the groundwater with-drawn has been freshwater; less than 1 percent of total with-drawals has been from saline groundwater. Fresh surface water accounted for about 78 percent of total withdrawals in 1950 and about 66 percent in 2005; since 1980, saline surface-water withdrawals have been about 15 percent of total with drawals. The increase in saline withdrawals primarily was related to greater use of brackish or saline surface water for thermo-electric-power generation in coastal areas.
The total number of acres irrigated continued to increase from 1950 to 2000, even as withdrawals remained static or decreased. In 2005, the total number of acres irrigated was 2 percent less than in 2000, but still more than 60 million acres. Between 1985 and 2005, the number of acres irrigated by sprinkler systems steadily increased from 22 million to more than 30 million acres. Presently, acres irrigated with sprinkler types of systems represent 50 percent of total acres irrigated. The use of microirrigation systems increased from less than 3 percent of the total acres irrigated in 1995 to almost 7 percent in 2005. Acres irrigated with flood systems decreased by 24 percent from 1985 to 2005, from 35 to 26.6 million acres. The average application rate for irrigation water has declined steadily from 3.55 acre-feet per acre in 1950 to 2.35 acre-feet per acre in 2005. This decline is attributed to greater use of sprinkler systems rather than flood systems and corresponding decreases in conveyance losses due to the more efficient application of water.
Estimated withdrawals for public supply have increased continually since 1950, along with the population served by public supply. Public-supply withdrawals were 14 Bgal/d in 1950, when 62 percent of the population was served by public water suppliers, and 44.2 Bgal/d in 2005, when 86 percent of the population was served by public water suppliers. Public-supply withdrawals in 2005 were about 11 percent of total withdrawals and 21 percent of all freshwater uses excluding thermoelectric power generation, generally consistent with the percentages since 1990. The percentage of groundwater used for public supply increased from 26 percent in 1950 to 33 percent in 2005. In 1980, estimates indicated that 36 percent of public-supply withdrawals were from ground-water; however, that peak percentage was the result of counting public-supply water in southern California as groundwater because surface water brought through aqueducts was stored in an aquifer before being pumped for municipal use.
Estimated withdrawals for self-supplied domestic use increased by 82 percent between 1950 and 2005. The self-supplied population was 57.5 million people in 1950, or 38 percent of the total population, and domestic with drawals were 2.1 Bgal/d. In 2005, the self-supplied population was 42.9 million people, and the domestic withdrawals were 3.83 Bgal/d. These data indicate an increase in per capita use from less than 40 to almost 90 gallons per day. Beginning with the 1985 estimates and continuing through 2005, with the exception of 2000, domestic deliveries from public supply were estimated. Average per capita use for the domestic population obtaining household water from public supply was 105 gallons per day in 1985 and 1990, 101 in 1995, and 99 for 2005. Estimates of the combined domestic per capita use for both self-supplied and public-supplied populations have not changed appreciably in 20 years, ranging from 100 gallons per day in 1985 to 98 gallons per day in 2005.
Changes in the industrial category may be compared for 1985 through 2005, which are the years the industrial category was compiled separately from commercial, mining, and

46 Estimated Use of Water in the United States in 2005
References CitedDziegielewski, Ben, Bik, Thomas, Alqalawi, Usama,
Mubako, Stanley, Eidem, Nathan, and Bloom, Shauna, 2006, Water use benchmarks for thermoelectric power generation: Carbondale, Illinois, Project completion report, Research report of the Department of Geography and Environmental Resources, Southern Illinois University, accessed March 12, 2009, at http://www.geog.siu.edu/geography_info/research/documents/ThermoReport.pdf.
Feeley, T.J., III, Skone, T.J., Stiegel, G.J., Jr., McNemar, Andrea,Nemeth, Michael, Schimmoller, Brian, Murphy, J.T., and Manfredo, Lynn, 2008, Water—A critical resource in the thermoelectric power industry: Energy, v. 33, p. 1–11.
Hutson, S.S., compiler, 2007, Guidelines for preparation of State water-use estimates for 2005: U.S. Geological Survey Techniques and Methods Book 4, Chap. E1, 28 p. (Also available at http://pubs.usgs.gov/tm/2007/tm4e1.)
Hutson, S.S., Barber, N.L., Kenny, J.F., Linsey, K.S., Lumia, D.S., and Maupin, M.A., 2004, Estimated use of water in the United States in 2000: U.S. Geological Survey Circular 1268, 46 p.
Lovelace, J.K., 2009a, Methods for estimating water withdrawals for aquaculture in the United States, 2005: U.S. Geological Survey Scientific Investigations Report 2009–5042, 13 p.
Lovelace, J.K., 2009b, Method for estimating water withdraw-als for livestock in the United States, 2005: U.S. Geological Survey Scientific Investigations Report 2009–5041, 7 p.
Lovelace, J.K., 2009c, Methods for estimating water witdraw-als for mining in the United States, 2005: U.S. Geological Survey Scientific Investigations Report 2009–5053, 7 p.
MacKichan, K.A., 1951, Estimated use of water in the United States, 1950: U.S. Geological Survey Circular 115, 13 p.
MacKichan, K.A., 1957, Estimated use of water in the United States, 1955: U.S. Geological Survey Circular 398, 18 p.
MacKichan, K.A., and Kammerer, J.C., 1961, Estimated use of water in the United States, 1960: U.S. Geological Survey Circular 456, 26 p.
Micheletti, W.C., and Burns, J.M., 2002, Emerging issues and needs in power plant cooling systems, in Proceedings of the Workshop on Electric Utilities and Water: Emerging issues and R&D needs: Pittsburgh, Pennsylvania, July 23–24, 2002, accessed May 20, 2009, at http://www.netl.doe.gov/publica-tions/proceedings/02/EUW/Micheletti_JMB.PDF.
Murray, C.R., 1968, Estimated use of water in the United States, 1965: U.S. Geological Survey Circular 556, 53 p.
Murray, C.R., and Reeves, E.B., 1972, Estimated use of water in the United States, 1970: U.S. Geological Survey Circular 676, 37 p.
Murray, C.R., and Reeves, E.B., 1977, Estimated use of water in the United States in 1975: U.S. Geological Survey Circular 765, 39 p.
Solley, W.B., Chase, E.B., and Mann, W.B., IV, 1983, Estimated use of water in the United States in 1980: U.S. Geological Survey Circular 1001, 56 p.
Solley, W.B., Merk, C.F., and Pierce, R.R., 1988, Estimated use of water in the United States in 1985: U.S. Geological Survey Circular 1004, 82 p.
Solley, W.B., Pierce, R.R., and Perlman, H.A., 1993, Estimated use of water in the United States in 1990: U.S. Geological Survey Circular 1081, 76 p.
Solley, W.B., Pierce, R.R., and Perlman, H.A., 1998, Estimated use of water in the United States in 1995: U.S. Geological Survey Circular 1200, 71 p.
U.S. Department of Commerce, 2009, Table SA25–Employment by industry (NAICS Series 1990-2007): Bureau of Economic Analysis, Regional Economic Accounts, accessed February 24, 2009, at http://www.bea.gov/regional/spi/default.cfm?satable=SA25N&series=NAICS.
U.S. Department of Energy, 2006a, Steam-electric plant opera-tion and design report, Form EIA-767: Energy Information Administration, accessed March 9, 2009, at http://www.eia.doe.gov/cneaf/electricity/forms/eia767/eia767.pdf.
U.S. Department of Energy, 2006b, Power plant report, Form EIA-906: Energy Information Administration, accessed March 9, 2009, at http://www.eia.doe.gov/cneaf/electricity/page/eia906_920.html.
U.S. Department of Energy, 2007, Annual energy review 2006: Energy Information Administration, DOE/EIA-0384(2006), accessed March 12, 2009, at http://tonto.eia.doe.gov/FTPROOT/multifuel/038406.pdf.
U.S. Department of Energy, 2009, State electricity profiles: Energy Information Administration, DOE/EIA-0348(01)/2, accessed March 3, 2009, at http://www.eia.doe.gov/cneaf/electricity/st_profiles/e_profiles_sum.html.
Veil, J.A., 2007, Use of reclaimed water for power plant cooling: Argonne, Illinois, Argonne National Laboratory, Environmental Science Division, ANL/EVS/R-07/3, 60 p.

Glossary 47
GlossaryThe following terms are referenced in the text or are part
of the water-use Circular series.
animal-specialties water use water use associated with the production of fish in captivity, except for fish hatcher-ies, and the raising of horses and such fur-bearing animals as rabbits and pets. Animal-specialties water-use estimates were included in the 1990 and 1995 water-use Circulars, but were combined with the livestock categories or aquaculture categories beginning in 2000. See also aquaculture water use, fish-farm water use, livestock water use, and rural water use.aquaculture water use water use associated with the farming of organisms that live in water (such as finfish and shellfish) and offstream water use associated with fish hatcheries. See also fish-farm water use, fish-hatchery water use, animal-specialties water use, and livestock water use.closed-loop cooling system see recirculation cooling system. commercial water use water for motels, hotels, restaurants, office buildings, other commercial facilities, military and nonmilitary institutions, and (for 1990 and 1995) offstream fish hatcheries. Water may be obtained from a public-supply system or may be self-supplied. Commercial water-use estimates were included in some previous water-use Circulars but were omitted beginning in 2000. See also fish-hatchery water use, public-supply water use, public-supply deliveries, and self-supplied water use.consumptive use the part of water withdrawn that is evaporated, transpired, incorporated into products or crops, consumed by humans or livestock, or otherwise removed from the immediate water environment. Consumptive-use estimates were included in some previous water-use Circulars but were omitted beginning in 2000. Also referred to as water consumed. conveyance loss water that is lost in transit from a pipe, canal, conduit, or ditch by leakage or evaporation. Gener-ally, the water is not available for further use; however, leakage from an irrigation ditch, for example, may percolate to a groundwater source and be available for further use. Conveyance-loss estimates were included in some previous water-use Circulars but were omitted beginning in 2000. See also irrigation water use. cooling system an equipment system that provides water for cooling purposes, such as to condensers at power plants or at factories. May include water intakes, outlets, cooling towers, ponds, canals, pumps, and pipes. See also cooling-system type, industrial water use, and thermoelectric-power water use.
cooling-system type defined as either once-through or recirculation cooling system. See also industrial water use, once-through cooling system, recirculation cooling system, and thermoelectric-power water use. domestic water use water used for indoor household purposes such as drinking, food preparation, bathing, washing clothes and dishes, flushing toilets, and outdoor purposes such as watering lawns and gardens. Domestic water use includes water provided to households by a public water supply (domestic deliveries) and self-supplied water. See also public-supply deliveries, public-supply water use, rural water use, and self-supplied water use.fish-farm water use water used for the production of finfish and shellfish under controlled feeding, sanitation, and harvesting procedures for commercial purposes. Water use by fish farms is classified in the aquaculture category. See also animal-specialties water use, aquaculture water use, and fish-hatchery water use. fish-hatchery water use water used for raising fish for later release and in association with the operation of fish hatcheries or fishing preserves. Fish-hatchery water use has been included in the aquaculture category since 2000. See also aquaculture water use, commercial water use, and fish-farm water use. freshwater water that contains less than 1,000 milligrams per liter (mg/L) of dissolved solids. Generally, water with more than 500 mg/L of dissolved solids is undesirable for drinking and many industrial uses. See also saline water.industrial water use water used for fabrication, processing, washing, and cooling. Includes industries such as chemical and allied products, food, paper and allied products, petro-leum refining, wood products, and steel. Term used in previous water-use Circulars to describe the combined public-supply deliveries to industrial users and self-supplied industrial with drawals. For 2000 and 2005, industrial water use refers only to self-supplied industrial withdrawals. See also cooling system, cooling-system type, mining water use, public-supply deliv eries, public-supply water use, and self-supplied water use. instream use water that is used, but not withdrawn, from a surface-water source for such purposes as hydroelectric-power generation, navigation, water-quality improvement, fish propagation, and recreation. Instream water-use estimates for hydroelectric power were included in some previous water-use Circulars but were omitted for 2000 and 2005. irrigation district a cooperative, self-governing public corporation set up as a subdivision of the State government, with definite geographic boundaries, organized, and having taxing power to obtain and distribute water for irrigation of lands within the district. Created under the authority of a State legislature with the consent of a designated fraction of the landowners or citizens. See also irrigation water use.
48 Estimated Use of Water in the United States in 2005
irrigation water use water that is applied by an irrigation system to assist crop and pasture growth, or to maintain vegetation on recreational lands such as parks and golf courses. Irrigation includes water that is applied for pre-irrigation, frost protection, chemical application, weed control, field preparation, crop cooling, harvesting, dust suppression, leaching of salts from the root zone, and convey-ance losses. See also conveyance loss, microirrigation system, sprinkler irrigation system, and surface irrigation system.livestock water use water used for livestock watering, feedlots, dairy operations, and other on-farm needs. Types of livestock include dairy cows and heifers, beef cattle and calves, sheep and lambs, goats, hogs and pigs, horses and poultry. See also animal-specialties water use, aquaculture water use, and rural water use. microirrigation system an irrigation system that wets only a discrete portion of the soil surface in the vicinity of the plant by means of applicators (such as orifices, emitters, porous tubing, or perforated pipe) and operated under low pressure. The applicators may be placed on or below the surface of the ground or suspended from supports. See also irrigation water use, sprinkler irrigation system, and surface irrigation system.mining water use water used for the extraction of naturally occurring minerals including solids (such as coal, sand, gravel, and other ores), liquids (such as crude petroleum), and gases (such as natural gas). Also includes uses associated with quarrying, milling, and other preparations customarily done at the mine site or as part of a mining activity. Does not include water associated with dewatering of the aquifer that is not put to beneficial use. Also does not include water used in processing, such as smelting, refining petroleum, or slurry pipeline operations. These processing uses are included in industrial water use. See also industrial water use and self-supplied water use.offstream use water withdrawn or diverted from a ground-water or surface-water source for aquaculture, commercial, domestic self-supply, industrial, irrigation, livestock, mining, public supply, thermoelectric power, and other uses. See also entries for each of these categories of use. once-through cooling system also known as open-loop cooling system. Cooling system in which the water is with-drawn from a source, circulated through the heat exchangers, and then returned to a body of water at a higher temperature. See also cooling system, cooling-system type, industrial water use, and thermoelectric-power water use.public-supply deliveries amount of water delivered from a public supplier to users for domestic, commercial, industrial, thermoelectric-power, or public-use purposes. Estimates of deliveries for each purpose were provided for 1995 and earlier years, but not for 2000. For 2005, only domestic deliveries were estimated nationally. See also commercial water use, domestic water use, industrial water use, public-supply water use, public water use, and thermoelectric-power use.
public-supply water use water withdrawn by public and private water suppliers that furnish water to at least 25 people or have a minimum of 15 connections. Public suppliers provide water for a variety of uses, such as domestic, commercial, industrial, thermoelectric-power, and public water use. See also commercial water use, domestic water use, industrial water use, public-supply deliveries, public water use, and thermoelectric-power water use. public water use water supplied from a public supplier and used for such purposes as firefighting, street washing, flushing of water lines, and maintaining municipal parks and swimming pools. Generally, public-use water is not billed by the public supplier. See also public-supply deliveries and public-supply water use. recirculation cooling system also known as closed-loop cooling system. Water is withdrawn from a source, circulated through heat exchangers, cooled, and then re-used in the same process. Recirculation cooling systems may use induced draft cooling towers, forced draft cooling towers, cooling ponds, or canals. See also cooling system, cooling-system type, indus-trial water use, and thermoelectric-power water use. reclaimed wastewater wastewater-treatment plant effluent that has been diverted for beneficial uses such as irrigation, industry, or thermoelectric cooling instead of being released to a natural waterway or aquifer. See also water use.return flow water that reaches a groundwater or surface-water source after release from the point of use and thus becomes available for further use. Term used in previous water-use Circulars. See also water use.rural water use water used in suburban or farm areas for domestic and livestock needs. The water generally is self-supplied, and includes domestic use, drinking water for livestock, and other uses such as dairy sanitation, cleaning, and waste disposal. Term used in previous water-use Circulars. See also animal-specialties water use, domestic water use, livestock water use, and self-supplied water use. saline water water that contains 1,000 mg/L or more of dissolved solids. See also freshwater.self-supplied water use water withdrawn from a ground-water or surface-water source by a user rather than being obtained from a public supply. sprinkler irrigation system an irrigation system in which water is applied by means of perforated pipes or nozzles operated under pressure so as to form a spray pattern. See also irrigation water use, microirrigation system, and surface irrigation system.standard industrial classification (SIC) codes four-digit codes established by the Office of Management and Budget, published in 1987, and used in the classification of establish-ments by type of activity in which they are engaged.

Center pivot irrigation system, Burke County, Georgia. Photo by Alan M. Cressler, USGS.
Glossary 49
surface irrigation system irrigation by means of flood, furrow, or gravity. Flood irrigation is the application of irrigation water in which the entire soil surface is covered by ponded water. Furrow is a partial surface-flooding method of irrigation normally used with clean-tilled crops in which water is applied in furrows or rows of sufficient capacity to contain the design irrigation stream. Gravity is an irrigation method in which water is not pumped, but flows in ditches or pipes and is distributed by gravity. See also irrigation water use, microirrigation system, and sprinkler irrigation system.thermoelectric-power water use water used in the process of generating electricity with steam-driven turbine generators. Term used in previous water-use Circulars to describe the combined public-supply deliveries to thermoelectric-power plants and self-supplied thermoelectric-power withdrawals. For 2000 and 2005, thermoelectric-power water use refers only to self-supplied thermoelectric-power withdrawals. See also cooling system, cooling-system type, public-supply water use, and self-supplied water use. wastewater-treatment return flow term used in previous water-use Circulars to describe water returned to the hydro-logic system by wastewater-treatment facilities. See also water use.
water use In a restrictive sense, the term refers to water that is withdrawn for a specific purpose, such as for public supply, domestic use, irrigation, thermoelectric-power cooling, or industrial processing. In previous water-use Circulars, water use for the domestic, commercial, industrial, and thermo-electric categories included both self-supplied withdrawals and deliveries from public supply. More broadly, water use pertains to the interaction of humans with and influence on the hydrologic cycle, and includes elements such as water withdrawal, delivery, consumptive use, wastewater release, reclaimed wastewater, return flow, and instream use. See also offstream use and instream use.watt-hour (Wh) an electrical energy unit of measure equal to 1 watt of power supplied to, or taken from, an electric circuit steadily for 1 hour.water withdrawal water removed from the ground or diverted from a surface-water source for use. See also offstream use and self-supplied water.

50 Estimated Use of Water in the United States in 2005
AlabamaAlabama Department of Economic and Community
Development, Office of Water Resources, Water Management Branch
Alabama Department of Environmental Management, Drinking Water Branch
Alabama Rural Water AssociationGeological Survey of AlabamaTennessee Valley Authority
AlaskaAlaska Department of Commerce, Community
and Economic DevelopmentAlaska Department of Environmental Conservation,
Public Health ServiceAlaska Department of Fish and GameAlaska Department of Natural Resources,
Division of AgricultureAlaska Division of Geology and Geophysical SurveysAlaska Division of Land and Water ManagementAlaska Division of Mining Land and WaterAlaska Oil and Gas Conservation CommissionUniversity of Alaska, Cooperative Extension Service
ArizonaArizona Department of Water ResourcesArizona Corporation Commission
ArkansasArkansas Natural Resources Commission
CaliforniaCalifornia Department of Water,
Division of Planning and Local AssistanceCalifornia Energy Commission
ColoradoColorado Department of Health and EnvironmentColorado Department of Natural ResourcesColorado Division of Water Resources
Office of State EngineerColorado Geological SurveyColorado Oil and Gas Conservation CommissionRocky Mountain Golf Course Superintendents Association
ConnecticutState of Connecticut Department of Environmental Protection
DelawareDelaware Department of Natural Resources
and Environmental Control
FloridaFlorida Department of Environmental Protection Northwest Florida Water Management District South Florida Water Management District Southwest Florida Water Management District St. Johns River Water Management District Suwannee River Water Management District
GeorgiaGeorgia Environmental Protection Division,
Watershed Protection BranchGeorgia Power CompanyUniversity of Georgia, Cooperative Extension Service
HawaiiHawaii Commission on Water Resource Management
IdahoIdaho Department of Agriculture,
Agricultural Statistics ServiceIdaho Department of Fish and GameIdaho Department of Water ResourcesIdaho Division of Environmental QualityIdaho State Geological SurveyUniversity of Idaho, Aquaculture Research InstituteUniversity of Idaho,
Research and Extension Center at Kimberly
IllinoisIllinois State Water Survey, Illinois Water Inventory Program
IndianaIndiana Department of Natural Resources, Division of Water
IowaIowa Department of Natural Resources,
Water Supply Engineering Section
KansasKansas Department of Agriculture,
Division of Water ResourcesKansas Water Office
KentuckyKentucky Energy and Environment Cabinet, Division of Water
Cooperating Agencies and OrganizationsThe following State, regional, and local organizations provided assistance and data as part of the water-use compilation.
In addition, State and regional offices of the U.S. Army Corps of Engineers, U.S. Bureau of Reclamation, U.S. Environmental Protection Agency, U.S. Fish and Wildlife Service, USDA National Agricultural Statistics Service, USDA Natural Resources Conservation Service, and other Federal agencies provided assistance and data for various States.
Cooperating Agencies and Organizations 51
LouisianaCapitol Area Ground Water Conservation CommitteeLouisiana Cooperative Extension ServiceLouisiana Department of Environmental QualityLouisiana Department of Health and HospitalsLouisiana Department of Transportation and DevelopmentLouisiana Office of Conservation,
Injection and Mining DivisionLouisiana State University Agricultural Center
MaineMaine Department of AgricultureMaine Department of Environmental ProtectionMaine Department of Health and Human ServicesMaine Public Utilities Commission
MarylandMaryland Department of the Environment
MassachusettsMassachusetts Department of Environmental Protection
MichiganMichigan Department of Environmental Quality,
Water Use Program
MinnesotaMinnesota Department of Natural Resources
MississippiMississippi Agriculture and Forestry Extension ServiceMississippi Department of Environmental Quality,
Office of Land and Water Resources Mississippi State Department of Health Yazoo Mississippi Delta Joint Management District
MissouriMissouri Department of Natural Resources
MontanaMontana Agricultural Statistical ServiceMontana Department of Natural Resources and Conservation
NebraskaNebraska Department of Natural Resources
NevadaCarson City Water DivisionNevada Agricultural Statistics ServiceNevada Bureau of Mines and GeologyNevada Department of WildlifeNevada Division of Water ResourcesPershing County Water Conservation DistrictSouthern Nevada Water Authority State of Nevada DemographerTruckee Carson Irrigation District
Truckee Meadows Water AuthorityUniversity of Nevada, Reno,
Department of Animal Biotechnology
New HampshireNew Hampshire Department of Environmental Services
New JerseyNew Jersey Department of Environmental Protection
New MexicoNew Mexico Office of the State Engineer,
Water Conservation Bureau
New YorkNew York City Department of Environmental ProtectionNew York State Department of Environmental ConservationNew York State Department of Health
North CarolinaCarolinas Golf Course Superintendents AssociationDuke Energy CompanyNorth Carolina Department of Environment and Natural
Resources, Division of Water Resources North Carolina Department of Agriculture and Consumer
Services, Agribusiness and Aquaculture North Carolina State University, College of Agriculture
and Life Sciences, Cooperative ExtensionNorth Carolina State University, College of Agriculture
and Life Sciences, Department of Crop ScienceProgress Energy Company
North DakotaNorth Dakota Agricultural Statistics ServiceNorth Dakota Industrial Commission, Oil and Gas DivisionNorth Dakota State Data Center,North Dakota State UniversityNorth Dakota State Department of HealthNorth Dakota State Water Commission
OhioOhio Department of Natural Resources
OklahomaCity of Tulsa, Department of Public WorksCity of Oklahoma City, Water & Wastewater UtilitiesGrand River Dam AuthorityOklahoma Agricultural Statistics ServiceOklahoma Corporation CommissionOklahoma Climatological SurveyOklahoma Department of CommerceOklahoma Department of Environmental QualityOklahoma Municipal Power AuthorityOklahoma Pork CouncilOklahoma Water Resources BoardSouthwest Power Administration

52 Estimated Use of Water in the United States in 2005
OregonOregon Agricultural Statistic ServiceOregon Department of EnergyOregon Department of Fish and WildlifeOregon Department of Geology and Mineral IndustriesOregon Health Division, Drinking Water ProgramOregon Water Resources Department
PennsylvaniaDelaware River Basin CommissionPennsylvania Department of Environmental Protection
Puerto RicoPuerto Rico Aqueduct and Sewer Authority Puerto Rico Department of Health Puerto Rico Department of Natural and
Environmental ResourcesPuerto Rico Electric and Power AuthorityPuerto Rico Land Authority
Rhode IslandRhode Island Department of Environmental Management,
Office of Water ResourcesRhode Island Division of PlanningRhode Island Economic Development CorporationRhode Island Water Resources Board
South CarolinaDuke Energy CorporationSouth Carolina Department of Health and
Environmental Control
South DakotaSouth Dakota Department of AgricultureSouth Dakota Department of Environment and
Natural Resources
TennesseeMemphis Light, Gas, and WaterTennessee Department of Environment and Conservation,
Division of Water Supply
TexasTexas Bureau Of Economic GeologyTexas Commission on Environmental Quality,
Surface Water Rights DivisionTexas Railroad CommissionTexas Water Development Board.
Water Use and Projections Section
U.S. Virgin IslandsU.S. Virgin Islands Energy Office, Department of
Planning and Natural ResourcesU.S. Virgin Islands Water and Power Authority
UtahUtah Department of AgricultureUtah Department of Natural Resources,
Division of Oil, Gas, and MiningUtah Department of Natural Resources,
Division of Water ResourcesUtah Department of Natural Resources,
Division of Water RightsUtah Department of Natural Resources,
Division of Wildlife ResourcesUtah Governor’s Office of Planning and Budget
VermontVermont Agency of Natural Resources,
Department of Environmental Conservation
VirginiaVirginia Department of Environmental Quality,
Water Supply Planning ProgramVirginia Department of Health, Office of Drinking Water
WashingtonWashington State Department of EcologyWashington State Department of Health
West VirginiaWest Virginia Department of Environmental Protection,
Division of Water And Waste ManagementWest Virginia Department of Health and Human Resources,
Bureau for Public HealthWest Virginia Geological and Economic Survey
WisconsinMinnesota Department of Natural ResourcesO.J. Noer Turf Grass Research & Education FacilityPublic Service Commission of Wisconsin,
Water and Energy DivisionsSoutheastern Wisconsin Regional Planning Commission University of Wisconsin–Extension,
Agriculture and Natural ResourcesUniversity of Wisconsin–Extension,
Geologic and Natural History SurveyWisconsin Department of Agriculture,
Trade and Consumer ProtectionWisconsin Department of Natural Resources
WyomingWyoming Agricultural Statistics ServiceWyoming Department of EmploymentWyoming Oil and Gas Conservation CommissionWyoming Water Development Commission
Manuscript approved on September 23, 2009
For more information about this publication contact:Chief, Office of GroundwaterU.S. Geological Survey411 National Center12201 Sunrise Valley DriveReston, VA 20192http://water.usgs.gov/watuse
Edited by Kay E. HedrickCartography and layout by Caryl J. Wipperfurth

Kenny and others—Estim
ated Use of W
ater in the United States in 2005—
Circular 1344
Printed on recycled paper