estimates of site index and height growth for douglas-fir in high
TRANSCRIPT

United States Department of Agriculture
Forest Service
Pacific Northwest Research Station
Research Paper PNW-RP-378
Estimates of Site Index and Height Growth for Douglas-Fir in High- Elevation Forests of the Oregon- Washington Cascade Range: Curves and Tables for Field Application
,, f
~:~"-"~"~ Donald J. DeMars and Francis R. Herman

Authors DONALD J. DeMARS is mensurationist, Forestry Sciences Laboratory, P.O. Box 909, Juneau, Alaska 99802. FRANCIS R. HERMAN was principal mensurationist (now retired), Institute of Northern Forestry, 308 Tanana Drive, Fairbanks, Alaska 99775-5500.

Abstract DeMars, Donald J.; Herman, Francis R. 1987. Estimates of site index and height growth for Douglas-fir in high-elevation forests of the Oregon-Washington Cascade Range: curves and tables for field application. Res. Pap. PNW-RP-378. Portland, OR: U.S. Department of Agriculture, Forest Service, Pacific Northwest Research Station. 16 p.
Estimation equations for height growth and site index were derived from stem-analysis data of Douglas-fir (Pseudotsuga menziesii [Mirb.] Franco var. menziesii) in the high- elevation forests of the Cascade Range in Oregon and Washington. Two sets of height-growth and site-index estimation curves and tables produced from previously published equations are presented-one set with U.S. customary units of measure and another set with metric units. These curves and tables were designed for use in the field by forest managers.
Keywords: Site index, increment (height), stem analysis, stand age, altitude (-site, Douglas-fir (coast), Oregon (Cascade Range), Washington (Cascade Range).
Summary Equation and curves for height growth and site index were developed from stem- analysis data for selected, dominant Douglas-fir (Pseudotsuga menziesii [Mirb.] Franco var. menziesfi ) trees collected at 52 locations between McKenzie Pass in central Oregon and Stevens Pass in north-central Washington. This paper presents previously published equations in tabular and graphic form suitable for field use.
Curves were based on the tallest, undamaged dominant in 0.25-acre (0.1-ha) plots from unmanaged stands. Trees with similar attributes should be selected when the site index of an upper slope forest stand is estimated.
Estimation curves for site index obtained by regressing site index on height and age differed from estimation curves for height growth obtained by regressing height on site index and age. Site-index curves should be used to predict the height of stands at the index age, given present age and height; curves for height growth should be used to predict expected heights of Douglas-fir at different ages for stands of a given site index.
Both the site-index curves and the height-growth curves will serve as a basis for developing growth and yield estimates for Douglas-fir in high-elevation forests of the Cascade Range in Oregon and Washington.

Contents 1 Introduction
2 Data
3 Analysis
4 Equations for Height Growth
8 Equations for Site Index
14 Discussion
14 Estimation Curves for Height Growth
14 Estimation Curves for Site Index
14 Possible Bias
15 Application of Curves
15 Literature Cited

Introduction This paper presents estimation curves for height growth and site index in tabular and graphic form for Douglas-fir (Pseudotsuga menziesfi [Mirb.] Franco var. menziesii) in the high-elevation forests of the Cascade Range in Oregon and Washington. The curves are based on equations previously presented by Curtis and others (1974a). Methods of analysis were those used for both Douglas-fir and noble fir (Abies procera Rehd.) (Curtis and others 1974a, 1974b; Herman and others 1978.) Equations, curves, and tables are presented in both U.S. customary and metric units.
The equations and curves were developed from stem-analysis data for selected dominant Douglas-fir trees collected at 52 locations between McKenzie Pass in central Oregon and Stevens Pass in north-central Washington (fig. 1). All locations were in unmanaged stands, mainly old growth in the Abies amabilis zone of Franklin and Dyrness (1973). Data from section trees were also collected for associated species: curves for associated noble fir were developed by Herman and others (1978), and Douglas-fir curves were presented by Curtis and others (1974b). Site-index and height curves for other species are planned.
X eattle,,
~ ; Stevens Pass :.(~."
• t l
• I
/
Portland "~..
Salem ~I , I
.:.. • -~---McKenzie Pass
Eugene
Figure 1--Geographic distribution of the Douglas-fir selected for stem analysis and used in the development of estimation curves for height growth and site index. All plot locations are in unmanaged stands, mainly old growth within the Abies amabilis zone of Franklin and Dyrness (1973).

Data An area of uniform site and stand conditions was selected, usually about 0.25-acre (0.1-ha) within a stand or group of trees in which the dominants were judged to be of one age class. The tallest dominant or codominant tree of each species present was selected and felled for stem analysis. Trees with indicators of rot and obvious defects, such as thin crowns, were avoided as were treeswith stag, forked, or broken tops and bent and crooked stems. Sections were cut at the stump (stump height varied), at 4.5 feet (1.37 m), and at intervals up the stem (usually 18 feet [5.5 m]) in the merchant- able portion of large trees and at shorter intervals in small trees and tops.
For each tree, a graph of height over age was plotted by computer, and the height- growth pattern of the tree was examined for signs of early suppression or history of past top damage. Because Douglas-fir is a shade-intolerant species, few trees showed abnormal early growth reduction, and only a few trees were rejected for a history of top damage. In the following tabulation, data from trees used in the analysis are summarized by number of sample trees present at successive breast height ages (age bh) (Curtis and others 1974b):
Numberof Age bh trees
10-80 52 100 49 150 47 200 40 250 31 300 10 350 7 400 4
The number of trees by classes of height attained at age 100 (H100) is given in figure 2.

161
14
12
~ 1 0
o 8 - L :
,,D E Z 6 -
B
2 -
/ / ~ / / I / /
I / / / /
/ /
/ / ' 1 / /
/ / / / / " 1 / / / /
/ / / / -
/ / / /
/ / / / '
r f / J
r / r
f / r j
f / / /
/ / / /
r / / /
r / J
f / i /
/ /
i F j
f /
r
/
/ / / /
/ /
/ / /
/ j
/ .
/ / p 0 I 1 I
0 20 40 60 80 1 0 0 1 2 0 1 4 0 6 0 1 8 0 2 0 0
To ta l height at age 1 0 0 years bh ( H I O 0 )
Figure 2--Number of Douglas-fir trees used in analysis sample by classes of H100 (attained height at age 100 years bh) (data from Curtis and others 1974b).
Analysis Interpolated values of height at successive 10-year intervals of age bh were the values used in the analysis. With minor modifications, the analysis follows the methods used with noble fir (Curtis and others 1974a, Herman and others 1978).
Two symbols used in the discussion and equations need to be defined:
• H100 is individual sample-tree height (in feet) at age 100 bh; it is an estimate of site index.
• H is total height of the tree at any specified age bh (age bh is the number of annual rings at 4.5 feet on the stem).
To fit equations, we subtracted 4.5 feet (1.37 m) from H100 and H to provide a com- mon origin for scales of height and age at bh.

Equations for Height Growth
The regression (H - 4 .5) = a + b (H100 - 4.5), where 4.5 feet 1 is breast height, was fitted to data for individual 10-year intervals of age bh. These regressions provided estimates of H for successive intervals of H100 that, when connected, gave un- smoothed trends over age which were used as guides in selecting suitable equation forms (Curtis and others 1974a, 1974b; Heger 1968). The standard errors of estimates (SEE) from the regressions were used as the basis for the weighting factor in subse- quent computations. Details of the analysis are given in Curtis and others (1974b).
Equations for height estimation are:
Equation 1, in feet:
(H100-4.5) H=4 .5 +
[a+b/(H100-4.5)+c(A ")+d/(H100-4.5) (A n)]
where:
A = age bh,
a = 0.6192,
b =-5.3394,
c = 240.29,
d = 3368.9,
n = -1.4,
H = height of tree in feet, and
H100 = total height (feet) of an individual tree at age 100 bh, which is an estimate of site index.
Standard error of estimate of the transformed variable w (H-4.5) was 0.954.
Height estimates calculated by this equation are given in table 1, and corresponding height-growth curves are shown in figure 3.
I The regressions expressed in metric equivalents:
(Hm-1.37) = a+b (H 100m-1.37);
where 1.37 meters is breast height.
Regression coefficients appearing in equations are changed where necessary to produce valid metric expressions. Curves expressed in metric units will be slightly different in reference height; that is, site-index curves for 32 in meters have no exact counterpart in selected curves for U.S. customary units. Separate equations are therefore given for feet and for meters.

Table lmExpected heights in feet for indicated ages at breast height (bh) for values of HIO0 (total height at index age 100 years bh) 1
Heightatindex age 100 Age bh 60 70 80 90 100 110 120 130 140 150 160
Years Feet
10 9 10 11 12 13 14 15 16 17 18 19 20 16 18 20 22 25 27 29 32 34 36 39 30 22 26 30 34 37 41 45 48 52 56 60 40 29 34 39 44 49 54 59 64 69 74 79 50 36 42 48 54 60 66 72 79 85 91 97 60 42 49 56 63 70 77 84 92 99 106 113 70 47 55 63 71 79 87 95 103 111 119 127 80 52 60 69 78 87 96 104 113 122 131 140 90 56 66 75 84 94 103 113 122 132 141 150
100 60 70 80 90 100 110 120 130 140 150 160 110 64 74 84 95 106 116 126 137 148 158 168 120 67 78 88 100 110 121 132 143 154 165 176 130 70 81 92 104 115 126 137 149 160 171 183 140 72 84 95 107 119 130 142 154 165 177 189 150 74 86 98 110 122 134 146 158 170 182 194 160 77 89 101 113 126 138 150 162 174 187 199 170 78 91 103 116 128 141 153 166 178 191 203 180 80 93 106 118 131 144 156 169 182 194 207 190 82 95 108 120 133 146 159 172 185 198 211 200 83 96 109 122 136 149 162 175 188 201 214 210 85 98 111 124 138 151 164 177 190 204 217 220 86 99 113 126 139 153 166 180 193 206 220 230 87 101 114 128 141 155 168 182 195 209 222 240 88 102 115 129 143 156 170 184 197 211 224 250 89 103 117 130 144 158 172 185 199 213 227 260 90 104 118 132 145 159 173 187 201 215 229
270 91 105 119 133 147 161 174 188 202 216 230 280 92 106 120 134 148 162 176 190 204 218 232 290 92 107 121 135 149 163 177 191 205 220 234 300 93 107 122 136 150 164 178 192 207 221 235 310 94 108 122 136 151 165 179 194 208 222 237 320 94 109 123 137 152 166 180 195 209 224 238 330 95 109 124 138 152 167 181 196 210 225 239 340 96 110 124 139 153 168 182 197 211 226 240 350 96 110 125 140 154 168 183 198 212 227 241 360 97 111 126 140 155 169 184 198 213 228 242 370 97 112 126 141 155 170 185 199 214 229 243 380 98 112 127 141 156 171 185 200 215 229 244 390 98 112 127 142 156 171 186 201 216 230 245 400 98 113 128 142 157 172 187 201 216 231 246
1 From equation 1 (in feet). Values correspond to height-growth curves shown in figure 3. Estimates for ages greater than 270 years bh are extrapolations of the data base.
260
24O
220
2OO
180
160 I
140
120
100
80
60
4O
20
0 0
I
~ . . - -
i
I I i I I 50 100 150 200 250
H 1 0 0 ( f e e t ) 160 150 140_ 130
110 100 9O 80 70 6u
I I I 300 350 40C
B r e a s t - h e i g h t a g e ( y e a r s )
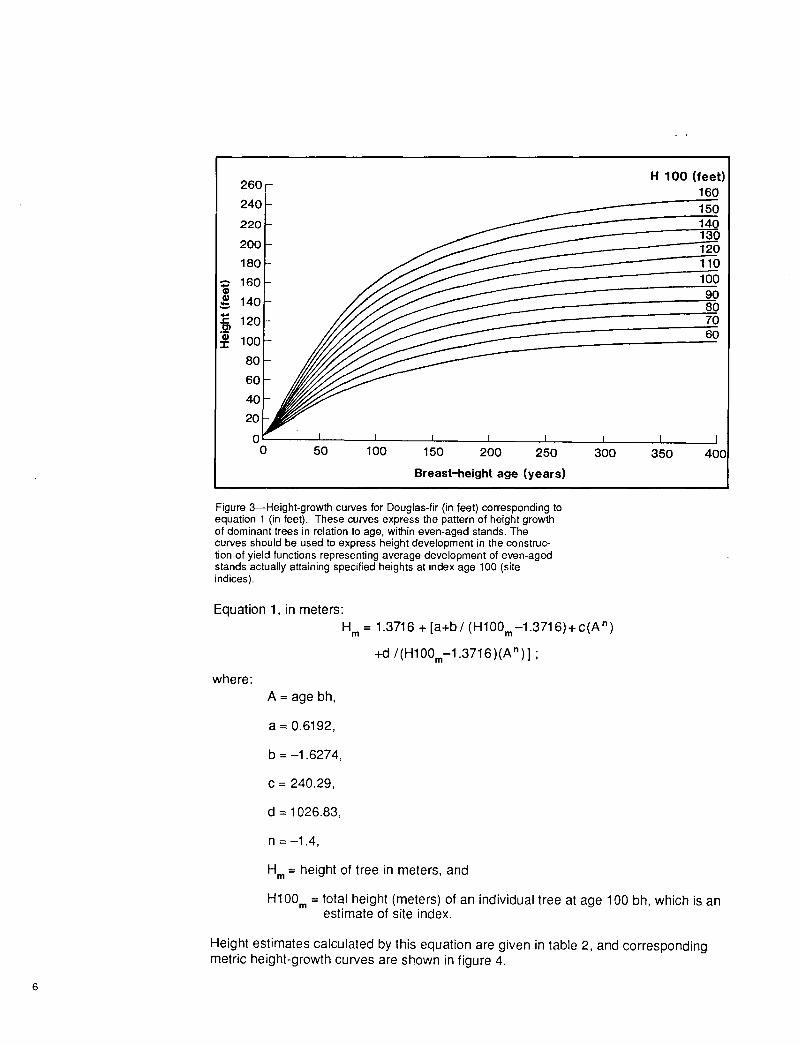
Figure 3--Height-growth curves for Douglas-fir (in feet) corresponding to equation 1 (in feet). These curves express the pattern of height growth of dominant trees in relation to age, within even-aged stands. The curves should be used to express height development in the construc- tion of yield functions representing average development of even-aged stands actually attaining specified heights at index age 100 (site indices).
Equation 1, in meters:
H m
where:
A = age bh,
= 1.3716 + [a+b / (H100m-1 .3716)+ c(An )
+d / (H100m-1 .3716) (An) ] "
a = 0.6192,
b = -1.6274,
c = 240.29,
d = 1026.83,
n = -1.4,
H m = height of tree in meters, and
H 1 0 0 13"1 = total height (meters) of an individual tree at age 100 bh, which is an
estimate of site index.
Height est imates calculated by this equation are given in table 2, and corresponding metric height-growth curves are shown in figure 4.

Table 2mExpected heights in meters for Indicated ages at breast height (bh) for values of H100 m (total height at index age 100 years bh) 1
Height at index age 100 Age bh 20 23 26 29 32 35 38 41 44 47 50
Year Meters
10 2.9 3.2 3.5 3.8 4.0 4.3 4.6 4,9 5.2 5.5 5.8 20 5.1 5.8 6.5 7.2 7.9 8.6 9.3 10.0 10.7 11.4 12.1 30 7.5 8.6 9.7 10.8 11.9 13.0 14.1 15,3 16.4 17.5 18.6 40 9.8 11.3 12,7 14.2 15.7 17.2 18.7 20.2 21.7 23.2 24.8 50 11.9 13.7 15,6 17.4 19.3 21.1 23.0 24.8 26.6 28.5 30.3 60 13.9 16.0 18,2 20.3 22.4 24.6 26.7 28.9 31.0 33.2 35.3 70 15.7 18.1 20,5 22.9 25.3 27.7 30.1 32.5 34,9 37.3 39.7 80 17.3 19.9 22,5 25.2 27.8 30.4 33.1 35.7 38.3 41.0 43.6 90 18.7 21.5 24.4 27.2 30.0 32.9 35.7 38.5 41.3 44.2 47.0
100 20.0 23.0 26.0 29.0 32.0 35.0 38.0 41.0 44.0 47.0 50.0 110 21.2 24.3 27.5 30.6 33.8 36.9 40.1 43.2 46.4 49.5 52.7 120 22.2 25.5 28.8 32.0 35.3 38.6 41.9 45.2 48.4 51.7 55.0 130 23.1 26.5 29.9 33.3 36.7 40:1 43.5 46.9 50.3 53.7 57.1 140 24.0 27.5 31.0 34.5 38.0 41.5 45.0 48.5 52.0 55.5 59.0 150 24.7 28.3 31.9 35.5 39.1 42.7 46.3 49.9 53.5 57.0 60.6 160 25.4 29.1 32.8 36.4 40.1 43.8 47,4 51.1 54.8 58.5 62.1 170 26.1 29.8 33.5 37.3 41.0 44.8 48.5 52.3 56.0 59.7 63.5 180 26.6 30.4 34.2 38.0 41.9 45.7 49.5 53.3 57.1 60.9 64.7 190 27.2 31.0 34.9 38.7 42.6 46.5 50.3 54.2 58.1 62.0 65.8 200 27.6 31.5 35.5 39.4 43.3 47.2 51.1 55.1 59.0 62.9 66.8 210 28.1 32,0 36.0 40.0 43.9 47.9 51,9 55.8 59.8 63.8 67.8 220 28.5 32.5 36.5 40.5 44.5 48.5 52.5 56.6 60.6 64.6 68.6 230 28.9 32.9 36.9 41.0 45.0 49.1 53.2 57.2 61.3 65.3 69.4 240 29.2 33.3 37.4 41.4 45.5 49.6 53.7 57.8 61.9 66.0 70.1 250 29.5 33.6 37.7 41.9 46.0 50.1 54.3 58.4 62.5 66.6 70.8 260 29.8 34.0 38.1 42.3 46.4 50.6 54.7 58.9 63.1 67.2 71.4
270 30.1 34.3 38.4 42.6 46.8 51.0 55.2 59.4 63.6 67.8 72.0 280 30.4 34.6 38.8 43.0 47.2 51.4 55.6 59.8 64.0 68.3 72.5 290 30.6 34.8 39.0 43.3 47.5 51.8 56.0 60.2 64.5 68.7 73.0 300 30.8 35.1 39.3 43.6 47.8 52.1 56.4 60.6 64.9 69.2 73.4 310 31.0 35,3 39.6 43.8 48.1 52.4 56.7 61.0 65.3 69.6 73.9 320 31.2 35.5 39.8 44.1 48.4 52.7 57.0 61.3 65.6 70.0 74.3 330 31.4 35.7 40.0 44.3 48.7 53.0 57.3 61,6 66.0 70.3 74.7 340 31.6 35.9 40.2 44.6 48.9 53.3 57.6 61.9 66.3 70.7 75.0 350 31.8 36.1 40.4 44.8 49.1 53.5 57.9 62.2 66.6 71.0 75.3 360 31.9 36.3 40.6 45.0 49.4 53.7 58.1 62.5 66.9 71.3 75.7 370 32.1 36.4 40.8 45.2 49.6 54.0 58.3 62.7 67.1 71.5 75.9 380 32,2 36,6 41.0 45.4 49.8 54.2 58.6 63.0 67.4 71.8 76.2 390 32.3 36.7 41.1 45.5 49.9 54.4 58.8 63.2 67.6 72.1 76.5 400 32.5 36.9 41.3 45.7 50.1 54.5 59.0 63.4 67.9 72.3 76.7
1 From equation 1 (in meters). Values correspond to height-growth curves shown in figure 4. Estimates for ages greater than 270 years bh are extrapolations of the data base.

80
70
60
¢~ 50
40
o) 3o
2O
10
I I
H 1 0 0 m ( m e t e r s ) 50
0 50 100
35
23 2o
t I I I I J 150 200 250
B r e a s t - h e i g h t age (years )
300 350 400
Figure 4--Height-growth curves for Douglas-fir (in meters) corre- sponding to equation 1 (in meters). These curves express the pattern of height growth of dominant trees in relation to age, within even-aged stands. The curves should be used to express height development in the construction of yield functions representing average development of even-aged stands actually attaining specified heights at index age 100 (site indices).
Equations for Site Index Preliminary regression equations (HIO0 - 4 . 5 ) = a + b (H - 4.5) and (HIO0 - 4.5) = a + b (H - 4.5) + c(H - 4.5) = were fitted to data for individual, successive 10-year inter- vals of age bh. Estimated regression coefficients were plotted over age and the resulting graphs examined to determine if regression coefficients are related to age bh. Identified trends were used as guides in the selection of equation models for expressing the HIO0 = f (H, age) relationship for all combined data.

We encountered difficulties when we tried to develop a single site-index estimation equation for the complete data set because of the wide range in ages and the small number of data points in the upper portion of the age range. To overcome these difficulties and to simplify curve fitting, we divided the pooled data into two groups: (1) ages less than or equal to 100 years bh, and (2) ages over 100 years bh. Sepa- rate, weighted regression equations were fitted to each data group. Both equations were conditioned so that H100 = H at age bh = 100 (Curtis and others 1974b).
Equation 2, in feet (ages<__100 years bh):
where:
(H100) = 4.5 +a+b(H-4.5) ;
a = 0.01006(100-A) 2 , and
b = 1.0 +0.00549779 (100-A ) +1.46842 x l 0 -14 (100-A) ~ .
Standard error of estimate of the transformed variable, w(H100-H), was 0.241.2
Corresponding numerical values are shown in table 3, and curves in figure 5, for ages bh of 10 through 100 years.
2 w(H100-H) was the dependent variable used to derive the equation (Curtis and others 1974b).
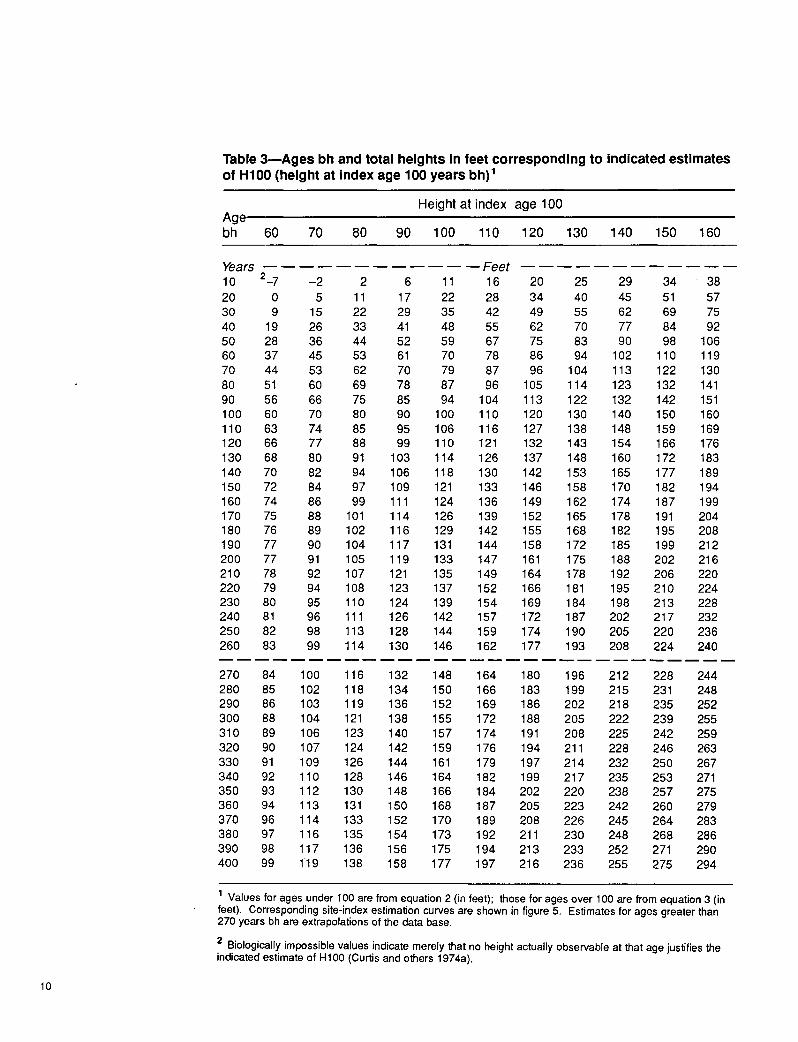
Table 3--Ages bh and total heights in feet corresponding to indicated estimates of HIO0 (height at index age 100 years bh) 1
Heightatindex age 100 Age. bh 60 70 80 90 100 110 120 130 140 150 160
Years Feet 10 2-7 -2 2 6 11 16 20 25 29 34 38 20 0 5 11 17 22 28 34 40 45 51 57 30 9 15 22 29 35 42 49 55 62 69 75 40 19 26 33 41 48 55 62 70 77 84 92 50 28 36 44 52 59 67 75 83 90 98 106 60 37 45 53 61 70 78 86 94 102 110 119 70 44 53 62 70 79 87 96 104 113 122 130 80 51 60 69 78 87 96 105 114 123 132 141 90 56 66 75 85 94 104 113 122 132 142 151 100 60 70 80 90 100 110 120 130 140 150 160 110 63 74 85 95 106 116 127 138 148 159 169 120 66 77 88 99 110 121 132 143 154 166 176 130 68 80 91 103 114 126 137 148 160 172 183 140 70 82 94 106 118 130 142 153 165 177 189 150 72 84 97 109 121 133 146 158 170 182 194 160 74 86 99 111 124 136 149 162 174 187 199 170 75 88 101 114 126 139 152 165 178 191 204 180 76 89 102 116 129 142 155 168 182 195 208 190 77 90 104 117 131 144 158 172 185 199 212 200 77 91 lO5 119 133 147 161 175 188 202 216 210 78 92 107 121 135 149 164 178 192 206 220 220 79 94 108 123 137 152 166 181 195 210 224 230 80 95 110 124 139 154 169 184 198 213 228 240 81 96 111 126 142 157 172 187 202 217 232 250 82 98 113 128 144 159 174 190 205 220 236 260 83 99 114 130 146 162 177 193 208 224 240
270 84 100 116 132 148 164 180 196 212 228 244 280 85 102 118 134 150 166 183 199 215 231 248 290 86 103 119 136 152 169 186 202 218 235 252 300 88 104 121 138 155 172 188 205 222 239 255 310 89 106 123 140 157 174 191 208 225 242 259 320 90 107 124 142 159 176 194 211 228 246 263 330 91 109 126 144 161 179 197 214 232 250 267 340 92 110 128 146 164 182 199 217 235 253 271 350 93 112 130 148 166 184 202 220 238 257 275 360 94 113 131 150 168 187 205 223 242 260 279 370 96 114 133 152 170 189 208 226 245 264 283 380 97 116 135 154 173 192 211 230 248 268 286 390 98 117 136 156 175 194 213 233 252 271 290 400 99 119 138 158 177 197 216 236 255 275 294
1 Values for ages under 100 are from equation 2 (in feet); those for ages over 100 are from equation 3 (in feet). Corresponding site-index estimation curves are shown in figure 5. Estimates for ages greater than 270 years bh are extrapolations of the data base.
2 Biologically impossible values indicate merely that no height actually observable at that age justifies the indicated estimate of H100 (Curtis and others 1974a).
10

160
Age bh
~0
140
120
o o
1oo
~ 80
60
40 0 50 100 150
Tree he igh t ( feet )
200 250 300
Figure 5---Estimation curves for site index for Douglas-fir. Curves for ages less than 100 years bh correspond to equation 2 (in feet); those for ages over 100 years bh correspond to equation 3 (in feet). Use these curves for estimating site index; that is, for estimating height at 100 years bh of a tree observed at some other age.
Equation 2, in meters (ages _< 100 years bh):
H100 m = 1.3716+a+b (H=-1.3716) ; where:
a = (0.00305 (100-A)2 ), and
b = [1.0 +0.00549779 (100-A) +1.46842,1 0-14 (100-A )7 ].
Corresponding metric values are shown in table 4 and curves in figure 6 for ages bh of 10 through 100 years.
11

Table 4--Ages bh and total heights in meters corresponding to Indicated esti- mates of H100 m (height at Index age 100 years bh) 1
Height at index age 100 Age bh 20 23 26 29 32 35 38 41 44 47 50
Years Meters
10 2 -1.3 0.0 1.3 2.7 4.1 5.4 6.8 8.2 9.5 10.9 12.3 20 0.9 2.6 4.3 6.0 7.7 9.4 11.2 12.9 14.6 16.3 18.0 30 3.8 5.8 7.8 9.8 11.8 13.8 15.8 17.8 19.8 21.7 23.7 40 7.0 9.1 11.3 13.5 15.7 17.9 20.1 22.3 24.5 26.6 28.8 50 9.9 12.3 14.6 16.9 19.3 21.6 23.9 26.3 28.6 30.9 33.2 60 12.6 15.1 17.5 20.0 22.4 24.9 27.3 29.8 32.3 34.7 37.2 70 15.0 17.6 20.2 22.7 25.3 27.9 30.4 33.0 35.6 38.2 40.7 80 17.1 19.8 22.5 25.2 27.9 30.6 33.3 36.0 38.7 41.4 44.1 90 18.7 21.6 24.4 27.3 30.1 33.0 35.8 38.6 41.5 44.3 47.2 100 20.0 23.0 26.0 29.0 32.0 35.0 38.0 41.0 44.0 47.0 50.0 110 21.1 24.3 27.5 30.7 33.9 37.0 40.2 43.4 46.6 49.8 53.0 120 22.0 25.3 28.6 31.9 35.3 38.6 41.9 45.2 48.5 51.9 55.2 130 22.8 26.2 29.6 33.1 36.5 40.0 43.4 46.9 50.3 53.7 57.2 140 23.5 27.0 30.6 34.1 37.7 41.3 44.8 48.4 51.9 55.5 59.0 150 24.1 27.8 31.4 35.1 38.8 42.4 46.1 49.8 53.4 57.1 60.8 160 24.6 28.4 32.1 35.9 39.7 43.5 47,2 51.0 54.8 58.6 62.3 170 25.0 28.9 32.8 36.6 40.5 44.4 48.3 52.1 56.0 59.9 63.8 180 25.4 29.3 33.3 37.3 41.3 45.2 49.2 53.2 57.2 61.1 65.1 190 25.7 29.7 33.8 37.9 42.0 46.0 50.1 54.2 58.2 62.3 66.4 200 26,0 30.2 34.3 38.5 42.6 46.8 51.0 55.1 59.3 63.5 67.6 210 26.3 30.6 34.8 39.1 43.3 47.6 51.8 56.1 60.4 64.6 68.9 220 26.6 31.0 35.3 39.7 44.0 48.4 52.7 57.1 61.4 65.8 70.1 230 27.0 31.4 35.8 40.3 44.7 49.2 53.6 58.0 62.5 66.9 71.3 240 27.3 31.8 36.4 40.9 45.4 49.9 54.5 59.0 63.5 68.0 72.6 250 27,7 32.3 36.9 41.5 46.1 50.7 55.3 60.0 64.6 69.2 73.8 260 28,0 32.7 37.4 42.1 46.8 51.5 56.2 60.9 65.6 70.3 75.0
270 28.4 33.2 38.0 42.8 47.5 52.3 57.1 61.9 66.7 71.5 76.3 280 28.8 33.7 38.5 43.4 48.3 53.1 58.0 62.9 67.7 72.6 77.5 290 29,2 34.1 39.1 44.0 49.0 53.9 58.9 63.8 68.8 73.8 78.7 300 29.6 34.6 39.6 44.7 49.7 54.7 59.8 64.8 69.9 74.9 79.9 310 29,9 35.1 40.2 45.3 50.4 55.5 60.7 65.8 70.9 76.0 81.1 320 30.3 35.5 40.7 45.9 51.1 56.4 61.6 66.8 72.0 77.2 82.4 330 30.7 36.0 41.3 46.6 51.9 57.2 62.4 67.7 73.0 78.3 83.6 340 31.1 36.5 41.9 47.2 52.6 58.0 63.3 68.7 74.1 79.4 84.8 350 31.5 37.0 42.4 47.9 53.3 58.8 64.2 69.7 75.1 80.6 86.0 360 32.0 37.5 43.0 48.5 54.1 59.6 65.1 70.6 76.2 81.7 87.2 370 32.4 38.0 43.6 49.2 54.8 60.4 66.0 71.6 77.2 82.8 88.4 380 32.8 38.5 44.1 49.8 55.5 61.2 66.9 72.6 78.3 84.0 89.7 390 33.2 38.9 44.7 50.5 56.3 62.0 67.8 73.6 79.3 85.1 90.9 400 33.6 39.4 45.3 51.1 57.0 62.8 68.7 74.5 80.4 86.2 92.1
1 Values for ages under 100 are from equation 2 (in meters); those for ages over 100 are from equation 3 (in meters). Corresponding site-index estimation curves are shown in figure 6. Estimates for ages greater than 270 years bh are extrapolations of the data base.
2 Biologically impossible values indicate merely that no height actually observable at that age justifies the indicated estimate of H100 m (Curtis and others 1974a).
12

50
Age bh
45
40 P cO
o 32 0
" ~ 3 o
~ 25
c
~ 20
15
10 0 10 20 30 40 50 60
Tree height (meters) 70 80 90
Figure 6--Estimation curves for site index for Douglas-fir. Curves for ages less than 100 years bh correspond to equation 2 (in meters); those for ages over 100 bh correspond to equation 3 (in meters). Use these curves for estimating site index; that is, for estimating height at 100 years bh of a tree observed at some other age.
Equation 3, in feet (ages > 100 years bh):
-0 .95 (100 / (A -100 ) ) 2 H100 = 4.5 +[7.6672 (e )]
+ [1 .0-0 .730948 (Ioglo A-2.0) o.a ] [H-4.5] .
Standard error of estimate of the transformed variable, w(H100-H), was 1.008.
Corresponding numerical values are shown in table 3, and curves in figure 5, for ages 100 + years bh.
Equation 3, in meters (ages>100 years bh):
H100 m =1.3716 +[2.33709(e -0"95 ( 1 0 0 / ( A - 1 0 0 ) ) 2 ) ]
+[1.0-0.730948 (Ioglo A -2 .0 ) ] ° 8 [Hm_ 1.3716].
Corresponding metric values are shown in table 4 and curves in figure 6, for ages 100+ years bh.
13

Discuss ion
Estimation Curves for Height Growth
Estimation Curves for Site Index
Possible Bias
Primary reasons for selecting 100 years bh as the index age were (1) the growth characteristics of Douglas-fir at high elevations and (2) the relatively long rotations that seem probable given the growth characteristics of the species.
As pointed out by Curtis and others (1974a), the dependent variable used to develop site-index equations should be different from the one used to develop height-growth equations. Corresponding curves from these equations are appropriate for different u s e s .
Height curves presented in this paper express the pattern of height growth of the tallest dominant Douglas-fir trees in relation to age, within even-aged stands. "H" was the dependent variable used to fit equations. Appropriate uses for these curves include estimating height development of stands actually attaining specified heights at index age (site index) and estimating stand-height development in the construction of yield tables.
Figures 3 and 4 demonstrate the ability of the tallest undamaged Douglas-fir trees (about 5 trees per acre) to maintain a good rate of height growth at advanced ages. Curtis and others (1974b) compared the height-growth curves for high elevation to two sets of height-growth curves (King 1966; McArdle and others 1930, 1961) developed for low-elevation Douglas-fir and found their shapes to be quite different. Although no data are available, such differences in height growth must be associated with similar differences in volume growth.
H100 was the dependent variable used to fit site-index equations. For ages other than index age, the site-index estimation curves shown in figures 5 and 6 provide better estimates of height at index age than does the traditional inverted form of height- growth curves. Thus, the primary use of these curves should be to estimate stand height at index age 100.
The height-growth and the site-index curves appear to be unbiased. Plots were established in carefully chosen stands that were evaluated as even-aged. Within these stands, only the tallest, undamaged, dominant tree of each species was selected for stem analysis. Trees that were sectioned and later found to have unusual growth patterns (caused by broken tops, suppression, insects and disease, or other damaging agents) were either replaced or discarded.
A possible bias could exist, even after we used these careful selection criteria, if undetected effects of broken tops, suppression, insects and disease, or other damag- ing agents were present or if the tallest trees selected at the time of cutting were not always the tallest throughout the life of the stand. As pointed out by Dahms (1963), bias can be introduced by such shifts in relative crown positions of sample trees over time. These shifts probably would not materially alter the shape of the curves within the age range of 100-250 years but could introduce bias at the younger ages.
Because of the shade intolerance of upper slope Douglas-fir, bias caused by shifts in relative crown position is not expected.
14

Application of Curves
L i terature Ci ted
The following criteria for applying the noble fir curves presented by Herman and others (1978) are also valid for the Douglas-fir curves:
• Trees must be growing in even-aged stands.
• Each Douglas-fir selected for site-index estimation must be the tallest, undamaged, dominant tree on an area of about 0.25 acre.
• Trees that are of a different age class from surrounding trees should be avoided.
• Curves are applicable to upper elevation forests in the Cascade Range between McKenzie Pass in Oregon and Stevens Pass in Washington.
When estimating the site index for a stand:
• Select a sample of undamaged, dominant Douglas-fir trees well distributed over the area (about 4 or 5 per acre).
• Determine total height and age bh for each tree.
• Use values from step 2 and equations 2 and 3, tables 3 and 4, or figures 5 and 6.
• Calculate the mean of the site-index values to estimate the site index of the stand.
Curtis, Robert O.; DeMars, Donald J.; Herman, Francis R. 1974a. Which depend- ent variable in site index-height-age regressions? Forest Science. 20(1): 74-87.
Curtis, Robert 0.; Herman, Francis R.; DeMars, Donald J. 1974b. Height growth and site index for Douglas-fir in high-elevation forests of the Oregon-Washington Cascades. Forest Science. 20 (4): 307-316.
Dahms, Walter G. 1963. Corrections for a possible bias in developing site index curves from sectioned tree data. Journal of Forestry. 61 (1): 25-27.
Franklin, Jerry F.; Dryness, C.T. 1973. Natural vegetation of Oregon and Washing- ton. Gen. Tech. Rep. PNW-8. Portland, OR: U.S. Department of Agriculture, Forest Service, Pacific Northwest Forest and Range Experiment Station. 417 p.
Heger, L. 1968. A method of constructing site index curves from stem analysis. Forest Chronicles. 44(4): 11-15.
15

Herman, Francis R.; DeMars, Donald J.; Woollard, Robert F. 1975. Field and com- puter techniques for stem analysis of coniferous forest trees. Res. Pap. PNW-194. Portland, OR: U.S. Department of Agriculture, Forest Service, Pacific Northwest Forest and Range Experiment Station. 51 p.
Herman, Francis R.; Curtis, Robert O.; DeMars, Donald J. 1978. Height growth and site index estimates for noble fir in high elevation forests of the Oregon-Wash- ington Cascades. Res. Pap. PNW-243. Portland, OR: U.S. Department of Agricul- ture, Forest Service, Pacific Northwest Forest and Range Experiment Station. 15 p.
King, James E. 1966. Site index curves for Douglas-fir in the Pacific Northwest. Weyerhaeuser For. Pap. 8. Centralia, WA: Weyerhaeuser Forestry Research Center. 49 p.
McArdle, Richard E.; Meyer, Walter H. 1930. The yield of Douglas-fir in the Pacific Northwest. Tech. Bull. 201. Washington, DC: U.S. Department of Agriculture. 64 p.
McArdle, Richard E.; Meyer, Walter H.; Bruce, Donald. 1961. The yield of Douglas- fir in the Pacific Northwest. Tech. Bull. 201. Washington, DC: U.S. Department of Agriculture. 72 p.
16

DeMars, Donald J.; Herman, Francis R. 1987. Douglas-fir in high- elevation forests of the Oregon-Washington Cascade Range: curves and tables for field application. Res. Pap. PNW-RP-378. Portland, OR: U.S. Department of Agriculture, Forest Service, Pacific North- west Research Station. 16 p.
Estimation equations for height growth and site index were derived from stem-analysis data of Douglas-fir (Pseudotsuga menziesfi [ Mirb.] Franco var. menziesfi) in the high-elevation forests of the Cascade Range in Oregon and Washington. Two sets of height-growth and site- index estimation curves and tables produced from previously published equations are presented--one set with U.S. customary units of measure and another set with metric units. These curves and tables were designed for use in the field by forest managers.
Keywords: Site index, increment (height), stem analysis, stand age, altitude (-site, Douglas-fir (coast), Oregon (Cascade Range), Washington (Cascade Range).
The Forest Service of the U.S. Department of Agriculture is dedicated to the principle of multiple use management of the Nation's forest resources for sustained yields of wood, water, forage, wildlife, and recreation. Through forestry research, cooperation with the States and private forest owners, and management of the National Forests and National Grasslands, it s t r ives--as directed by Congress-- to provide increasingly greater service to a growing nation.
The U.S. Department of Agriculture is an Equal Opportunity Employer. Applicants for all Department programs will be given equal consideration without regard to race, color, sex, religion, or national origin.
Pacific Northwest Research Station 319 S.W. Pine St. P.O. Box 3890 Portland, Oregon 97208

August 1987
U.S. Department of Agriculture Pacific Northwest Research Station 319 S.Wo Pine Street P.O. Box 3890 Portland, Oregon 97208
BULK RATE POSTAGE + FEES PAID USDA-FS
PERMIT No. G°40
Official Business Penalty for Private Use, $300
do NOT detach label