estimating bark thickness of pinus radiata - scion · bark measurement increases the cost of taking...
TRANSCRIPT

340
ESTIMATING BARK THICKNESS OF PINUS RADIATA
A. GORDON
Forest Research Institute, New Zealand Forest Service, Private Bag, Rotorua, New Zealand
(Received for publication 19 September 1983; revision 3 October 1983)
ABSTRACT
Bark thickness in Pinus radiata D. Don is related to over-bark diameter, position up the stem, tree height, and breast-height over-bark diameter. Equations have been derived for predicting bark thickness as a function of these variables and as a function of over-bark diameter alone. By using the bark thickness equations, routine bark-gauge measurements together with their associated measurement errors can be eliminated, which should accelerate the derivation of new, more precise, stem volume functions. The bark thickness equations, used in conjunction with a tree or log taper function, can provide estimates of the volume of bark to be harvested or available for utilisation.
INTRODUCTION
As all standing timber is encased in bark, measurement of wood volume requires some adjustment to reduce over-bark to under-bark diameters. Most tree volume equations predict the under-bark volume of the stem from a few, efficiently measured, tree variables. To derive these equations a sample of trees is usually sectionally measured to determine "actual" under-bark volume. In New Zealand the adjustment to over-bark diameters is generally made by subtracting the sum of two bark thickness readings from a Swedish bark gauge.
By sampling the bark thickness, bias and imprecision are introduced to the "actual" under-bark volume and so to the derived volume and taper equations. But, as volume and taper equations are the primary building blocks for many mensuration systems, accuracy and precision are essential at this stage to avoid multiplicative errors.
The Swedish bark gauge is not an ideal instrument for a number of reasons. Over-estimation of bark by this gauge has been noted by von Althen (1964) and specifically for P. radiata by Carron & Mclntyre (1959). Tests on P. radiata in New Zealand have shown a resulting 1.44% under-estimate in the volume of 72 logs which were peeled to measure "actual" volume (J. Beers, pers. comm.). The imprecision in volume estimate owing to sampling bark thickness was 1.31% (standard error of the mean as a percentage of "actual") for two readings at each diameter point, decreasing to 0.83% for five readings. This sampling error associated with only two* readings tended to increase toward the base of the tree where the bark is rough and the stem
New Zealand Journa l of Fores t ry Science 13(3): 340-53 (1983)
Gordon — Estimating bark thickness 341
can be fluted. Operator fatigue due to bruised hands can cause bias, especially when measuring large P. radiata whose lower bark often exceeds 50 mm in thickness. The importance of operator experience was noted by Gray (1956) who also mentioned that inaccurate readings are easily made. Seasonal bias, due to changes in the density and moisture content of the outer wood layers, results from the gauge entering this wood easily in early summer and so over-estimating (von Althen 1964). When felled trees are being measured, the bark on the underside is effectively removed from the sampling frame unless the logs are destroyed by sectional cutting. Finally, the time involved in bark measurement increases the cost of taking sectional measurements and/or decreases the size of the tree sample.
Thus although over-bark volume can be measured comparatively accurately and rapidly, the under-bark volumes derived using Swedish bark gauge adjustments are less reliable, despite the amount of effort that goes into bark measurement.
As interest increases in efficient use of timber harvesting residues, prediction of the volume and proportions of bark will become important. Although regression equations have been derived to predict bark thickness and volume for P. radiata at Kaingaroa Forest (C. J. Goulding, unpubl. data), the data were collected using a Swedish bark gauge and so incorporate the errors mentioned above.
The work reported here is based on data derived solely from taped diameter measurements taken (a) over-bark and (b) under-bark after removing the bark.
The following notation is used:
D = Taped diameter over-bark (cm)
d = Taped diameter under-bark after bark peeled (cm)
B = D - d = double bark thickness (cm)
Di.4 = Taped over-bark diameter 1.4 m above ground (cm)
H = Total tree height (m)
h = Level of measurement above ground (m)
V0b = Volume over-bark (m3)
V u b = Volume under-bark (m3)
Vb = V0b - Vub = bark volume (m3)
Vbs = Volume of bark substance (m3)
SbS = Cross-sectional surface area of bark substance (m 2 )
A n impor tan t distinction mus t be m a d e between bark volume (Vb) and the volume
of bark substance (Vbs). T h e former is equivalent to
h = H
I (D2 - d2) dh where d and D are functions of h 40000 J
and thus includes all the spaces (caused by cracks, gaps, and projections in the bark surface) enclosed within the diameter tape when D is measured. Vbs is then Vb minus the volume of these spaces.

342 New Zealand Journal of Forestry Science 13(3)
DATA AND METHODS
The data used were drawn from several sources but all diameter measurements were made using a tape, and the bark was removed by peeling to obtain under-bark readings. Because of a preponderance of observations taken on 10-year-old trees, the data were split into two sets. The 10-year-old trees made up a fairly balanced set and were used to examine bark thickness variation between different localities and individual trees. This set comprised 994 observations on 169 trees from 13 localities, and was also used as independent data to verify functions fitted to the main set.
Six localities were represented in the main data set of 1934 observations on 206 trees. A wide range of tree sizes was covered but the age classes were not uniformly represented as only measurements on 11- and 15-year-old trees were available for two localities. Tables 1 and 2 give the localities from which the trees were sampled and Figs 1 and 2 show the characteristics of the main data set.
TABLE 1—Data set for 10-year-old trees
Locality No. of trees No. of observations
Total Average per tree
Lake Taupo Maramarua Athenree Tairua Whangapoua Kaingaroa Waipoua Aupouri Waitangi Waiuku Riverhead Glenbervie Woodhill
19 10 20 19 19 10 10 10 10 10 12 10 10
115 57
118 114 97 58 61 68 60 51 71 63 61
6.1 5.7 5.9 6.0 5.1 5.8 6.1 6.8 6.0 5.1 5.9 6.3 6.1
169 994
900
^ 7 0 0 LU
g 5 0 0
(Z 300|_ LL
100 10 20 30 AGE
40 50
FIG. 1—Distribution of observations by age.
Gordon — Estimating bark thickness
TABLE 2—Main data set
343
Locality
Kaingaroa
Tairua
Whakarewarewa Lake Taupo Rotoehu
Woodhill
Age (years)
11 13 15 18 39 24 46 8
11 11 15 20 29
No. of trees
11 49 21 10 21 5
17 12 20 10 10 10 10
206
No.
Total
62 639 208 66
221 33
200 95
157 67 58 60 68
1934
of observations
Average per tree
5.6 13.0 9.9 6.6
10.5 6.6
11.9 7.9 7.9 6.7 5.8 6.0 6.8
60h
40 I O LU
I LU 20 LU
er
* * * * * * * * A
x l I L J . _L 10 30 50 70
BREAST HEIGHT DIAMETER OVER-BARK (cm)
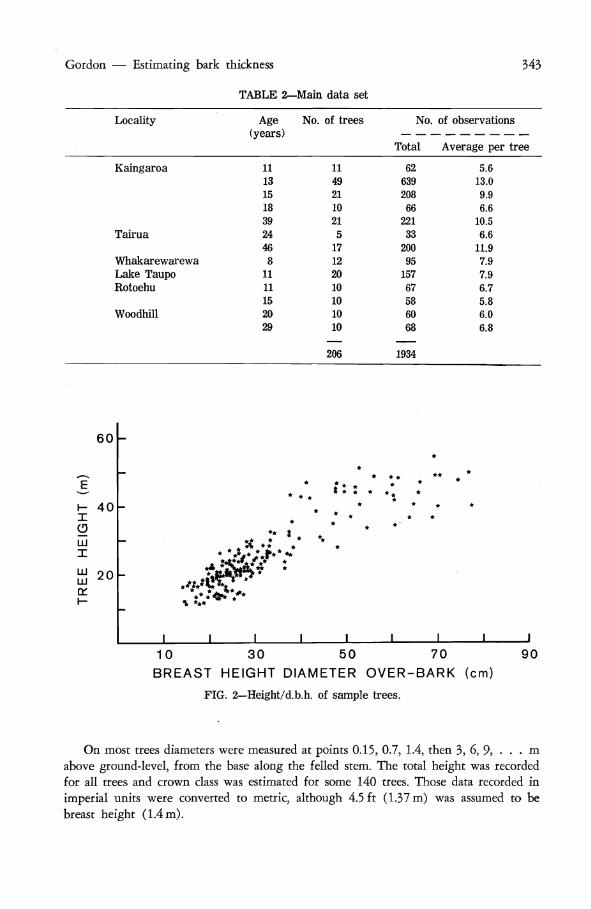
FIG. 2—Height/d.b.h. of sample trees.
90
On most trees diameters were measured at points 0.15, 0.7, 1.4, then 3, 6, 9, . . . m above ground-level, from the base along the felled stem. The total height was recorded for all trees and crown class was estimated for some 140 trees. Those data recorded in imperial units were converted to metric, although 4.5 ft (1.37 m) was assumed to be breast height (1.4m).
344 New Zealand Journal of Forestry Science 13(3)
RESULTS
Variation in Bark Thickness
Bark thickness, B, varies considerably with changes in diameter. The range of values of D, d, B, and the ratio d / D is given in Table 3.
TABLE 3—Range of main data set
Diameter over-bark (cm)
Diameter under-bark (cm)
Double bark thickness (cm)
Ratio of d/D
Minimum
2.2
1.8
0.3
0.78
Mean
22.3
20.7
1.7
0.93
Maximum
81.0
75.5
10.4
0.98
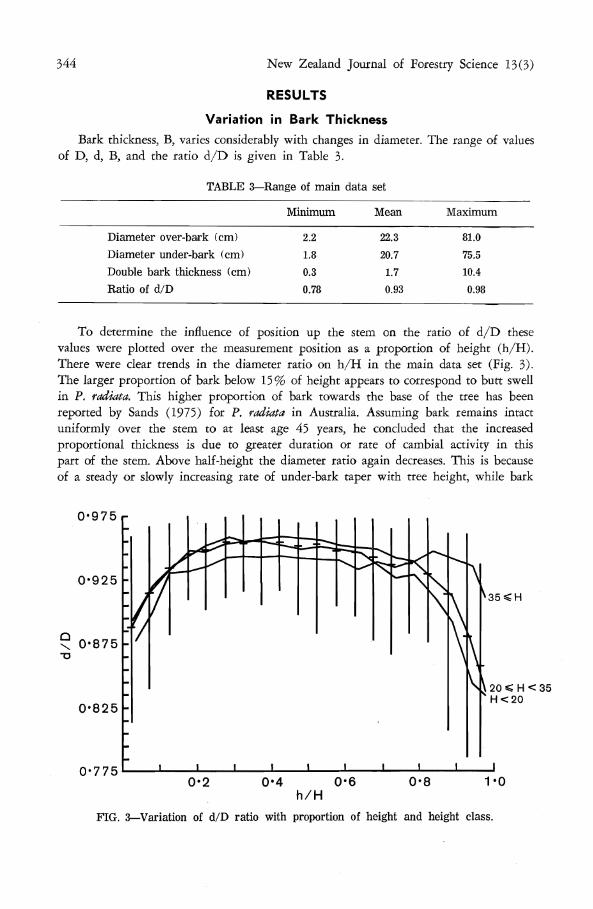
To determine the influence of position up the stem on the ratio of d / D these values were plotted over the measurement position as a proportion of height (h /H) . There were clear trends in the diameter ratio on h / H in the main data set (Fig. 3). The larger proportion of bark below 15% of height appears to correspond to butt swell in P. radiata. This higher proportion of bark towards the base of the tree has been reported by Sands (1975) for P. radiata in Australia. Assuming bark remains intact uniformly over the stem to at least age 45 years, he concluded that the increased proportional thickness is due to greater duration or rate of cambial activity in this part of the stem. Above half-height the diameter ratio again decreases. This is because of a steady or slowly increasing rate of under-bark taper with tree height, while bark
0 - 9 7 5 r
35 <H
20 ^ H < 35 H<20
0*2 0*4 0-6 0*8 1*0 h/H
FIG. 3—Variation of d/D ratio with proportion of height and height class.

Gordon — Estimating bark thickness 345
thickness tends to a constant value (approximately B = 0.5). This has been shown for a number of coniferous species, especially the North American "southern" pines by Mesavage (1969) and in Britain by MacDonald (1933) who reported that "The rapid increase in bark percentage in the last two sections (80-100% of height) is characteristic of all the conifers which have been investigated; it is, however, more pronounced in the smaller trees."
By dividing the main data set into height classes and plotting diameter ratio means over h / H groups, the effect of the size is clarified. The clear divergence of points as h / H exceeds 80% (Fig. 3) indicates that the point at which under-bark diameter begins to decrease more rapidly, and the resulting d / D ratio begins to drop, is related to tree height. A measurement of crown level was available for some of the data and this point proved to be in close agreement with the beginning of the d / D ratio decrease. As Larson (1963) pointed out, the form of the stem within the crown differs appreciably from that below. Thus the effect of height appears to result from the general increase in proportional crown level with height.
To examine bark thickness variation between localities and between trees the data set for 10-year-old trees was used. For consistency with the estimating equations (see below) variation in the transformed ratio loge (B/D), adjusted for position in the stem and tree height by the covariates (1 - h / H ) 9 and (h/H)°-2 6 8 H, was analysed (Table 4). The effect of locality and trees within locality were both significant at the 5% level, but the actual proportion of variation associated with these factors was not large.
TABLE 4—Variance components of the transformed bark ratio loge (B/D)
Source
Covariates
Locality
Tree within locality
Error
Variance
0.0695
0.0051
0.0110
0.0309
Percentage
59.7
4.3
9.4
26.6
Estimating Bark Thickness
The main data set was used to develop equations for estimating bark thickness. To meet practical requirements two prediction equations were considered.
(1) As a function of D, h, H, D±,}l
A number of different equation types using these variables were tried to describe the d / D curve as it varies with proportional height. Many equations failed to predict adequately near h = O or h = H. Consistently better results were obtained by using loge (B/D) as the dependent variable, and two terms in h / H .
In the general form:
loge (B/D) = bo + bi (1 - h /H) P l + b2 (h /H)* 2 (1)
346 New Zealand Journal of Forestry Science 13(3)
To account for the effect of height on the rate of d /D decrease (Fig. 3), P2 was replaced by various functions of height and normal distribution maximum likelihood estimates of the parameters obtained.
The solution
Px = 9.0 and P2 = 0.268 H (2)
was adopted, as the resulting equation fitted the data well and showed no undesirable characteristics when solved for extreme or unusual combinations of variables.
Di.4 and H/D1.4 were found to make small but significant decreases in the residual variation of loge (B/D) and were added to the equation. The final version took this form:
loge (B/D) = bo + bi (1 - V H ) b 2 + b3 ( h / H ) ^ + b5 Dx.4 + b 6 H/D1.4 (3)
The coefficients (with standard errors) are:
bo bi b2 b3
-3 .023 (0.044) 1.107 (0.020) 9.0 (0.4) 1.564 (0.037)
b4 bs bfi
0.268 (0.013) 0.004 28 (0.000 42) -0 .226 (0.043)
Under-bark diameter is then estimated as d = D - B
(2) As a function of D
An approximate but robust means of estimating bark thickness and volume was given by Meyer (1946) who observed that the plot of d over D formed a straight line. As the variance of d increased proportionally with D, the weighted least squares solution of the equation:
d = k D (4)
2d is given by: k — —_ (5)
2 D
From this Meyer developed the following estimates:
B = D (1 - k) (6)
Vb = Vob (1 - k2) _ . (7)
[or Vb = V u b (1/k2 - 1) _ (8)}
From the main data set a value of k = 0.926 was calculated using (4). Although this value can be used to estimate B in (6) it will give biased estimates of bark volume. The application of Equations (7) and (8) should be limited, as Meyer noted, to trees of one size-class and sample measurements to estimate k must be taken at the half-volume point up the stem to minimise bias. Values of k, over three height-classes, were calculated from (4) using those measurements closest to the half-volume point of each tree (Table 5). More accurate estimates of bark volume using (7) and (8) will be obtained using these values.
Gordon — Estimating bark thickness
TABLE 5—k values and bark volume percentages
347
k
Bark volume
Percentage of Vob
Percentage of VUb
< 2 0 m
0.951
9.6
10.6
Height classes
20-35 m
0.951
9.5
10.5
> 35 m
0.938
12.1
13.7
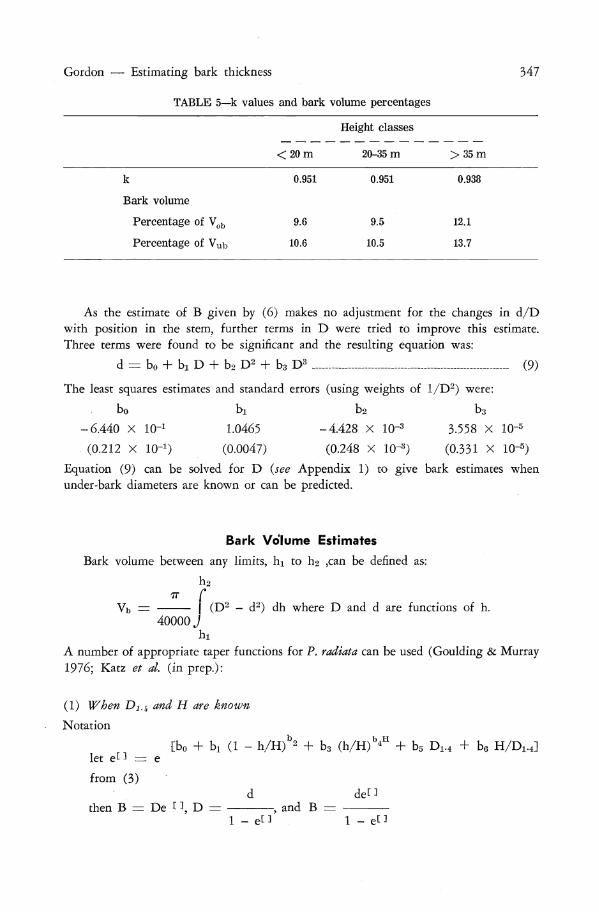
As the estimate of B given by (6) makes no adjustment for the changes in d/D with position in the stem, further terms in D were tried to improve this estimate. Three terms were found to be significant and the resulting equation was:
d = b0 + bi D + b2 D2 + b3 D
3 (9)
The least squares estimates and standard errors (using weights of 1/D2) were:
bo bi bs b3
-6.440 X IO-1 1.0465 -4.428 X IO"3 3.558 X 10~5
(0.212 X IO"1) (0.0047) (0.248 X 10~3) (0.331 X IO"5)
Equation (9) can be solved for D (see Appendix 1) to give bark estimates when under-bark diameters are known or can be predicted.
Bark Volume Estimates
Bark volume between any limits, hi to I12 ,can be defined as:
h2
Vb = 77 C
I (D2 - d2) dh where D and d are functions of h. 40000 J
hi A number of appropriate taper functions for P. radiata can be used (Goulding & Murray 1976; Katz et al. (in prep.):
(1) When Dt.ii and H are known
Notation
[b0 + bi (1 - h/H)"2 + b3 (h/H)b4H + b5 D1.4 + b6 H/Di.4] let e [ ] = e
from (3) d d e "
then B = De " , D = , and B = 1 - e " 1 - e "
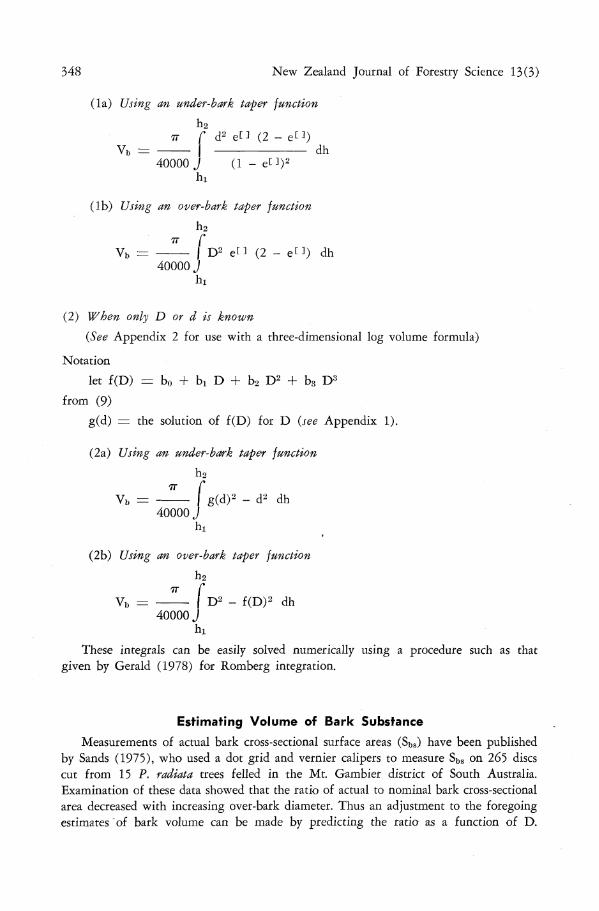
348 New Zealand Journal of Forestry Science 13(3)
(Ia) Using an under-bark taper function
h2 77 f d2 e " (2 - e " )
Vb = | dh 40000 J (1 - € " ) 2
hi
(Ib) Using an over-bark taper junction
h2
77 r Vb = I D2 e " (2 - e " ) dh
40000 J hi
(2) When only D or d is known
(See Appendix 2 for use with a three-dimensional log volume formula)
Notation
let f(D) = b0 + bi D + b2 D2 + b3 D3
from (9)
g(d) = the solution of f(D) for D (see Appendix 1).
(2a) Using an under-bark taper junction
h2
Vb = - ^ — I g(d)2 - d2 dh 40000 J
hi
(2b) Using an over-bark taper junction
h2
77 r Vb = I D2 - f(D)2 dh
40000 J hi
These integrals can be easily solved numerically using a procedure such as that given by Gerald (1978) for Romberg integration.
Estimating Volume of Bark Substance
Measurements of actual bark cross-sectional surface areas (Sbs) have been published by Sands (1975), who used a dot grid and vernier calipers to measure Sbs on 265 discs cut from 15 P. radiata trees felled in the Mt. Gambier district of South Australia. Examination of these data showed that the ratk> of actual to nominal bark cross-sectional area decreased with increasing over-bark diameter. Thus an adjustment to the foregoing estimates "of bark volume can be made by predicting the ratio as a function of D.
Gordon — Estimating bark thickness 349
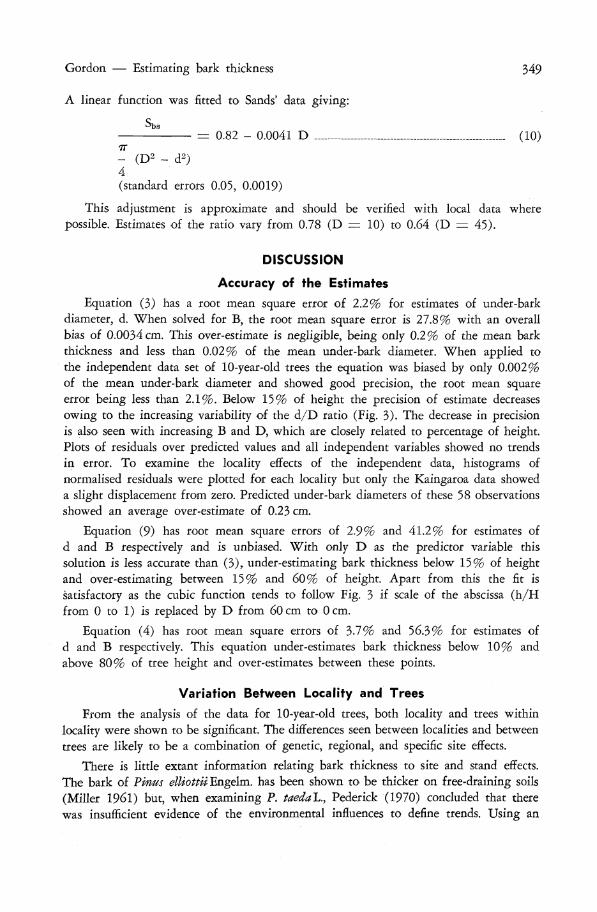
A linear function was fitted to Sands' data giving:
= 0.82 - 0.0041 D (10)
- (D2 - d2) 4 (standard errors 0.05, 0.0019)
This adjustment is approximate and should be verified with local data where possible. Estimates of the ratio vary from 0.78 (D = 10) to 0.64 (D = 45).
DISCUSSION
Accuracy of the Estimates
Equation (3) has a root mean square error of 2.2% for estimates of under-bark diameter, d. When solved for B, the root mean square error is 27.8% with an overall bias of 0.0034 cm. This over-estimate is negligible, being only 0.2% of the mean bark thickness and less than 0.02% of the mean under-bark diameter. When applied to the independent data set of 10-year-old trees the equation was biased by only 0.002% of the mean under-bark diameter and showed good precision, the root mean square error being less than 2 .1%. Below 15% of height the precision of estimate decreases owing to the increasing variability of the d / D ratio (Fig. 3). The decrease in precision is also seen with increasing B and D, which are closely related to percentage of height. Plots of residuals over predicted values and all independent variables showed no trends in error. To examine the locality effects of the independent data, histograms of normalised residuals were plotted for each locality but only the Kaingaroa data showed a slight displacement from zero. Predicted under-bark diameters of these 58 observations showed an average over-estimate of 0.23 cm.
Equation (9) has root mean square errors of 2.9% and 41.2% for estimates of d and B respectively and is unbiased. With only D as the predictor variable this solution is less accurate than (3), under-estimating bark thickness below 15% of height and over-estimating between 15% and 60% of height. Apart from this the fit is satisfactory as the cubic function tends to follow Fig. 3 if scale of the abscissa (h /H from 0 to 1) is replaced by D from 60cm to Ocm.
Equation (4) has root mean square errors of 3.7% and 56.3% for estimates of d and B respectively. This equation under-estimates bark thickness below 10% and above 80% of tree height and over-estimates between these points.
Variation Between Locality and Trees
From the analysis of the data for 10-year-old trees, both locality and trees within locality were shown to be significant. The differences seen between localities and between trees are likely to be a combination of genetic, regional, and specific site effects.
There is little extant information relating bark thickness to site and stand effects. The bark of Pmus elliottiiEngdm. has been shown to be thicker on free-draining soils (Miller 1961) but, when examining P. taedaL., Pederick (1970) concluded that there was insufficient evidence of the environmental influences to define trends. Using an
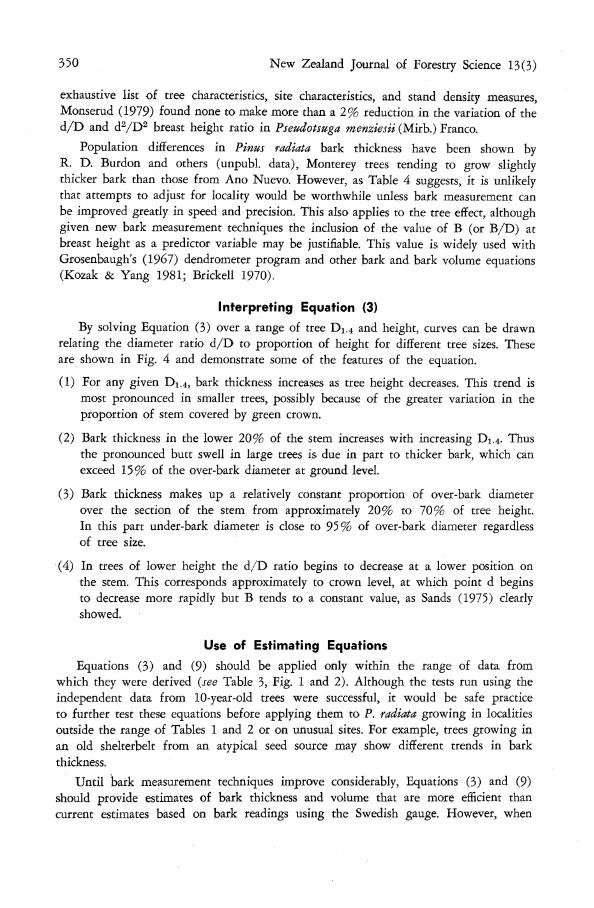
350 New Zealand Journal of Forestry Science 13(3)
exhaustive list of tree characteristics, site characteristics, and stand density measures, Monserud (1979) found none to make more than a 2% reduction in the variation of the d/D and d2/D2 breast height ratio in Pseudotsuga menziesii (Mirb.) Franco.
Population differences in Pinus radiata bark thickness have been shown by R. D. Burdon and others (unpubl. data), Monterey trees tending to grow slightly thicker bark than those from Ano Nuevo. However, as Table 4 suggests, it is unlikely that attempts to adjust for locality would be worthwhile unless bark measurement can be improved greatly in speed and precision. This also applies to the tree effect, although given new bark measurement techniques the inclusion of the value of B (or B/D) at breast height as a predictor variable may be justifiable. This value is widely used with Grosenbaugh's (1967) dendrometer program and other bark and bark volume equations (Kozak & Yang 1981; Brickell 1970).
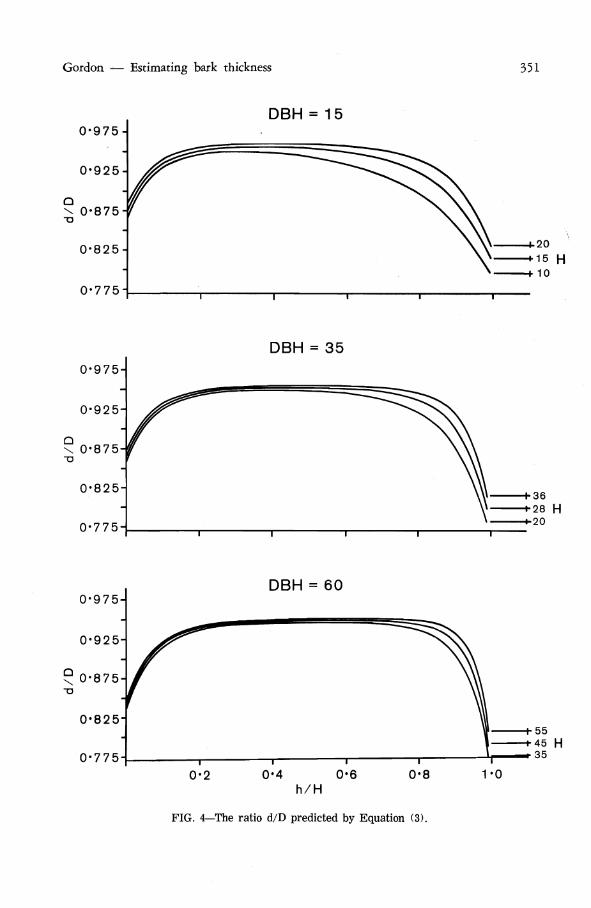
Interpreting Equation (3)
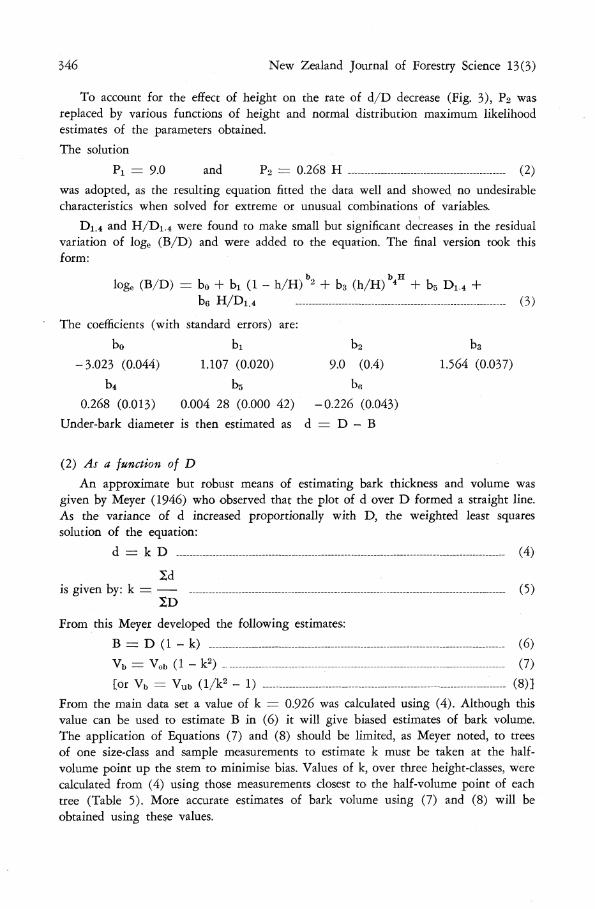
By solving Equation (3) over a range of tree Di.4 and height, curves can be drawn relating the diameter ratio d/D to proportion of height for different tree sizes. These are shown in Fig. 4 and demonstrate some of the features of the equation.
(1) For any given D1.4, bark thickness increases as tree height decreases. This trend is most pronounced in smaller trees, possibly because of the greater variation in the proportion of stem covered by green crown.
(2) Bark thickness in the lower 20% of the stem increases with increasing Di.4. Thus the pronounced butt swell in large trees is due in part to thicker bark, which can exceed 15% of the over-bark diameter at ground level.
(3) Bark thickness makes up a relatively constant proportion of over-bark diameter over the section of the stem from approximately 20% to 70% of tree height. In this part under-bark diameter is close to 95% of over-bark diameter regardless of tree size.
(4) In trees of lower height the d/D ratio begins to decrease at a lower position on the stem. This corresponds approximately to crown level, at which point d begins to decrease more rapidly but B tends to a constant value, as Sands (1975) clearly showed.
Use of Estimating Equations
Equations (3) and (9) should be applied only within the range of data from which they were derived (see Table 3, Fig. 1 and 2). Although the tests run using the independent data from 10-year-old trees were successful, it would be safe practice to further test these equations before applying them to P. radiata growing in localities outside the range of Tables 1 and 2 or on unusual sites. For example, trees growing in an old shelterbelt from an atypical seed source may show different trends in bark thickness.
Until bark measurement techniques improve considerably, Equations (3) and (9) should provide estimates of bark thickness and volume that are more efficient than current estimates based on bark readings using the Swedish gauge. However, when
Gordon — Estimating bark thickness 351
DBH = 15
•.20 *15 H + 10
0-775
DBH = 35
4-36 ••28 H •-20
DBH = 60
FIG. 4—The ratio d/D predicted by Equation (3).
352 New Zealand Journal of Forestry Science 13(3)
bark can be measured quickly and precisely, further study into using sample measurements on each tree or log may show worthwhile improvements can be made.
ACKNOWLEDGMENTS
The assistance of J. Beers, G. Sutton, and staff of the Wood Quality Section at FRI in data collection is gratefully acknowledged. Thanks are due to M. Kimberley who devised an exact method for variance-component calculation.
REFERENCES BRICKELL, J. E. 1970: Test of an equation for predicting bark thickness of western
Montana species. U.S. Forest Service, Intermountain Forest and Range Experiment Station, Research Note I NT-107.
CARRON, L. T.; McINTYRE, G. A. 1959: The taper line (Gray) and sectional methods for merchantable volume of Pinus radiata stems. Australian Forestry 23: 50-60.
ELLIS, J. C. 1982: A three-dimensional formula for coniferous log volumes in New Zealand. N.Z. Forest Service, FRI Bulletin No. 20.
GERALD, C. F. 1978: "Applied Numerical Analysis". 2nd edition. Addison-Wesley Publishing Company.
GOULDING, C. J.; MURRAY, J. C. 1976: Polynomial taper equations that are compatible with tree volume equations. New Zealand Journal of Forestry Science 5: 313-22.
GRAY, H. R. 1956: The form and taper of forest-tree stems. Imperial Forestry Institute (Oxford) Paper No. 32.
GROSENBAUGH, L. R. 1967: STX--FORTRAN-4 program for estimates of tree populations from 3P sample-tree-measurements. U.S. Forest Service, Pacific Southwest Forest and Range Experiment Station, Research Paper PSW-13.
KATZ, A.; DUNNINGHAM, A. G.; GORDON, A.: A compatible volume and taper equation for New Zealand Pinus radiata D. Don grown under the direct sawlog regime. N.Z. Forest Service, FRI Bulletin (in press).
KOZAK, A.; YANG, R. C. 1981: Equations for estimating bark volume and thickness of commercial trees in British Columbia. Forestry Chronicle 57: 112-5.
LARSON, P. R. 1963: Stem form development of forest trees. Forest Science Monograph No. 5.
MACDONALD, J. 1933: The form of the stem in coniferous trees. Forestry 7: 121-9. MESAVAGE, C. 1969: Converting dendrometer estimates of outside-bark stem diameters
to wood diameters of major southern pines. U.S. Forest Service, Southern Forest Experiment Station, Research Note SO-93.
MEYER, A. 1946: Bark volume determination in trees. Journal of Forestry 44: 1067-70. MILLER, S. R. 1961: Variation in bark thickness of slash pine by site, tree size, and
distance up stem. Union Camp Corporation, Savannah, Georgia, Woodland Research Notes No. 10.
MONSERUD, R. A. 1979: Relations between inside and outside bark diameter at breast height for Douglas fir in Northern Idaho and North-western Montana. U.S. Forest Service, Intermountain Forest and Range Experiment Station, Research Note INT-266.
PEDERICK, L. A. 1970: Variation and inheritance of stem form and bark thickness in young loblolly pine. North Carolina State University Technical Report No. 41.
SANDS, R. 1975: Radiata pine bark - aspects of morphology, anatomy and chemistry. New Zealand Journal of Forestry Science 5: 74-86.
von ALTHEN, F. W. 1964: Accuracy of the Swedish bark measuring gauge. Forestry Chronicle 40(2): 257-8.

Gordon — Estimating bark thickness 353
APPENDIX 1
ESTIMATES OF OVER-BARK DIAMETER FROM UNDER-BARK DIAMETER WHEN ONLY THE LATTER IS KNOWN
Equation (9) presented above for predicting under-bark diameter has the form
d = Bo + Bi D + Ba D2 + B3 D3
This can be solved directly for D over the range 1.8 < d < 75.5 as follows:
let Q = 1/3 (Bi/Ba) - 1/9 (B2/B3)2
R = 1/6 ((Bi/Ba) (Ba/Ba) - 3 (Bo - d)/B3) - 1/27 (B2/B3)3
Si = (R + (Q3 + R2)i/2)i/3 Sa = - (( - (R - (Q3 + R2)1/2))1/*)
then D = (Si + S2) - B2/3B3
APPENDIX 2
ESTIMATING BARK VOLUMES OF LOGS USING A 3D FORMULA
This formula (Ellis 1982) for exotic conifer logs in New Zealand gives an estimate of log volume under-bark as:
V = K ds2 L + etl.944 157 loge (L) + 0.029 931 ds
+ 0.884 711 loge ((di - ds)/L) - 6.946430] (11)
where ds = small-end diameter under-bark (cm) di = large-end diameter under-bark (cm) L — log length (m) V = log volume (m3) K = 7.853 982 X IO"5
or using an average taper r= T (cm/m) ' di = ds + T L
Assuming a simple under-bark taper curve described by d2 = b0 + bi/ + b2 P (12)
where / = length from butt (m) bo, bi, ba are constant and coefficients d = under-bark diameter (cm)
then (12) can be solved directly for any log given ds, L, V, and di or T. The resulting taper curve will generate volumes identical to (11) when integrated over the whole log. The constant and coefficient are:
b0 = i 2
bi = 6V/(KL2) - 6 diVL + (2/L) (dx2 - ds
2) b2 = - 6V/(KL3) + 6 4VL2 - (3/L2) i 2 - ds
2)
Bark volumes can then be estimated by applying bark thickness equations to the taper curve derived for each log.