estimating effective landscape distances and … · estimating effective landscape distances and...
TRANSCRIPT
Estimating effective landscape distances and movement corridors:comparison of habitat and genetic data
MARIA C. MATEO-SANCHEZ,1,� NIKO BALKENHOL,2 SAM CUSHMAN,3 TRINIDAD PEREZ,4
ANA DOMINGUEZ,4 AND SANTIAGO SAURA1
1E.T.S.I Montes, Forestal y del Medio Natural, Technical University of Madrid,Ciudad Universitaria s/n 28040, Madrid, Spain
2Department of Wildlife Sciences, University of Goettingen, Buesgenweg 337077, Goettingen, Germany3United States Forest Service, Rocky Mountain Research Station, Southwest Forest Science Complex,
2500 South Pine Knoll Drive, Flagstaff, Arizona 86001 USA4Department of Functional Biology, University of Oviedo, Avda. Julian Claverıa 6, 33006 Oviedo, Spain
Citation: Mateo-Sanchez, M. C., N. Balkenhol, S. Cushman, T. Perez, A. Domınguez, and S. Saura. 2015. Estimating
effective landscape distances and movement corridors: comparison of habitat and genetic data. Ecosphere 6(4):59. http://
dx.doi.org/10.1890/ES14-00387.1
Abstract. Resistance models provide a key foundation for landscape connectivity analyses and are
widely used to delineate wildlife corridors. Currently, there is no general consensus regarding the most
effective empirical methods to parameterize resistance models, but habitat data (species’ presence data and
related habitat suitability models) and genetic data are the most widely used and advocated approaches.
However, the practical consequences of applying one or the other approach have not been well studied. To
address this knowledge gap, we performed a comparative study on the implications of using habitat
suitability versus genetic data for determining effective landscape distances (a proxy inversely related to
isolation among patches) based on least-cost and circuit-theoretic approaches, and for identifying potential
movement corridors. For our comparison, we used data for the Cantabrian brown bear in Spain, an
endangered population for which connectivity has been identified as a major conservation concern. Our
results show that for brown bears, habitat models tend to overestimate resistance to movement through
non-optimal areas, whereas genetic data yield higher estimates of effective distances within habitat areas.
Therefore, our results suggest that (1) dispersal might be generally less constrained by landscape
conditions than habitat utilization in home ranges, and that (2) dispersing animals might be more flexible
in their movement behavior than residents are in their habitat resource utilization behavior, with records
for residents dominating species occurrence data and subsequent habitat models. The assessed approaches
provided dissimilar connectivity models with notable differences in patterns of predicted corridors across
the study area, mainly due to differences in predicted connections between subpopulations. Our results
highlight that the functional differences in habitat vs. genetic data, as well as the assumptions and potential
limitations of different analytical approaches that use these data, need to be considered more carefully in
connectivity modeling and subsequent corridor delineation.
Key words: circuit theory; connectivity; dispersal; habitat suitability; landscape genetics; least-cost paths; resistance.
Received 16 October 2014; revised 2 December 2014; accepted 5 December 2014; final version received 4 February 2015;
published 21 April 2015. Corresponding Editor: D. P. C. Peters.
Copyright: � 2015 Mateo-Sanchez et al. This is an open-access article distributed under the terms of the Creative
Commons Attribution License, which permits unrestricted use, distribution, and reproduction in any medium, provided
the original author and source are credited. http://creativecommons.org/licenses/by/3.0/
� E-mail: [email protected]
v www.esajournals.org 1 April 2015 v Volume 6(4) v Article 59
INTRODUCTION
The establishment and conservation of corri-dors has been widely suggested as a key meansto facilitate movement between wildlife habitatpatches and to preserve and enhance landscapeand population connectivity (Simberloff et al.1992). The classical concept of corridors asnarrow strips of habitat that facilitate movementsof organisms between habitat patches (Rosen-berg et al. 1997) has been recently broadened.Rather than experiencing landscapes as categor-ical mosaics (habitat vs. non habitat), it is morelikely that organisms experience the landscapematrix as a gradient of differential permeability(Cushman et al. 2010). This generalization main-streams the concept of resistance to movementand suggests reconceptualization of connectivityproblems to address how species movement isaffected by landscape features across a range ofspatial scales. Formally, landscape resistancerepresents an integration of multiple behavioraland physiological factors such as aversion,energy expenditure, or mortality risk whenmoving through a particular environment (Zelleret al. 2012). In a practical sense, landscaperesistance is a spatial layer that reflects step-wisecosts of moving through each cell in a raster mapfor least cost path analyses (Singleton et al. 2002)or the relative probability of moving across thecell for circuit theory-based analyses (McRae etal. 2008).
Since modeling landscape resistance is increas-ingly used as the basis to predict populationconnectivity and therefore is a crucial step inidentifying movement corridors, resistance mod-eling has received much attention from corridordesigners (Beier et al. 2008, Spear et al. 2010,Zeller et al. 2012). However, despite the existenceof multiple and varied approaches, there is noconsensus on how to best parameterize resistancesurfaces (Zeller et al. 2012). Parameterizingresistances involves identifying and combiningthe important resistant factors (e.g., land cover,transport infrastructure, etc.) that affect thespecies’ movement in an optimal way to realis-tically estimate the cost of movement throughany location in the landscape. Resistance valueshave usually been determined by assigningresistance scored on an arbitrary scale (Beier etal. 2008, Pereira et al. 2011) on the basis of expert
opinion itself or in combination with literaturereview (Larkin et al. 2004, Kautz et al. 2006).However, such approaches have frequently beenshown to perform poorly (Beier et al. 2008, Shirket al. 2010). To address these limitations, someauthors have suggested that habitat suitabilitymodels predicting species occurrence on the basisof empirical data may provide a better estimationof resistance (Ferreras 2001, Chetkiewicz et al.2006, O’Brien et al. 2006, Beier et al. 2008). Thisapproach essentially implies that animal move-ments are influenced by the same environmentalfactors as habitat selection (e.g., Chetkiewicz etal. 2006, Wasserman et al. 2010, Zeller et al. 2012).More recently, the field of landscape genetics hasshown great potential to provide more rigorousmethods to parameterize resistance models byinferring the influences of landscape on realizedpopulation connectivity (Spear et al. 2005, Cush-man et al. 2006, Storfer et al. 2007, Balkenhol etal. 2009). Individual-based analysis comparingpairwise genetic distances to pairwise effectivedistances under multiple landscape resistancehypothesis are a powerful tool for supportingconservation efforts (Cushman et al. 2006, 2013a,Epps et al. 2007, Segelbacher et al. 2010).
Understanding how different approaches canaffect the analyses that aim to identify conserva-tion corridors is a critical issue given the largeconservation implications and investments thatare potentially derived from such analyses. Inthis paper we addressed this issue by comparingpredicted movement corridors and effectivedistances (derived from least cost analysis andcircuit theory) across alternative resistance sur-face scenarios based on different parameteriza-tion methodologies: habitat modeling andlandscape genetics. We also assessed how twodifferent variable integration approaches (addi-tive and multiplicative) affected the predictionsand implications of landscape genetic models ofresistance.
Our aim was to gain insights into thedifferences and similarities between the resultsobtained using the different approaches, theirpotential limitations, and consequent manage-ment implications. We considered brown bear(Ursus arctos) in the Cantrabrian Range (NWSpain) as the focal species. Brown bear is a long-lived omnivorous mammal with a solitary socialstructure and promiscuous mating system
v www.esajournals.org 2 April 2015 v Volume 6(4) v Article 59
MATEO-SANCHEZ ET AL.
(Nores and Naves 1993, Schwartz et al. 2003).Males and females have intra and inter-sexuallyoverlapping home ranges (Dahle and Swenson2003) and dispersal primarily occurs by males,while females typically are philopatric (Swensonet al. 1998). Brown bear is highly dependent onlarge landscapes with low human-footprint andlarge extents of forest cover (Clevenger et al.1997, Apps et al. 2004, Mateo-Sanchez et al.2014a). The brown bear population in theCantabrian Range suffered a dramatic declinein the last several centuries as a result of humanpersecution and progressive loss and fragmenta-tion of its habitat (Naves et al. 2003). Weconsidered this population highly suited for thisanalysis for the following reasons. (1) In theCantabrian Range, brown bears occur in twosmall, apparently isolated and endangered sub-populations, with about 220 individuals in total(Perez et al. 2014). Connectivity has beenidentified as a major conservation concern forthis species, with potentially large implicationsfor actual planning and conservation measures inthe study area (Ballesteros and Palomero 2012).(2) Brown bears and other large mammals are ofparticular interest for connectivity networksbecause these species operate at broad scalesand occur at low densities, which imply that theirpopulations are more likely to be affected by theloss of connectivity (Beier et al. 2008). (3) Largeamounts of habitat and genetic data are availablefor the species and recent research has focused onlandscape resistance and connectivity for thisspecies (Perez et al. 2009, 2010, Mateo-Sanchez etal. 2014a, b) which provides a unique opportunityfor the comparative analyses needed to effective-ly tackle the aforementioned objectives.
MATERIALS AND METHODS
Study areaThe study was carried out in the Cantabrian
Range (northwestern Spain). This area is within alarger transnational initiative covering protectedareas from the Cantabrian Range to the WesternAlps (SW Europe), in which previous studies onconnectivity and the barrier effect of roads forforest mammals have focused (Gurrutxaga et al.2011, Jongman et al. 2011). The region is 49,472km2 in extent and contains the whole knownrange of the native populations of the brown bear
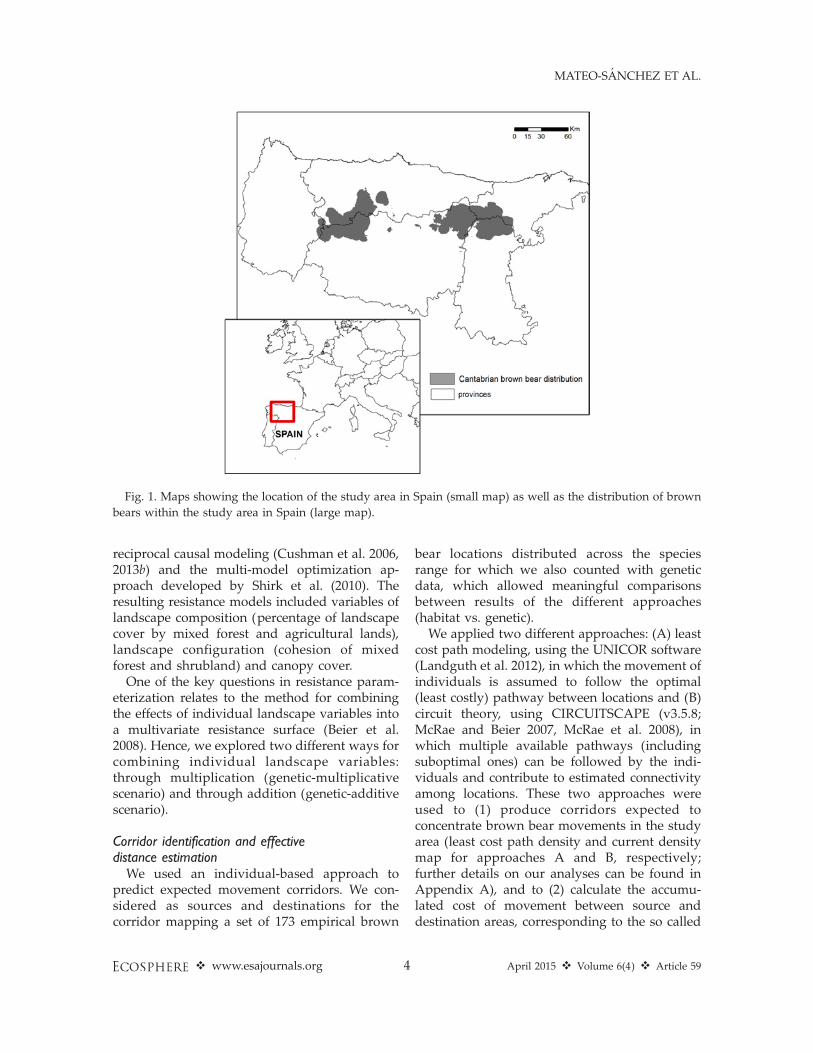
in Spain, its peripheral areas and the belt areabetween the two subpopulations. As shown inFig. 1, both subpopulations occupy a similar areaof about 2,500 km2 each and are separated byabout 50 km of unoccupied range.
Landscape resistance parameterizationLandscape resistance was parameterized un-
der three different scenarios based on differentmethodological approaches (habitat scenario,genetic-multiplicative scenario, and genetic-ad-ditive scenario), as described next. All resistancemaps were produced with a spatial resolution of100 m.
Habitat suitability as a proxy for resistance tomovement.—A plausible way to empirically esti-mate relationships between connectivity andenvironmental conditions is to assume thathabitat quality has a direct (inverse) relationshipwith resistance to movement (e.g., Pullinger andJohnson 2010, Kuemmerle et al. 2011, Mateo-Sanchez et al. 2014b). We used this approach inour first parameterization scenario (habitat sce-nario), in which we created a resistance surfacewhere resistance to movement was obtainedthrough an inverse function of habitat suitability.We used a multiscale suitability habitat modeldeveloped by Mateo-Sanchez et al. (2014a) topredict brown bear occurrence in the study area.After transformation every pixel represented theunit cost of crossing each location, so that thelowest resistance value represented the cost ofmoving through the highest quality habitat.Landscape variables included in the model werelandscape composition (percentage of landscapecovered by forest), forest canopy cover anddensity of buildings (Mateo-Sanchez et al.2014a, b).
Landscape genetics to infer resistance to move-ment.—We used individual-based landscape ge-netics approaches to produce resistance modelsunder two different scenarios (Mateo-Sanchez etal., in press). Specifically, we used genetic samplesof brown bears genotyped at 17 polymorphicmicrosatellite loci to quantify genetic structureand measured the genetic distance amongsamples as the proportion of shared alleles(Bowcock et al. 1994). The relationship betweenthe genetic structure observed within the bearpopulation and likely drivers of landscaperesistance was systematically evaluated through
v www.esajournals.org 3 April 2015 v Volume 6(4) v Article 59
MATEO-SANCHEZ ET AL.
reciprocal causal modeling (Cushman et al. 2006,2013b) and the multi-model optimization ap-proach developed by Shirk et al. (2010). Theresulting resistance models included variables oflandscape composition (percentage of landscapecover by mixed forest and agricultural lands),landscape configuration (cohesion of mixedforest and shrubland) and canopy cover.
One of the key questions in resistance param-eterization relates to the method for combiningthe effects of individual landscape variables intoa multivariate resistance surface (Beier et al.2008). Hence, we explored two different ways forcombining individual landscape variables:through multiplication (genetic-multiplicativescenario) and through addition (genetic-additivescenario).
Corridor identification and effectivedistance estimation
We used an individual-based approach topredict expected movement corridors. We con-sidered as sources and destinations for thecorridor mapping a set of 173 empirical brown
bear locations distributed across the speciesrange for which we also counted with geneticdata, which allowed meaningful comparisonsbetween results of the different approaches(habitat vs. genetic).
We applied two different approaches: (A) leastcost path modeling, using the UNICOR software(Landguth et al. 2012), in which the movement ofindividuals is assumed to follow the optimal(least costly) pathway between locations and (B)circuit theory, using CIRCUITSCAPE (v3.5.8;McRae and Beier 2007, McRae et al. 2008), inwhich multiple available pathways (includingsuboptimal ones) can be followed by the indi-viduals and contribute to estimated connectivityamong locations. These two approaches wereused to (1) produce corridors expected toconcentrate brown bear movements in the studyarea (least cost path density and current densitymap for approaches A and B, respectively;further details on our analyses can be found inAppendix A), and to (2) calculate the accumu-lated cost of movement between source anddestination areas, corresponding to the so called
Fig. 1. Maps showing the location of the study area in Spain (small map) as well as the distribution of brown
bears within the study area in Spain (large map).
v www.esajournals.org 4 April 2015 v Volume 6(4) v Article 59
MATEO-SANCHEZ ET AL.
effective distances in least cost path modelingand to effective resistances (or resistance dis-tance) in circuit-based modeling (hereafter bothreferred to as effective distances). Higher effec-tive distances among locations are assumed to
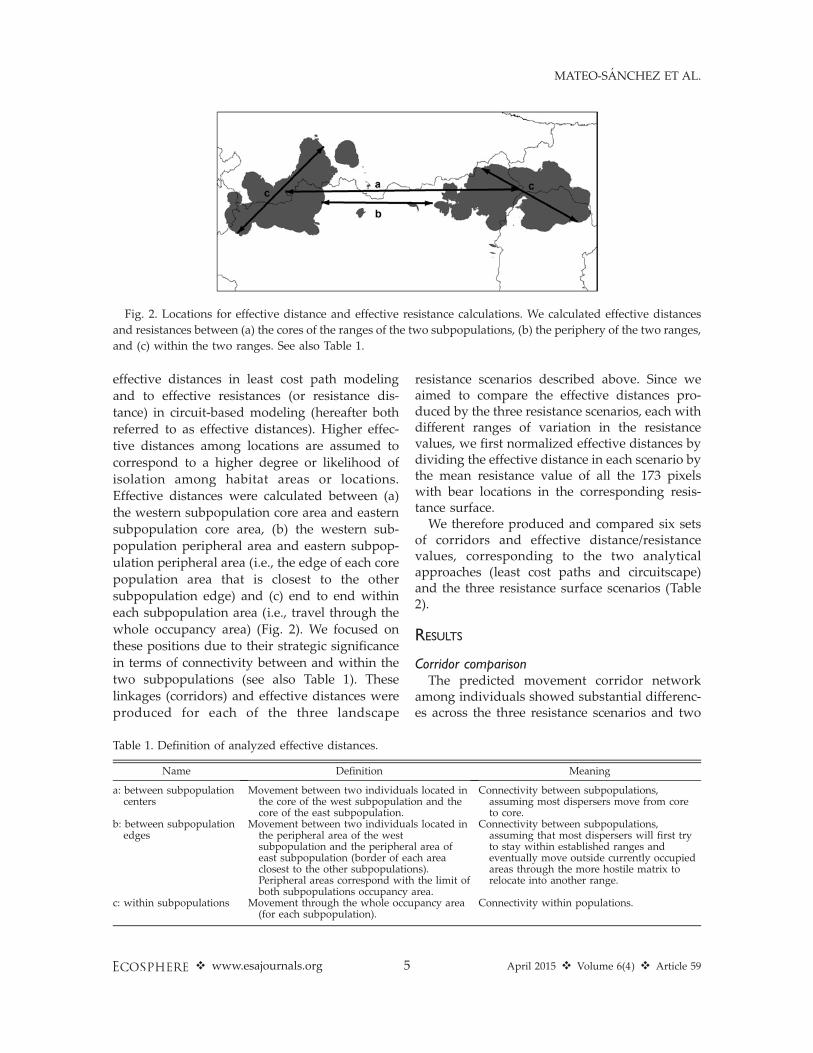
correspond to a higher degree or likelihood ofisolation among habitat areas or locations.Effective distances were calculated between (a)the western subpopulation core area and easternsubpopulation core area, (b) the western sub-population peripheral area and eastern subpop-
ulation peripheral area (i.e., the edge of each corepopulation area that is closest to the othersubpopulation edge) and (c) end to end withineach subpopulation area (i.e., travel through thewhole occupancy area) (Fig. 2). We focused onthese positions due to their strategic significance
in terms of connectivity between and within thetwo subpopulations (see also Table 1). Theselinkages (corridors) and effective distances wereproduced for each of the three landscape
resistance scenarios described above. Since weaimed to compare the effective distances pro-duced by the three resistance scenarios, each withdifferent ranges of variation in the resistancevalues, we first normalized effective distances bydividing the effective distance in each scenario bythe mean resistance value of all the 173 pixelswith bear locations in the corresponding resis-tance surface.
We therefore produced and compared six setsof corridors and effective distance/resistancevalues, corresponding to the two analyticalapproaches (least cost paths and circuitscape)and the three resistance surface scenarios (Table2).
RESULTS
Corridor comparisonThe predicted movement corridor network
among individuals showed substantial differenc-es across the three resistance scenarios and two
Fig. 2. Locations for effective distance and effective resistance calculations. We calculated effective distances
and resistances between (a) the cores of the ranges of the two subpopulations, (b) the periphery of the two ranges,
and (c) within the two ranges. See also Table 1.
Table 1. Definition of analyzed effective distances.
Name Definition Meaning
a: between subpopulationcenters
Movement between two individuals located inthe core of the west subpopulation and thecore of the east subpopulation.
Connectivity between subpopulations,assuming most dispersers move from coreto core.
b: between subpopulationedges
Movement between two individuals located inthe peripheral area of the westsubpopulation and the peripheral area ofeast subpopulation (border of each areaclosest to the other subpopulations).Peripheral areas correspond with the limit ofboth subpopulations occupancy area.
Connectivity between subpopulations,assuming that most dispersers will first tryto stay within established ranges andeventually move outside currently occupiedareas through the more hostile matrix torelocate into another range.
c: within subpopulations Movement through the whole occupancy area(for each subpopulation).
Connectivity within populations.
v www.esajournals.org 5 April 2015 v Volume 6(4) v Article 59
MATEO-SANCHEZ ET AL.
analytical approaches (Figs. 3 and 4). Important-ly, major functional links did not match amongscenarios or methods (least cost path vs circuittheory). In the case of linkages defined throughcumulative density of least cost paths on aresistance map derived from habitat suitability,connections between subpopulations followedtwo main routes that converged in the peripheralarea of the East subpopulation (Fig. 3a). Incontrast, for the resistance scenarios based ongenetic data and least cost path analysis, connec-tions showed more extensive networks consistingin one major route complemented by severalsecondary routes that converge with the princi-pal route when using multiplicative geneticresistance (Fig. 3b). In the additive geneticresistance scenario analyzed with least costpaths, three parallel and interconnected routescoalesce in both subpopulations (Fig. 3c). Whenanalyzing connections designated through circuittheory, potential connections identified throughcurrent maps also differed across the assessedresistance scenarios. A higher concentration ofcurrent in narrower and more clearly definedareas is found in the habitat based resistancescenario (Fig. 4a). When resistance was based ongenetic data, more and wider permeable areaswere detected (Fig. 4b, c), with movements lessconcentrated in thin strips of land. Results alsoshow that within-subpopulation connectivitynetwork pattern was relatively similar for allthe scenarios in both approaches.
Effective distances comparisonThere were strong correlations between effec-
tive distances across the three resistance scenar-ios assessed when all pairs of locations wheresimultaneously considered: Pearson’s correlationcoefficient r . 0.96 in all the cases for effectiveleast cost distances and r . 0.82 in all the cases
for effective resistances based on circuit theory.However, effective distances between strategiclocations showed considerably different valuesamong scenarios (Fig. 5). Effective distancesbetween two individuals located within differentcenters of the two subpopulations were 7–9%lower for genetic scenarios (multiplicative andadditive) than for the habitat scenario. Moreimportantly, when two individuals were locatedin the proximate peripheral areas (edges) of bothsubpopulations, effective distance was muchhigher for the habitat scenario than for geneticscenarios (47% and 79% higher for the genetic-multiplicative and genetic-additive scenarios,respectively). When comparing the multiplicativeand additive genetic scenarios, the normalizedeffective distances were more similar than whencomparing the habitat and genetic scenarios, butthe additive genetic scenario showed the lowesteffective distances between individuals. In con-trast, effective distance between two individualslocated in the same core in both subpopulationswas 40–30% lower when calculated acrossresistance based on habitat suitability than whencomputed for resistance scenarios based ongenetic data. Effective distances within coreswere relatively similar in the two geneticscenarios, but the multiplicative approachshowed higher values.
Effective distances (effective resistances) calcu-lated through circuit theory followed the samegeneral pattern as least-cost effective distanceswhen considering movements between popula-tion edges and movements within populations(Fig. 5b). In these cases, effective resistances inthe genetic-multiplicative and genetic-additivescenarios were again considerably lower than forthe habitat-based resistance scenario (37% and51%, respectively). Oppositely, effective resistanc-es between the centers of both subpopulations
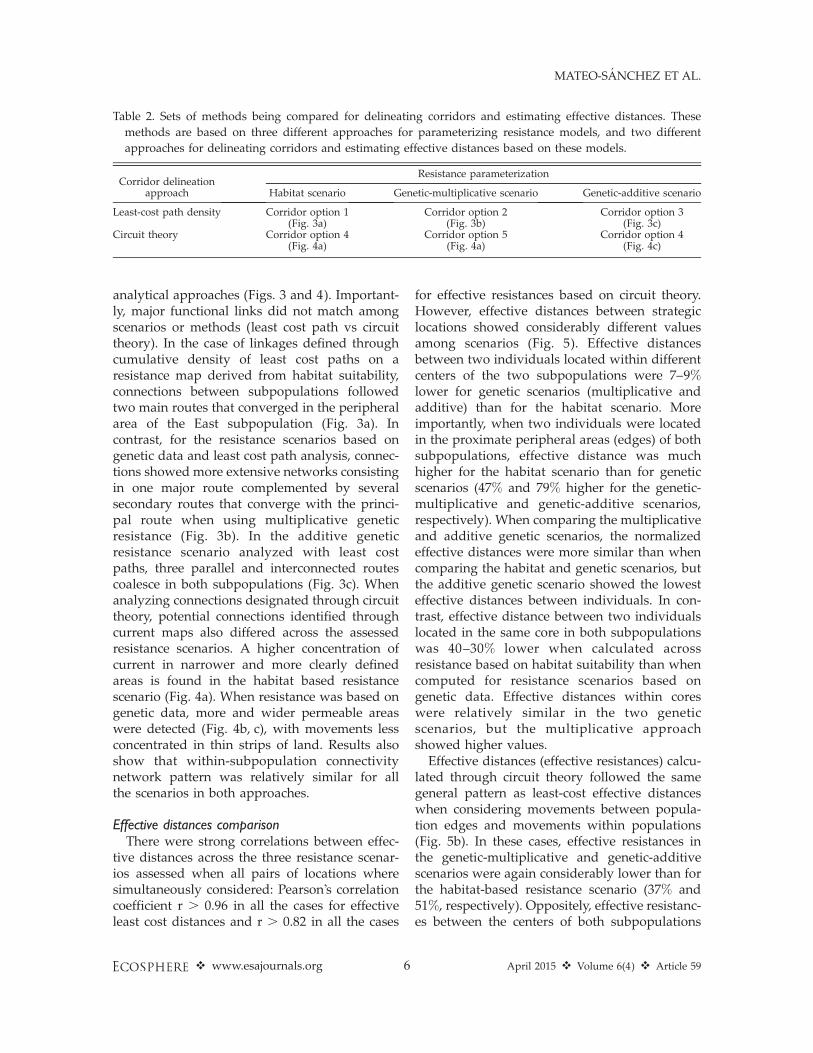
Table 2. Sets of methods being compared for delineating corridors and estimating effective distances. These
methods are based on three different approaches for parameterizing resistance models, and two different
approaches for delineating corridors and estimating effective distances based on these models.
Corridor delineationapproach
Resistance parameterization
Habitat scenario Genetic-multiplicative scenario Genetic-additive scenario
Least-cost path density Corridor option 1 Corridor option 2 Corridor option 3(Fig. 3a) (Fig. 3b) (Fig. 3c)
Circuit theory Corridor option 4 Corridor option 5 Corridor option 4(Fig. 4a) (Fig. 4a) (Fig. 4c)
v www.esajournals.org 6 April 2015 v Volume 6(4) v Article 59
MATEO-SANCHEZ ET AL.
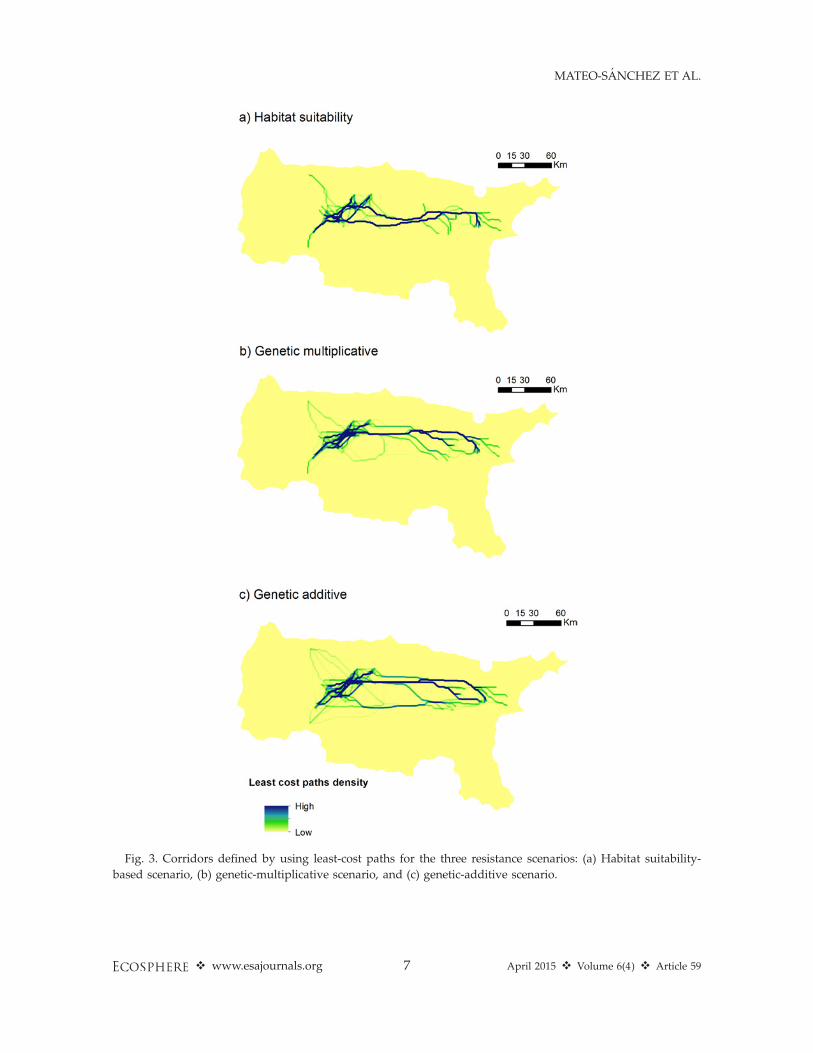
Fig. 3. Corridors defined by using least-cost paths for the three resistance scenarios: (a) Habitat suitability-
based scenario, (b) genetic-multiplicative scenario, and (c) genetic-additive scenario.
v www.esajournals.org 7 April 2015 v Volume 6(4) v Article 59
MATEO-SANCHEZ ET AL.

Fig. 4. Current maps defined by circuit theory for resistance scenarios: (a) Habitat suitability-based scenario, (b)
genetic-multiplicative scenario, and (c) additive genetic-based scenario.
v www.esajournals.org 8 April 2015 v Volume 6(4) v Article 59
MATEO-SANCHEZ ET AL.
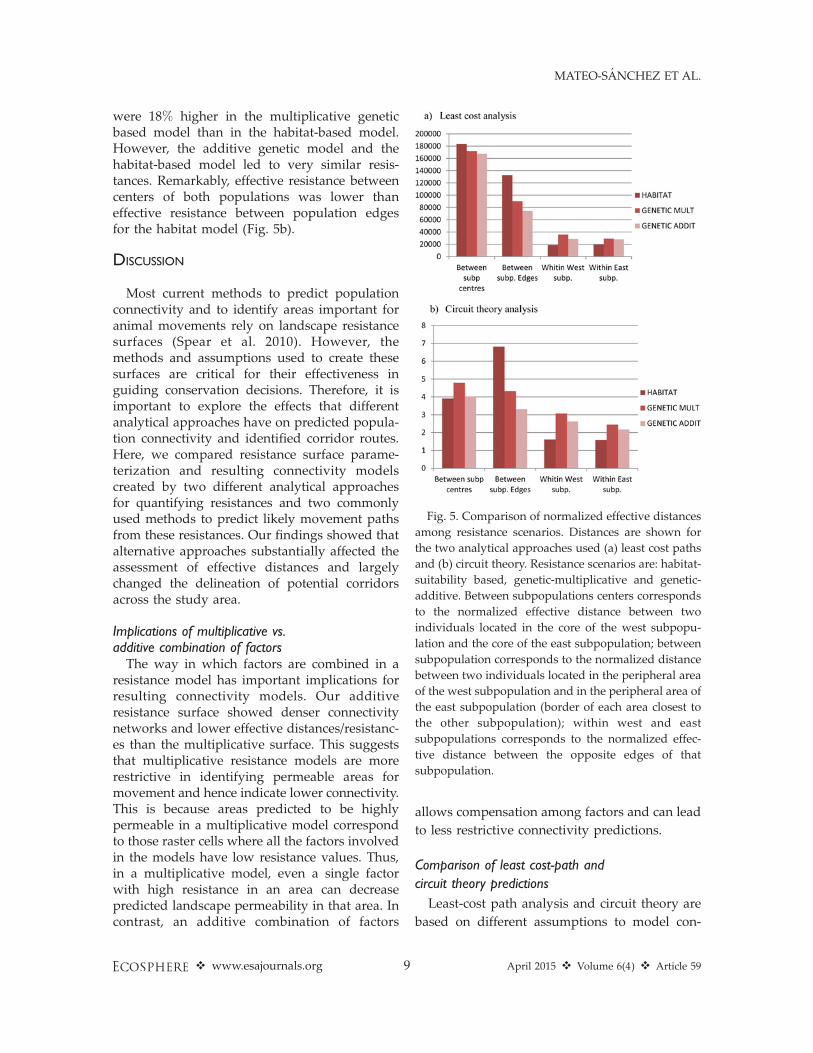
were 18% higher in the multiplicative geneticbased model than in the habitat-based model.However, the additive genetic model and thehabitat-based model led to very similar resis-tances. Remarkably, effective resistance betweencenters of both populations was lower thaneffective resistance between population edgesfor the habitat model (Fig. 5b).
DISCUSSION
Most current methods to predict populationconnectivity and to identify areas important foranimal movements rely on landscape resistancesurfaces (Spear et al. 2010). However, themethods and assumptions used to create thesesurfaces are critical for their effectiveness inguiding conservation decisions. Therefore, it isimportant to explore the effects that differentanalytical approaches have on predicted popula-tion connectivity and identified corridor routes.Here, we compared resistance surface parame-terization and resulting connectivity modelscreated by two different analytical approachesfor quantifying resistances and two commonlyused methods to predict likely movement pathsfrom these resistances. Our findings showed thatalternative approaches substantially affected theassessment of effective distances and largelychanged the delineation of potential corridorsacross the study area.
Implications of multiplicative vs.additive combination of factors
The way in which factors are combined in aresistance model has important implications forresulting connectivity models. Our additiveresistance surface showed denser connectivitynetworks and lower effective distances/resistanc-es than the multiplicative surface. This suggeststhat multiplicative resistance models are morerestrictive in identifying permeable areas formovement and hence indicate lower connectivity.This is because areas predicted to be highlypermeable in a multiplicative model correspondto those raster cells where all the factors involvedin the models have low resistance values. Thus,in a multiplicative model, even a single factorwith high resistance in an area can decreasepredicted landscape permeability in that area. Incontrast, an additive combination of factors
allows compensation among factors and can lead
to less restrictive connectivity predictions.
Comparison of least cost-path and
circuit theory predictions
Least-cost path analysis and circuit theory are
based on different assumptions to model con-
Fig. 5. Comparison of normalized effective distances
among resistance scenarios. Distances are shown for
the two analytical approaches used (a) least cost paths
and (b) circuit theory. Resistance scenarios are: habitat-
suitability based, genetic-multiplicative and genetic-
additive. Between subpopulations centers corresponds
to the normalized effective distance between two
individuals located in the core of the west subpopu-
lation and the core of the east subpopulation; between
subpopulation corresponds to the normalized distance
between two individuals located in the peripheral area
of the west subpopulation and in the peripheral area of
the east subpopulation (border of each area closest to
the other subpopulation); within west and east
subpopulations corresponds to the normalized effec-
tive distance between the opposite edges of that
subpopulation.
v www.esajournals.org 9 April 2015 v Volume 6(4) v Article 59
MATEO-SANCHEZ ET AL.
nectivity (Spear et al. 2010). While least-costanalyses assume animals follow a single andoptimal pathway, circuit theory assumes randomwalks so that movement is influenced by allpossible pathways. Therefore, results from bothmethods provide different and complementaryinsights about brown bear movement. For bothapproaches, effective distances between subpop-ulation centers (the individual has to cross part ofthe habitat area and the matrix in-betweensubpopulation ranges) differed from effectivedistances between subpopulation edges (theindividual only crosses the matrix betweenhabitat areas). However, and surprisingly, wefound that circuit-theoretic effective resistancebetween subpopulation edges was actually high-er than the effective resistance between popula-tion centers in the habitat-based resistancescenario (Fig. 5b). To have a lower effectiveresistance between the centers of the habitatareas than between the less distant edges of thoseareas is rather difficult to interpret ecologically,because bears moving away from the edges firsthave to reach the edges before crossing thematrix to reach the other subpopulation. Thisresult might point out to a potential limitation ofcircuit theory (or of the implementation of it) toassess landscape connectivity. We ensured thatour finding was not an artifact arising from someidiosyncratic and unnoted characteristic of ourparticular brown bear spatial data by creating asimple and purposefully controlled exampledepicting a resistance pattern similar to the oneof the habitat-based scenario (i.e., similar extent,resolution and arrangement). This controlledexample confirmed our results from the real beardata set, i.e., effective resistances were smallerbetween the cores than between the edges(further details can be found in Appendix Aand Appendix B: Fig. B1). This finding advocatesfor further research to fully clarify this issue froman analytical point of view and, if possible, toprovide guidelines for avoiding potentially un-intended results in the application of circuittheory for connectivity analyses.
Habitat models may overestimate resistance tomovement through non-optimal areas
Corridors between subpopulations predictedfrom habitat suitability-based resistance did notmatch the locations or intensity of corridors
identified through genetic-based resistances. Inaddition, effective distances between subpopula-tions were substantially higher when habitatsuitability was used as a surrogate for landscaperesistance. These findings suggest that resistancesurfaces based on habitat models may tend tooverestimate landscape resistance in areas withlow habitat suitability. In our analysis, this effectwas dramatic when effective distance was calcu-lated between peripheral areas of both subpop-ulations and individuals had to cross mostlyunsuitable areas. In contrast, effective distancesbetween individuals located within subpopula-tions were lowest when resistance surfaces werebased on habitat suitability. Thus, congruent withresults from Wasserman et al. (2010), we foundthat habitat suitability can predict a greaterresistance to poor habitat than is suggested bygenetic data. In other words, the fact that thespecies does not occur (permanently) in aparticular habitat does not imply that it cannotmove when needed (e.g., dispersal) through thisarea. In this sense, landscape genetics modelsintegrate the movement of many individualsover time and thus lead to a more synopticmeasure of landscape resistance (Zeller et al.2012, Cushman et al. 2013a). This suggests thatthere is not necessarily a correspondence be-tween habitat use patterns and dispersal move-ments. Conditions providing suitable habitat forpermanent establishment and local resource mayoften be different than the conditions facilitatingdispersal movements (Cushman et al. 2013a,Peterman et al. 2014). Since suitability modelsare based on occurrence data that usuallyrepresent locations within home ranges, habitatsuitability models may not adequately reflecthow environments affect animals during move-ments outside of their usual home ranges, suchas dispersal or mating excursions (Cushman et al.2013a). For our study species, results suggeststhat dispersing bears are more flexible in theirmovement behavior and less constrained bylandscape conditions than suggested from theiroccurrence in typical bear habitats. While ouranalyses have only been conducted for a singlespecies, we believe that the results may be similarfor many other organisms as well, particularlyfor species that are highly mobile and not strictlyconfined to a specific type of habitat.
v www.esajournals.org 10 April 2015 v Volume 6(4) v Article 59
MATEO-SANCHEZ ET AL.

Genetic data estimate higher resistance tomovement through suitable habitat areas
For within-population movements, the genet-ically-derived resistance surfaces predicted largereffective distances among individuals than thehabitat suitability-based resistance surface. Thisis likely due to the fact that resistance modelsderived from landscape genetic analyses arebased on comparison of genetic distances andeffective distances. Such landscape genetic ap-proaches may lead to resistance surfaces thatoverestimate effective distances in areas that arehighly suitable (and eventually well connected toeach other) when factors other than resistance tomovement govern spatial-genetic structure; forinstance, even when two sampled individuals areseparated by a very short distance (or evenlocated in the same raster cell), they will showsome genetic differentiation, which may translatein such genetic resistance models exacerbatingthe effective distance estimates at short ranges toexplain such genetic structure. Spatial-geneticstructure within populations is likely less depen-dent on the resistance of the landscape matrix(Fahrig 2007), but more strongly influenced bymany other biological and ecological factorsacting locally, including sex-specific space-usebehavior, local population density, survival, orreproductive success (Pfluger and Balkenhol2014). Another issue related to genetic data isthat in long-lived species there may be atemporal disconnection between genetic struc-ture and the current landscape; i.e., there may belegacy effects of previous landscapes (James et al.2007, Spear et al. 2010) that could lead tomisestimate current connectivity. However,Landguth et al. (2010) showed that the legacyof past landscape features is not a particularlyimportant problem in species with relativelylarge dispersal abilities. Hence, landscape lega-cies are unlikely to affect our conclusions aboutbrown bear dispersal and gene flow.
The importance of inter-population movementsfor predicting connectivity
Movements outside of typical habitat are lessfrequent than within-habitat movements, butthey are also critical for genetic exchange andrange expansion (Nathan et al. 2003, Chetkiewiczet al. 2006). Previous research has shown that avariable but generally low number of migrants
per generation can lead to a sufficient amount ofgene flow between populations (e.g., Mills andAllendorf 1996, Vucetich and Waite 2000). There-fore, facilitating sufficient levels of inter-popula-tion movements should be a priority inconnectivity strategies. Importantly, it is preciselyin this kind of movements where, according toour results, resistance estimates and connectivitymodels varied most strongly between the ana-lytical approaches we compared. Within the twosubpopulations, effective distances and resistanc-es were always low, and predicted movementpaths were very consistent among the differentanalytical approaches. However, estimated dis-tances and predicted movement paths differedsubstantially among the different approaches forconnectivity between the two subpopulations.Thus, analytical choices for parameterizing andutilizing resistance surfaces will be most impor-tant when trying to predict inter-populationmovements, when individuals move out ofestablished ranges and cross the unsuitablelandscape matrix. Importantly, this is also thekind of analysis most relevant for corridordesign, as the goal is usually the (re-) connectionof different subpopulations located across alandscape or the support of species range shiftsin response to climate change, rather than thefacilitation of within-population movements.
Conclusions for connectivity analysis basedon habitat suitability
Based on our study, it seems reasonable toquestion the assumption that habitat suitabilitymodels can accurately capture landscape resis-tance to movement for corridor design. Locationdata used to produce habitat suitability modelstend to be dominated by habitat use (i.e., shelter,foraging) and thus by frequent routine move-ments within established home ranges. However,genetic structure may be strongly determined bymating movements and rare dispersal events.These types of movements are unlikely to bewell-captured by occurrence data and may betherefore poorly represented in resistance modelsderived from such data. Thus, as alreadysuggested by Beier et al. (2008) and Zeller et al.(2012), genetic-based studies are likely to be moreuseful to understand connectivity of populations.However, if genetic data are not available orwhen recent landscape changes are not yet
v www.esajournals.org 11 April 2015 v Volume 6(4) v Article 59
MATEO-SANCHEZ ET AL.

reflected in genetic data, parameterization basedon habitat models, direct movement data (e.g.,telemetry) or even expert opinion may be stillrequired (Spear et al. 2010). Indeed, resistancesurfaces should ideally be assessed thoughanalyses of multiple data sources. For example,a resistance surface that is supported by inde-pendent analysis of movement and genetic data(e.g., Cushman and Lewis 2010) is much morelikely to be robust than one developed from asingle empirical data set. For example, recentresearch in telemetry data analysis providesmethods that help to distinguish habitat usefrom dispersal locations (e.g., Dickson et al. 2005,Squires et al. 2013, Zeller et al. 2014). Comparedto occurrence-based habitat models, these novelapproaches could provide resistance models thatmore reliably reflect actual species movementacross complex landscapes.
Implications for conservationConnectivity models should accurately predict
inter-population movement and gene flow, andenable researchers to reliably identify the mostlikely movement routes among subpopulations.As shown in this study, connectivity models andthe corridors suggested by them depend stronglyon the analytical methods used for creating andutilizing underlying resistance surfaces. Severalpublished studies have suggested ways forfinding optimal resistance values (e.g., Kuroe etal. 2011, Shirk et al. 2010, Graves et al. 2014), andthese studies have certainly improved resistance-based connectivity modeling. However, theeffects of different conceptual approaches under-lying resistance models (habitat suitability vs.resistance to inter-population movement) or theanalytical choices made during their creation andanalysis (additive vs. multiplicative models,least-cost vs. circuit-theory) appear to be at leastas important as the numerical optimization ofresistance values. Indeed, our results suggest thatthese other aspects substantially impact theoutcome of resistance-based connectivity predic-tions, which could be a challenge for applyingresistance-based connectivity models in practicalconservation. If different approaches predictvastly dissimilar areas to be important forconservation efforts (e.g., optimal locations forcorridors or road-crossing structures), it will berather difficult to objectively choose and justify a
single ‘best’ management action.For now, we advocate the use of genetically-
derived resistance surfaces over the use ofoccurrence data, but agree with Zeller et al.(2012) that more comparative research is neededto fill current knowledge gaps related to land-scape resistance and connectivity modeling.Indeed, we argue that research identifying theadvantages and limitations of various conceptualand analytical approaches, such as those herereported, is urgently needed for assessing howmeaningful and useful different resistance-basedconnectivity models actually are for practicalconservation planning. We hope that our studyhas highlighted some of these future researchneeds and that it will motivate others to furtherinvestigate this important topic.
ACKNOWLEDGMENTS
Funding was provided by the Spanish Ministry ofScience and Innovation through research grant GE-FOUR (AGL2012-31099), Technical University of Ma-drid and DAAD. We are also grateful to the RegionalAdministrations involved in the brown bear manage-ment: Junta de Castilla y Leon, Gobierno de Cantabria,Principado de Asturias and Xunta de Galicia forproviding data. Thanks also to the valuable supportprovided by Fundacion Oso Pardo.
LITERATURE CITED
Apps, C. D., B. N. McLellan, J. G. Woods, and M. F.Proctor. 2004. Estimating grizzly bear distributionand abundance relative to habitat and humaninfluence. Journal of Wildlife Management68:138–152.
Balkenhol, N., F. Gugerli, S. A. Cushman, L. P. Waits,A. Coulon, J. Arntzen, R. Holderegger, and H. H.Wagner. 2009. Identifying future research needs inlandscape genetics: where to from here? LandscapeEcology 24:455–463.
Ballesteros, F., and G. Palomero. 2012. Conectividad,demografıa y conservacion del oso pardo cantab-rico. Pages 19–31 in A. San Miguel, F. Ballesteros,J. C. Blanco, and G. Palomero, editors. Manual debuenas practicas para la gestion de corredoresoseros en la Cordillera Cantabrica. Fundacion OsoPardo. Ministerio de Agricultura, Alimentacion yMedio Ambiente, Madrid, Spain.
Beier, P., D. R. Majka, and W. D. Spencer. 2008. Forks inthe road: choices in procedures for designingwildland linkages. Conservation Biology 22:836–851.
Bowcock, A., A. Ruiz-Linares, J. Tomfohrde, E. Minch,
v www.esajournals.org 12 April 2015 v Volume 6(4) v Article 59
MATEO-SANCHEZ ET AL.

J. Kidd, and L. L. Cavalli-Sforza. 1994. Highresolution of human evolutionary trees withpolymorphic microsatellites. Nature 368:455–457.
Chetkiewicz, C.-L. B., C. C. St. Clair, and M. S. Boyce.2006. Corridors for conservation: integrating pat-tern and process. Annual Review of Ecology,Evolution and Systematics 37:317–342.
Clevenger, A. P., F. J. Purroy, and M. A. Campos. 1997.Habitat assessment of a relict brown bear (Ursusarctos) population in northern Spain. BiologicalConservation 80:17–22.
Cushman, S. A., M. Chase, and C. Griffin. 2010.Mapping landscape resistance to identify corridorsand barriers for elephant movement in southernAfrica. Pages 349–367 in S. A. Cushman and F.Huettmann, editors. Spatial complexity, informat-ics, and wildlife conservation. Springer, New York,New York, USA.
Cushman, S. A., and J. S. Lewis. 2010. Movementbehavior explains genetic differentiation in Amer-ican black bears. Landscape Ecology 25:1613–1625.
Cushman, S. A., K. S. McKelvey, J. Hayden, and M. K.Schwartz. 2006. Gene flow in complex landscapes:testing multiple hypotheses with causal modeling.American Naturalist 168:486–499.
Cushman, S. A., B. McRae, F. Adriansen, P. Beier, M.Shirley, and K. Zeller. 2013a. Biological corridorsand connectivity. Pages 284–404 in D. McDonald,editor. Conservation in theory and practice. Wiley,New York, New York, USA.
Cushman, S. A., T. N. Wasserman, E. L. Landguth, andA. J. Shirk. 2013b. Re-evaluating causal modelingwith Mantel tests in landscape genetics. Diversity5(1):51–72.
Dickson, B. G., J. S. Jenness, and P. Beier. 2005.Influence of vegetation, topography, and roads oncougar movement in southern California. Journalof Wildlife Management 69:264–276.
Dahle, B., and J. E. Swenson. 2003. Home ranges inadult Scandinavian brown bears (Ursus arctos):effect of mass, sex, reproductive category, popula-tion density and habitat type. Journal of Zoology260:329–335.
Epps, C. W., J. D. Wehausen, V. C. Bleich, S. G. Torres,and J. S. Brashares. 2007. Optimizing dispersal andcorridor models using landscape genetics. Journalof Applied Ecology 44:714–724.
Fahrig, L. 2007. Non-optimal animal movement inhuman-altered landscapes. Functional Ecology21:1003–1015.
Ferreras, P. 2001. Landscape structure and asymmet-rical inter-patch connectivity in a metapopulationof the endangered Iberian lynx. Biological Conser-vation 100:125–136.
Graves, T., R. B. Chandler, J. A. Royle, P. Beier, andK. C. Kendall. 2014. Estimating landscape resis-tance to dispersal. Landscape Ecology. doi: 10.1007/
s10980-014-0056-5Gurrutxaga, M., L. Rubio, and S. Saura. 2011. Key
connectors in protected forest area networks andthe impact of highways: A transnational case studyfrom the Cantabrian Range to the Western Alps(SW Europe). Landscape and Urban Planning101:310–320.
James, P. M. A., M. J. Forteen, A. Fall, D. Kneeshaw,and C. Messier. 2007. The effects of spatial legaciesfollowing shifting management practices and fireon boreal forest age structure. Ecosystems 10:1261–1277.
Jongman, R. H., I. M. Bouwma, A. Griffioen, L. Jones-Walters, and A. M. Van Doorn. 2011. The panEuropean ecological network: PEEN. Landscapeecology 26:311–326.
Kautz, R., R. Kawula, T. Hoctor, J. Comiskey, D.Jansen, D. Jennings, J. Kasbohm, F. Mazzotti, R.McBride, and L. Richardson. 2006. How much isenough? Landscape-scale conservation for theFlorida panther. Biological Conservation 130:118–133.
Kuemmerle, T., K. Perzanowski, H. Resit Akcakaya, F.Beaudry, T. R. Van Deelen, I. Parnikoza, P.Khoyetskyy, D. M. Waller, and V. C. Radeloff.2011. Cost-effectiveness of strategies to establish aEuropean bison metapopulation in the Carpathi-ans. Journal of Applied Ecology 48:317–329.
Kuroe, M., N. Yamaguchi, T. Kadoya, and T. Miyashita.2011. Matrix heterogeneity affects population sizeof the harvest mice: Bayesian estimation of matrixresistance and model validation. Oikos 120: 271–279.
Landguth, E., S. Cushman, M. Schwartz, K. McKelvey,M. Murphy, and G. Luikart. 2010. Quantifying thelag time to detect barriers in landscape genetics.Molecular Ecology 19:4179–4191.
Landguth, E., B. Hand, J. Glassy, S. Cushman, and M.Sawaya. 2012. UNICOR: a species connectivity andcorridor network simulator. Ecography 35:9–14.
Larkin, J. L., D. S. Maehr, T. S. Hoctor, M. A. Orlando,and K. Whitney. 2004. Landscape linkages andconservation planning for the black bear in west-central Florida. Animal Conservation 7:23–34.
Mateo-Sanchez, M. C., N. Balkenhol, S. Cushman, T.Perez, A. Domınguez, and S. Saura. In press. Acomparative framework to infer landscape effectson population genetic structure: Are habitat suit-ability models effective in explaining gene flow?Landscape Ecology. doi: 10.1007/s10980-015-0194-4
Mateo-Sanchez, M. C., S. A. Cushman, and S. Saura.2014a. Scale dependence in habitat selection: thecase of the endangered brown bear (Ursus arctos) inthe Cantabrian Range (NW Spain). InternationalJournal of Geographical Information Science28:1531–1546.
Mateo-Sanchez, M., S. Cushman, and S. Saura. 2014b.
v www.esajournals.org 13 April 2015 v Volume 6(4) v Article 59
MATEO-SANCHEZ ET AL.
Connecting endangered brown bear subpopula-tions in the Cantabrian Range (north-westernSpain). Animal Conservation 17:430–440.
McRae, B. H., and P. Beier. 2007. Circuit theory predictsgene flow in plant and animal populations.Proceedings of the National Academy of Sciences104:19885–19890.
McRae, B. H., B. G. Dickson, T. H. Keitt, and V. B. Shah.2008. Using circuit theory to model connectivity inecology, evolution, and conservation. Ecology89:2712–2724.
Mills, L. S., and F. W. Allendorf. 1996. The one-migrant-per-generation rule in conservation andmanagement. Conservation Biology 10:1509–1518.
Nathan, R., G. Perry, J. T. Cronin, A. E. Strand, andM. L. Cain. 2003. Methods for estimating long-distance dispersal. Oikos 103:261–273.
Naves, J., T. Wiegand, E. Revilla, and M. Delibes. 2003.Endangered species constrained by natural andhuman factors: The case of brown bears inNorthern Spain. Conservation Biology 17:1276–1289.
Nores, C., and J. Naves. 1993. Distribucion historica deloso pardo en la Penınsula Iberica. Pages 13–33 in J.Naves and G. Palomero, editors. El oso pardo enEspana (Ursus arctos). ICONA, Madrid, Spain.
O’Brien, D., M. Manseau, A. Fall, and M.-J. Fortin.2006. Testing the importance of spatial configura-tion of winter habitat for woodland caribou: anapplication of graph theory. Biological Conserva-tion 130:70–83.
Pereira, M., P. Segurado, and N. Neves. 2011. Usingspatial network structure in landscape manage-ment and planning: a case study with pond turtles.Landscape and Urban Planning 100:67–76.
Perez, T., J. Naves, F. Vazquez, A. Fernandez-Gil, J.Albornoz, E. Revilla, M. Delibes, and A. Domı-nguez. 2014. Estimating the population size of theendangered brown bear through genetic sampling.Wildlife Biology. doi: 10.2981/wlb.00069
Perez, T., F. Vazquez, J. Naves, A. Fernandez, A.Corao, J. Albornoz, and A. Domınguez. 2009. Non-invasive genetic study of the endangered Canta-brian brown bear (Ursus arctos). Conservationgenetics 10:291–301.
Perez, T., J. Naves, J. F. Vazquez, J. Seijas, A. Corao, J.Albornoz, and A. Domınguez. 2010. Evidence forimproved connectivity between Cantabrian brownbear subpopulations. Ursus 21:104–108.
Peterman, W. E., G. M. Connette, R. D. Semlitsch, andL. S. Eggert. 2014. Ecological resistance surfacespredict fine-scale genetic differentiation in a terres-trial woodland salamander. Molecular Ecology23: 2402–2413.
Pfluger, F. J., and N. Balkenhol. 2014. A plea forsimultaneously considering matrix quality andlocal environmental conditions when analysing
landscape impacts on effective dispersal. MolecularEcology 23: 2146–2156.
Pullinger, M. G., and C. J. Johnson. 2010. Maintainingor restoring connectivity of modified landscapes:evaluating the leastcost path model with multiplesources of ecological information. Landscape Ecol-ogy 25:1547–1560.
Rosenberg, D. K., B. R. Noon, and E. C. Meslow. 1997.Biological corridors: form, function, and efficacy.BioScience 47:677–687.
Schwartz, C. C., S. D. Miller, and M. A. Haroldson.2003. Grizzly bear. Pages 556–586 in G. A. Feld-hammer, B. C. Thompson, and J. A. Chapman,editors. Wild mammals of North America: biology,management and conservation. The John HopkinsUniversity Press, Baltimore, Maryland, USA.
Segelbacher, G., S. A. Cushman, B. K. Epperson, M.-J.Fortin, O. Francois, O. J. Hardy, R. Holderegger, P.Taberlet, L. P. Waits, and S. Manel. 2010. Applica-tions of landscape genetics in conservation biology:concepts and challenges. Conservation Genetics11:375–385.
Shirk, A., D. Wallin, S. Cushman, C. Rice, and K.Warheit. 2010. Inferring landscape effects on geneflow: a new model selection framework. MolecularEcology 19:3603–3619.
Simberloff, D., J. A. Farr, J. Cox, and D. W. Mehlman.1992. Movement corridors: conservation bargainsor poor investments? Conservation Biology 6:493–504.
Singleton, P. H., W. L. Gaines, and J. F. Lehmkuhl.2002. Landscape permeability for large carnivoresin Washington: a geographic information systemweighted-distance and least-cost corridor assess-ment. USDA, Forest Service, Pacific NorthwestResearch Station, Portland, Oregon, USA.
Spear, S. F., N. Balkenhol, M.-J. Fortin, B. H. McRae,and K. Scribner. 2010. Use of resistance surfaces forlandscape genetic studies: considerations for pa-rameterization and analysis. Molecular Ecology19:3576–3591.
Spear, S. F., C. R. Peterson, M. D. Matocq, and A.Storfer. 2005. Landscape genetics of the blotchedtiger salamander (Ambystoma tigrinum melanostic-tum). Molecular Ecology 14:2553–2564.
Squires, J. R., N. J. DeCesare, L. E. Olson, J. A. Kolbe,M. Hebblewhite, and S. A. Parks. 2013. Combiningresource selection and movement behavior topredict corridors for Canada lynx at their southernrange periphery. Biological Conservation 157:187–195.
Storfer, A., M. Murphy, J. Evans, C. Goldberg, S.Robinson, S. Spear, R. Dezzani, E. Delmelle, L.Vierling, and L. Waits. 2007. Putting the ‘landscape’in landscape genetics. Heredity 98:128–142.
Swenson, J. E., F. Sandegren, and A. Derberg. 1998.Geographic expansion of an increasing brown bear
v www.esajournals.org 14 April 2015 v Volume 6(4) v Article 59
MATEO-SANCHEZ ET AL.
population: evidence for presaturation dispersal.Journal of Animal Ecology 67:819–826.
Vucetich, J. A., and T. A. Waite. 2000. Is one migrantper generation sufficient for the genetic manage-ment of fluctuating populations? Animal Conser-vation 3:261–266.
Wasserman, T. N., S. A. Cushman, M. K. Schwartz, andD. O. Wallin. 2010. Spatial scaling and multi-modelinference in landscape genetics: Martes americana innorthern Idaho. Landscape ecology 25:1601–1612.
Zeller, K. A., K. McGarigal, P. Beier, S. A. Cushman,
T. W. Vickers, and W. M. Boyce. 2014. Sensitivity of
landscape resistance estimates based on point
selection functions to scale and behavioral state:
pumas as a case study. Landscape Ecology 29:541–
557.
Zeller, K. A., K. McGarigal, and A. R. Whiteley. 2012.
Estimating landscape resistance to movement: a
review. Landscape Ecology 27:777–797.
SUPPLEMENTAL MATERIAL
APPENDIX A
DETAILS ON CORRIDOR IDENTIFICATION
ANALYSES
Least cost path density modelingUNICOR (UNIversal CORridor and network
simulation model, Landguth et al. 2010) iden-tifies the shortest path between every specifiedspecies location on a landscape to every otherspecified species location. The combination ofall the movement paths produces a least costpath density map that represents the pattern ofthe most probable movement paths for brownbear in the study area (e.g., Cushman et al.2013a; Mateo-Sanchez et al. 2014b). To identifyputative corridors, we computed the focaldensity of the factorial least cost path networkwith a moving window of 1-km radius with aGIS (Mateo-Sanchez et al. 2014b). UNICOR alsocalculated effective (least cost) distance be-
tween all combinations of sources and destina-tions.
Circuit theory modelingCircuitscape (McRae et al. 2008) uses circuit
theory to model landscapes as conductancesurfaces and predict important connectionsamong locations. Based on the assumption of arandom walk, all plausible paths between eachtwo locations are integrated creating a currentmap. Analogously to the factorial least cost pathdensity map described above, the combination ofevery pairwise current map allows the identifycorridors with higher current flow.
This software also computes pairwise effectiveresistance between all combinations of locations(here brown bear occurrences). In this study weused a four-neighbor case for the calculations.
APPENDIX B
DETAILS ON THE EXAMPLE OF CIRCUITSCAPE
ESTIMATES OF EFFECTIVE RESISTANCES
The simulated example consists of two habitatareas with low resistance to movement that areseparated by a high resistance matrix. Wecomputed circuit-based effective resistances be-tween two points located in the center of bothhabitat areas and two points located on theirclosest edges (Fig. B1). Results showed that
centre to centre effective resistance was lower
than edge to edge (see Fig. B1), confirming our
findings from the brown bear data set. This
suggests that there might be a previously
unreported issue related to some conceptual
aspects of circuit theory or its application to
model landscape connectivity, or issues related to
details of the implementation of the calculations
in Circuitscape.
v www.esajournals.org 15 April 2015 v Volume 6(4) v Article 59
MATEO-SANCHEZ ET AL.
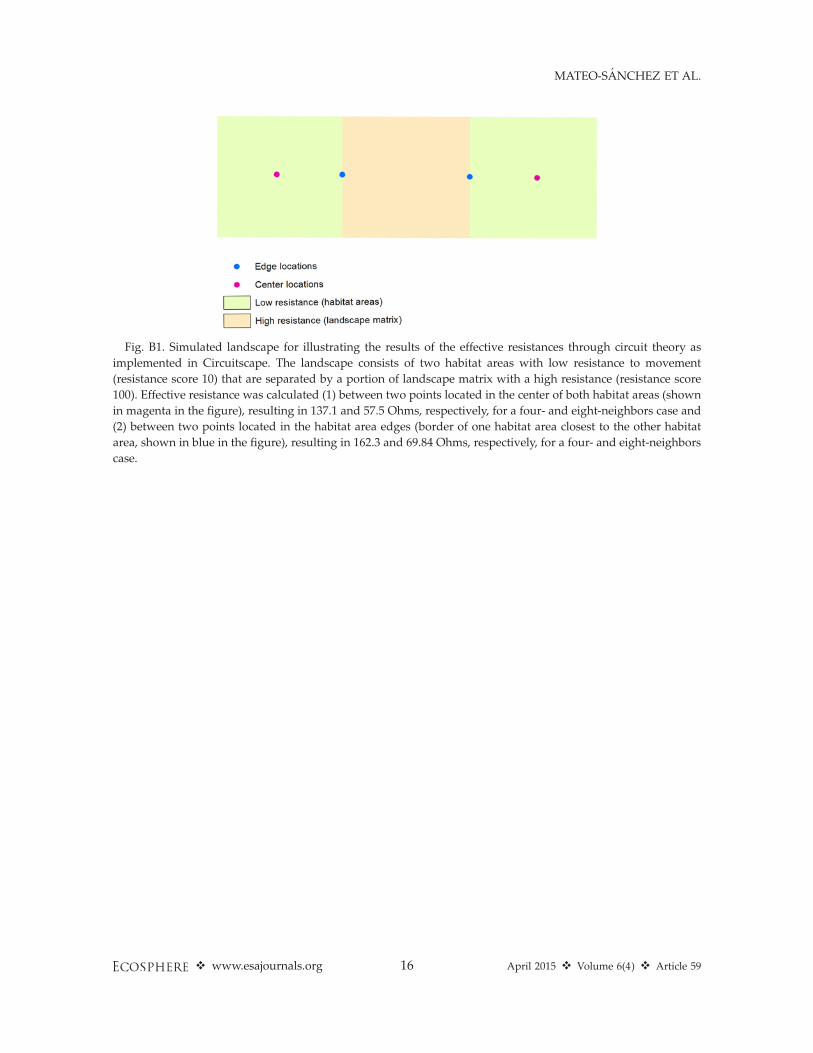
Fig. B1. Simulated landscape for illustrating the results of the effective resistances through circuit theory as
implemented in Circuitscape. The landscape consists of two habitat areas with low resistance to movement
(resistance score 10) that are separated by a portion of landscape matrix with a high resistance (resistance score
100). Effective resistance was calculated (1) between two points located in the center of both habitat areas (shown
in magenta in the figure), resulting in 137.1 and 57.5 Ohms, respectively, for a four- and eight-neighbors case and
(2) between two points located in the habitat area edges (border of one habitat area closest to the other habitat
area, shown in blue in the figure), resulting in 162.3 and 69.84 Ohms, respectively, for a four- and eight-neighbors
case.
v www.esajournals.org 16 April 2015 v Volume 6(4) v Article 59
MATEO-SANCHEZ ET AL.