estimating habitat quality and survival benefits: … · purpose the habitat workgroup was charged...
TRANSCRIPT

ESTIMATING HABITAT QUALITY AND SURVIVAL BENEFITS:
REMAND HABITAT WORKGROUP APPROACH
Purpose
The Habitat Workgroup was charged with estimating survival benefits associated with proposed tributary habitat restoration actions.
The task was to be completed within a very short
time-frame (three months) with readily available information.
To the extent possible, the approach needed to
improve upon the Appendix E Approach used in the 2004 BiOp.

Potential Tools
Life-Cycle Models (e.g., EDT, HQI, PHABSIM, RIPPLE, Shiraz, Greene and Beechie model, McHugh et al. model, etc.).
Professional Judgment (Delphi) Approach
(similar to the Appendix E approach).
Limitations
Very short time period to complete the work for salmon and steelhead populations throughout the Columbia Basin.
Must use existing information that is readily
available.
Cannot accurately estimate the effects of tributary habitat actions on survival at all life stages.
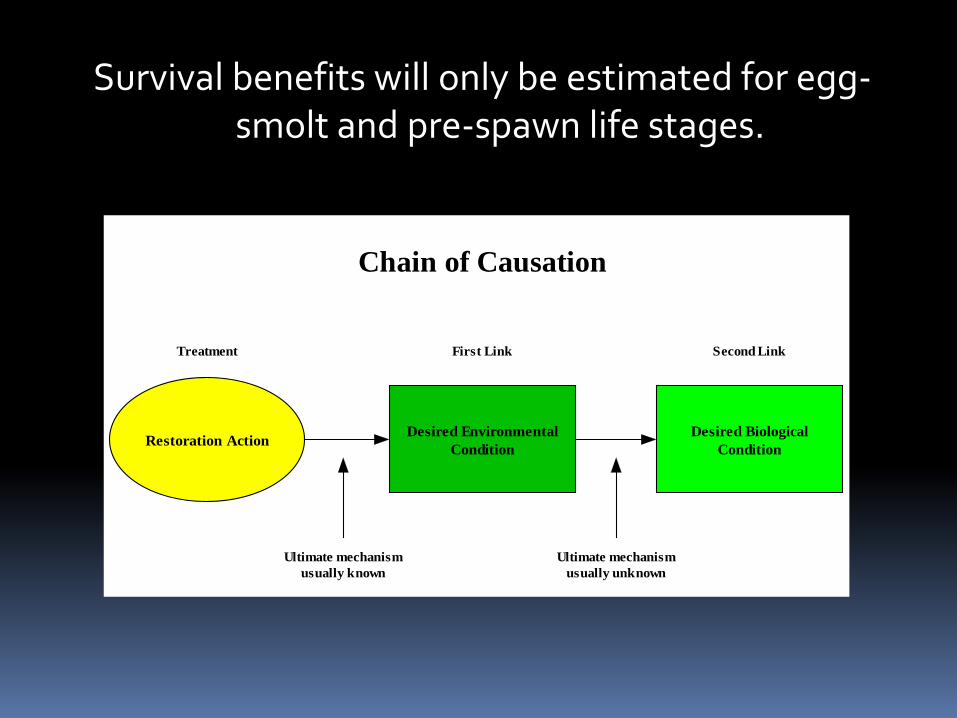
Survival benefits will only be estimated for egg-smolt and pre-spawn life stages.
Chain of Causation
Restoration Action Desired EnvironmentalCondition
Desired BiologicalCondition
Treatment First Link Second Link
Ultimate mechanismusually known
Ultimate mechanismusually unknown
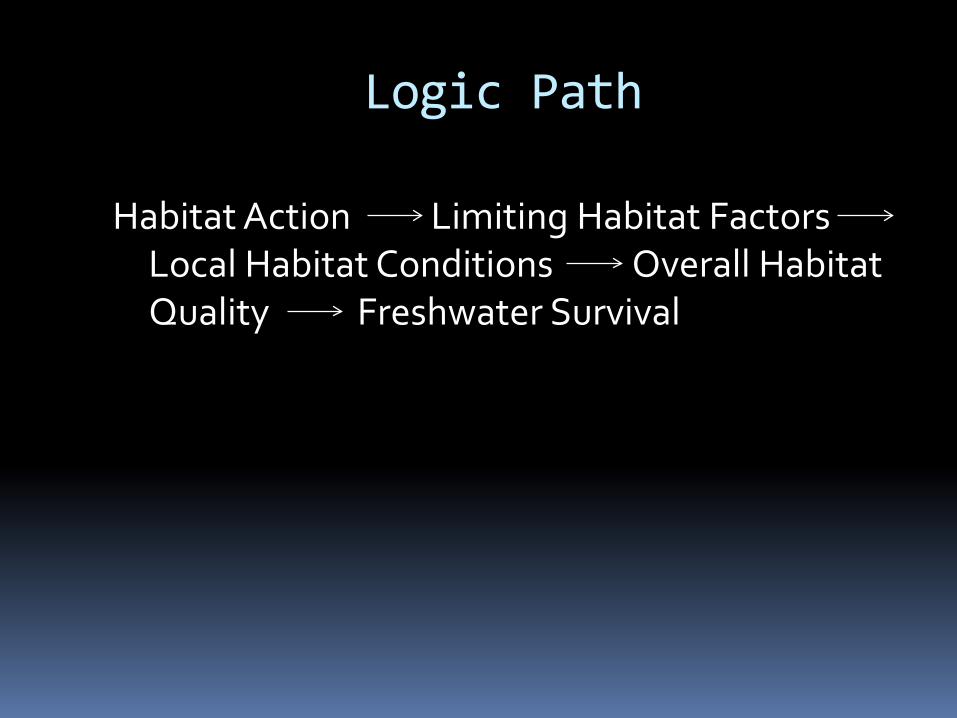
Logic Path
Habitat Action Limiting Habitat Factors Local Habitat Conditions Overall Habitat Quality Freshwater Survival
Assumptions
Limiting habitat factors are known for each population.
Habitat actions directly affect habitat variables that limit the population.
Habitat variables can be combined to describe local habitat conditions.
Local habitat conditions can be combined to describe overall habitat quality for the entire population.
Changes in overall habitat quality are directly linked to changes in freshwater survival.
Process Requires Local Biologist Input
• Identify limiting habitat factors for each assessment unit or population.
• Estimate the “current” status or condition of each limiting habitat factor.
• Identify habitat actions that would address the limiting habitat factors.
• Estimate the “potential” status or condition of limiting habitat factors if the habitat action is implemented.
Requires Remand Habitat Workgroup Input
• Combine limiting habitat factor scores into a single local habitat condition score.
• Combine local habitat condition scores into a single overall habitat quality score for the population.
• Translate habitat quality change into survival change.
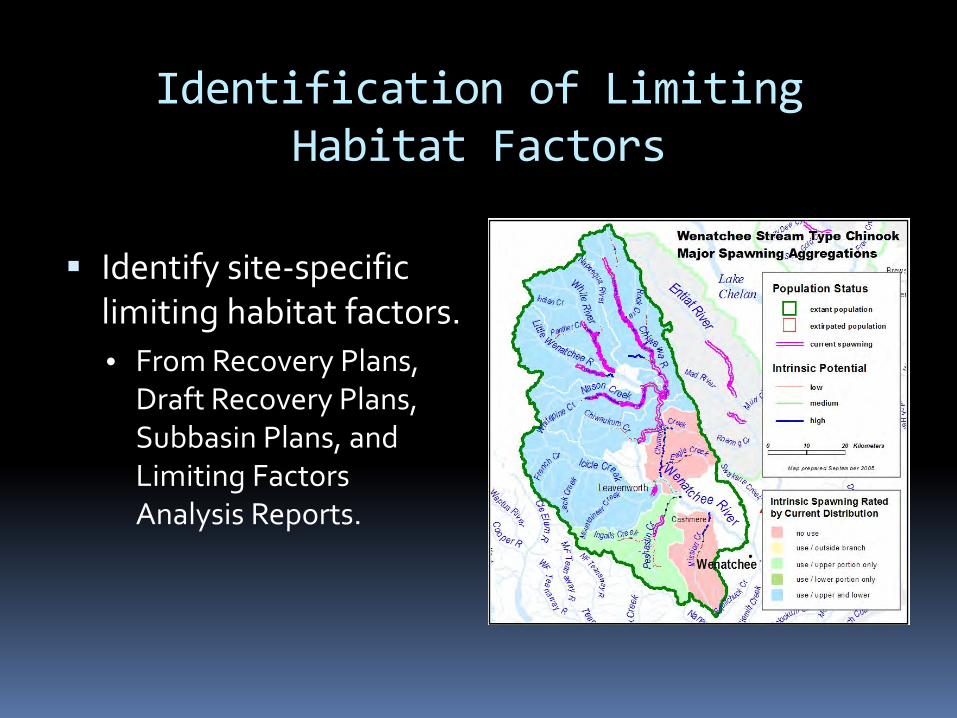
Identification of Limiting Habitat Factors
Identify site-specific
limiting habitat factors. • From Recovery Plans,
Draft Recovery Plans, Subbasin Plans, and Limiting Factors Analysis Reports.
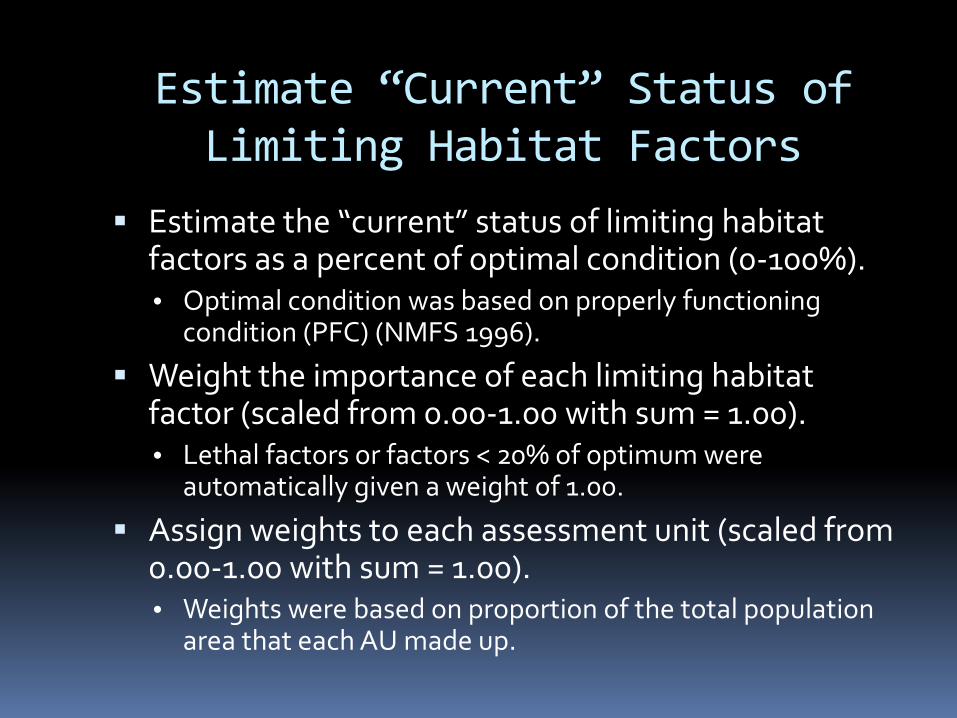
Estimate “Current” Status of Limiting Habitat Factors
Estimate the “current” status of limiting habitat factors as a percent of optimal condition (0-100%). • Optimal condition was based on properly functioning
condition (PFC) (NMFS 1996).
Weight the importance of each limiting habitat factor (scaled from 0.00-1.00 with sum = 1.00). • Lethal factors or factors < 20% of optimum were
automatically given a weight of 1.00.
Assign weights to each assessment unit (scaled from 0.00-1.00 with sum = 1.00). • Weights were based on proportion of the total population
area that each AU made up.
Identify Tributary Habitat Actions
Identify specific habitat actions that will address the limiting habitat factor.
The habitat action must directly or indirectly address the limiting factor and/or threat.
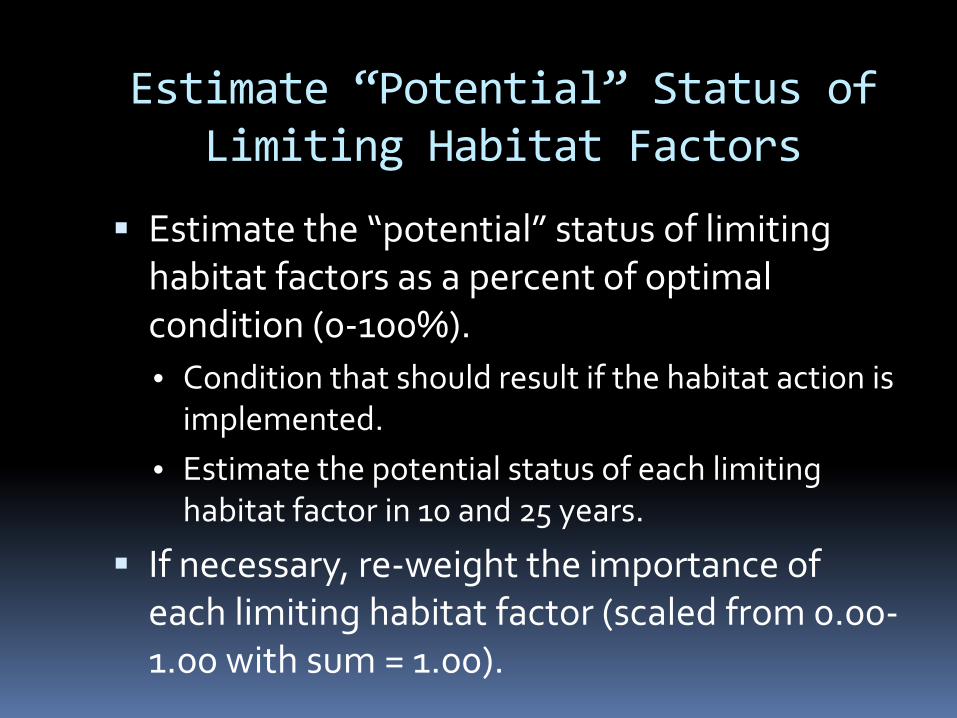
Estimate “Potential” Status of Limiting Habitat Factors
Estimate the “potential” status of limiting habitat factors as a percent of optimal condition (0-100%). • Condition that should result if the habitat action is
implemented. • Estimate the potential status of each limiting
habitat factor in 10 and 25 years.
If necessary, re-weight the importance of each limiting habitat factor (scaled from 0.00-1.00 with sum = 1.00).
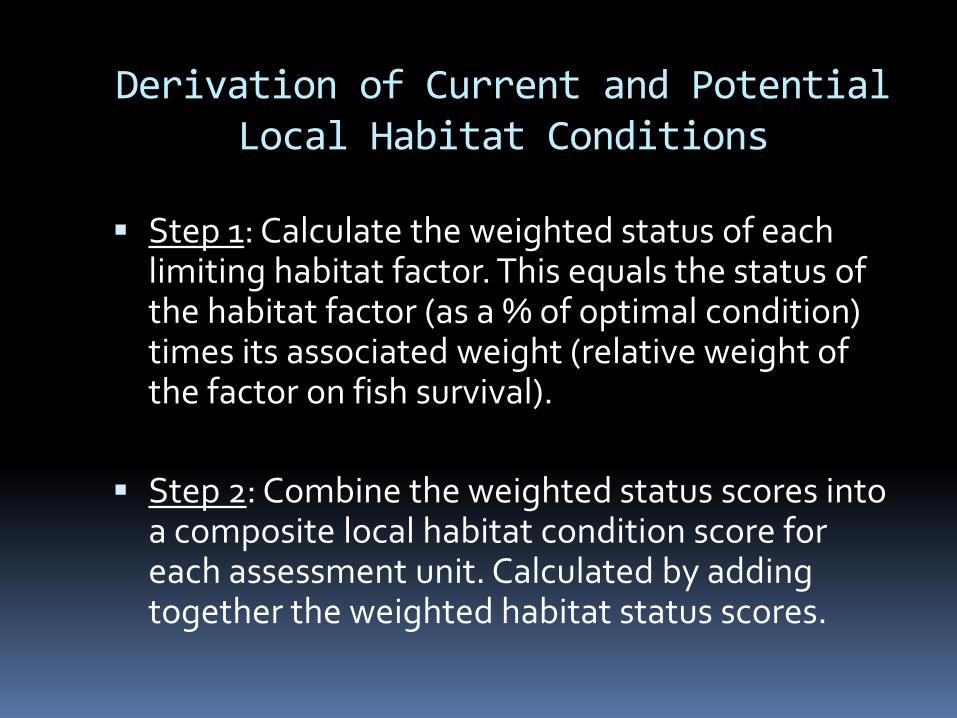
Derivation of Current and Potential Local Habitat Conditions
Step 1: Calculate the weighted status of each limiting habitat factor. This equals the status of the habitat factor (as a % of optimal condition) times its associated weight (relative weight of the factor on fish survival).
Step 2: Combine the weighted status scores into
a composite local habitat condition score for each assessment unit. Calculated by adding together the weighted habitat status scores.
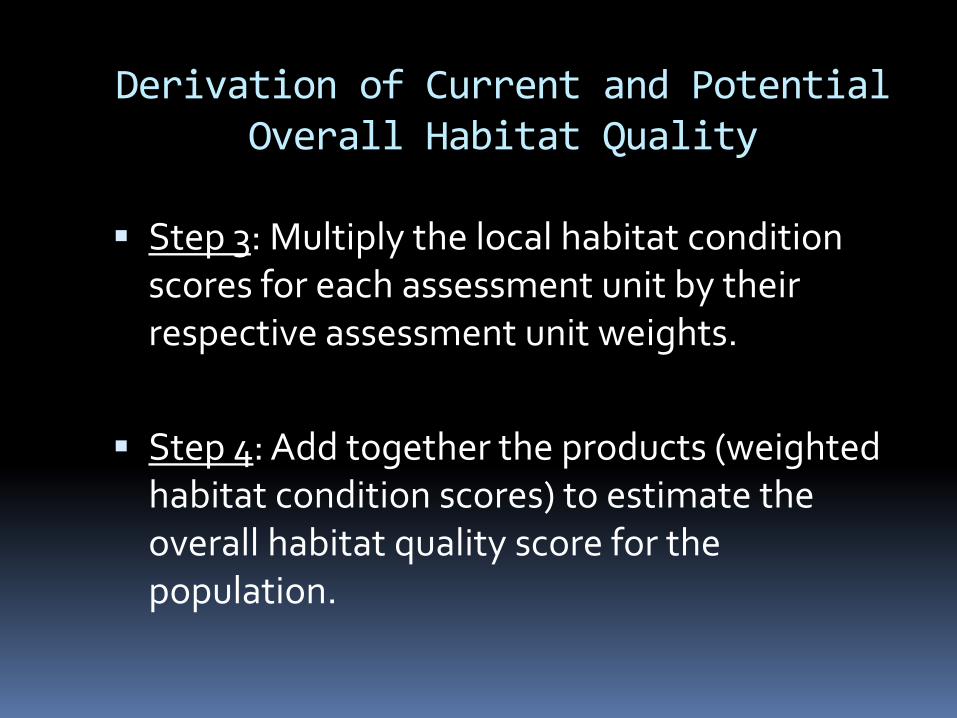
Derivation of Current and Potential Overall Habitat Quality
Step 3: Multiply the local habitat condition scores for each assessment unit by their respective assessment unit weights.
Step 4: Add together the products (weighted
habitat condition scores) to estimate the overall habitat quality score for the population.

Derivation of Survival Benefits

Derivation of Survival Benefits
There are published relationships between habitat variables and survival.
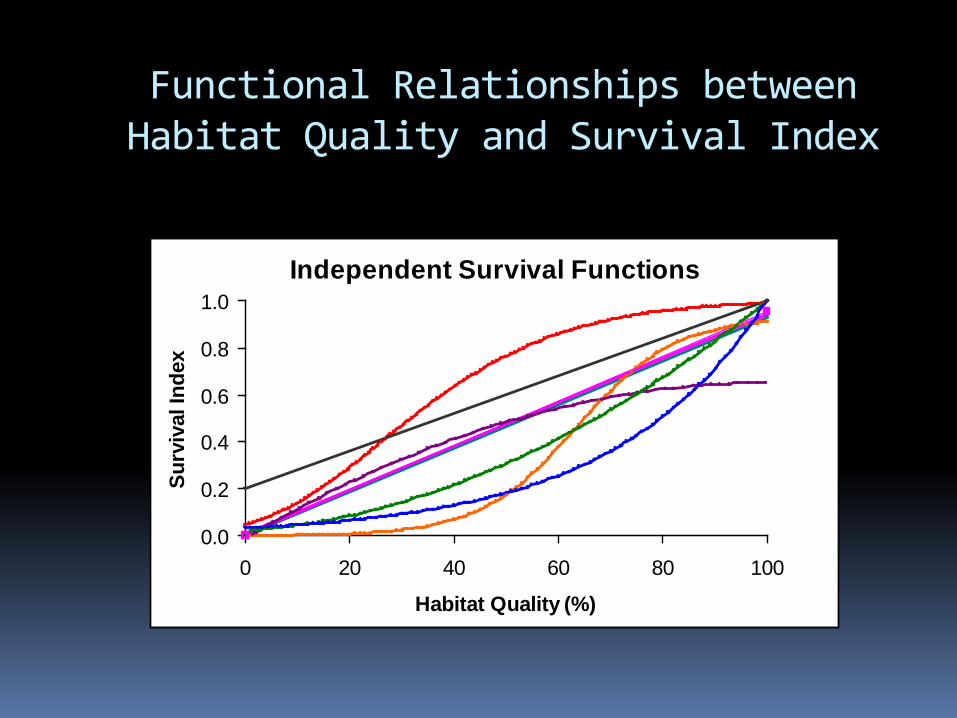
Functional Relationships between Habitat Quality and Survival Index
Independent Survival Functions
0.0
0.2
0.4
0.6
0.8
1.0
0 20 40 60 80 100
Habitat Quality (%)
Surv
ival
Inde
x
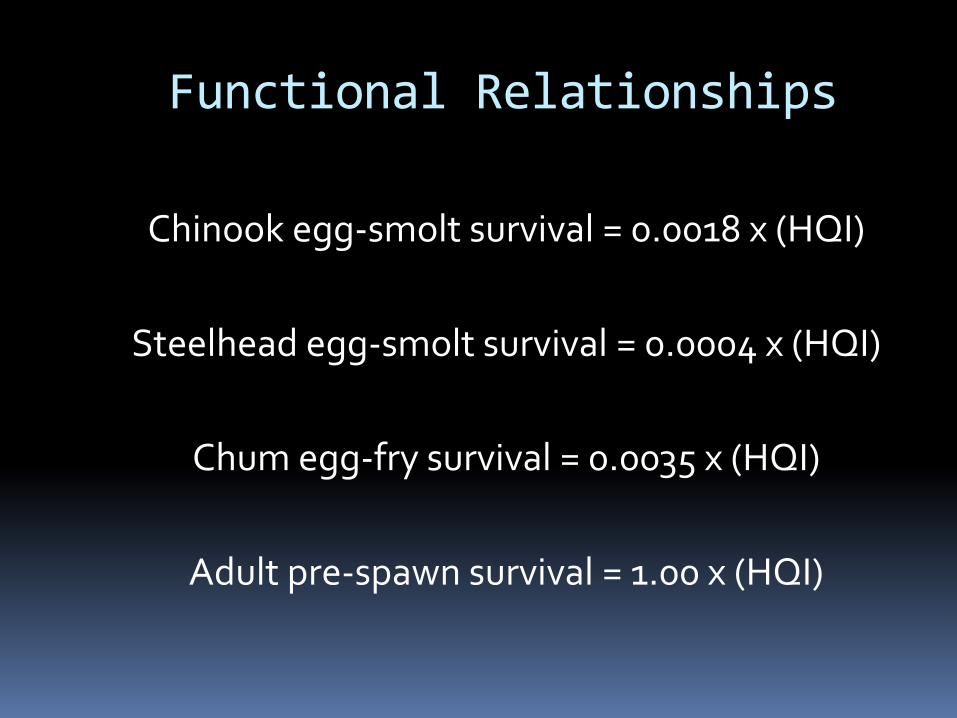
Functional Relationships
Chinook egg-smolt survival = 0.0018 x (HQI)
Steelhead egg-smolt survival = 0.0004 x (HQI)
Chum egg-fry survival = 0.0035 x (HQI)
Adult pre-spawn survival = 1.00 x (HQI)
Assumptions
Egg-smolt survival is the lowest when habitat quality is the lowest and survival is the highest when habitat quality is the highest.
Egg-smolt survival is directly proportional to habitat quality.
Mortality is density independent. Hatcheries have no effect on survival of
naturally produced fish.
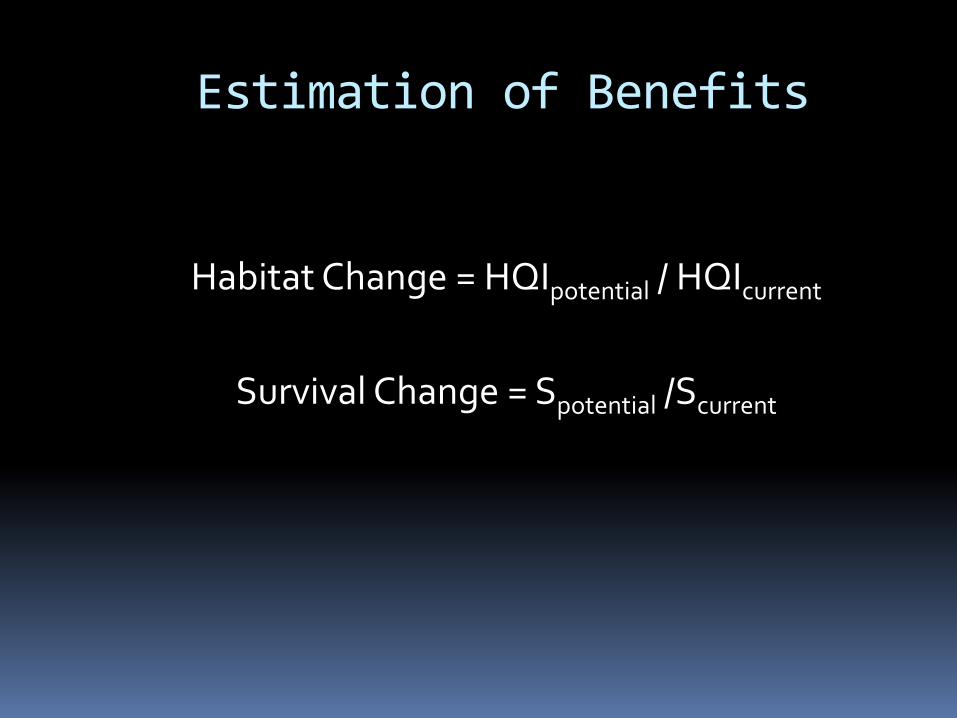
Estimation of Benefits
Habitat Change = HQIpotential / HQIcurrent
Survival Change = Spotential /Scurrent