estimating larval fish ingestion rates: can laboratory ... · pdf fileestimating larval fish...
TRANSCRIPT

Vol. 67: 209-225. 1990 MARINE ECOLOGY PROGRESS SERIES Mar. Ecol. Prog. Ser.
Published November 1
Estimating larval fish ingestion rates: can laboratory derived values be reliably
extrapolated to the wild?'
B. R. MacKenzie, W. C. Leggett, R. H. Peters
Department of Biology, McGill University, 1205 Ave. Dr. Penfield, Montreal, Quebec, Canada H3A 1B1
ABSTRACT: We used literature data to compare the relative influences of body size, water temperature, food density and experimental method on laboratory derived estimates of the ingestion rates of marine fish larvae. We subsequently used these results to evaluate whether larval feeding rates in nature are likely to be food-limited. Larval dry weight, temperature and food density explained 85 % of the variance in the laboratory derived ingestion rates of 11 species. After removing the effects of larval size and water temperature on ingestion rates, larval functional response was steepest at food densities < - 185 pg 1 - l ; beyond this level, ingestion rates were independent of food density. A conlparison of the laboratory functional response with natural microzooplankton densities shows that (1) larvae are unlikely to feed at maximal rates in the sea; (2) larval feeding rates are most sensitive to changes in food abundance across the range of food densities that are most likely to occur in nature (median = 31 pg 1-'; 90th percentile = 148 pg I-'; N = 46). However, in situ ingestion rate estimates for 8 species of marine fish larvae indicate that these larvae fed at rates independent of food density and near-maximally, despite relatively low food densities. We conclude that this difference between in situ and laboratory estimates of ingestion rates as a function of prey density results primarily from the failure of most integrated census estimates of prey density to adequately represent the real contact rate of larvae with their prey and the failure of most laboratory experimental designs to incorporate relevant variables known to influence prey encounter rates and selection. Integrated measures of in situ prey abundance and most experimental designs fail to account for small-scale temporal and spatial patchiness in the dstributions of larvae and their prey, for various aspects of larval behaviour, and for water-column turbulence.
INTRODUCTION
Laboratory ingestion rate s tudies involving indi- vidual species of larval fish h a v e established that larvae display a sharp functional response a t low food densities a n d tha t ingestion rates become satiated a t much higher densities (Theilacker & Dorsey 1980, Klumpp & von Westernhagen 1986; also Holling 1959, Ivlev 1961). These laboratory-derived functional responses a r e often used to evaluate the extent to which naturally occurring food levels may influence larval s u n i v a l a n d year-class s t rength in marine fish populations (e.g. H o u d e 1978, Wroblewski & Richmann 1987, Anderson 1988).
However, extrapolation from laboratory estimates of food ingestion ra tes in this way could bias interpreta-
Contribution to the program of GIROQ (Groupe interuniver- sitaire de recherches oceanographiques du Quebec)
tions of larval feeding ecology (Anderson 1988, J e n k i n s 1988) because they assume that laboratory derived functional responses a r e similar in form a n d magni tude to t h e functional responses of larvae i n nature. This assumption m a y not b e valid because experimental conditions themselves c a n influence laboratory inges- tion a n d growth rates of larval fish ( H o u d e 1977, Theilacker & Dorsey 1980, Hunte r 1981) a n d other zooplankton (Peters & Downing 1984, Delafontaine & Leggett 1987). T h e relative importance of these experi- mentally induced biases i n laboratory ingestion rates h a s not yet b e e n quantified relative to t h e influences of larval size, water t empera ture a n d food density.
Moreover, n o quant i ta t ive comparison of i n situ lar- val feeding rates i n response to local food densities h a s b e e n a t tempted for wild larval populations. H e n c e t h e validity of t h e assumption t h a t laboratory a n d natural functional responses a r e similar remains i n doubt , a s d o e s t h e utility of the application of experimentally
O Inter-Research/Printed in Germany

210 Mar. Ecol. Prog. Ser. 67. 209-225. 1990
derived ingestion rates to wild populations (Rothschild & Osborn 1988).
In this study we sought to identify the variables that influence the magnitude and form of ingestion rate responses to varying prey densities both in the labora- tory and in the wild. We also used empirical models developed in the course of this analysis to evaluate whether ingestion rates of wild marine fish larvae are likely to be food-hmited.
METHODS
Laboratory ingestion rates. Data collection and con- ventions: The data used in developing empirically based ingestion rate models were extracted from the literature relating to marine and estuarine species of fish larvae. We sought data on ingestion rate ( I ; expres- sed as pg dry weight of food ingested individual-' d-l) , larval dry weight (W; pg individual-'), prey dry weight (PW; pg individual-') and prey density (Food; numbers 1-' or pg 1-l). We expressed body size and food densities in units of mass because these are known to represent energy flow better than units of length or numeric concentrations respectively (Houde 1978, Theilacker & Dorsey 1980).
Sixty percent of all larvae contained in our data set were preserved in formalin before dry weight determi- nations were performed. Losses in dry weight are known to occur in larval fishes as a consequence of preservation but the magnitude of this loss has not been thoroughly evaluated (Delafontaine & Leggett
1989, Giguere et al. 1989). Available estimates of pre- servation-induced dry weight loss range from 9 to 30 % (Theilacker & Dorsey 1980, Bailey 1982, Hay 1984). If reported dry weights had not been corrected for this preservation effect, we assumed a 20 % dry weight loss, which is the midpoint of the published ranges (Theilacker & Dorsey 1980, Bailey 1982, Hay 1984), before adjusting dry weight values accordingly.
In 7 of the 11 laboratory-based studies incorporated into our data set, prey dry weights were not reported. In these cases, we estimated prey dry weights from weight equivalents reported in the literature (Table 1). This allowed us to convert all numerical densities of prey components to equivalent dry weights in one of 3 ways: (1) in cases where the proportions of different prey items in the diet were reported (N = 3; Houde & Schekter 1981, Theilacker 1987, Chesney 1989), we calculated the total dry weight of all food offered in each experimental treatment as follows:
n
Food = (Pi . PWi D) i = l
(1)
where Food = food density (kg I- ' ) ; P, = numerical proportion (range 0.0 to 1.0) of component i in the total prey population; PWi = dry weight equivalent of 1 prey item of component i; D = total prey population density (number I - ' ) , and n = number of prey components in the prey population; (2) in cases where the relative proportions of individual prey components were not reported (N = 1: Monteleone e( Peterson 1986), we estimated the dry weight biomass of food with Eq. (1) by assuming that the diet was comprised of equal
Table 1. Conventions, extracted from the literature, used to estimate the influence of food density on larval fish ingestion rates. Data sources listed alphabetically below table
Convention Reference
Preserved larval fish dry weight = 0.8 X unpreserved larval flsh dry weight 5, 7, 8, 16 Preserved zooplankton dry weight = 0.6 X unpreserved zooplankton dry weight 7, 18 Carbon mass = 0.4 X dry mass (zooplankton) 15 Carbon mass = 0.55 x dry mass (Artemia nauplii) 14 Dry mass = 0.2 X wet mass (fish larvae) 12 Specific gravity of zooplankton = 1 g cm-3 11 ?G ash = 0.11 X dry weight 1 Acartja tonsa nauplius = 0.26 !(g 6 Artem~a nauplius = 1.85 pg 2 Brachionus (mixed sizes) = 0.16 pg 17 C'alanus finmarchicus (nauplius) = 1.5 pg 4 Euryternora affinjs (naupl~us) = 0.28 pg 3, 10 E. affinls (copepodite) = 2.2 pg 3 E. affinis (adult) = 10.4 {(g (April-May in Chesapeake estuary) 9 Pseudocalanus (nauplius) = 0.26 ~cg 13
1, BBmstedt (1986); 2, Benijts et al. (1975); 3, Burkhili & Kendall (1982; see also Chesney 1989); 4, Davis (1984); 5, Delafontaine & Leggett (1989); 6, Durbin & Durbin (1981); 7, Giguere et al. (1989); 8, Hay (1984); 9, Heinle & Frerner (1975; see also Chesney 1989); 10, Houde & Schekter (1981; see also Chesney 1989); 11, MacCauley (1984); 12, McGurk (1986); 13, Monteleone & Peterson (1986); 14, Oppenheimer & Moreira (1980); 15, Peters (1983); 16, Theilacker & Dorsey (1980), 17, Thedacker & McMaster (1971); 18, Vidal & S m ~ t h (1986)
h4acKenz1e et. al. Est~mating larval fish ingestion rates 211
proportions of all prey; (3) in cases where only 1 size of prey was offered per experimental treatment (N = 7), we multiplied the numerical density of prey by the dry weight equivalent of an individual prey comprising the diet.
All 11 studies used in our analysis reported ingestion rate estimates for larvae of several sizes. To minimize potential bias caused by over-representation of l or 2 species whose ingestion rates were measured several times in 1 study and at a narrow range of experimental conditions, we restricted our data to the lower and upper limits, and midpoint, of the reported size range of larvae used in each combination of experimental con- ditions.
All ingestion rate estimates were standardized to a 12 h feeding period. We adopted this convention because larval fish are visual feeders (Hunter 1981, Blaxter 1988).
To evaluate the potential effects of methodological factors on laboratory estimates of ingestion rate, we included in our data set water temperature, experimen- tal container volume, larval density (numbers I- ' ) , and prey type (Brachionus and/or Artemia, or wild zoo- plankton). The results of earlier studies of ingestion rates of larval fish and other zooplankton (e.g. Rosen- thal & Hempel 1970, Houde 1977, Barahona-Fernandes & Conan 1981, Peters & Downing 1984, Delafontaine &
Leggett 1987) suggested that these variables can be important contributors to observed variation in mea- sured ingestion rates. Several other variables that are also believed to influence ingestion rates (e.g. turbu- lence, light intensity, turbidity; Chesney 1989) were not evaluated because they were reported too infre- quently to be incorporated in the analyses.
Statistical techniques: All data were expressed in standard units as detailed above. Ingestion rates, larval and prey sizes, larval and food densities were logarith- mically-transformed (base 10) prior to regression analy- sis to linearize allometric relationships and stabilize the variance in our data set (Peters & Downing 1984). In our analysis we intentionally excluded interaction and higher order terms to retain simplicity and to reduce the likelihood of fitting the model to outliers (Peters & Downing 1984), even though this exclusion may reduce the amount of variance explained.
We used analysis of covariance (Zar 1974) to distin- guish the possible effect of different prey types (e.g. Rosenthal & Hempel 1970, Vu 1983). We coded Artemia nauplii or Brachionus as 0 and wild zooplank- ton native to the larval habitat, whether collected from the sea or cultured in the laboratory, as 1.
Model construction: Body size strongly influences ingestion rates in a wide variety of animals (Peters 1983) and influences many other life-history traits among larval fish (Miller et al. 1988). We first examined
the effect of larval size on ingestion rates before consid- ering other variables. We then used stepwise regres- sion and scatterplots to evaluate the influence of the remaining variables on residual variation about the allometric model, and all subsequent models. The crite- rion for variable selection and retention was set at p <0.05. All computations were performed with SAS 6.0 (PC version; SAS 1985a, b) and Systat 4.0 (Wilkin- son 1988).
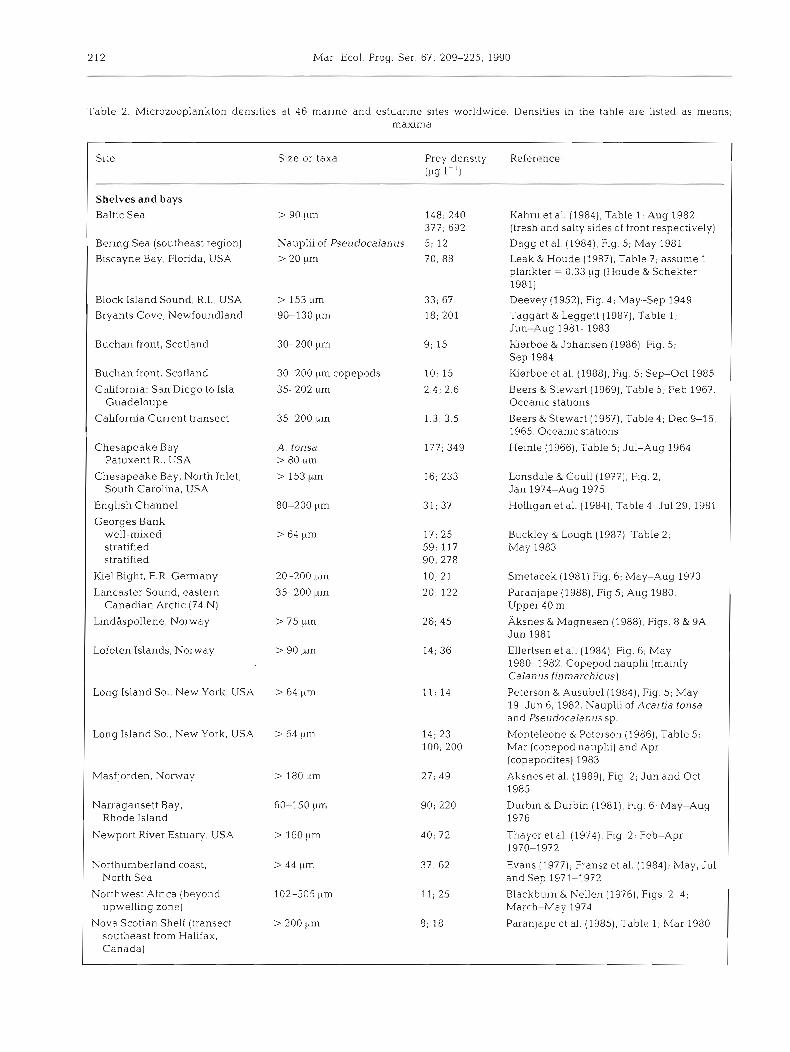
Larval feeding ecology in nature. Natural mic- rozooplankton densities: We used the laboratory based functional response models we developed to investigate the likelihood that natural food densities permit wild larvae to feed at maximal rates. For this analysis, we compiled literature estimates of microzoo- plankton abundance for a variety of marine environ- ments (Table 2).
In developing this data set we used only microzoo- plankton abundance estimates derived in studies that employed mesh sizes < 200 pm. This was done because early stage larvae generally consume prey smaller than this size (Theilacker & Dorsey 1980, Frank 1988). In some studies zooplankton samples were size-fraction- ated prior to weighing. In these cases we used only those data which related to size classes which closely corresponded to the <200 Lim component. This re- duced, but did not eliminate, the possible effect of contamination by larger zooplankton on estimates of larval prey abundance.
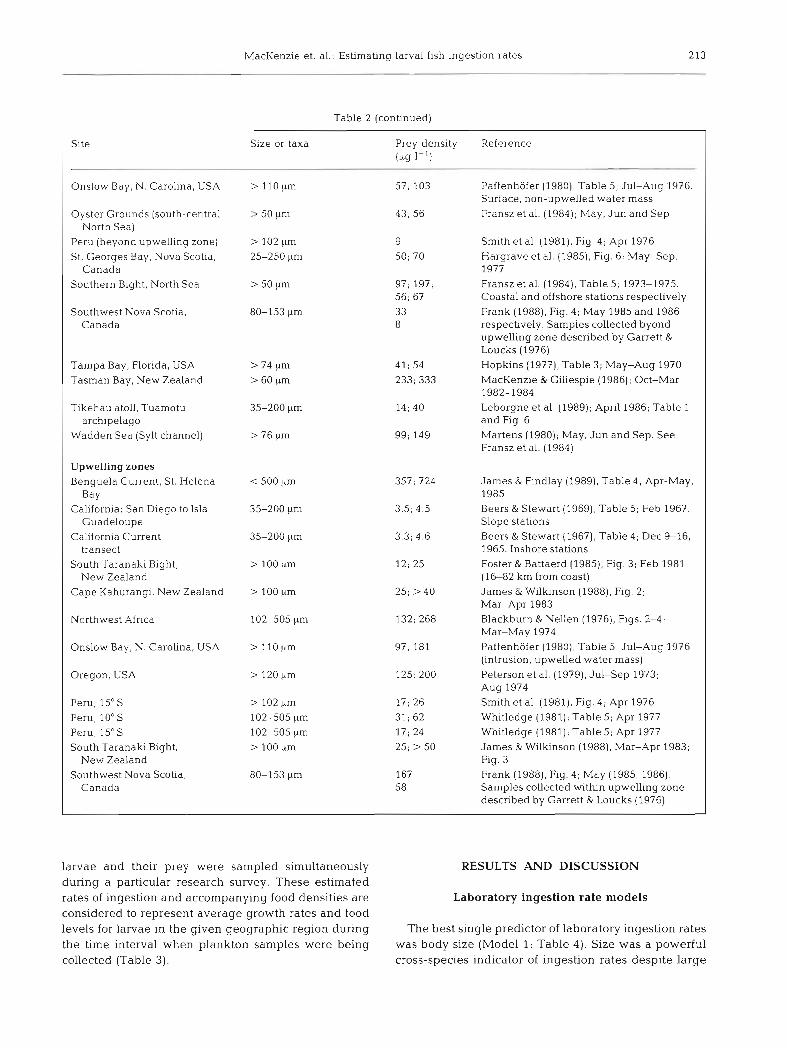
We recorded the average and maximum (Owen 1989) prey density in each study. Many data were extracted directly from figures and tables. In some cases, authors reported prey densities as ranges or averages. In these cases we used range midpoints or averages as representative densities for the areas in question. In cases where distinct habitats were sam- pled (e.g. within and beyond an upwelling region), we grouped data accordingly in order to accurately reflect these different hydrographic regimes. In cases where the seasonal occurrence of fish larvae was known for a given area or habitat, we used only zooplankton densities corresponding to that interval.
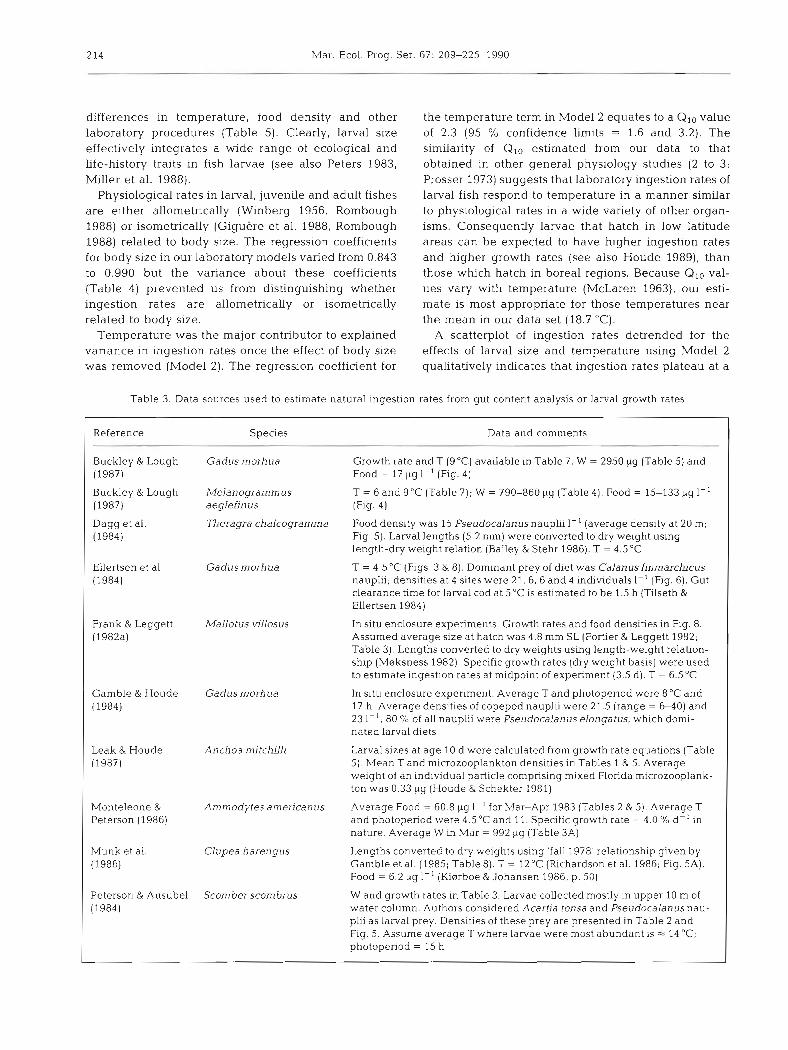
Ingestion rates o f wild larvae: To examine how ingestion rates of wild larvae were related to food density, we gathered from the literature ingestion rates for wild and enclosure-reared larvae and compared these as a group with those predicted by our labora- tory-based model. Ingestion rates of wild larvae were estimated using either gut content analyses of field- collected specimens combined with a corresponding species-specific laboratory estimate of digestion rate (N = 5 ; Dagg et al. 1984, Ellertsen et al. 1984), or were calculated from growth rate and in situ temperatures (N = 31; see Checkley 1984). In compiling this data base, we only included data from field studies in which
212 Mar Ecol. Prog. Ser. 67: 209-225, 1990
Table 2. Microzooplankton densities at 46 marine and estuarine sites worldwide. Densities in the table are listed as means; rnaxlrna
Site Size or taxa Prey density [klg 1-l)
Reference
Shelves and bays
Baltic Sea Kahru et al. (1984). Table 1; Aug 1982. (fresh and salty sides of front respectively)
Dagg et al. (1984), Fig. 5 ; May 1981 Bering Sea (southeast region) Nauplli of Pseudocalanus 5; 12 Biscayne Bay. Florida. USA > 20 pm 70; 88 Leak & Houde (1987), Table 7; assume 1
plankter = 0 33 pg (Houde & Schekter 1981)
Block Island Sound, R.I., USA > 153 pm Bryants Cove, Newfoundland 90-130 yrn
Deevey (1952), Fig. 4; May-Sep 1949 Taggart & Leggett (1987), Table 1; Jun-Aug 1981-1983
Buchan front, Scotland 30-200 pm 9; 15 Ki~rboe & Johansen (1986), Fig. 5; Sep 1984
Kierboe et al. (1988). Fig. 5 ; Sep-Oct 1985 Buchan front. Scotland 30-200 lim copepods 10; 15
California: San Diego to Isla 35-202 2.4; 2.6 Guadeloupe
California Current transect 35-200 ~trn 1.3; 3.5
Beers & Stewart (1969), Table 5; Feb 1967. Oceanic statlons
Beers & Stewart (1967), Table 4 ; Dec 9-16, 1965. Ocean~c stat~ons
Heinle (1966). Table 5; Jul-Aug 1964 Chesapeake Bay Patuxent R . , USA
Chesapeake Bay, North Inlet, South Carolina, USA
English Channel
Georges Bank well-mixed stratified stratified
h e 1 Bight, F.R. Germany
A. tonsa > 80 kirn
> 153 gm Lonsdale & Coull (1977), Fig. 2; Jan 1974-Aug 1975
Holl~gan et al. (1984), Table 4; Jul29, 1981
> 64 urn Buckley & Lough (1987), Table 2; May 1983
Srnetacek (1981) Fig. 6: May-Aug 1973
Paranjape (1988), Fig 5; Aug 1980. Upper 40 m
Aksnes & Magnesen (1988), Figs. 8 & 9A; Jun 1981
Ellertsen et al. (1984), Fig 6; May 1980-1982. Copepod nauplii (ma~nly Calanus finmarchicus)
Peterson & Ausubel (1984), Fig. 5 ; May 19-Jun 6, 1982. Nauplii of Acartia lonsa and Pseudocalanus sp.
Monteleone & Peterson (1986), Table 5; Mar (copepod nauplii) and Apr (copepodites) 1983
~ k s n e s et al. (1989), Fig. 2; Jun and Oct 1985
Durbin & Durbin (1981), Fig 6; May-Aug 1976
Thayer et al. (1974). Fig. 2; Feb-Apr 1970-1972
Evans (1977); Fransz et al. (1984); May, Jul andSep1971-1972
Blackburn & Nellen (1976). Figs. 2-4; March-May 1974
Paranjape et al. (1985), Table 1; Mar 1980
Lancaster Sound, eastern Canadian Arctic (74 N)
Lindbspollene, Norway
I Lofoten Islands, Norway > 90 ,urn
I Long Island So., New York, USA > 64 pm
Long Island So., New York, USA > 64 urn
Masfjorden, Nonvay > 180 pm 27: 49
Narragansett Bay, 60-150 pm Rhode Island
Newport River Estuary, USA > 160 {trn
Northumberland coast, > 44 k~rn North Sea
Northwest Africa (beyond 102-505 pm upwelling zone)
Nova Scottan Shelf (transect > 200 l.~m southeast from Halifax, Canada)
MacKenzie et, al.: Estimating larval fish ingestion rates 213
Table 2 (continued)
Site Size or taxa Prey density Reference (PS I-')
Onslow Bay, N. Carolina, USA > 110 pm 57; 103 Paffenhofer (1980), Table 5; Jul-Aug 1976. Surface, non-upwelled water mass
Oyster Grounds (south-central > 50 ,urn 43; 56 Fransz et al. (1984); May, Jun and Sep North Sea)
Peru (beyond upwelling zone) > 102 ~ ~ r n 9 Smith et al. (1981), Fig. 4 ; Apr 1976 St. Georges Bay, Nova Scotla, 25-250 pm 50; 70 Hargrave et al. (1985), Fig. 6; May-Sep.
Canada 1977 Southern Bight, North Sea > 50 pm 97; 197, Fransz et al. (1984), Table 5; 1973-1975.
56; 67 Coastal and offshore stations respectively
Southwest Nova Scotia, 80-153 pm 33 Frank (1988), Fig. 4 ; May 1985 and 1986 Canada 8 respectively. Samples collected byond
upwelling zone described by Garrett & Loucks (1976)
Tampa Bay, Florida, USA > 74 pm 41; 54 Hopkins (1977), Table 3; May-Aug 1970 Tasman Bay, New Zealand > 60 pm 233; 333 MacKenzie & Gillespie (1986); Oct-Mar
1982-1984
Tikehau atoll, Tuamotu 35-200 pm 14; 40 Leborgne et al. (1989); April 1986; Table 1 archipelago and Fig. 6
Wadden Sea (Sylt channel) > 7 6 ynl 99; 149 Martens (1980); May, Jun and Sep. See Fransz et al. (1984)
Upwelling zones Benguela Current, St. Helena < 500 ,urn 357; 724 James & Findlay (1989), Table 4 , Apr-May,
Bay 1985 California: San Diego to Isla 35-200 ltm 3.5, 4 5 Beers & Stewart (1969), Table 5; Feb 1967.
Guadeloupe Slope stations California Current 35-200 pm 3.3; 4.6 Beers & Stewart (1967), Table 4; Dec 9-16,
transect 1965. Inshore stations South Taranaki Bight, > 100 pm 12; 25 Foster & Battaerd (1985), Fig. 3; Feb 1981
New Zealand (1-2 km from coast) Cape Kahurangi, New Zealand > 100 pm 25; > 40 James & Willunson (1988), Fig. 2;
Mar-Apr 1983
Northwest Africa 102-505 pm 132; 268 Blackburn & Nellen (1976), Figs. 2 4 ; Mar-May 1974
Onslow Bay, N. Carolina, USA > 110 pm 97; 181 Paffenhofer (1980), Table 5 ; Jul-Aug 1976 (intrusion, upwelled water mass)
Oregon, USA > 120pm 125; 200 Peterson et al. (1979), Jul-Sep 1973; Aug 1974
Peru; 15" S 1 102 pm 17; 26 Smith et al. (1981), Fig. 4 ; Apr 1976
Peru; 10" S 102-505 pm 31; 62 Whitledge (1981); Table 5; Apr 1977 Peru; 15" S 102-505 pm 17; 24 Whitledge (1981); Table 5; Apr 1977 South Taranaki Bight, > 100 pm 25; > 50 James & Wilkinson (1988), Mar-Apr 1983;
New Zealand Fig. 3 Southwest Nova Scotia, 80-153 pm 167 Frank (1988), Fig. 4; May (1985, 1986).
Canada 58 Samples collected withln upwelling zone described by Garrett & Loucks (1976)
larvae and their prey were sampled simultaneously RESULTS AND DISCUSSION during a particular research survey. These estimated rates of ingestion and accompanying food densities are Laboratory ingestion rate models considered to represent average growth rates and food levels for larvae in the given geographic region during The best single predictor of laboratory ingestion rates the time interval when plankton samples were being was body size (Model 1; Table 4 ) . Size was a powerful collected (Table 3). cross-species indicator of ingestion rates despite large
214 Mar. Ecol. Prog. Ser. 67: 209-225, 1990
differences in temperature, food density and other laboratory procedures (Table 5). Clearly, larval size effectively integrates a wide range of ecological and life-history traits in fish larvae (see also Peters 1983, Miller et al. 1988).
Physiological rates in larval, juvenile and adult fishes are either allometncally (Winberg 1956, Rombough 1988) or isometrically (Giguere et al. 1988, Rombough 1988) related to body size. The regression coefficients for body size in our laboratory models varied from 0.843 to 0.990 but the variance about these coefficients (Table 4 ) prevented us from distinguishing whether ingestion rates are allometrically or isometrically related to body size.
Temperature was the major contributor to explained variance in ingestion rates once the effect of body size was removed (Model 2). The regression coefficient for
the temperature term in Model 2 equates to a Qlo value of 2.3 (95 O/O confidence limits = 1.6 and 3.2). The similarity of Q I o estimated from our data to that obtained in other general physiology studies (2 to 3 ; Prosser 1973) suggests that laboratory ingestion rates of larval fish respond to temperature in a manner similar to physiolo~cal rates in a wide variety of other organ- isms. Consequently larvae that hatch in low latitude areas can be expected to have higher ingestion rates and higher growth rates (see also Houde 1989), than those which hatch in boreal regions. Because Qlo val- ues vary with temperature (McLaren 1963), our esti- mate is most appropriate for those temperatures near the mean in our data set (18.7 "C).
A scatterplot of ingestion rates detrended for the effects of larval size and temperature using Model 2 qualitatively indicates that ingestion rates plateau at a
Table 3. Data sources used to estimate natural ingestion rates from gut content analysis or larval growth rates
Reference
Buckley & Lough (1 987)
Buckley & Lough (1987)
Dagg et a1 (1984)
Ellertsen et a1 (1984)
Frank & Leggett (1982a)
Gamble & Houde (1984)
Leak & Houde (1987)
Monteleone & Peterson (1986)
Munk et a1 (1986)
Peterson & Ausubel (1 984)
Species Data and comments
Gadusmorhua Growth rate and T (9°C) available in Table 7. W = 2950 pg (Table 5) and Food = 17 pg 1-' (Fig. 4)
Melanogramm u s T = 6 and 9°C (Table 7); W = 790-860 pg (Table 4). Food = 15-133 big I - ' aeglefin us (Fig. 4)
73eragra chalcogramma Food density was 15 Pseudocalanus nauplii 1-' (average density at 20 m; Fig 5). Larval lengths (5.2 mm) were converted to dry weight using length-dry weight relation (Bailey & Stehr 1986). T = 4.5"C
Gadus morhua T = 421°C (Figs. 3 & 8). Dominant prey of diet was Calanusfinmarchicus nauplii; densities at 4 sites were 21 .6 ,6 and 4 individuals I-' (Fig. 6). Gut clearance time for larval cod at 5 "C is estimated to be 1.5 h (Tilseth & Ellertsen 1984)
MaUotus villosus In situ enclosure experiments. Growth rates and food densities in Fig. 8. Assumed average size at hatch was 4.8 mm SL (Fortier & Leggett 1982; Table 3). Lengths converted to dry weights using length-weight relation- ship (Msksness 1982). Specific growth rates (dry weight basis) were used to estimate ingestion rates at midpoint of experiment (3.5 d). T = 6S°C
Gadus morhua
Anchoa mitchllll
In s ~ t u enclosure experiment. Average T and photoperiod were 8°C and 17 h. Average densities of copepod nauplii were 21.5 (range = 6 4 0 ) and 23 I- ' ; 80 % of all nauplii were Pseudocalanus elongatus, which domi- nated larval d ~ e t s
Larval sizes at age 10 d were calculated from growth rate equations (Table 5). Mean T and microzooplankton densities in Tables 1 & 5. Average weight of an individual particle comprising mjxed Florida microzooplank- ton was 0.33 11g (Houde & Schekter 1981)
Ammodytes americanus Average Food = 60.8 pg I - ' for Mar-Apr 1983 (Tables 2 & 5). Average T and photoperiod were 4.5"C and 11. Specific growth rate = 4.0 % d-' in nature. Average W in Mar = 992 pg (Table 3A)
Clupea harengus Lengths converted to dry weights usmg 'fall 1978' relationship given by Gamble et al. (1985; Table 8). T = 12°C (kchardson et al. 1986; Fig. 5A). Food = 6.2 big I- ' (Kiorboe & Johansen 1986; p. 50)
Scorn ber scorn brus W and growth rates in Table 3. Larvae collected mostly in upper 10 m of water column. Authors considered Acartia tonsa and Pseudocalanusnau- p h as larval prey. Densities of these prey are presented in Table 2 and Fig. 5. Assume average T where larvae were most abundant is = 14 "C; photoperiod = 15 h
MacKenz~e et , al.: Estimating larval fish ingestlon rates
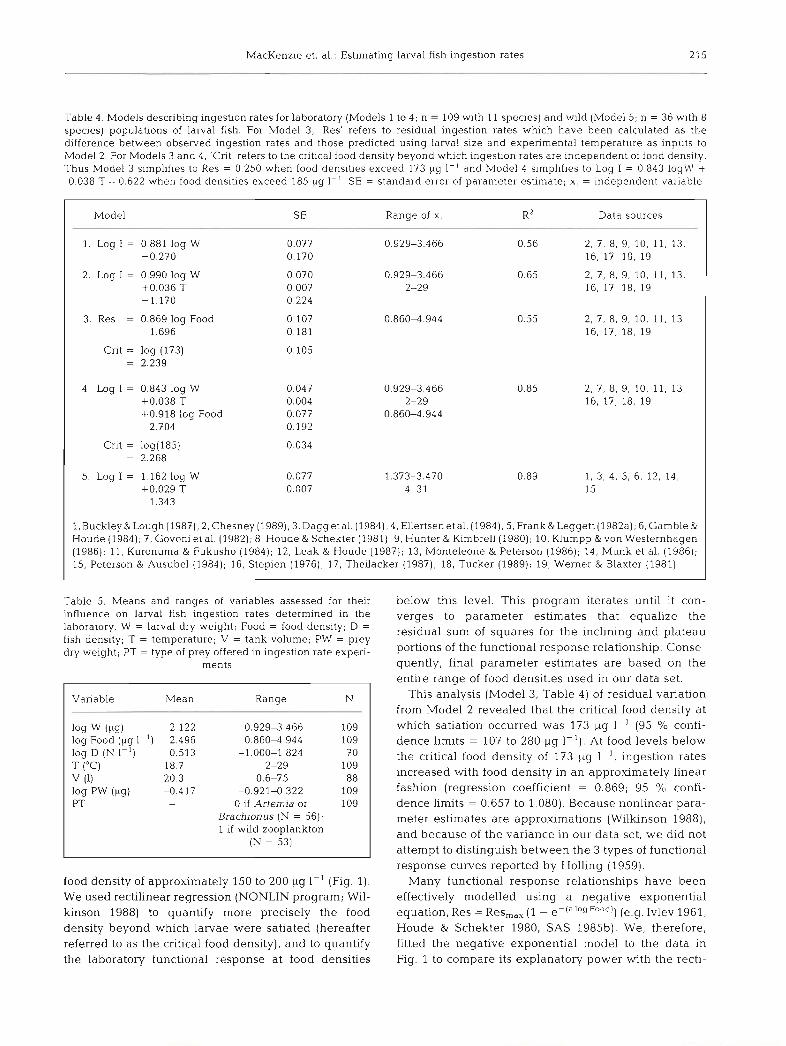
Table 4 Models descrlblng Ingestion rates for laboratory (Models 1 to 4, n = 109 w ~ t h 11 spec~es ) and wild (Model 5 , n = 36 wlth 8 specles) populations of larval flsh For Model 3, Res refers to res~dual lngest~on rates w h ~ c h have been calculated as the difference between observed lngestlon rates and those predicted using larval slze and exper~menta l temperature as inputs to L4odel 2 For Models 3 and 4 C r ~ t refers to the crit~cal food denslty beyond which ingestlon rates are Independent of food density Thus Model 3 s~mpllfles to Res = 0 250 when food dens~t ies exceed 173 ,ug 1 - ' and Model 4 s~mpl~f l e s to Log I = 0 843 logW + 0 038 T - 0 622 when food densi t~es exceed 185 pg 1- ' SE = standard error of parameter estimate, X, = independent variable
Model SE Range of x, R* Data sources - - - -
1. Log I = 0 881 log W -0.270
2 Log I = 0.990 log W +0.036 T -1.170
3. Res = 0.869 log Food - 1.696
Crit = log (173) = 2.239
4. Log I = 0.843 log W +0.038 T +0.918 log Food -2.704
Cnt = log(185) = 2.268
5. Log I = 1.162 log W +0.029 T -1.343
1, Buckley &Lough (1987); 2, Chesney (1989); 3, Dagget al. (1984); 4, Ellertsenetal. (1984); 5, Frank& Leggett (1982a); 6, Gamble & Houde (1984); 7, Govoni et a1 (1982); 8 , Houde & Schekter (1981); 9, Hunter & Kimbrell(l980); 10, Klumpp & von Westernhagen (1986); 11, Kuronuma & Fukusho (1984); 12, Leak & Houde (1987); 13, Monteleone & Peterson (1986); 14, Munk et al. (1986); 15, Peterson & Ausubel (1984); 16. Stepien (1976), 17, Thellacker (1987); 18, Tucker (1989); 19, Werner & Blaxter (1981)
Table 5. Means and ranges of vanables assessed for their influence on larval fish ingestion rates determined in the laboratory. W = larval dry weight; Food = food density; D =
fish density; T = temperature; V = tank volume; PW = prey dry weight; PT = type of prey offered In lngestlon rate experi-
ments
below this level. This program iterates until it con- verges to parameter estimates that equalize the residual sum of squares for the inclining and plateau portions of the functional response relationship. Conse- quently, final parameter estimates are based on the entire range of food densities used in our data set.
This analysis (Model 3, Table 4 ) of residual variation from Model 2 revealed that the critical food density at which satiation occurred was 173 ,ug 1-I (95 % confi- dence limits = 107 to 280 yg I - ' ) . At food levels below the critical food density of 173 vg 1 - l , ingestion rates increased with food density in an approximately linear fashion (regression coefficient = 0.869; 95 % confi- dence limits = 0.657 to 1.080). Because nonlinear para- meter estimates are approximations (Willunson 1988), and because of the variance in our data set, we did not attempt to distinguish between the 3 types of functional response curves reported by Holling (1959).
Many functional response relationships have been effectively modelled using a negative exponential equation, Res = Res,,, (1 - e-(a'OgFOOdi ) (e.g. Ivlev 1961, Houde & Schekter 1980, SAS 1985b). We, therefore, fitted the negative exponential model to the data in Fig. 1 to compare its explanatory power with the 1-ecti-
Variable Mean Range
log W (PS) log Food (pg I - ' ) log D (N I- ' ) T ("C) v (1) log p w ( W ) PT
0.929-3 466 0.860-4.944
-1.000-1.824 2-29
0.6-75 -0.921-0 322
0 if Ar t em~a or Brachionus ( N = 56); 1 if wlld zooplankton
(N = 53)
food density of approximately 150 to 200 yg 1-' (Fig. 1). We used rectilinear regression (NONLIN program; Wil- lunson 1988) to quantify more precisely the food density beyond which larvae were satiated (hereafter referred to as the critical food density), and to quantify the laboratory functional response at food densities

216 Mar Ecol. Prog. Ser
linear model. The negative exponential model (Res = 0.391 -3.529 e ( - ' ~ 0 7 7 1 0 ~ 0 0 d ) ) explained slightly less variance (R2 = 0.54) than the rectilinear model (Fig. l ; R2 = 0.55).
Given this finding, we prefer the rectilinear regres- sion model because it (1) explicitly identifies the food density (and its confidence limits) at which ingestion rates become satiated, (2) has fewer parameters than other models (Holling 1959, Ivlev 1961) across the range of food densities that larvae are likely to encounter in nature (Fig. 2B), (3) has power equal to more complex models in explaining the variance in ingestion rates detrended for the effects of larval size and experimental temperature; (4) easily accomodates additional significant variables if required (e.g. labora- tory artifacts).
We next developed a multivariate model (Model 4 , Table 4) employing larval size, temperature and food density as inputs; food density was again treated rectilinearly (Wilkinson 1988). The resulting model (Model 4 ) is statistically equivalent to combining Model 2 and Model 3.
Model 4 indicated that the average-sized larva (132.4 pg; Table 5) in our data set became satiated at a food density of 185 pg I-' (95 % confidence limits = 158 to 217 pg 1-l ; average temperature = 18.7 "C). This criti- cal food density does not differ significantly from the output of Model 3. The predicted maximum ingestion rate for a 132.4 kcg larva at 18.7 "C at food densities equalling or exceeding the critical food density was 75.8 @g d-' (57.0 O/O of dry body weight d-'; Table 4).
Laboratory induced biases in ingestion rate estimates
The only experimental variables significantly corre- lated with residual variation from Model 4 were prey type and prey size (respectively, R = -0.22; p = 0.02; R = 0.22; p = 0.02; N = 109). Larvae fed wild zooplank- ton consumed less food than those fed Artemia or Brachionus, and larvae offered larger prey ingested more food than those fed smaller prey.
Artemia nauplii were among the heaviest food organisms offered in these studies (Table 1). These nauplii are also slow, inefficient swimmers compared to copepod nauplii (Gauld 1959). Our results are therefore consistent with the hypothesis that fish larvae are most effective at capturing large, slow-swimming prey. However, prey preferences are known to vary widely among different species of larval fish and to depend on the behaviour of both larvae and prey, and on prey size and color (Checkley 1982, Peterson & Ausubel 1984). Generalizations are therefore difficult and dangerous. The strongest result of this analysis was the fact that the effects of prey type and prey size were very small
- I m
1 1 10 100 1000 10000 100000
Food Density (rg l") Fig. 1. Scatterplot of larval ingestion rates determined in laboratory experiments and expressed as a function of food dens~ty. The effects of larval size and experimental tempera- ture were removed using Model 2 (Table 4) to isolate the influence of food density on ingestion rates. The fitted curve reflects a rectilinear model (Model 3, Table 4) which explicitly
defines the critical food density at which satiation occurs
relative to the effects of size, temperature and food density.
Fish density and container volume did not systemati- cally bias the estimates of ingestion rate (p = 0.86; N =
70 and p = 0.23; N = 88 respectively). This observation is inconsistent with the results of enclosure and meso- cosm experiments which have typically yielded growth rates that were higher than those reported from laboratory tanks (Blaxter 1988). We conclude that the modest number and range of experimental conditions (Table 5) in our data set and the potential for confound- ing variables precluded the identification of such artifacts. For example, the positive correlation between larval and food densities ( R ~ = 0.53; p < 0.0001; N = 70) in the experiments we surveyed may have reduced the likelihood that unnaturally high laboratory fish densities would suppress individual feeding rates.
Species-specific ingestion rates
The cumulative influence of size, temperature and food density on feeding rates in our data set is large (Table 4), and the influence of experimental factors on standardized feeding rates in our data set was rela- tively small. This suggests that the residual variation about Model 4 could be related to interspecific differ- ences. This variation can be partitioned on a species- specific basis as follows:
I, = l00 antilog [ 2 (l0y1,~ - loyIl,)/N I (2)
where I, = average relative ingestion rate for species S;
logI,, = observed ingestion rate for each individual of
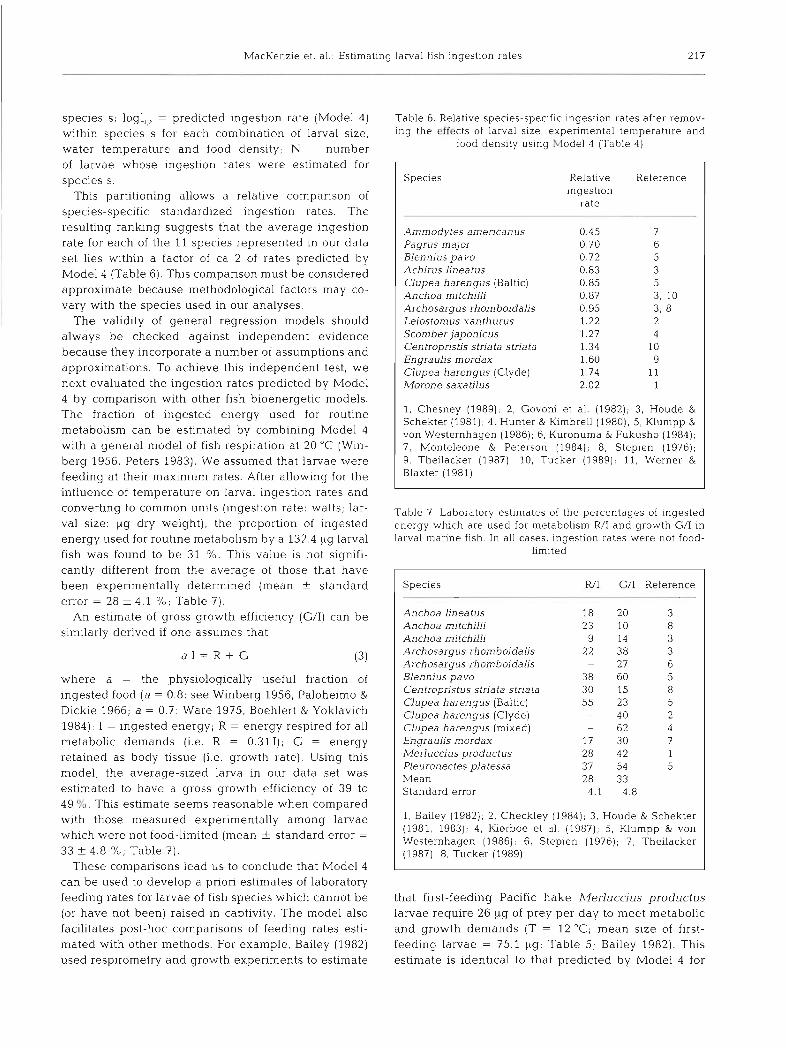
MacKenzie et. a1 Estlmatlng larval fish ingest~on rates 217
species S; logI,, = predicted ingestion rate (Model 4 ) within species s for each combination of larval size, water temperature and food density; N = number of larvae whose ingestion rates were estimated for species S.
This partitioning allows a relative comparison of species-specific standardized ingestion rates. The resulting ranking suggests that the average ingestion rate for each of the 11 species represented in our data set lies within a factor of ca 2 of rates predicted by Model 4 (Table 6). This conlparison must be considered approximate because methodological factors may co- vary with the species used in our analyses.
The validity of general regression models should always be checked against independent evldence because they incorporate a number of assumptions and approximations. To achieve this independent test, we next evaluated the ingestion rates predicted by Model 4 by comparison with other fish bioenergetic models. The fraction of ingested energy used for routine metabolism can be estimated by combining Model 4 with a general model of fish respiration at 20 'C (Win- berg 1956, Peters 1983). We assumed that larvae were feeding at their maximum rates. After allowing for the influence of temperature on larval ingestion rates and converting to common units (ingestion rate: watts; lar- val size: ,ug dry weight), the proportion of ingested energy used for routine metabolism by a 132.4 pg larval fish was found to be 31 %. This value 1s not signifi- cantly different from the average of those that have been experimentally determined (mean f standard error = 28 f 4.1 %; Table 7) .
An estimate of gross growth efficiency (G/I) can be similarly derived if one assumes that
Table 6. ing the
Relat~ve species-specific inges t~on rates after remov- effects of larval size, expenmental temperature and
food dens~ ty using Glodel 4 (Table 4)
Specles Relat~ve Reference lngestlon
rate
Ammodytes amencanus Pagrus major Blennlus pavo Achirus lineat us Clupea harengus (Baltic) Anchoa mitchilli Archosargus rhomboidalis Lelostom 11s xanthurus Scomber japonicus Centropristis stria ta stria ta Engra uhs mordax Clupea harengus (Clyde) Morone saxatilus
1. Chesney (1989), 2 , Govoni et al. (1982); 3, Houde & Schekter (1981); 4, Hunter & Kimbrell (1980); 5, Klumpp & von Westernhagen (1986); 6, Kuronuma & Fukusho (1984); 7, Monteleone & Peterson (1984), 8 , Stepien (1976); 9, Theilacker (1987); 10, Tucker (1989), 11, Werner & Blaxter (1981)
Table 7 Laboratory estimates of the percentages of lngested energy which are used for metabolism R/I and growth G/I in larval marlne fish In all cases, ingestion rates were not food-
limited
where a - the physiologically useful fraction of ingested food (a = 0.8: see Winberg 1956, Paloheimo & Dickie 1966; a = 0.7: Ware 1975, Boehlert & Yoklavich 1984); I = ingested energy; R = energy respired for all metabolic demands (i .e . R = 0.311); G = energy retained as body tissue (Le, growth rate). Using this model, the average-sized larva in our data set was estimated to have a gross growth efficiency of 39 to 49 9:. This estimate seems reasonable when compared with those measured experimentally among larvae which were not food-limited (mean f standard error =
33 f 4.8 O/O; Table 7). These comparisons lead us to conclude that Model 4
can be used to develop a priori estimates of laboratory feeding rates for larvae of fish species which cannot be that first-feeding Pacific hake Merluccjus productus (or have not been) raised in captivity. The model also larvae require 26 ,ug of prey per day to meet metabolic facilitates post-hoc comparisons of feeding rates esti- and growth demands (T = 12 "C; mean size of first- mated with other methods. For example, Bailey (1982) feedlng larvae = 75.1 pg; Table 5; Bailey 1982). This used respirometry and growth experiments to estimate estimate is identical to that predicted by Model 4 for
Specles RI1 G/I Reference
Anchoa Lineatus 18 20 3 Anchoa mitchilli 23 10 8 Anchoa mitchilll 9 14 3 Archosargus rhomboidalis 22 38 3 AI-chosargus rhomboidalis - 27 6 Blennius pavo 38 60 5 Cen tropristus stnata stnata 30 15 8 Clupea harengus (Baltlc) 55 23 5 Clupea harengus (Clyde) - 40 2 Clupea harengus (m~xed) - 62 4 Engra ulis mordax 17 30 7 Merluccius productus 28 42 1 Pleuronectes platessa 37 54 5 h4ean 28 33 Standard error 4.1 4 8
1, Bailey (1982); 2, Checkley (1984); 3, Houde & Schekter (1981, 1983); 4, I(10rboe et al. (1987); 5 , Klumpp & von Westernhagen (1986); 6, Stepien (1976); 7, Theilacker (1987); 8 , Tucker (1989)
218 Mar. Ecol. Prog. Ser. 67 209-225, 1990
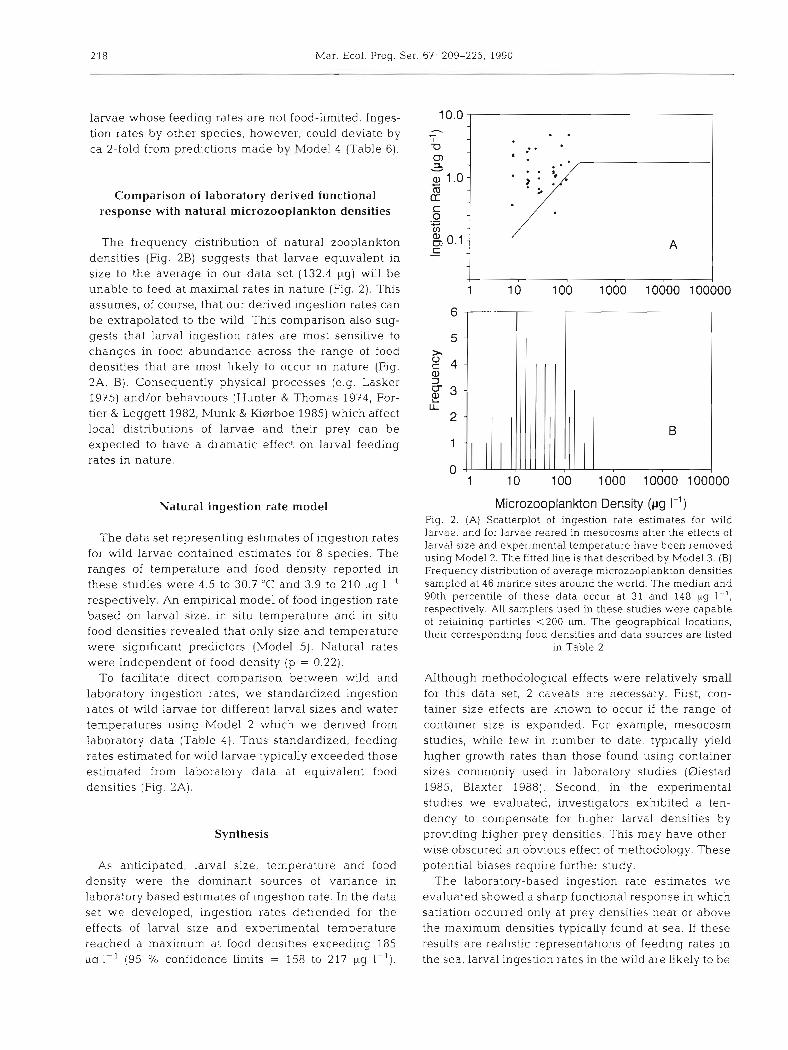
larvae whose feeding rates are not food-limited. Inges- tion rates by other species, however, could deviate by ca 2-fold from predictions made by Model 4 (Table 6) .
Comparison of laboratory derived functional response with natural microzooplankton densities
The frequency distribution of natural zooplankton densities (Fig. 2B) suggests that larvae equivalent in size to the average in our data set (132.4 big) will be unable to feed a t maximal rates in nature (Fig. 2). This assumes, of course, that our derived ingestion rates can be extrapolated to the wild. This comparison also sug- gests that larval ingestion rates are most sensitive to changes in food abundance across the range of food densities that are most likely to occur in nature (Fig. 2A, B). Consequently physical processes (e.g. Lasker 1975) and/or behaviours (Hunter & Thomas 1974, For- tier & Leggett 1982, Munk & ffierrboe 1985) which affect local distributions of larvae and their prey can be expected to have a dramatic effect on larval feeding rates in nature.
Natural ingestion rate model
The data set representing estimates of ingestion rates for wild larvae contained estimates for 8 species. The ranges of temperature and food density reported in these studies were 4.5 to 30.7 'C and 3.9 to 210 pg 1-' respectively. An empirical model of food ingestion rate based on larval size, in situ temperature and in situ food densities revealed that only size and temperature were significant predictors (Model 5). Natural rates were independent of food density (p = 0.22).
To facilitate direct comparison between wild and laboratory ingestion rates, we standardized ingestion rates of wild larvae for different larval sizes and water temperatures using Model 2 which we derived from laboratory data (Table 4) . Thus standardized, feeding rates estimated for wild larvae typically exceeded those estimated from laboratory data at equivalent food densities (Fig. 2A).
Synthesis
As anticipated, larval size, temperature and food density were the dominant sources of variance in laboratory based estimates of ingestion rate. In the data set we developed, ingestion rates detrended for the effects of larval size and experimental temperature reached a maximum at food densities exceeding 185 uq I-' (95 % confidence limits = 158 to 217 pg I-').
Microzooplankon Density ( ~ g I-') Fig. 2. (A) Scatterplot of ingestion rate estimates for wild larvae, and for larvae reared in mesocosms after the effects of larval size and experimental temperature have been removed using Model 2 The fitted line is that described by Model 3. (B) Frequency distribution of average microzooplankton d e n s ~ t ~ e s sampled at 46 marine sites around the world. The median and 90th percentile of these data occur at 31 and 148 pg I-', respectively. All samplers used in these studies were capable of retaining particles <200 pm. The geographical locations, their corresponding food densities and data sources are listed
in Table 2
Although methodological effects were relatively small for this data set, 2 caveats are necessary. First, con- tainer size effects are known to occur if the range of container size is expanded. For example, mesocosm studies, while few in number to date, typically yleld higher growth rates than those found using container sizes commonly used in laboratory studies (Oiestad 1985, Blaxter 1988). Second, in the experi.menta1 studies we evaluated, investigators exhibited a ten- dency to compensate for higher larval densities by providing higher prey densities. This may have other- wise obscured an obvious effect of methodology. These potential biases require further study.
The laboratory-based ingestion rate estimates we evaluated showed a sharp functional response in which satiation occurred only at prey densities near or above the maximum densities typicaUy found at sea. If these results are realistic representations of feeding rates in the sea, larval ingeshon rates in the wild are likely to be
MacKenzie et. al.: Estimating larval fish ingestion rates 219
significantly below the maximum levels possible in most areas where larvae are found in nature.
However the independence of ingestion rates esti- mated for wild larvae and estimates of food density in the sea, coupled with the fact that these rates are uniformly near the maximum levels observed in laboratory studies, strongly suggests that laboratory functional response models seriously misrepresent natural feeding rates. However, before accepting thls conclusion several alternative explanations should be explored.
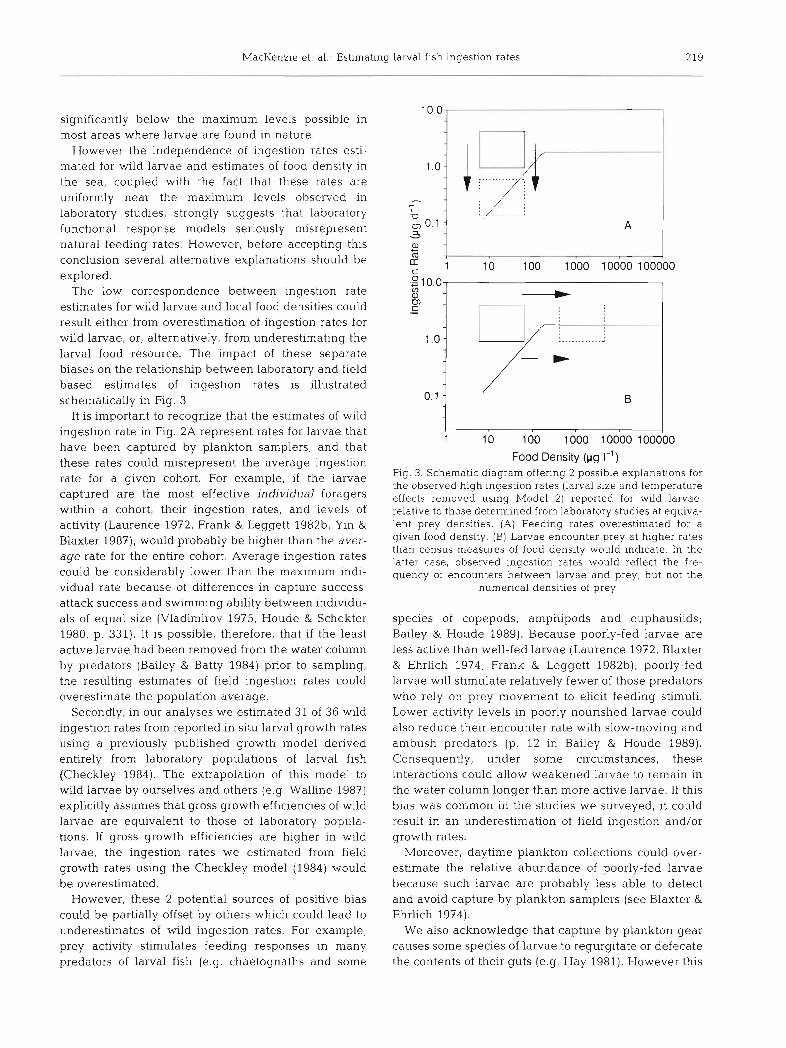
The low correspondence between ingestion rate estimates for wild larvae and local food densities could result either from overestimation of ingestion rates for wild larvae, or, alternatively, from underestimating the larval food resource. The impact of these separate biases on the relationship between laboratory and field based estimates of ingestion rates is illustrated schematically in Fig. 3.
It is important to recognize that the estimates of wild ingestion rate in Fig. 2A represent rates for larvae that 4 I
1 have been captured by plankton samplers, and that
10 100 1000 10000 100000
these rates could misrepresent the average ingestion Food Density (pg I-')
rate for a given cohort. For example, if the larvae Fig. 3. Schematic diagram offering 2 possible explanations for the observed high ingestion rates (larval size and temperature
captured are the most effective individual foragers effects removed usinq Model 2) reported for wild larvae, within a cohort, their ingestion rates, and levels of relative to those determined from laboiatow studies at equiva- activity (Laurence 1972, Frank & Leggett 1982b, Yin & Blaxter 1987), would probably be higher than the aver- age rate for the entire cohort. Average ingestion rates could be considerably lower than the maximum indi- vidual rate because of differences in capture success, attack success and swimming ability between individu- als of equal size (Vladimirov 1975, Houde & Schekter 1980, p. 331). It is possible, therefore, that if the least active larvae had been removed from the water column by predators (Bailey & Batty 1984) prior to sampling, the resulting estimates of field ingestion rates could overestimate the population average.
Secondly, in our analyses we estimated 31 of 36 wild ingestion rates from reported in situ larval growth rates using a previously published growth model derived entirely from laboratory populations of larval fish (Checkley 1984). The extrapolation of this model to wild larvae by ourselves and others (e.g. Walline 1987) explicitly assumes that gross growth efficiencies of wild larvae are equivalent to those of laboratory popula- tions. If gross growth efficiencies are higher in wild larvae, the ingestion rates we estimated from field growth rates using the Checkley model (1984) would be overestimated.
However, these 2 potential sources of positive bias could be partially offset by others which could lead to underestimates of wild ingestion rates. For example, prey activity stimulates feeding responses in many predators of larval fish (e.g. chaetognaths and some
lent prey densities. (A) Feeding rates overestimated -for a given food density. (B) Larvae encounter prey at higher rates than census measures of food density would indicate. In the latter case, observed ingestion rates would reflect the fre- quency of encounters between larvae and prey, but not the
numerical densities of prey
species of copepods, amphipods and euphausiids; Bailey & Houde 1989). Because poorly-fed larvae are less active than well-fed larvae (Laurence 1972, Blaxter & Ehrlich 1974, Frank & Leggett 1982b), poorly-fed larvae will stimulate relatively fewer of those predators who rely on prey movement to elicit feeding stimuli. Lower activity levels in poorly nourished larvae could also reduce their encounter rate with slow-moving and ambush predators (p. 12 in Bailey & Houde 1989). Consequently, under some circumstances, these interactions could allow weakened larvae to remain in the water column longer than more active larvae. If this bias was common in the studies we surveyed, it could result in an underestimation of field ingestion and/or growth rates.
Moreover, daytime plankton collections could over- estimate the relative abundance of poorly-fed larvae because such larvae are probably less able to detect and avoid capture by plankton samplers (see Blaxter & Ehrlich 1974).
We also acknowledge that capture by plankton gear causes some species of larvae to regurgitate or defecate the contents of their guts (e.g. Hay 1981). However this
220 Mar Ecol. Prog. Ser.
effect, and other potential sources of bias in determin- ing ingestion rates from gut contents and clearance data (e.g. different digestibilities of various prey types; Rosenthal & Hempel 1970), is likely to be small in our case because only 5 of the 36 field ingestion rates we report and used were based on the analysls of gut contents.
The cumulative magnitude and direction of these potential sources of bias is difficult to assess without a better knowledge of how different predators encounter and capture larvae that are feeding and growing at different rates in situ. Until such information becomes available we cannot exclude the possibility that the wild ingestion rates in our data set are biased by these and possibly other considerations.
However, we do believe that there is sufficient infor- mation available regarding in situ zooplankton abun- dance estimates to question whether these estimates adequately reflect larval prey availability. For example, estimates of prey standing stock are known to neglect zooplankton production rates which typically range from 0.5 to 2.0 CL^ 1-' d-' in continental shelf ecosystems (Middlebrook 81 Roff 1986, McLaren et al. 1989). Moreover, episodic product~on events can greatly increase rates of plankton production. These phenomena are common both in nearshore regions (Tont 1981, &cos & Wilson 1984, Atkinson et al. 1984. Takahashi et al. 1986, Lohrenz et al. 1988, Thresher et al. 1989) and in offshore areas of continental shelves (Checkley et al. 1988, Frank & Carscadden 1989). In addition, this new production is typically in the size range (e.g. Mullin et al. 1985, Checkley et al. 1988) required by early stages of larvae (Hunter 1981, Frank & Leggett 1986). Despite the probable importance of transient production events to larval feeding success, their influence is difficult to quantify and forecast with conventional methods (Cote & Platt 1983, Thresher et al. 1989).
Zooplankton is also known to be patchily distributed in the sea on the spatial scale of larval feedlng activity (metres to 100's of metres; see Jenkins 1988, Owen 1989). For example, the median prey density within a patch has been reported to be twice the density that would be obtained with integrative sampling gear (Owen 1989). However, patch intensity (number of prey per patch) can range up to 10-fold higher than an integrated density estimate, particularly if wind speeds are favorable (Owen 1989). As a consequence, esti- mates of prey density based on integrative sampling techniques are likely to be much lower than those actually experienced by fish larvae (review by Leggett 1986, Jenkins 1988, Owen 1989).
Census estimates of prey density also fail to incorpo- rate the positive effects of small-scale turbulence on plankton contact rates (Rothschild & Osborn 1988).
Larvae of other aquatic taxa are known to exploit micro-scale differences in the physical environment to improve feeding success (e.g. black flies Simulium vit- tatum; Morin & Peters 1988, Ciborowski & Craig 1989). It seems plausible, therefore, that larval fish may also be capable of exploiting physical variability in their habitat for similar purposes.
Finally, larval fish are known to swim faster in nature than when confined in laboratory tanks (von Western- hagen & Rosenthal 1979). Greater routine swimming speeds by wild larvae relative to those reared in the laboratory would cause wild larvae to search larger volumes, thereby increasing the potential for contacts between larvae and prey.
For all of these reasons, we believe that underestima- tion of the frequency of contacts between larvae and prey in nature is a major factor influencing the discre- pancy between laboratory and in situ ingestion rates (Fig. 2). Similarly our comparisons suggest that failure to design laboratory experiments that account for pro- cesses that benefit high rates of contact between larvae and their prey (e.g. larval behaviours, patchiness, tur- bulence) are certain to result in low feeding rates, unless researchers provlde unnaturally high prey densities in an attempt to compensate for artificial rearing conditions. Consequently those studies which are most effective at replicating the natural environ- ment can be expected to produce growth rates approaching those observed in nature (e.g. Kiurboe & Munk 1986).
Our observation that fish larvae in the sea can feed at rates near satiation, and that these rates appear to be largely independent of food density, is consistent with the results of several recent studies. High resolution sampling has shown that mortality rates can be inde- pendent of the food resource, in spite of large-scale variations in food abundance (Taggart & Leggett 1987), and confirms that prey densities in some nursery areas, where such sampling techniques have been employed, are unlikely to limit feeding rates (Jenkins 1987, 1988, Fort~er & Harris 1989).
It must be acknowledged, however, that the absence of a relationship between natural ingestion or growth rates and food density is not universal (e.g. Frank & Leggett 1982a, 1986, Buckley & Lough 1987, Korboe et al. 1988) However typical in situ prey densities, when coupled with appropriate interactions between prey distributions, the physical environment (e.g small- scale turbulence; Rothschild & Osborn 1988), and larval feeding and die1 migratory behavlours (Hunter & Thomas 1974, Heath et al. 1988, Munk et al. 1989) appear to be sufficient to allow many larval populations to feed at near-maximal rates In nature. In the absence of these (and possibly other) interactions, feeding rates at food densities < ca 185 pg 1-' will probably be sub-

MacKenzie et. al.: Estimati ng larval fish ingestion rates 221
maximal and could approach those predicted by our laboratory based functional response model (Model 4) .
In particular, much of the potential variability in larval feeding rates that might be expected to occur in the sea because of natural variation in food densities has probably already been dampened by spawning behaviour: the spawning activity of temperate and boreal species of fish is known to be highly restricted in time and space (Sinclair 1988). We suspect that the historical average for the larval food resource at these times/places may be more suitable for larval feeding than at other times or places (see also Kiarboe & Johan- sen 1986). Interannual variations in hydrodynamic regimes, which are largely beyond the control of larvae and which influence recruitment (Cury & Roy 1989) and larval survival (Peterman & Bradford 1987) may, therefore, exert their influence through their effects on feeding success. These effects could simultaneously increase (or decrease) both the density of prey and the frequency of contacts between larval fish and their
Prey. We conclude that increased attention to factors that
influence the small-scale temporal and spatial dynamics of interactions between larval fish and their prey would contribute meaningfully to the resolution of the oldest question in recruitment dynamics 'Does food abundance and its availability to larvae regulate year- class strength in fishes?'.
Acknowledgements. Earlier versions of this work were pre- sented at the 13th Annual Larval Fish Conference of the American Fishenes Society, Merida, Mexico, May 21-27, 1989, and at the Canadian Conference for Fisheries Research, Ottawa, Ontario, Canada Jan 3-4, 1990, we thank those colleagues who provided us with useful comments and cnti- cisms. We also thank John Anderson, Chris Chambers and Ken Frank for their constructive reviews of the manuscript. B.R.M. was supported by a Natural Sciences and Engineering Research Council post-graduate scholarship.
LITERATURE CITED
~ k s n e s , D. L , Magnesen, T. (1988). A population dynamics approach to the estimation of production of four calanoid copepods in Lindbspollene, western Norway. Mar. Ecol. Prog. Ser. 45: 57-68
~ k s n e s , D. L., Aure, J. Kaartvedt, S., Magnesen, T., Richard, J . (1989). Significance of advection for the carrying capacities of fjord populations. Mar. Ecol. Prog. Ser 50: 263-274
Anderson. J . T. (1988). A review of size dependent survival during pre-recruit stages of fishes in relation to recruit- ment. J. Northw. Atl. Fish. Sci. 8: 55-66
Arcos. D. F., Wilson. R. E. (1984). Upwelling and the distribu- tion of chlorophyll a within the Bay of Concepcion. Chile. Estuar. coast. Shelf Sci. 18: 25-35
Atkinson, L P, , O'Malley, P. G. , I'oder, J . A., Paffenhofer, G.
A. (1984). The effect of summertime shelf break upwelling on nutrient flux in southeastern United States continental shelf waters. J. mar Res. 42: 969-993
Bailey, K. M. (1982). The early life history of the Pacific hake Merluccius productus Fish. Bull. U.S. 80: 589-598
Bailey, K. M. , Batty, R. S. (1984). Laboratory study of predation by Aurelia aunta on larvae of cod, flounder, plaice and herring: development and vulnerability to capture, mar Biol. 83: 287-291
Bailey, K. M. , Stehr, C. L. (1986). Laboratory studies on the early life history of the walleye pollock, Theragra chalco- gramma (Pallas). J . exp. mar Biol. Ecol. 99: 233-246
Bailey, K. M., Houde, E. D. (1989). Predation on eggs and larvae of marine fishes and the recruitment problem. Adv. mar Biol. 25: 1-83
Bamstedt, U. (1986). Chemical composition and energy con- tent. In: Corner, E. D. S., O'Hara, S. C. M. (eds.) The biological chemistry of marine copepods. Oxford Univer- sity Press, Oxford, p. 1-58
Barahona-Fernandes, M. H , Conan, G. (1981). Daily food intake of reared larvae of the European seabass (Dicen- trarchus labrax L ) . Statistical analysis and modelling. Rapp. P-v. Reun. Cons int. Explor Mer 178: 41-44
Beers, J. R., Stewart, G. L. (1967). Micro-zooplankton in the euphotic zone at five locations across the California Current. J . Fish. Res. Bd Can. 24: 2053-2068
Beers, J . R., Stewart. G. L. (1969). Microzooplankton and its abundance relative to the larger zooplankton and other seston components. Mar. Biol. 4: 182-189
Benijts, F., van Voorden, E., Sorgeloos, P. (1975). Changes in the biochemical composition of the early larval stages of the brine shrimp, Arlernia salina L. In: Persoone, G.. Jas- pers, E. (eds.) Proc. 10th European Mar. Biol. Symp., Vol. 1 kfariculture. Universa Press, Wetteren, Belgium, p. 1-9
Blackburn, M., Nellen, W (1976). Distribution and ecology of pelagic fishes studied from eggs and larvae in an upwel- ling area off Spanish Sahara. Fish. Bull. U.S. 74: 885-896
Blaxter, J . H. S . (1988). Pattern and variety in development. In: Hoar, W. S., Randall, D. J (eds.) Fish physiology, Vol XI The physiology of developing fish, Part A: Eggs and lar- vae. Academic Press, New York, p . 1-58
Blaxter, J . H. S. . Ehrlich, K. F. (1914) Changes in behavlour during starvation of herring and plaice larvae. In: Blaxter, J . H. S. (ed.) The early life history of fish. Springer-Verlag, Berlin, p. 575-588
Boehlert, G. W., Yoklavich, M. M. (1984). Carbon assimilation as a function of ingestion rate in Pacific herring. Clupea harengus pallasi Valenclennes. J . exp. mar. Biol. Ecol. 79: 251-262
Buckley, L. J., Lough, R. G. (1987) Recent growth, biochemi- cal con~position, and prey field of larval haddock (Melanogrammus aeglefinus) and Atlantic cod (Gadus n~orhua) on Georges Bank Can. J . Fish. Aquat. Sci. 44: 14-25
Burkhill, P. H., Kendall, T. F. (1982). Producti.on of the copepod Eurytemora affinis in the Bristol Channel. Mar. Ecol. Prog. Ser 7: 21-31
Checkley, D. M. Jr (1982). Selective feeding by Atlantic her- ring (Clupea harengus) by larvae on zooplankton in natural assemblages. Mar Ecol. Prog. Ser. 9: 245-253
Checkley, D. M. J r (1984). Relation of growth to ingestion for larvae of Atlantic herring Clupea harengus and other fish. Mar. Ecol. Prog. Ser. 18: 215-224
Checkley, D. M. Jr, Raman, S.. Maillet, G. L., Mason, K. M. (1988). Winter storm effects on the spawning and larval drift of a pelagic fish. Nature, Lond. 335: 346-348
Chesney, E. J . Jr (1989). Estimating the food requirements of
222 Mar. Ecol. Prog. Ser. 67: 209-225, 1990
striped bass larvae Morone saxatilus: effects of light, tur- bidity, and turbulence. Mar Ecol. Prog. Ser. 53: 191-200
Cirobowski, J. J. H., Craig, D. A. (1989). Factors influencing dispersion of larval black flies (Diptera:Simuliidae): effects of current velocity and food concentration. Can. J . Fish. Aquat. Sci. 46: 1329-1341
Cote. B., Platt, T (1983). Day-to-day variations in the spring- summer photosynthetic parameters of coastal marine phy- toplankton Limnol. Oceanogr. 28: 320-344
Cury, P,, Roy, C. (1989). Optimal environmental window and pelagic fish recruitment success in upwelling areas. Can. J . Fish. Aquat. Sci. 46: 670-680
Dagg, M. J., Clarke, M. E., Nishiyama, T., Smith, S. L. (1984). Production and standing stock of copepod nauph, food items for larvae of the walleye pollock Theragra chalco- gramrna in the southeastern Bering Sea. Mar. Ecol Prog. Ser. 19: 7-16
Davis, C. S. (1984). Food concentrations on Georges Bank: nonlimiting effect on development and survival of labora- tory reared Pseudocalanus sp. and Paracalanus parvus (Copepoda, Calanoida). Mar. Biol. 82: 41-46
Deevey, G. B (1952) Quantity and composition of the zoo- plankton of Block Island Sound, 1949. Bull Bingham Oceanogr. Coll. 13: 120-164
DeLafontaine. Y., Leggett, W C. (1987). Effect of container size on estimates of mortality and predation rates in exper- iments with macrozooplankton and larval fish. Can. J. Fish. Aquat. Sci. 44: 1534-1543
DeLafontaine, Y., Leggett, W. C. (1989). Changes in size and weight of hydromedusae during formalin preservation. Bull. mar Sci. 44: 1129-1 137
Durbin, A, G., Durbin, E. G. (1981). Standing stock and esti- mated production rates of phytoplankton and zooplankton in Narragansett Bay, Rhode Island. Estuaries 4: 2 4 4 1
Ellertsen, B., Fossum, P., Solemdal, P., Sundby. S.. Tilseth, S. (1984). A case study on the distribution of cod larvae and availability of prey organisms in relation to physical pro- cesses in Lofoten. In: Dahl, E., Danielssen, D. S., Msks- ness, E . , Solemdal, P. (eds.) The propagation of cod Gadus rnorhua L. Arendal, Norway. Flodevigen rapportser. 1: 453-477
Evans, F. (1977). Seasonal density and production estimates of the commoner planktonic copepods of Northumberland coastal waters. Estuar. coast. mar. Sci. 5: 223-241
Fortier, L., Leggett, W. C. (1982). Fickian transport and the dispersal of fish larvae In estuaries. Can. J . Fish. Aquat Sci. 39: 1150-1163
Fortier, L., Hams, R. P. (1989). Optimal foraging and density- dependent competition in marine fish larvae. Mar. Ecol. Prog. Ser 51: 19-33
Foster, B. A., Battaerd, W. R. (1985). Distribution of zooplank- ton in a coastal upwelling in New Zealand. N.Z.Jl mar Freshwat. Res. 19. 213-226
Frank, K. T (1988). Independent distributions of fish larvae and their prey: natural paradox or sampling artifact. Can. J. Fish. Aquat. Sci. 45: 48-59
Frank, K. T., Leggett, W. C. (1982a). Coastal water mass replacement: its effect on zooplankton dynamics and the predatorprey complex associated with larval capelin (Mal- lotus villosus). Can. J. Fish. Aquat. Sci. 39: 991-1003
Frank, K. T., Leggett. W. C. (1982b). Environmental regulation of growth rate, efficiency, and swimming performance in larval capelin (Mallotus capelin), and its application to the match/mismatch hypothesis. Can. J. Fish. Aquat. Sci. 39: 691-699
Frank, K. T., Leggett, W C (1986). Effect of prey abundance and size on the growth and survival of larval fish: an
experimental study employing large volume enclosures. Mar. Ecol. Prog. Ser. 34: 11-22
Frank, K. T., Carscadden, J . E. (1989) Factors affecting recruitment variability of capelin (MaLlotus villosus) in the Northwest Atlantic. J. Cons. 45: 146-164
Fransz, H. G., Miguel, J. C., Gonzalez, S. R. (1984). Mesozoo- plankton composition, biomass and vertical hstribuhon, and copepod production in the stratified central North Sea. Neth. J. Sea Res. 18: 82-96
Gamble, J. C , Houde, E. D. (1984). Growth, mortality, and feeding of cod (Gadus rnorhua L.) larvae in enclosed water columns and in laboratory tanks. In: Dahl, E., Danielssen, D. S., E. Meksness, E., Solemdal, P. (eds.) The propagation of cod Gadus rnorhua L. Arendal, Norway. Flodevigen Rapportser. 1: 123-143
Gamble, J. C., MacLachlan, P., Seaton, D. D. (1985). Compara- tive growth and development of autumn and spring spawned Atlantic herring larvae in large enclosed eco- systems. Mar. Ecol. Prog. Ser. 26: 19-33
Garrett, C. J . R. , Loucks, R. H. (1976). Upwelllng along the Yarmouth shore of Nova Scotia. J. Fish. Res. Bd Can. 33: 116-117
Gauld, D. T. (1959). Swimming and feeding in crustacean larvae: the nauplius larva. Proc. 2001. Soc. Lond. 132: 31-50
GiguQre, L. A , Cote, B., St-Pierre, J.-F. (1988). Metabolic rates scale isometrically in larval fishes. Mar. Ecol. Prog. Ser. 50: 13-19
Giguere, L. A., St. Pierre, J.-F., Bemier, B., Vezina, A., Ron- deau, J.-G (1989). Can we estimate the true weight of zooplankton samples after chemical preservation? Can. J. Fish. Aquat. Sci. 46: 522-527
Govoni, J . J . , Peters, D. S., Merriner, J . V. (1982). Carbon assimilation during larval development of the marine tele- ost Leiostomusxanthurus Lacepede. J. exp. mar. Biol. Ecol. 64: 287-299
Hargrave, B. T., Hard~ng, G. C., Drinkwater, K. F., Lambert, T C., Harrison, W. G. (1985). Dynamics of the pelagic food web in St Georges Bay, southern Gulf of St. Lawrence. Mar. Ecol. Prog. Ser. 20: 221-240
Hay. D. E. (1981). Effects of capture and fixation on gut contents and body size of Pacific herring larvae. Rapp. P.- v Reun. Cons. Int. Explor. Mer 178: 395-400
Hay. D. E. (1984). Weight loss and change of con&tion factor during fixation of Pacific herring, Clupea harengus pallasi, eggs and larvae. J . Fish. Biol. 25: 421-433
Heath, M. R., Henderson, E. W., Baird, D. L. (1988). Vertical distribution of herring larvae in relation to physical mixing and illumination. Mar. Ecol. Rog. Ser. 47: 21 1-228
Heinle, D. R (1966). Production of a calanoid copepod, Acartia tonsa in the Patuxent hver estuary. Chesapeake Sci. 7: 59-74
Heinle, D. R., Flemer, D. A. (1975). Carbon requirements of a population of the estuarine copepod Euryfernora affinis. Mar Biol. 31: 235-247
Holllgan, P. M., Harris, R. P , Newell, R. C., Harbour, D. S., Head, R. N., h l e y , E. A. S., Lucas, M. I. Tranter. P. R. G., Weekley. C. M. (1984). Vertical distribution and partition- ing of organic carbon in mixed, frontal and stratified waters of the English Channel. Mar. Ecol. Prog. Ser. 14: 11 1-127
Holling, C. S. (1959). The components of predation as revealed by a study of small mammal predation of the European Pine Sawfly. Can. Entom. 91: 293-320
Hopkins. T L. (1977). Zooplankton distribution in surface waters of Tampa Bay, Flonda. Bull. mar. Sci. 27: 467-478
Houde, E. D. (1977). Effects of stocking density and food

MacKenzie et. al.: Estimahng larval fish ingestion rates 223
density on survival, growth, and yleld of laboratory-reared larvae of red sea bream, Archosargus rhomboidalis (L.) (Sparidae). J. Fish Biol. 7: 115-127
Houde, E. D. (1978). Critical food concentrations for larvae of three species of subtropical marine fishes. Bull. mar. Sci. 28: 395-411
Houde, E. D. (1989). Comparative growth, mortality and energetics of marine fish larvae: temperature and implied latitudinal effects. Fish. Bull. U.S. 87: 471-496
Houde, E. D., Schekter, R. C. (1980). Feeding by marine fish larvae: developn~ental and functional responses. Environ Biol. fish. 5: 315-334
Houde, E. D., Schekter, R. C. (1981). Growth rates, rations, and cohort consumption of marine fish larvae in relation to prey concentrations. Rapp. P-v. Reun. Cons. int. Explor. Mer 178: 441-453
Houde, E. D., Schekter, R. C. (1983). Oxygen uptake and comparative energetics among eggs and larvae of three subtropical marine fishes. Mar. Biol. 72: 283-293
Hunter, J. R. (1981). Feeding ecology and predation of marine larvae. In: Lasker. R. (ed.) Marine fish larvae: morphology. ecology and relation to fisheries. Univ. of Washington Press, Seattle, p. 34-77
Hunter, J. R., Thomas. G. L. (1974). Effect of prey distribution and density on the searchin and feeding behaviour of larval anchovy Engraulis mordax. In: Blaxter, J. H. S. (ed.) The early life history of fish. Springer-Verlag Berlin, p. 559-574
Hunter, J. R., Kimbrell, C. A. (1980). Early life hlstory of Pacific mackerel, Scomber japonicus. Fish. Bull. U.S. 78: 89-101
Ivlev, V. S. (1961). Experimental ecology of the feeding of fishes. Yale University Press. New Haven
James, M. R., Wilkinson, V. H. (1988). Biomass, carbon inges- tion, and ammonia excretion by zooplankton associated with an u p w e h g plume in western Cook Strait, New Zealand. N. Z. J. mar. Freshwat. Res. 22: 249-257
James, A. G., Findlay, K. P. (1989). Effect of particle size and concentrations on feeding behaviour, selectivity and rates of food ingestion by the Cape anchovy Engraulis capensis. Mar. Ecol. Prog. Ser. 30: 275-294
Jenkins, G. P. (1987) Comparative diets, prey selection, and predatory impact of CO-occumng larvae of two flounder species. J. exp. mar. Biol. Ecol. 110: 147-170
Jenluns, G. P. (1988) Micro- and fine-scale distribution of microplankton in the feeding environment of larval floun- der. Mar. Ecol. Prog. Ser. 43: 233-244
Kahru, M,, Elken, J., Kotta, I., Simm, M,, Vilbaste, K. (1984). Plankton hstributions and processes across a front in the open Baltic Sea. Mar. Ecol. Prog. Ser. 20: 101-111
Kiorboe, T., Johansen, K. (1986). Studies of a larval herring (Clupea harengus L.) patch in the Buchan area. IV. Zoo- plankton distribution and productivity in relation to hydro- graphic features. Dana 6: 37-51
Kierboe, T., Munk, P. (1986). Feeding and growth of larval herring, Clupea harengus, in relation to density of copepod nauphi. Environ. Biol. Fish. 17: 133-139
Kiorboe, T., Munk, P., Richardson, K. (1987). Respiration and growth of larval herring Clupea harengus: relatlon between specific dynamic action and growth efficiency. Mar. Ecol. Prog. Ser. 40: 1-10
Kiorboe, T., Munk, P., hchardson, K., Christensen, V.. Paulsen, H. (1988). Plankton dynamics and larval herring growth, drift and survival in a frontal area. Mar. Ecol. Prog. Ser. 44: 205-219
Klumpp, D. W., von Westemhagen, H. (1986). Nitrogen balance in marine fish larvae: influence of developmental stage and prey density. Mar. Biol. 93: 189-199
Kuronuma. K., Fukusho, K. (1984). Rearing of marine fish larvae in Japan. International Development Research Centre, Ottawa, Ontario. Canada. IDRC-TS47e p. 1-109
Lasker, R. (1975). Field criteria for the survival of anchovy larvae: the relation between inshore chlorophyll maximum layers and successful first feeding. Fish. Bull. U.S. 73: 453462
Laurence, G. C. (1972). Comparative swimming abilities of fed and starved larval largemouth bass (Micropterus sal- moides). J. Fish. Biol. 4: 73-78
Leak. J . C. , Houde, E. D. (1987). Cohort growth and survival of bay anchovy Anchoa mitchillj in Biscayne Bay, Florida. Mar. Ecol. Prog. Ser. 37: 109-122
LeBorgne, R., Blanchot, J., Charpy. L. (1989). Zooplankton of Tikehau atoll (Tuamotu archipelago) and its relationship to particulate matter. Mar. Biol. 102: 341-353
Leggett, W. C. (1986). The dependence of fish larval survival on food and predator densities. In: Skreslet, S. (ed.) NATO AS1 Series Vol. G7: The role of freshwater outflow in coastal marine ecosystems. Springer-Verlag, Berlin, p. 117-137
Lohrenz, S. E., Arnone, R. A., Wiesenburg, D. A. , DePalma, I. P. (1988). Satellite detection of transient enhanced primary production in the western Mediterranean Sea. Nature, Lond. 335: 245-247
Lonsdale, D. J., Coull, B. C. (1977). Composition and seasonal- ity of zooplankton of North Inlet, South Carolina. Chesapeake Sci. 18: 272-283
MacCauley, E. (1984). The estimation of the abundance and biomass of zooplankton in samples. In: Downing. J. A., Rigler, F. H. (eds.) A manual on methods for the assess- ment of secondary productivity in fresh waters, 2nd edn. Blackwell Scientific Publications, Oxford. p. 228-265
MacKenzie, A. L., Gillespie, P. A. (1986). Plankton ecology and productivity, nutrient chemistry, and hydrography of Tasman Bay, New Zealand, 1982-1984. N. Z. J1 mar. Fresh- wat. Res. 20: 365-395
Martens, P. (1980). Contributions to the mesozooplankton of the northern Wadden Sea of Sylt. Helgolander wiss. Meeres. 34: 41-53
McGurk, M. D. (1986). Natural mortality of marine pelagic fish eggs and larvae: role of spatial patchiness. Mar. Ecol. Prog. Ser 34: 227-242
McLaren, I. A. (1963). Effects of temperature on growth of zooplankton and the adaptive value of vertical migration. J. Fish. Res. Bd Can. 20: 685-727
McLaren, I. A., Tremblay, M. J., Corkett, C. J., Roff, J. C. (1989). Copepod production on the Scotian Shelf based on lifehistory analyses and laboratory rearings. Can. J . Fish. Aquat. Sci. 46: 560-583
Middlebrook, K., Roff, J. C. (1986). Comparison of methods for estimating annual productivity of the copepods Acartia hudsonica and Euryten~ora herdmani in Passamaquoddy Bay, New Brunswick. Can. J . Fish. Aquat. Sci. 43: 656-664
Miller, T. J . , Crowder, L. B., Rice, J. A. , Marschall, E. A. (1988). Larval size and recruitment mechanisms in fishes: toward a conceptual framework. Can. J. Fish. Aquat. Sci. 45: 1657-1670
M~ksness , E. (1982). Food uptake. growth and survival of capelin larvae (Mallotus villosus Muller) in an outdoor constructed basin. Fisk. Dir. Skr HavUnders. l?: 263-285
Monteleone, D. M., Peterson, W. T. (1986). Feeding ecology of American sand lance Ammodytes americanus larvae from Long Island Sound. Mar. Ecol. Prog. Ser. 30: 133-143
Morin, A., Peters, R. H. (1988). Effect of microhabitat features, seston quality, and periphyton on abundance of ovenvin-

224 Mar. Ecol Prog. Ser
tering black fly larvae in southern Quebec. Limnol. Oceanogr. 33: 431446
Mullin, M. M.. Brooks, E. R., Reid, F. M. H., Napp, J. & Stewart, E. F. (1985). Vertical structure of nearshore plank- ton off southern California: a storm and a larval fish food web. Fish. Bull. U.S. 83: 151-170
Munk, P, , Kierboe, T (1985). Feeding behaviour and swirn- ming activlty of larval herring (Clupea harengus) in rela- tion to density of copepod nauplii. Mar. Ecol. Prog. Ser. 24: 15-2 1
Munk, P,, Chnstensen, V . , Paulsen, H. (1986). Studies of a l a n ~ a l herring (Clupea harengus L.) patch in the Buchan area. 11. Growth, mortality and drift of larvae. Dana 6: 11-24
Munk. P,, Kiorboe, T., Christensen, V (1989). Vertical migra- tions of herring (Clupea harengus) larvae in relation to light and prey distnbutions. Environ. Biol. Fish. 26: 87-96
Oiestad, V. (1985). Predation on fish larvae as a regulatory force, illustrated in mesocosm studies with large groups of larvae. NAFO Sci. Coun. Stud. 8. 25-32
Oppenheimer, C. H., Moreira, G. S. (1980). Carbon, nitrogen and phosphorus content in the developmental stages of the bnne shnmp Artemia. In: Persoone, G., Sorgeloos, P,, Roels, O., Jaspers, E. (eds.) The brine shrimp Artemia, Vol. 2, Physiology, biochemistry, molecular biology. Universa Press. Wettern, Belgium, p . 609-612
Owen, R. W. (1989). Microscale and finescale variations of small plankton in coastal and pelagic environments. J. mar. Res. 47: 191-240
Paffenhofer, G. A. (1980). Zooplankton distributions as related to summer hydrographic conditions in Onslow Bay, North Carolina. Bull. mar. Sci. 30: 819-832
Paloheimo, J. E., Dickie, L. M. (1966). Food and growth of fishes 11. Effects of food and temperature on the relation between metabolism and body size. J. Fish. Res. Bd Can. 23: 869-908
Paranjape, M. A (1988). Microzooplankton in Lancaster Sound (eastern Canadlan Arctic) in summer: b~omass and distribution. Deep Sea Res. 35: 1547-1563
Paranjape, M. A., Conover, R. J . , Harding, G. C., Prouse, N. J . (1985). Micro- and macrozooplankton on the Nova Scotian Shelf in the prespring bloom period: a comparison of their potential resource utilization. Can. J. Fish. Aquat. Sci. 42: 1484-1492
Peterman, R. M., Bradford, M. J. (1987). Wind speed and mortality rate of a marine fish, the northern anchovy (Engrauhs mordax). Science 235: 354-356
Peters. R. H. (1983). The ecological implications of body size. Cambndge University Press, New York
Peters, R. H.. Downing, J. A. (1984). Empirical analys~s of zooplankton filtering and feeding rates. Limnol. Oceanogr. 29 763-784
Peterson, W T., Miller, C. B., Hutchinson, A. (1979). Zonahon and maintenance of copepod populations in the Oregon upwelling zone. Deep Sea Res 26: 467494
Peterson, W T., Ausubel, S. J . (1984). Diets and selective feeding by larvae of Atlantic mackerel Scomber scombrus on zooplankton. Mar Ecol. Prog Ser 17: 65-75
Prosser. C. L. (1973). Comparative animal physiology. 3rd edn. Saunders. Philadelphia
hchardson, K . , Heath, M . R., Pihl, N. J (1986). Studies of a larval herring (Clupea harengus L.) patch in the Buchan area. I The distribution of larvae in relation to hydro- graphic features Dana 6: 1-10
Rombough, P. J. (1988). Respiratory gas exchange, aerobic metabolism, and effects of hypoxia during early life. In: Hoar, W S., Randall, D. J . (eds.) Fish physiology, Vol. XI,
The physiology of developing fish, Part A: eggs and larvae. Academic Press, San Diego, p. 59-161
Rosenthal, H., Hempel, G. (1970). Experimental studies m feeding and food requirements of herring larvae (Clupea harengus L.) In: Steele, J. H. (ed.) Marine food chains. Oliver and Boyd, Edinburgh. p. 344-364
Rothschild, B. J . , Osborn, T R. (1988). Small-scale turbulence and plankton contact rates. J . Plankton Res. 10: 465-474
SAS Institute Inc. (1985a). SAS/STAT guide for personal com- puters, Version 6 Edition. Cary, North Carolina
SAS Institute Inc. (1985b). SAS User's Guide: Statistics, Ver- sion 5 Edition. Cary, North Carolina. Procedure NLIN, p. 575-606
Sinclair, M. (1988). Marine populations: an essay on popula- tion regulation and speciation. Washington Sea Grant Pro- gram. University of Washington Press, Seattle
Srnetacek, V. (1981). The annual cycle of protozooplankton in the ffiel Bight. Mar. Biol. 63: 1-11
Smith, S. L., Brink, K. H., Santander. H. Cowles, T. J. Huyer, A. (1981). The effect of advection on variations in zoo- plankton at a single location near Cabo Nazca. Peru. In: kchards, F. A. (ed.) Coastal & estuarine sciences I: coastal upwelling. American Geophysical Union, Washington, D.C., p. 400410
Stepien. W. P.. J r (1976). Feeding of laboratory-reared larvae of the sea bream Archosargus rhomboidaljs (Sparidae). Mar. Biol. 38: 1-16.
Taggart, C. T., Leggett, W C. (1987). Short-term mortality in post-emergent larval capelin Mallotus villosus 11. Import- ance of food and predator density, and density-independ- ence. Mar. Ecol. Prog. Ser. 41: 219-229
Takahashi, M., Ishizaka, J., Ishimaru, T. , Atkinson, L P,, Lee, T. N., Yamaguchi, Y., Fujita, Y., Ichimura, S. (1986). Tem- poral change in nutrient concentrations and phytoplank- ton biomass in short time scale local upwelling around the Izu Peninsula, Japan. J. Plankton Res. 8: 1039-1049
Thayer, G. W , Hoss. D. E., Kjelson. M. A , Hettler Jr., W F., Lacroix, M W. (1974). Biomass of zooplankton in the Newport River Estuary and the influence of postlarval fishes. Chesapeake Sci. 15: 9-16
Theilacker, G. (1987). Feeding ecology and growth energetics of larval northern anchovy, Engraulis m o r d a . Fish. Bull. U.S 85: 213-228
Thellacker, G., Dorsey, K. (1980). Larval fish diversity, a sum- mary of laboratory and field research. In: Sharp. G. D. (ed.) Workshop on the effects of environmental variation on the survival of larval pelagic fishes. Intergovernmental Oceanographic Commission Workshop Report No. 28. UNESCO, FAO. Rome, p 106-141
Theilacker, G. H., ~McMaster, M. F. (1971). mass culture of the rotifer Brachionusplicatilus and its evaluation as a food for larval anchovies Mar Biol. 10: 183-188
Thresher, R. E.. Harris. G. P,, Gunn, S.. Clementsen, L. A. (1989). Phytoplankton production pulses and episodic sett- lement of a temperate marine fish. Nature, Lond. 341: 64 1-643
Tilseth. S., EUertsen. B. (1984). Food consumpt~on rate and gut evacuation processes of first feeding cod larvae (Gadus morhua L.). In: Dahl, E., Danielssen, D. S., Moksness. E., Solemdal. P. (eds.) The propagation of cod Gadus morhua L. Arendal, Norway. Flodevigen rapportser. 1. 167-183
Tont. S. A. (1981). Temporal variations in diatom abundance off Southern California in relation to surface temperature, alr temperature and sea level. J mar. Res. 39. 191-207
Tucker Jr., J . (1989). Energy utilization in bay anchovy Anchoa rnitchilli and black sea bass Centropristis striata eggs and larvae. Fish. Bull. U.S. 87: 279-295
MacKenzie et. al.: Estimating larval fish ingestion rates 225
Vidal, J. , Smith, S. L. (1986). Biomass, growth and develop- ment of herbivorous zooplankton in the Southeast Bering Sea during spring. Deep Sea Res. 33A: 523-556
Vladimirov, V. 1. (1975). Critical periods in the development of fishes. J. Ichthyol. 15: 851-869
von Westernhagen, H., Rosenthal, H. (1979). Laboratory and insitu studies on larval development and swimming per- formance of Pacific herring Clupea harengus pallasi Hel- golander wiss. Meeresunters. 32: 539-549
Vu, T. T (1983). A histoenzymological study of protease activities in the digestive tract of larvae and adults of sea bass, Dicentrarchus labrax L. Aquaculture 32: 57-69
Walline, P. (1987). Growth and ingestion rates of larval fish populations in the coastal waters of Israel. J. Plankton Res. 9: 91-102
Ware, D. M. (1975). Growth, metabolism and optimal swim- mlng speed of pelagic fish. J. Fish. Res. Bd Can. 32: 33-4 1
Werner, R. G., Blaxter, J. H. S. (1981). The effect of prey density on mortality, growth, and food consumption in larval herring (Clupea harengus L.). Rapp. P.-v. RBun. Cons. int. Explor. Mer 178: 405408
This article was submitted to the editor
Whitledge, T E. (1981). Nitrogen recycling and biological populations in upwelling ecosystems. In: Richards, F. A. (ed.) Coastal and estuarine sciences I: coastal upwelling. American Geophysical Union. Washington, D.C., p. 257-273
Wilkinson, L. (1988). SYSTAT: The system for statistics. SYS- TAT, Inc. Evanston, Illinois
Winberg, G. G. (1956). Nauchnye Trudy Belorusskogo Gosudarstvennogo Universiteta imeni V. I. Lenina, Minsk. (Rate of metabolism and food requirements of fishes. Fish. Res. Bd. Canada, Trans. Ser No. 433)
Wroblewski, J S., Richmann, J. G. (1987). The nonlinear response of plankton to wind mixing events - implications for survival of larval northern anchovy. J. Plankton Res. 9: 103-123
Yin, M. C., Blaxter, J. H. S. (1987). Escape speeds of marine fish larvae during early development and starvation. Mar. Biol. 96: 459-468
Zar. J. H. (1974). Biostatistical analysis. Prentice-Hall, Englewood Cliffs, New Jersey
Manuscript first received: April 3, 1990 Revised version accepted: August 6, 1990