estimating missing temporal attributes in genealogical data
TRANSCRIPT

Estimating Missing Temporal Attributes In Genealogical Data
Nam Wook Kim Stanford Visualization Group
Stanford University [email protected]
ABSTRACT We present a machine learning approach for estimating missing temporal attributes in genealogical data. Geneal-ogy analyses have been commonly focused on understand-ing generational relations. The importance of temporal analyses has often been suppresed in genealogical research. We have observed that temporal attributes of an individual, birth, death, marriage and divorce dates, are frequently missing in genealogical data. Filling out those attributes allows users to reconstruct temporal streams of their family stories, which in turn make fruitful genealogy analyses possible. Keywords: Machine Learning, Visualization, Genealogy, Missing data
INTRODUCTION Genealogy is an incredibly popular activity pursued by millions of people spanning from hobbyist genealogists to professional genealogy researchers. Genealogical research involves understanding not only not only where and when people lived, but also their life styles and biographies. In addition, it often requires, or leads to, diverse knowledge of religion histories, migration trends, political and historical social conditions and genetics. Complex nature of geneal-ogy leveraging diverse fields lends itself to a challenging problem as well as incredibly useful for enriching commu-nity. Correctly identifying individuals and their relationships are the most important part of genealogical research. To keep track of their findings, people often use typical genea-logical graphs such as pedigree charts and descendent charts. Such existing graphs are limited in showing only generational relations. We have previously developed a new visualization for genealogical data (Figure 1). It is designed to reveal other useful aspects of the data with focus on temporal information. It requires temporal attrib-utes, birth, death, marriage and divorce dates, to be visual-ized. Not only enabling efficient temporal analysis in fam-ily history, it also provides a way to identify non-hierarchical patterns such as divorce, re-marriage and in-termarriage. A commonly faced problem in producing the visualiza-tion is that required temporal attributes are frequently miss-ing. Filling out missing attributes will allow users to recon-struct temporal streams of their family stories through visu-
alizations, which in turn make fruitful genealogy analyses possible. In addition, missing temporal attributes are important in larger genealogy context as well. For example, genealogists often run into the ambiguity problem when identifying an individual in ancestry. Two possible sources for the ambi-guity come from geographic location and temporal records. If it were possible to estimate dates, genealogists would be able to gain insight figuring out who is likely to be their ancestors and their temporal relationships. In this paper, we present a machine learning based ap-proach for estimating missing temporal attributes in genea-logical data. We have used Freebase web service to extract genealogical data. Features are constructed based on evi-dences from non-missing attributes. Support vector regres-sion is then used to estimate missing temporal attributes. At final stage, estimated attributes are fed into the visualiza-tion system. The visualization put visual makers to indicate the presence of estimated attributes, or missing attributes.
RELATED WORK Many researchers in different fields such as statistics have faced missing data problems. Yumei at el [1] introduced a support vector regression (SVR) based approach to filling in missing values. To do it, they set the decision attribute (output attribute) as the condition attribute (input attribute) and the condition attribute as the decision attribute. SVM regression is then executed to predict the condition attrib-ute values. They compared results with different methods not using machine learning techniques, including the mean and median of all the values of the same class. They then showed that SVR approach outperformed than the others.
Figure 1: Temporal Visualization of Genealogy: converging and diverging lines indicate marriage and divorce respectively. Parent-child relationship is signified by a gray drop line

Feng at el [2] also presented a SVR based imputing method utilizing orthogonal coding scheme to estimate missing values for DNA microarray gene expression data. A com-parative study of their method with the previously devel-oped methods such as K nearest neighbor and Bayesian principal component analysis impute method demonstrated that the SVR method has powerful estimation ability. Drizd at el [3] addressed importance of properly handling missing and uncertain data in visualizations. They observed that missing data sometimes causes misinterpretation. With between-subject graph interpretation study, they concluded that correctly identifying missing data and indicating the presence of them are necessary.
METHODS In this section, we describe overall procedure of our sys-tem. We do this by dividing the system into five different stages, data extraction, feature set construction, support vector regression, data estimation and visualization.
Data Extraction We build a web interface that extracts genealogical data from Freebase web service (Figure 2). A user can specify four parameters, filename, start date, end date and maxi-mum size. Person entries whose lifespans are within the bound, from the start date to the end date are extracted up to the specified maximum size. To avoid script time limit, multiple queries are sent to Freebase in sequence and then results are concatenated into a single array.
Feature Set Construction To construct feature sets, we make use of strong relations among temporal attributes. In other words, each attribute plays a pivotal role in estimating another attribute. For ex-ample, marriage dates can be inferred from birth dates of children and vice versa. We summarized how we use rele-vant information contained in other attributes to create fea-tures (Table 1).
Attribute Relevant Information Birth date Sibling’s birth date, parents’
marriage date, spouse’s birth date, child’s birth date...
Death Date Sibling’s death date, par-ents’ marriage date, spouse’s death date…
Marriage Date birth date, death date, oldest child’s birth date, spouse’s birth and death dates…
Divorce Date birth date, death date, youngest child’s birth date, spouse’s birth and death dates …
Table 1 A subset of features for each attribute is shown. For example, for birth date, we can further use attributes, other than the ones given, such as siblings’ death dates or parent’s divorce date and so on and so forth.
There are a number of constraints in relationships be-tween different attributes. For example, child’s birth date cannot be after mother’s death or parents’ marriage date cannot be after child’s birth unless it’s the child out of wedlock. Another extreme case is father’s birth date is after child’s birth date. In our system, however, we do not en-
force these constraints. Once feature attributes of individuals are extracted, we normalize attributes with respect to a reference date. For example, let say we have a feature tuple (sibling’s birth date (SBB), parents’ marriage date (PM), spouse’s birth date (SPB), child’s birth date (CB) and we normalize it with respect to parents’ marriage date. It then becomes (SBB-PM, SPB-PM, CB-PM). Every example in the fea-ture set is normalized in such way. Accordingly, the nor-malization process reduces the dimension of the feature set by one. A primary reason for this normalization is that range of dates can be very large possibly spanning from -9999 to 2009. This requires huge amount of data for train-ing sets. There are two problems when constructing a feature set, missing features and outliers. It is observed that features are frequently missing either because of the incompleteness or nonexistence (i.e. missing records for siblings or non-existence of siblings). For either case, we use the mean of existing values to fill in the missing feature value. If the reference date is missing, we simply discard the example. The missing feature problem occurs again at the data esti-mation stage, which in turn requires constructing more than one feature set for each attribute with different reference dates. In addition, after constructing the normalized fea-ture set, we detect and remove outliers. For example, it may not make sense that difference between child’s birth
Figure 2: Web Interface for genealogy data extrac-tion
date and parents’ marriage is greater than 100 years, so we remove the example. Aside from the aforementioned prob-lems, if there are more than one sibling, we use the mean of siblings’ birth dates. We do same thing for similar attrib-utes such as spouses’ birth dates, in case multiple spouses exist.
Support Vector Regression After the feature set is constructed, we divide it into train-ing set and test set (70% and 30%). We then use epsilon-support vector regression to learn parameters from the training set:
2 *
1
*
*
1minimize ( )2
,subject to ,
, 0
l
i ii
i i i
i i i
i i
w C
y w x bw x b y
ξ ξ
ε ξε ξ
ξ ξ
=
+ +
− < > − ≤ +< > + − ≤ +
≥
∑
We used fixed value 0.1 for epsilon and did 10-fold cross-validation test on the training set to determine the regulari-zation parameter C.
Data Estimation At this stage, we run into the same missing feature prob-lem presented at the feature set construction stage. We briefly describe how this problem enforces construction of feature sets using different reference dates. Let’s assume that we are estimating missing birth dates and have a nor-malized feature set with respect to parents’ marriage date.
After the parameter w is learned using the support vector regression, we now estimate person A’s birth date in real time. If A has no parents’ marriage date available, we can-not proceed. If A has sibling’s birth date and the feature set was nor-malized with respect to it, we could perform the estimation of A’s birth date. This informs us that we need to learn more than one parameter w from feature sets that are nor-malized with respect to different reference dates.
Visualization Estimated attributes are then used to generate a temporal visualization of genealogical data. We place visual markers to indicate the presence of missing attributes.
RESULTS AND DISCUSSION In this section, we present results on estimating birth dates. Estimating other attributes will be similarly done. To measure the performance, we use the normalized root mean square error (NRMSE) defined as follows:
2[( ) ]variance[ ]
guess answer
answer
mean y yNRMSE
y−
=
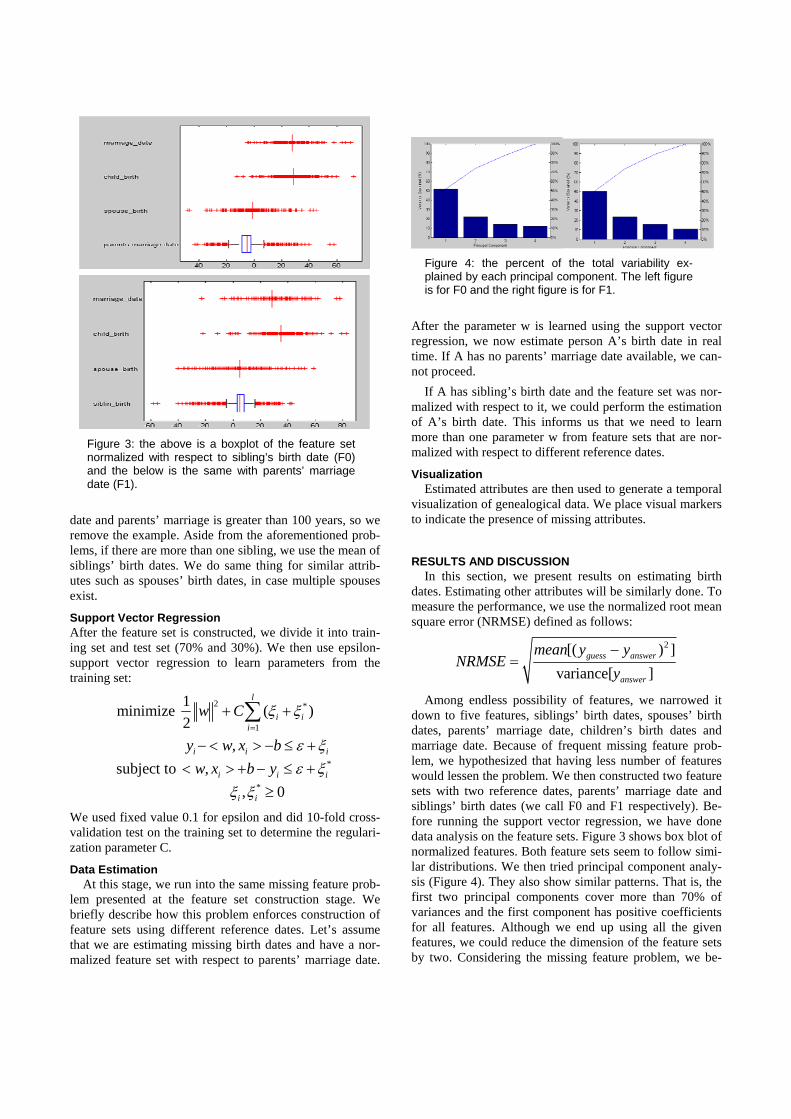
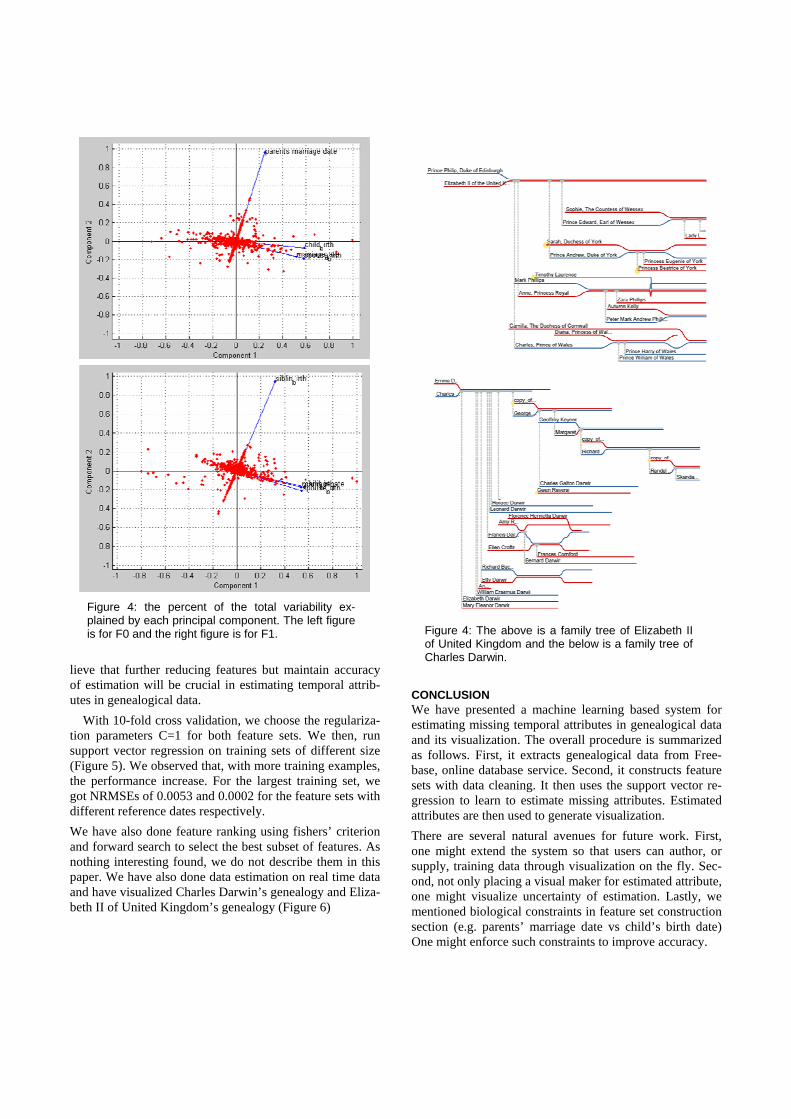
Among endless possibility of features, we narrowed it down to five features, siblings’ birth dates, spouses’ birth dates, parents’ marriage date, children’s birth dates and marriage date. Because of frequent missing feature prob-lem, we hypothesized that having less number of features would lessen the problem. We then constructed two feature sets with two reference dates, parents’ marriage date and siblings’ birth dates (we call F0 and F1 respectively). Be-fore running the support vector regression, we have done data analysis on the feature sets. Figure 3 shows box blot of normalized features. Both feature sets seem to follow simi-lar distributions. We then tried principal component analy-sis (Figure 4). They also show similar patterns. That is, the first two principal components cover more than 70% of variances and the first component has positive coefficients for all features. Although we end up using all the given features, we could reduce the dimension of the feature sets by two. Considering the missing feature problem, we be-
Figure 3: the above is a boxplot of the feature set normalized with respect to sibling’s birth date (F0) and the below is the same with parents’ marriage date (F1).
Figure 4: the percent of the total variability ex-plained by each principal component. The left figure is for F0 and the right figure is for F1.
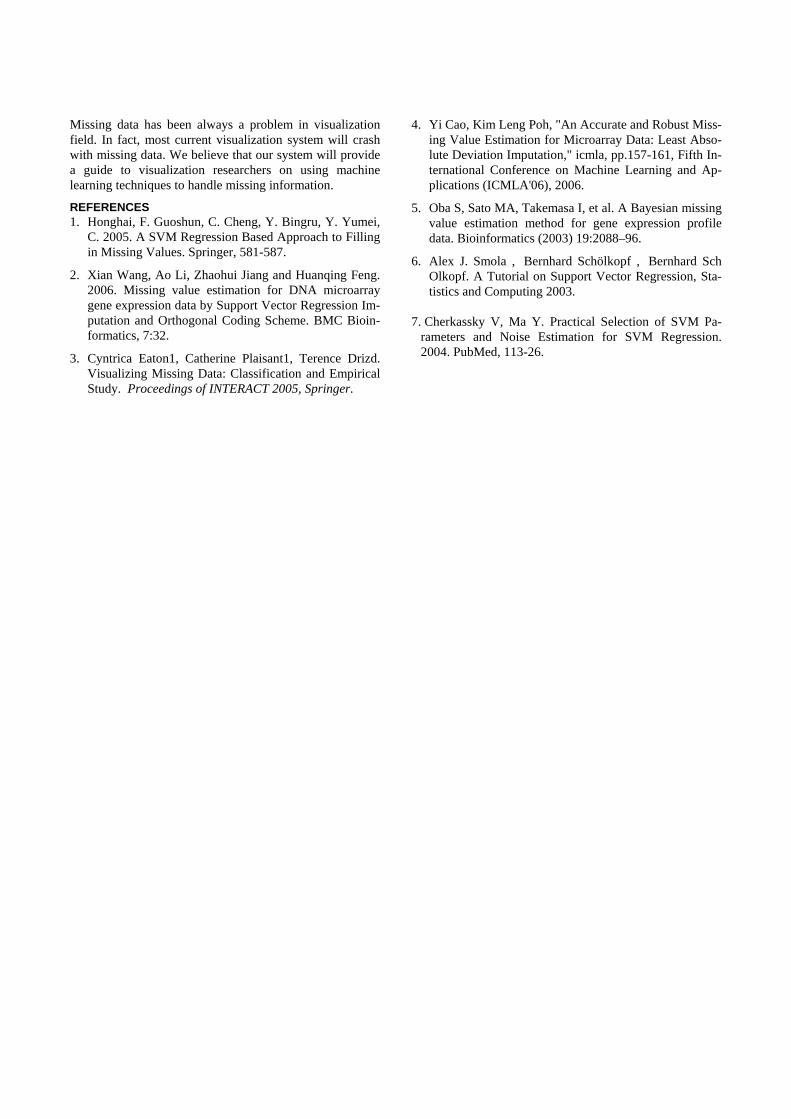
lieve that further reducing features but maintain accuracy of estimation will be crucial in estimating temporal attrib-utes in genealogical data. With 10-fold cross validation, we choose the regulariza-tion parameters C=1 for both feature sets. We then, run support vector regression on training sets of different size (Figure 5). We observed that, with more training examples, the performance increase. For the largest training set, we got NRMSEs of 0.0053 and 0.0002 for the feature sets with different reference dates respectively. We have also done feature ranking using fishers’ criterion and forward search to select the best subset of features. As nothing interesting found, we do not describe them in this paper. We have also done data estimation on real time data and have visualized Charles Darwin’s genealogy and Eliza-beth II of United Kingdom’s genealogy (Figure 6)
CONCLUSION We have presented a machine learning based system for estimating missing temporal attributes in genealogical data and its visualization. The overall procedure is summarized as follows. First, it extracts genealogical data from Free-base, online database service. Second, it constructs feature sets with data cleaning. It then uses the support vector re-gression to learn to estimate missing attributes. Estimated attributes are then used to generate visualization. There are several natural avenues for future work. First, one might extend the system so that users can author, or supply, training data through visualization on the fly. Sec-ond, not only placing a visual maker for estimated attribute, one might visualize uncertainty of estimation. Lastly, we mentioned biological constraints in feature set construction section (e.g. parents’ marriage date vs child’s birth date) One might enforce such constraints to improve accuracy.
Figure 4: the percent of the total variability ex-plained by each principal component. The left figure is for F0 and the right figure is for F1.
Figure 4: The above is a family tree of Elizabeth II of United Kingdom and the below is a family tree of Charles Darwin.
Missing data has been always a problem in visualization field. In fact, most current visualization system will crash with missing data. We believe that our system will provide a guide to visualization researchers on using machine learning techniques to handle missing information.
REFERENCES 1. Honghai, F. Guoshun, C. Cheng, Y. Bingru, Y. Yumei,
C. 2005. A SVM Regression Based Approach to Filling in Missing Values. Springer, 581-587.
2. Xian Wang, Ao Li, Zhaohui Jiang and Huanqing Feng. 2006. Missing value estimation for DNA microarray gene expression data by Support Vector Regression Im-putation and Orthogonal Coding Scheme. BMC Bioin-formatics, 7:32.
3. Cyntrica Eaton1, Catherine Plaisant1, Terence Drizd. Visualizing Missing Data: Classification and Empirical Study. Proceedings of INTERACT 2005, Springer.
4. Yi Cao, Kim Leng Poh, "An Accurate and Robust Miss-ing Value Estimation for Microarray Data: Least Abso-lute Deviation Imputation," icmla, pp.157-161, Fifth In-ternational Conference on Machine Learning and Ap-plications (ICMLA'06), 2006.
5. Oba S, Sato MA, Takemasa I, et al. A Bayesian missing value estimation method for gene expression profile data. Bioinformatics (2003) 19:2088–96.
6. Alex J. Smola , Bernhard Schölkopf , Bernhard Sch Olkopf. A Tutorial on Support Vector Regression, Sta-tistics and Computing 2003.
7. Cherkassky V, Ma Y. Practical Selection of SVM Pa-
rameters and Noise Estimation for SVM Regression. 2004. PubMed, 113-26.