estimating quantities and types of food waste at the …
TRANSCRIPT
OCTOBER 2017 R-17-09-B
AUTHOR Darby Hoover, Natural Resources Defense CouncilLEAD RESEARCHER Laura Moreno
ESTIMATING QUANTITIES AND TYPES OF FOOD WASTE AT THE CITY LEVEL: TECHNICAL APPENDICES
NRDC: Estimating Quantities and Types of Food Waste at the City Level - Technical Appendices (PDF)

Page 2 ESTIMATING QUANTITIES AND TYPES OF FOOD WASTE AT THE CITY LEVEL: TECHNICAL APPENDICES NRDC
Table of Contents
Appendix A: Conformance with Food Loss and Waste Standard—Residential .......................................................3
Appendix B: Conformance with FLW Standard—Industrial, Commercial, Institutional (ICI) .............................. 12
Appendix C: Baseline Assessment Field Methodology ...........................................................................................22
Appendix D: Kitchen Diary Background for Analysis ............................................................................................29
Appendix E: Kitchen Diary Data ............................................................................................................................35
Appendix F: Survey 1 Data ......................................................................................................................................38
Appendix G: Residential Bin Dig Data ....................................................................................................................75
Appendix H: Comparing Demographics with Wasted Food Generation .................................................................87
Appendix I: Comparing Attitudes and Behaviors with Wasted Food Generation ...................................................95
Appendix J: Survey 1 and 2 Comparison and Survey 2 Unique Questions .............................................................100
Appendix K: ICI Bin Digs Conversion Factors ....................................................................................................... 110
Appendix L: ICI Estimates Conversion Factors ..................................................................................................... 117
Appendix M: Sample Individual Facility ICI Report ..............................................................................................126
Appendix N: ICI Sectors ........................................................................................................................................129
Appendix O: ICI and Residential Combined .......................................................................................................... 133
Appendix P: Study Templates................................................................................................................................ 137
These appendices provide more information on the methodology, research, and templates associated with the report Estimating Quantities and Types of Food Waste at the City Level, available at https://www.nrdc.org/resources/food-matters-what-we-waste-and-how-we-can-expand-amount-food-we-rescue.

Page 2 ESTIMATING QUANTITIES AND TYPES OF FOOD WASTE AT THE CITY LEVEL: TECHNICAL APPENDICES NRDC Page 3 ESTIMATING QUANTITIES AND TYPES OF FOOD WASTE AT THE CITY LEVEL: TECHNICAL APPENDICES NRDC
The Food Loss and Waste Accounting and Reporting Standard (FLW Standard1) provides a framework for accounting for and reporting on food loss and waste. The graphic below describes the scope of the residential assessment using the FLW Standard.
REQUIREMENT 1: BASE FLW ACCOUNTING AND REPORTING ON THE PRINCIPLES OF RELEVANCE, COMPLETENESS, CONSISTENCY, TRANSPARENCY, AND ACCURACYA. Relevance: n Characterize wasted food in households by type, weight, edibility, loss reason, and discard destination
n Explore food waste-related behaviors to better understand how they relate to the amount of food wasted by households and to identify potential interventions (e.g. behavior education campaigns)
n Contribute to a working model for other cities to perform similar assessments
1 Food Loss and Waste Accounting and Reporting Standard, http://flwprotocol.org (accessed October 16, 2017).
Appendix A: Conformance with Food Loss and Waste Standard—Residential
BASELINE FOOD WASTE ASSESSMENT: RESIDENTIAL (FOOD LOSS AND WASTE ACCOUNTING AND REPORTING STANDARD)FIGURE 2: BASELINE FOOD WASTE ASSESSMENT: RESIDENTIAL (FOOD LOSS AND WASTE ACCOUNTING AND REPORTING STANDARD
TIMEFRAME MATERIAL TYPE DESTINATION BOUNDARY RELATED ISSUES
ONE WEEK (SEPT 2016 – JAN 2017)
* This specifically refers to food that is fed to pets/animals in households.
** Both backyard composting and subscription/ curbside composting services are included.
Note: At the time of the measurement, residential waste materials collected curbside were sent to landfill (Nashville), to landfill and compost (Denver), and to landfill, compost, combustion, and codigestion (NYC).
ANIMAL FEED*
LANDFILL
SEWER
COMPOST/AEROBIC**
LAND APPLICATION
NOT HARVESTED
REFUSE/DISCARDS
FOOD CATEGORY =ALL FOOD ANDBEVERAGE DISCARDED AT HOME
LIFECYCLE STAGE =CONSUMPTION
ORGANIZATION =613 HOUSEHOLDS
GEOGRAPHY =NASHVILLE, TNDENVER, CONEW YORK CITY, NY
WEIGHT OF LIGHTWEIGHT PACKAGING IS INCLUDED.
PARTICIPANTS WERE ASKED TO EXCLUDE OR RECORD AND DESCRIBE INCLUSION OF HEAVIER PACKAGING.
FOOD
INEDIBLE PARTS BIOMATERIAL/ PROCESSING
CO/ANAEROBIC DIGESTION
CONTROLLED COMBUSTION

Page 4 ESTIMATING QUANTITIES AND TYPES OF FOOD WASTE AT THE CITY LEVEL: TECHNICAL APPENDICES NRDC
B. Completeness: A total of 613 households in three cities tracked all food and beverage discarded to all destinations (including trash, home compost, curbside compost, drain disposal, feeding to pets) for one week using a kitchen diary. Additional data were derived from surveys and bin digs.
C. Consistency: Methodologies and templates used for tracking and analyzing data were identical across study cities (except for variations as noted in the detailed methodology below).
D. Transparency: Methodology, including assumptions and definitions, is available in this report (with additional details available upon request).
E. Accuracy: Analyses and calculations have been tested and verified; some accuracy of primary data cannot be assured due to inconsistencies in individual study participant tracking.
REQUIREMENT 2: ACCOUNT FOR AND REPORT THE PHYSICAL AMOUNT OF FLW EXPRESSED AS WEIGHTReported in pounds
REQUIREMENT 3: DEFINE AND REPORT SCOPE A. Timeframe: The kitchen diary and bin digs account for one week (seven days) of residential waste.
Nashville: The field research took place during September/October 2016 in metropolitan Nashville, TN, including Antioch, TN. Participants were asked to start their kitchen diary on the day after their trash collection day and conclude on the following trash collection day. Start dates ranged from September 27 to 30, 2016. Two bin digs were completed for a subset of participating households. The first bin dig was the week prior to the kitchen diary and the second bin dig was the same trash collection day that the kitchen diary was completed.
Denver: The field research took place during November 2016 in Denver, Colorado. Participants were asked to start their kitchen diary on the day after their trash collection day and conclude on the following trash collection day. One bin dig was completed for a subset of participating households. The bin dig collection was timed to take place the morning after the day that the kitchen diary was completed.
NYC: The field research took place during January/February 2017 in New York City (including all boroughs except Staten Island). Participants were asked to start their kitchen diary on a given day (varied by household) and conclude after one week of recording. One bin dig was completed for a subset of participating households. In NYC, single family households and small multi-family buildings have trash collected two to three times per week. In Survey 1, participants were asked which day of the week they most frequently set out their trash. Trash was collected from the randomly selected households on the day indicated on Survey 1 to increase the likelihood of collecting a sample during the week of their kitchen diary. The bin dig results were then scaled appropriately to represent one week’s worth of trash. Large multi-family buildings do not have a set schedule for trash collection by unit; instead, residents place trash down a chute or into a shared bin. For these buildings, arrangements were made with the building manager to collect trash samples from the compactor room. (See methodology in Requirement 4 for more details.)
Material Type: All food items included in both the kitchen diary and bin digs were given classifications related to edibility. Participants were asked to report both food and beverage items that were discarded. The primary classification first splits all items into “edible food” and “inedible parts” (the primary classification aligns with the definitions of “food” and “inedible parts” used in the FLW Standard). “Edible food” refers to any substance intended for human consumption (compatible with the definition of “food” in the FLW Standard). “Edible” does not reflect the state of food at any particular point in time (such as purchase or disposal), but is used to describe an item that would have been considered edible at some point. “Inedible parts” refers to components of food which are not typically consumed in the United States (e.g. banana peels) and/or for which significant skill or effort would be required to render this part of food “edible” (e.g. citrus rinds). (This definition is compatible with the definition of “inedible parts” in the FLW Standard.)
The secondary classification seeks to capture the complexity of defining edibility, especially in terms of culture and preference. Accordingly, items considered “edible food” were split into two groups: 1) Typically Edible and 2) Questionably Edible.
Typically Edible: These items are intended for human consumption and are not generally considered inedible. Examples include pizza, liquid coffee, and bananas without the peel.

Page 4 ESTIMATING QUANTITIES AND TYPES OF FOOD WASTE AT THE CITY LEVEL: TECHNICAL APPENDICES NRDC Page 5 ESTIMATING QUANTITIES AND TYPES OF FOOD WASTE AT THE CITY LEVEL: TECHNICAL APPENDICES NRDC
Questionably Edible: These items can be safely eaten, but may not be considered edible by a portion of the population due to culture or preference. These items might also require additional processing/cooking to make them desirable to eat. Examples include potato peels, beet greens, kale stems, carrot peels/tops, and apple cores/peels.
See Appendix D for comprehensive lists of materials identified in the kitchen diaries and bin digs that were considered “inedible parts,” “questionably edible,” and “typically edible.”
For the bin digs, materials were sorted into ten food waste categories, one for inedible parts (using the definition of “inedible parts” described above), eight categories subcategorizing edible food, and one category for unidentifiable food waste. All kitchen diary entries were also coded to match the bin dig categories for comparison.
1. Inedible Parts: Items not intended for human consumption (smalls amount of edible material associated with the inedible material were permitted to be included).
2. Edible – Meat & Fish: Uncooked or cooked meat (with mostly edible components) unmixed with other types of food. Examples include beef, pork, and fish.
3. Edible – Dairy & Eggs: Solid dairy or egg products unmixed with other food types or in original form. Examples include milk, cheese, butter, and eggs.
4. Edible – Fruits & Vegetables: Solid uncooked or cooked vegetables and fruits (with mostly edible components) unmixed with other types of food. Examples include apples, lettuce, and fresh herbs.
5. Edible – Baked Goods: Baked goods and bread-like products unmixed with other food types or in original form, including pastries. Examples include bread, cake, and tortillas.
6. Edible – Dry Foods: Cooked or uncooked grains, pastas, legumes, nuts, or cereals unmixed with other food types or in original form. Examples include flour, nuts, lentils, and cereal.
7. Edible – Snacks, Condiments, & Others: Includes confections, processed snacks, condiments, and other miscellaneous items. Examples include candy, chips, and sauces.
8. Edible – Liquids/Oils/Grease: Items that are liquid, including beverages. Examples include cooking oil, liquid coffee, and soda.
9. Edible – Cooked/Prepared Items/Leftovers: Items that have many food types mixed together as part of cooking or preparation. Examples include lasagna, burritos, falafel, stir-fry, sandwiches, and pizza.
10. Unidentifiable: Used only if necessary
Additionally, waste that was not food was sorted into the following categories:
1. Food-Soiled Paper; 2. Yard Trimmings; 3. Glass; 4. Recyclable Paper and Cardboard (not food-soiled); 5. Metals; 6. Rigid Plastics; 7. Plastic Films and Composites; and 8. All Other Materials.
TWO LEVELS OF CLASSIFICATION OF DISCARDED FOOD BASED ON “EDIBILITY”FIGURE 3: TWO LEVELS OF CLASSIFICATION OF DISCARDED FOOD
BASED ON “EDIBILITY”
ALL DISCARDED FOOD & BEVERAGES
EDIBLE FOODINEDIBLE
PARTS
INEDIBLEQUESTIONABLY
EDIBLETYPICALLY
EDIBLE
PRIM
ARY
CLAS
SIFI
CATI
ONSE
COND
ARY
CLAS
SIFI
CATI
ON

Page 6 ESTIMATING QUANTITIES AND TYPES OF FOOD WASTE AT THE CITY LEVEL: TECHNICAL APPENDICES NRDC
While categorization of these materials was not the focus of the waste audit, collecting this additional information on wastage rates of commonly recyclable and other materials provides additional context and data on the types of materials found in the waste overall.
C. Discard Destinations: Nashville: At the time of the study, Nashville’s trash only went to landfill, not incinerators or other alternative destinations. For bin digs, the only discard destination included was landfills. For kitchen diaries, the following discard destinations were included:
n Landfill (curbside trash collection)
n Home Compost or Subscription Compost Collection (curbside organics collection not available in Nashville; respondents did not distinguish which type of compost)
n Feeding Animals/Pets
n Drain Disposal
Denver: At the time of the study, Denver’s trash only went to landfill, not incinerators or other alternative destinations. Material collected in the curbside organics collection program was composted. For bin digs, the only discard destinations included were landfills (and some curbside compost). For kitchen diaries, the following discard destinations were included:
n Landfill (curbside trash collection)
n Home Compost
n Curbside Compost Collection
n Feeding Animals/Pets
n Drain Disposal
NYC: At the time of the study, New York City’s trash primarily went to landfill, with a small portion (approximately 15%) sent to incinerators. Material collected in the curbside organics collection program was composted or anaerobically digested/co-digested. For bin digs, the only discard destinations included were landfills (including a portion to incineration) and some curbside compost (including a portion to co/anaerobic digestion). For kitchen diaries, the following discard destinations were included:
n Landfill (majority of curbside trash collection)
n Home Compost
n Curbside Compost Collection
n Compost Drop-off
n Feeding Animals/Pets
n Drain Disposal
n Controlled Combustion (not distinguished by respondent from landfill; represents destination of a portion of NYC’s trash)
n Co/Anaerobic Digestion (not distinguished by respondent from curbside compost; represents destination of a portion of NYC’s curbside compost)
D. Boundary: 1. Food category: All food and beverage items discarded in households were included in the study. Participants were
asked to qualitatively track how much food they discarded outside of their household, but that information was not integrated into the quantitative analysis of household-level wasted food.
2. Lifecycle stage: Consumption
3. Geography: Metropolitan Nashville, TN (including Antioch, TN); Denver, CO; New York City, NY (including all boroughs except Staten Island)

Page 6 ESTIMATING QUANTITIES AND TYPES OF FOOD WASTE AT THE CITY LEVEL: TECHNICAL APPENDICES NRDC Page 7 ESTIMATING QUANTITIES AND TYPES OF FOOD WASTE AT THE CITY LEVEL: TECHNICAL APPENDICES NRDC
4. Organization: 613 households total
Nashville: 68 households completed the kitchen diaries. 51 of those households had their trash collected for bin digs.
Denver: 198 households completed the kitchen diaries. 51 of those households had their trash collected for bin digs, another 14 had their trash and compost collected, and one had only its compost collected.
NYC: 347 households completed the kitchen diaries. 94 of those households had their trash collected for bin digs, another 10 had their trash and compost collected, and 5 had only their compost collected.
E. Related Issues – Packaging: While kitchen diary participants were encouraged to use provided containers (tared) to weigh wasted food, some participants weighed food in other packaging. For the kitchen diaries and bin digs, lightweight packaging (such as plastic film) was included in the weight of the food materials, since it generally weighs very little compared with the food material. Heavier packaging materials (e.g. metal and glass) were removed from the food material for bin digs. For kitchen diaries, participants were asked to either remove food from heavy packaging, or to weigh the food in the heavy packaging but also describe the packaging material so it could be excluded later by researchers from the weight of the food material. However, a majority of respondents indicating the presence of heavier packaging did not provide size or other detailed information on the packaging, so we were unable to accurately remove the weight of packaging from weights tracked in the kitchen diaries. As a result, a small amount of packaging is included in the kitchen diary estimates.
REQUIREMENTS 4 AND 5: DESCRIBE THE QUANTIFICATION AND SAMPLING METHODS
Recruitment: In all cities, participants who signed up for the study received a free digital kitchen scale. Participants who completed the kitchen diary and surveys were given a $50 gift card.
Nashville: There were two basic recruitment methods used in Nashville:
1. Random Sampling: From a list of all households receiving trash collection service from Metro Nashville, 300 households were randomly selected. The 300 households received post cards with information on the study and an online link to participate. Many of those households were also visited in-person by the field team.
2. Convenience Sampling: Using social media and email lists, information on how to participate in the study was publicized and participants could self-select to participate in the study.
It should be noted that participants who opted in to the study via the convenience sampling method were more likely to complete the kitchen diaries and surveys than those recruited via random sampling, likely resulting in a bias towards people already concerned and informed about the issue.
In total, 115 households in Nashville were recruited and 68 of them completed the kitchen diary as well as the surveys.
Denver: In total, 1,000 households were selected from a list of all households in Denver receiving trash collection services and each of those households received a postcard with information about the study and an online link to participate. 200 households were selected per trash collection day (five days a week). Additionally, 120 of the 1,000 households selected were subscribed to curbside organics collection. The 1,000 households were selected by randomly selecting an initial list of 50 households per trash collection day. To increase the ease of recruitment, households adjacent to the initial selected households were included until 200 households were selected per day.
Households opted into the study using the following:
1. Postcard: Some (under 50) of the original 1,000 households that received postcards opted into the study using the link provided.
2. Door-to-Door Recruitment: Households that received postcards were visited by door-to-door recruiters to solicit participation. Additionally, recruiters also visited surrounding households (within a block’s radius of the initially selected household) to recruit other households. Recruitment was opened up to surrounding residents to increase participation and reduce burden of traveling on the recruitment team.
In total, 350 households in Denver were recruited and 198 of them completed the kitchen diary as well as the surveys.

Page 8 ESTIMATING QUANTITIES AND TYPES OF FOOD WASTE AT THE CITY LEVEL: TECHNICAL APPENDICES NRDC
NYC: Two techniques were used to recruit participating households, one for households in large multi-family buildings (10 or more units), and one for single-family households and small multi-family buildings (9 units or fewer). Different recruitment techniques were used owing to the difficulty of accessing the front doors of households in large multi-family buildings without permission for door-to-door recruitment.
1. Single-Family and Small Multi-Family Buildings (9 units or fewer): These types of households were assumed to have front doors accessible to recruiters without previous permission; thus, door-to-door recruitment techniques were used. In Brooklyn, Queens, and the Bronx, census tracts with at least 50% of households in that tract being single-family or small multi-family buildings were identified. From these selected census tracts, a total of 26 census tracts were randomly selected in Brooklyn, Queens and the Bronx for recruitment. In Brooklyn and Queens, 12 census tracts were chosen in each borough (3 with curbside compost collection and 9 without). In the Bronx, 2 census tracts without curbside compost collection were chosen. Recruiters went door-to-door in the census tracts for recruitment.
2. Large Multi-Family Buildings (10 or more units): These types of households were assumed to have front doors that were not easily accessible to our recruitment team. To recruit these households, homeowners’ associations and building managers were contacted to grant permission to post information on the study or to present at building meetings. Participants in these buildings could opt in to the study once permission was granted. Where permitted by the building manager/homeowner association, recruiters set up a table in the building lobby to recruit residents as they passed through or presented to the homeowners’ association as part of their regular monthly meeting.
In total, 686 households in NYC were recruited and 347 of them completed the kitchen diary as well as the surveys.
Kitchen Diaries and Surveys: Participating households were asked to complete one-week long kitchen diaries that track food and beverages that were discarded or not eaten. Additionally, each participating household was asked to complete two surveys (one before and one after participating in the kitchen diary) that collected basic demographic information as well as information on the household’s food-related attitudes and behaviors.
The following information was collected in the kitchen diary for all discarded food and beverages:
n Date
n Time
n Associated with Which Meal: Breakfast, Lunch, Dinner, Dessert, Snack, Other
n Description of Food/Beverage Being Discarded: Written in by respondent (e.g. lasagna, bananas, ham sandwich with cheese, broccoli stems)
n State of Food/Beverage at Time of Discard: Cooked/Leftovers, Prepped (chopped or prepared, but not cooked), Whole, Inedible Parts, Other
n Weight: Measured to the nearest tenth of an ounce (ounces with one decimal point) on provided kitchen scale
n Packaging: If wasted food was in a glass, metal, or hard plastic container when weighed, participant was asked to estimate the size (dimensions or volume). Participants were instructed not to include the weight of plastic containers provided for weighing.
n Discard Destination: Trash, Drain Disposal, Home Compost, Curbside Compost Collection (Denver and NYC only), Compost Drop-off (NYC only), Feeding Pets, Other
n Loss Reason: Past Date on Label, Moldy or Spoiled, Didn’t Taste Good, Improperly Cooked, Inedible Parts, Left Out Too Long, Too Little to Save, Don’t Want as Leftovers, Other
Participants were provided with a pre-printed kitchen diary (see Appendix C for sample) to reduce time needed to complete each entry. They were also given a digital kitchen scale and two small plastic containers to assist with weighing the food. Additionally, a short guidebook describing how to complete the kitchen diary was provided to every participant, including information on how to prepare/tare the scale before use and answers to frequently asked questions. Participants also had access to support via text, phone, and/or email throughout the measurement process. Households were only asked to weigh and record details of food that is wasted in the household. However, households were asked to provide a short, daily narrative on food discarded outside of the household for every member of the household.

Page 8 ESTIMATING QUANTITIES AND TYPES OF FOOD WASTE AT THE CITY LEVEL: TECHNICAL APPENDICES NRDC Page 9 ESTIMATING QUANTITIES AND TYPES OF FOOD WASTE AT THE CITY LEVEL: TECHNICAL APPENDICES NRDC
Physical kitchen diaries were collected and transferred to a spreadsheet. All entries were coded to:
n Standardize food names;
n Indicate “edibility” in terms of how it is defined for the study; and
n Categorize into food types in line with bin dig categories.
All original inputs from participants were saved; however, corrections were made if participant made a “mistake” in characterizing food. For instance, some entries described the food as moldy, but indicated that the loss reason was “inedible parts.” The original entry was saved; however, the final loss reason was corrected to “moldy/spoiled.”
Bin Digs: A subset of randomly selected houses (of those participating in the study) had their trash collected once before the study and once while participating in the study (Nashville only) or once while participating in the study (Denver and NYC). The waste material was collected, sorted, and categorized (see Requirement 3 for specific sorting categories). The bin digs were not used as a primary source of data to determine how much food is wasted; however, they were used to validate kitchen diary data (to compare reported quantities of wasted food with what was found in the trash bin).
As mentioned above, households in NYC have trash collection 2-3 days per week. In order to estimate weekly waste generation for bin digs, NYC households were asked in the second survey to indicate how many times they put out their trash the week of the study. This number was used to scale the results of the bin digs to represent one week’s worth of material. For instance, if household X had their trash collected for the study and indicated that they put out their trash twice that week in the survey, their bin dig results were multiplied by two to represent one week’s worth of trash.
REQUIREMENT 6: PROVIDE A QUALITATIVE OR QUANTITATIVE ASSESSMENT OF UNCERTAINTYThe main source of information used to determine food waste generation was the kitchen diaries. The kitchen diaries only captured one week’s worth of discarded food and beverages, and therefore did not capture the seasonality of food waste generation and disposal, including seasonal differences in what types of food are eaten and thus discarded. Additionally, there is some evidence that people may be less likely to compost in rainy or cold weather, which is not captured. The week-long kitchen diaries were extrapolated to an entire year, thus there is uncertainty in that extrapolation.
Other factors may also influence the accuracy of or ability to extrapolate from kitchen diary data collected, including the challenge of accurately reporting all discards by multiple household members; having a sample population that may be more biased than average toward greater awareness around food and waste issues; and the hypothesis that our study may not have captured refrigerator or freezer clean-outs, which likely increase the amount of food discarded when they occur.
Additional sources of uncertainty include aspects mentioned in other sections of this Appendix and in Appendix D, such as sample sizes, inclusion of some packaging in reported weights, non-normal distribution, sampling bias, and participants changing behaviors as a result of study participation.
Accounting for Underreporting in Kitchen DiariesWhen recording wasted food through kitchen diaries, it is expected that there will be underreporting as a result of:
n Changes of Behavior
n Social Acceptability Bias: Most people do not like wasting food or consider wasting food a socially unacceptable behavior, thus may change their behavior during the kitchen diary process, both knowingly and unknowingly. In general, it is expected that behavior would change to waste less than if their behavior were not being recorded.
n Improper Recording
n Convenience: Some people may not record all items because “they are too small” or delay recording items until after the study period due to the effort of recording every food item wasted. For example, respondents may decide to delay a refrigerator cleanout because of the burden of recording each item.
n Confusion: Some respondents may not record items if they don’t think it is “food” or “waste.” This study requested that both wasted food and beverages be recorded; however, there may be an underreporting of beverages because they are not considered “food” by respondents. Additionally, wasted ornamental food, like pumpkins for Halloween, may not be reported because they are not considered “food” by the household.

Page 10 ESTIMATING QUANTITIES AND TYPES OF FOOD WASTE AT THE CITY LEVEL: TECHNICAL APPENDICES NRDC
For this study, underreporting rates were determined by collecting discarded curbside material (primarily trash, as well as compost, when available) from a subset of households that were also participating in the kitchen diary data recording. Bin dig data from all three cities involved in this study (Nashville, Denver, and New York City) were combined to determine the underreporting rate for all three cities.
In Nashville, trash was collected twice from selected households during the study period. The first set of bin digs were performed prior to the respondents starting the kitchen diary, thus theoretically representing their “normal” trash generation. The second set of bin digs were performed at the end of the kitchen diary period; thus, wasted food found in the trash collected in the second set should be the same food as that recorded in the corresponding kitchen diary.
In Denver and New York City, trash (and curbside compost when it was available) was collected once from selected households during the study period. The bin digs were performed at the end of the kitchen diary period; thus, wasted food found in the trash collected should be the same food as that recorded in the corresponding kitchen diary. In New York City, trash/compost is collected regularly two to three days per week per household; for our sample, however, trash was only collected from households on one of their collection days. Respondents were asked in their second survey (completed after the kitchen diary period) to indicate how many times they set out their trash during the week-long study period. Using the information provided in the survey, the weekly amount of disposed material was extrapolated. Note that since only one bin dig was performed in these cities, this analysis does not include underreporting as a result of changes in behavior from participating in the research.
To understand the level of underreporting, a subset of households that participated in the kitchen diary data recording also had their trash (and curbside compost when available) collected at some point during the kitchen diary study period and sorted into the categories used in the bin dig analysis. The amount of total wasted food found in the trash or compost was compared to the amount of total wasted food reported as being thrown in the trash or compost in the kitchen diary. Trash and compost were compared separately.
One of the main challenges to this method is collecting only material for the week that corresponds to the kitchen diary. Collecting material from a specific week is challenging to do without significantly altering the behavior of the respondents. To get the most “accurate” results, the study design aimed to minimize the impact on the respondents’ regular routines. However, there were many issues that arose, including:
n Getting respondents to put out their trash during the week of collection.
Some households don’t regularly put out their trash or wait until their trash can is full to put it at the curb. Despite reminders, some respondents did not put out their trash.
n Getting more than a week’s worth of trash
If households do not put out their trash each week, collected material may represent multiple weeks of trash. Additionally, trash collected in indoor waste bins may have included waste generated prior to the kitchen diary period.
n Getting all the week’s trash to the curb
Some respondents may record their wasted food per week and put out their trash cans for collection; however, some waste material from the week may remain in their indoor waste bin, thus not making it to the curbside bin.
As a result of the above challenges, overreporting, in addition to underreporting, was observed. For the purposes of this report, we performed two sets of analyses: 1) Underreporting calculations considering all households; and 2) Underreporting calculations on the subset of households where more trash was found during the bin digs than reported. The second analysis aims to reduce the error caused by false instances of “overreporting.” Both sets of analyses are reported below; however, the first method is a more conservative method for determining underreporting (and the method we selected for our study).
Underreporting Analyses and Results When analyzing all households, the average total wasted food underreporting rate ranged from 24% to 65% in the three cities (see Table 1 for more details). Both underreporting and overreporting were observed at the individual household level. On average, however, underreporting was dominant in each of the three cities.

Page 10 ESTIMATING QUANTITIES AND TYPES OF FOOD WASTE AT THE CITY LEVEL: TECHNICAL APPENDICES NRDC Page 11 ESTIMATING QUANTITIES AND TYPES OF FOOD WASTE AT THE CITY LEVEL: TECHNICAL APPENDICES NRDC
TABLE 1. SUMMARY OF UNDERREPORTING FOR FOOD IN TRASH IN NASHVILLE, DENVER, AND NEW YORK CITY
ANALYSIS WITH ALL HOUSEHOLDS ANALYSIS WITH ONLY UNDERREPORTING HOUSEHOLDS
NUMBER OF HOUSEHOLDSUNDERREPORTING RATE
(BY WEIGHT) NUMBER OF HOUSEHOLDSUNDERREPORTING RATE
(BY WEIGHT)
NASHVILLE 30 24% 17 71%
DENVER 37 65% 29 109%
NEW YORK CITY 53 47% 32 127%
AVERAGE 47% 108%
When comparing wasted food reportedly discarded in compost bins in the kitchen diary compared to what was found in the compost bins, an underreporting rate of 144% was found in New York City, while an overreporting rate of 19% was found in Denver (see Table 2). In NYC, this is likely a result of many sampled households having wasted food in their curbside collection bins, but having very little reported in their kitchen diary (potential causes for this include indoor bins not being emptied into curbside collection bins by the time of our pickup). In addition, some smaller NYC multi-family residences share compost bins (though may not necessarily share trash bins); samples collected from those shared compost bins may have included material discarded by neighboring non-participant households in addition to material discarded by the households participating in the study. The overreporting in Denver could be a result of respondents inaccurately reporting disposing of food in the compost, as composting is a more socially acceptable behavior than throwing food in the trash.
TABLE 2. SUMMARY OF REPORTING FOR FOOD IN COMPOST IN DENVER AND NEW YORK CITY
ANALYSIS WITH ALL HOUSEHOLDS
NUMBER OF HOUSEHOLDS REPORTING RATE (BY WEIGHT)
DENVER 14 19% Overreporting
NEW YORK CITY 6 144% Underreporting
In Nashville, two bin digs were performed, one prior to the kitchen diary and one right after the kitchen diary. The comparison between the two digs was designed to capture any changes in behavior that resulted from participating in measuring their wasted food through the kitchen diary. The average total food waste generation for the first bin dig was 8 pounds/household/week while the average for the second was 5.9 pounds/household/week. This was a reduction in food waste generation of 22%. Edible food waste had an even larger reduction of 33% from the first to second bin dig.
Study Correction Factor For the purposes of this study, the average total wasted food underreporting rate from the trash digs of all three cities combined, 47%, was used as a correction factor applied to kitchen diary results. This correction factor is applied to total food waste generation and is not dependent on discard destination (it is used for all discard destinations). The underreporting rate for trash is being used as a proxy for all other discard destinations. Even though the reporting rate for compost was also calculated, the sample size was too small to be significant, and the results were inconclusive.

Page 12 ESTIMATING QUANTITIES AND TYPES OF FOOD WASTE AT THE CITY LEVEL: TECHNICAL APPENDICES NRDC
A. ICI Estimates (All Cities)The Food Loss and Waste Accounting and Reporting Standard (FLW Standard1) provides a framework for accounting for and reporting on food loss and waste. The graphic below describes the scope of the ICI estimate using the FLW Standard.
REQUIREMENT 1: BASE FLW ACCOUNTING AND REPORTING ON THE PRINCIPLES OF RELEVANCE, COMPLETENESS, CONSISTENCY, TRANSPARENCY, AND ACCURACYA. Relevance: n Estimate the amounts of food likely to be wasted in specific sectors in the study cities, including the residential sector
n Contribute to a working model for other cities to perform similar assessments
B. Completeness: All facilities within designated subsectors and geographies were included. Food waste generation estimates were derived from specific facility information obtained using several public and proprietary databases. Additional data were derived from surveys and bin digs.
1 Food Loss and Waste Accounting and Reporting Standard, http://flwprotocol.org (accessed October 16, 2017).
Appendix B: Conformance with FLW Standard— Industrial, Commercial, Institutional (ICI)
BASELINE FOOD WASTE ASSESSMENT: ICI ESTIMATES (FOOD LOSS AND WASTE ACCOUNTING AND REPORTING STANDARD)FIGURE 3: BASELINE FOOD WASTE ASSESSMENT: ICI ESTIMATES (FOOD LOSS AND WASTE ACCOUNTING AND REPORTING STANDARD)
TIMEFRAME MATERIAL TYPE DESTINATION BOUNDARY RELATED ISSUES
PROXY EXTRAPOLATION (ONE YEAR)
Note: The sources used for extrapolation were for “total food waste generation” and did not specifically note whether beverages were included; the assumption is that they are not.
The numbers used for proxy extrapolation were for “total food waste generation” and thus theoretically represent all discard destinations.
ANIMAL FEED
LANDFILL
SEWER
COMPOST/AEROBIC
LAND APPLICATION
NOT HARVESTED
REFUSE/DISCARDS
FOOD CATEGORY =ALL FOOD (NOT BEVERAGE)
LIFECYCLE STAGE =VARIABLE(CONSUMER-FACINGBUSINESSES &INSTITUTIONS,MANUFACTURING,DISTRIBUTION)
ORGANIZATION =34,040 FACILITIES
GEOGRAPHY =NASHVILLE, TNDENVER, CONEW YORK CITY, NY
WEIGHT OF PACKAGING IS EXCLUDED
FOOD
INEDIBLE PARTS BIOMATERIAL/ PROCESSING
CO/ANAEROBIC DIGESTION
CONTROLLED COMBUSTION

Page 12 ESTIMATING QUANTITIES AND TYPES OF FOOD WASTE AT THE CITY LEVEL: TECHNICAL APPENDICES NRDC Page 13 ESTIMATING QUANTITIES AND TYPES OF FOOD WASTE AT THE CITY LEVEL: TECHNICAL APPENDICES NRDC
C. Consistency: Methodologies and templates used for tracking and analyzing data were identical across study cities; definitions used were identical to definitions used in residential study (and ICI bin digs) where applicable.
D. Transparency: Methodology, including assumptions and definitions, is available in this report (with additional details available upon request).
E. Accuracy: Analyses and calculations have been tested and verified; some accuracy of facility data cannot be assured due to inconsistencies in information provided in available databases.
REQUIREMENT 2: ACCOUNT FOR AND REPORT THE PHYSICAL AMOUNT OF FLW EXPRESSED AS WEIGHTThe metric reported is total food waste generation in tons per year.
REQUIREMENT 3: DEFINE AND REPORT SCOPE A. Timeframe: The ICI food waste estimates were based on proxy extrapolation, thus do not represent a specific timeframe; however, the estimates are based on industrial, commercial, and institutional facilities operating for one year.
B. Material Type: The estimates include edible food and its associated inedible parts (as defined in Appendix A); however, they are not separated in the analysis.
C. Discard Destinations: The numbers used for proxy extrapolation are for total food waste generation and thus theoretically represent all discard destinations.
D. Boundary: 1. Food category: All food (not beverage) items
2. Lifecycle stage: Variable (Consumer-facing businesses & institutions, manufacturing, distribution)
3. Geography: Facilities within the city limits of Nashville, TN; Denver, CO; New York City, NY (all five boroughs)
4. Organization: 34,040 facilities (4,698 Nashville, 2,565 Denver, 26,777 NYC) were included from the following sectors:
n Colleges & Universities
n Correctional Facilities
n Events & Recreation Facilities
n Food Manufacturing & Processing
n Food Wholesalers & Distributors
n Grocers & Markets
n Health Care (Hospitals and Nursing Homes)
n Hospitality (Hotels)
n K-12 Schools
n Restaurants & Caterers

Page 14 ESTIMATING QUANTITIES AND TYPES OF FOOD WASTE AT THE CITY LEVEL: TECHNICAL APPENDICES NRDC
The following types of ICI facilities were not included even though they may significantly contribute to total food waste generation in the cities:
n Convenience Stores (lack of information on food waste generation)
n Food Banks and Pantries (lack of information on food waste generation)
n Coffee Shops (lack of information on food waste generation)
n Airports (lack of information on food waste generation)
n Corporate Cafeterias (lack of information on food waste generation and locations)
E. Related Issues: Numbers used did not include packaging.
REQUIREMENTS 4 AND 5: DESCRIBE THE QUANTIFICATION AND SAMPLING METHODSFacility-Level InformationIn order to conduct ICI food waste generation estimates, information on the types of facilities in each geographic area was obtained using several databases, both public and proprietary. Information on location, sales, number of employees, number of students, square footage, and number of beds at each facility was obtained to estimate food waste generation, whenever possible. The information collected from the database was “cleaned” to remove duplicates, facilities outside of the sectors of interest, and facilities located outside of the city limits.
The following public databases were used (facility information for other sectors was found on proprietary databases):
n National Center for Education Statistics: Provided list of colleges/universities and K-12 schools (both public and private), including location, education levels, and number of students.
n American Hospital Directory: Provided list of hospitals, including location and number of beds.
n PrisonPro.com: Provided list of correctional facilities by location and number of beds.
Converting Facility-Level Information to Food Waste EstimatesFor each sector, conversion factors were used to convert facility-level information to food waste generation estimates (see Table 1 below for list of conversion factors). The conversion factors used for this analysis were identified by the U.S. Environmental Protection Agency in their report entitled “Technical Methodology for the U.S. EPA Wasted Food Opportunities Map (Version 1.0)2”. The sources were compared to other potential sources of information, including some of the limited number of food waste characterizations completed by local and state governments (see Appendix L for specific sources and more details).
Below is the main piece of facility-level information used to estimate food waste generation for each sector:
n Colleges & Universities (# of students)
n Correctional Facilities (# of inmates/beds)
n Events & Recreation Facilities (# of seats)
n Food Manufacturing & Processing (revenue)
n Food Wholesalers & Distributors (revenue)
n Grocers & Markets (# of employees)
n Health Care (# of beds for hospitals; revenue for nursing homes)
n Hospitality (Hotels) (# of employees)
n K-12 Schools (# of students, grade levels)
n Restaurants & Caterers (# of employees)
2 Environmental Protection Agency, “Technical Methodology for the U.S. EPA Wasted Food Opportunities Map (Version 1.0),” to be available at https://www.epa.gov/sustainable-management-food/technical-methodology-wasted-food-opportunities-map (not yet available at time of print).

Page 14 ESTIMATING QUANTITIES AND TYPES OF FOOD WASTE AT THE CITY LEVEL: TECHNICAL APPENDICES NRDC Page 15 ESTIMATING QUANTITIES AND TYPES OF FOOD WASTE AT THE CITY LEVEL: TECHNICAL APPENDICES NRDC
TABLE 1. CONVERSION FACTORS USED IN ANALYSIS
SECTOR CONVERSION FACTOR(S) USED DATABASE USED FOR LIST OF FACILITIES
Colleges & Universities .35 lbs/meal
Residential – 405 meals/student/yr
Non-Residential – 108 meals/students/yr
National Center for Education Statistics
Correctional Facilities 1 lb/inmate/day PrisonPro.com
Events & Recreation Facilities 100 days/yr
.6 lbs/seat/day
Attendance is 80% of capacity
OR (depending on available facility information)
.45 lbs/visitor
Online Search
Food Manufacturing & Processing .053 lbs/$ of revenue/yr Proprietary Database
Food Service Sector (Restaurants & Caterers)
3,000 lbs/employee/yr Proprietary Database
Food Wholesalers & Distributors .01 lbs/$ of revenue/yr Proprietary Database
Grocers & Markets 3,000 lbs/employee/yr Proprietary Database
Health Care—Hospitals 3.42 lbs/bed/day American Hospital Directory
Health Care—Nursing Homes 1.8 lbs/bed/day
23 beds/$ million of revenue
Proprietary Database
Hospitality (Hotels) 1,984 lbs/employee/yr Proprietary Database
K-12 Schools 31 weeks/year
Elementary – 1.13 lbs/student/week
Middle – .73 lbs/student/week
High – .35 lbs/student/week
All – .74 lbs/student/week
Elementary/Middle - .93 lbs/student/week
Middle/High - .54 lbs/student/week
National Center for Education Statistics
K-12 SchoolsFor K-12 schools, different wastage rates were used for elementary, middle, and high schools. However, some schools are combined middle/high schools or have all grades. It was assumed that there were 31 weeks of school per year. For combined schools, an average was used:
n Elementary/Middle School: .93 lbs per student per week
n Middle/High School: .54 lbs per student per week
n All Grades: .74 lbs per student per week
Nursing HomesFor nursing homes, it was estimated that 23 beds equate to $1 million in revenue. This estimate was generated using information from the American Health Care Association3 stating that there are 1.7 million beds in nursing homes in the U.S. representing $72 billion of revenue.
3 American Health Care Association, “Fast Facts,” available at https://www.ahcancal.org/research_data/trends_statistics/Pages/Fast-Facts.aspx (accessed on October 17, 2017).

Page 16 ESTIMATING QUANTITIES AND TYPES OF FOOD WASTE AT THE CITY LEVEL: TECHNICAL APPENDICES NRDC
Events & Recreation Facilities A comprehensive list of events and recreation facilities serving food were not available. A list of facilities was generated through online searches; however, information on number of seats, number of employees, number of visitors, and revenue could not be found for all facilities. Additionally, events and recreation facilities represent a wide range of facility types and uses (number of days per year the facility is in use, types of event, etc.), thus determining a conversion factor that works for all is difficult. EPA’s methodology did not include conversion factors for event facilities, so two conversion factors from Recycling Works Massachusetts4 were used due to the overall similarity between numbers used by Recycling Works and EPA.
If information on number of seats was available, the following assumptions and conversion factors were used:
n Each facility is in operation for 100 days per year (assumption by NRDC)
n 80% capacity (assumption by NRDC)
n .6 lbs/seat/day
If information on the number of visitors was available and number of seats was not, the following assumptions and conversion factors were used:
n .45 lbs/visitor
REQUIREMENT 6: PROVIDE A QUALITATIVE OR QUANTITATIVE ASSESSMENT OF UNCERTAINTYThe formulas used in this method should not be used to determine an individual facility’s food waste generation. The conversion factors used are sector-based averages of food waste generation. The average represents an entire sector of diverse facilities with wide-ranging food waste generation rates. Additionally, this method cannot be used to track progress in reducing food waste; the data generated by these methods represent an estimate of sector-based food waste generation that should be used as a baseline estimate only.
The conversion factors used for this analysis were identified by the U.S. Environmental Protection Agency in their report entitled “Technical Methodology for the U.S. EPA Wasted Food Opportunities Map (Version 1.0)5”. Some of the factors were based on data and sources more than a decade old and others were based on data with a small sample size of facilities. While these conversion factors are based on some of the best existing data, the conversion factors used in this analysis should still be used with caution. Overall, there is very little research that would allow us to confidently determine whether these conversion factors are or are not indicative of industry-level averages. More research must be done to determine this.
Acknowledging that there are other potential sources of food waste generation information, we compared EPA’s conversion factors to other potential sources of information, including some of the limited number of waste characterizations completed by local and state governments. Additionally, potential concerns about specific conversion factors were identified as potential areas for further research (see Table 2 below for concerns). Please note that this table is not comprehensive of all studies on food waste generated in the institutional, commercial, and industrial sectors. A sensitivity analysis was performed for some of the facility types (see Table 2 for list and Appendix L for sensitivity analysis) to determine the potential impact of specific conversion factors on the entire food waste generation estimate. Although we believe that the most appropriate conversion factors were selected for this analysis, the alternate estimations derived from the scenarios used to conduct the sensitivity analysis can be used as a range to show certainty if desired. (See Appendix L for detailed scenarios and conversion factors derived from the sensitivity analysis.)
Additionally, the formulas we used were derived from food waste characterization studies, of which there have been a very limited number to date. Many waste characterization studies do not include specific analysis of food waste separate from other organic waste, and those that do generally do not subdivide food waste into specific subcategories (such as estimates of the amount of food waste which was potentially edible or avoidable). Consequently, the formulas derived from these studies do not provide a way to estimate how much of the food generated by the ICI sector may have been edible, only estimates of total waste generated. (See NRDC’s report “Modeling the Potential to Increase Food Rescue: Denver, New York City and Nashville”6 for information on how to estimate the amount of food that may be suitable for donation.)
4 Recycling Works Massachusetts, “Food Waste Estimation Guide,” available at http://recyclingworksma.com/food-waste-estimation-guide (accessed on October 17, 2017). 5 Environmental Protection Agency, “Technical Methodology for the U.S. EPA Wasted Food Opportunities Map (Version 1.0),” to be available at https://www.epa.gov/sustainable-management-food/technical-methodology-wasted-food-opportunities-map (not yet available at time of print). 6 JoAnne Berkenkamp, “ Modeling the Potential to Increase Food Rescue,” Natural Resources Defense Council (2017), available at https://www.nrdc.org/resources/food-matters-what-we-waste-and-how-we-can-expand-amount-food-we-rescue.

Page 16 ESTIMATING QUANTITIES AND TYPES OF FOOD WASTE AT THE CITY LEVEL: TECHNICAL APPENDICES NRDC Page 17 ESTIMATING QUANTITIES AND TYPES OF FOOD WASTE AT THE CITY LEVEL: TECHNICAL APPENDICES NRDC
TABLE 2. CONCERNS ABOUT DATA AND SENSITIVITY ANALYSIS
SECTOR CONCERNS ABOUT DATA SENSITIVITY ANALYSIS?
Colleges & Universities No
Correctional Facilities No
Events & Recreation Facilities n Depends significantly on event types, number of events/year, and other factors that make this sector diverse
n Seat capacity vs. visitors is important distinction (may only be able to find seat capacity)
No
Food Manufacturing & Processing No
Food Service Sector (Restaurants & Caterers) n May be significant differences based on type of restaurant: quick service vs. full service vs. limited service
Yes (Used Metro Vancouver’s and California’s numbers & different assumptions for limited/quick service vs. full service).
Food Wholesalers & Distributors No
Grocers & Markets n 3,000 lb number is from 1990’s. There has been a reduction in employee size for grocers which may mean a higher food waste per employee number
n Does not distinguish between hypermarkets, supermarkets, and smaller grocers
n Does not include food that goes to reclaimer
Yes (Used California’s number).
Health Care—Hospitals No
Health Care—Nursing Homes No
Hospitality n May significantly depend on what types of food services are provided (e.g. room service, restaurants, bars, etc)
Yes (Used California’s number).
K-12 Schools n May be significant differences by public vs. private school within school level
No

Page 18 ESTIMATING QUANTITIES AND TYPES OF FOOD WASTE AT THE CITY LEVEL: TECHNICAL APPENDICES NRDC
B. ICI Bin Digs (All Cities)The Food Loss and Waste Accounting and Reporting Standard (FLW Standard7) provides a framework for accounting for and reporting on food loss and waste. The graphic below describes the scope of the ICI bin digs using the FLW Standard.
REQUIREMENT 1: BASE FLW ACCOUNTING AND REPORTING ON THE PRINCIPLES OF RELEVANCE, COMPLETENESS, CONSISTENCY, TRANSPARENCY, AND ACCURACYA. Relevance: n Use bin digs to help understand how much and what types of food are discarded from ICI facilities and to “groundtruth”
ICI estimates.
n Contribute to a working model for other cities to perform similar assessments
B. Completeness: Representative facilities within designated subsectors and geographies were included. The facilities were recruited with the goal of working with at least one to four facilities per city from each sector listed below.
C. Consistency: Methodologies and templates used for tracking and analyzing data were identical across study cities; definitions used were identical to definitions used in residential study (and ICI estimates) where applicable.
D. Transparency: Methodology, including assumptions and definitions, is available in this report (with additional details available upon request).
E. Accuracy: Analyses and calculations have been tested and verified; some accuracy of or ability to extrapolate from facility data cannot be assured due to inconsistencies in materials collected as described below.
7 Food Loss and Waste Accounting and Reporting Standard, http://flwprotocol.org/ (accessed October 16, 2017).
BASELINE FOOD WASTE ASSESSMENT: ICI BIN DIGS (FOOD LOSS AND WASTE ACCOUNTING AND REPORTING STANDARD)FIGURE 4: BASELINE FOOD WASTE ASSESSMENT: ICI BIN DIGS (FOOD LOSS AND WASTE ACCOUNTING AND REPORTING STANDARD)
TIMEFRAME MATERIAL TYPE DESTINATION BOUNDARY RELATED ISSUES
VARIABLE (SEPT 2016 –JAN 2017)
Note: At the time of the measurement, waste materials collected were sent to landfill (Nashville), to landfill and compost (Denver), and to landfill, compost, combustion, and codigestion (NYC).
ANIMAL FEED
LANDFILL
SEWER
COMPOST/AEROBIC
LAND APPLICATION
NOT HARVESTED
REFUSE/DISCARDS
FOOD CATEGORY =ALL FOOD AND BEVERAGE
LIFECYCLE STAGE =VARIABLE(CONSUMER-FACINGBUSINESSES ANDINSTITUTIONS,MANUFACTURING,DISTRIBUTION)
ORGANIZATION =93 FACILITIES
GEOGRAPHY =NASHVILLE, TNDENVER, CONEW YORK CITY, NY
WEIGHT OF LIGHTWEIGHT PACKAGING IS INCLUDED.
SINGLE SAMPLES WITH MAXIMUM WEIGHT 220 LBS. WERE TAKEN FROM EACH FACILITY (ONE DAY’S WORTH FOR MOST FACILITIES).
FOOD
INEDIBLE PARTS BIOMATERIAL/ PROCESSING
CO/ANAEROBIC DIGESTION
CONTROLLED COMBUSTION

Page 18 ESTIMATING QUANTITIES AND TYPES OF FOOD WASTE AT THE CITY LEVEL: TECHNICAL APPENDICES NRDC Page 19 ESTIMATING QUANTITIES AND TYPES OF FOOD WASTE AT THE CITY LEVEL: TECHNICAL APPENDICES NRDC
REQUIREMENT 2: ACCOUNT FOR AND REPORT THE PHYSICAL AMOUNT OF FLW EXPRESSED AS WEIGHTThe metric reported is total food waste generation in pounds (extrapolated where feasible to pounds per year).
REQUIREMENT 3: DEFINE AND REPORT SCOPE A. Timeframe: The ICI bin digs collected trash and compost (when available) material from facilities. Most facilities had one day or a portion of one day’s trash collected. The timeframe of the bin dig was noted for each facility.
B. Material Type: For the bin digs, materials were sorted into ten food waste categories, one for inedible parts (using the definition of “inedible parts” described in Appendix B), eight categories subcategorizing edible food (see Appendix B), and one category for unidentifiable food waste.
1. Inedible Parts: Items not intended for human consumption (it is acceptable for a small amount of edible material associated with the inedible material to be included).
2. Edible – Meat & Fish: Uncooked or cooked meat (with mostly edible components) unmixed with other types of food. Examples include beef, pork, and fish.
3. Edible – Dairy & Eggs: Solid dairy or egg products unmixed with other food types or in original form. Examples include milk, cheese, butter, and eggs.
4. Edible – Fruits & Vegetables: Solid uncooked or cooked vegetables and fruits (with mostly edible components) unmixed with other types of food. Examples include apples, lettuce, and fresh herbs.
5. Edible – Baked Goods: Baked goods and bread-like products unmixed with other food types or in original form, including pastries. Examples include bread, cake, and tortillas.
6. Edible – Dry Foods: Cooked or uncooked grains, pastas, legumes, nuts, or cereals unmixed with other food types or in original form. Examples include flour, nuts, lentils, and cereal.
7. Edible – Snacks, Condiments, & Others: Includes confections, processed snacks, condiments, and other miscellaneous items. Examples include candy, chips, and sauces.
8. Edible – Liquids/Oils/Grease: Items that are liquid, including beverages. Examples include cooking oil, liquid coffee, and soda.
9. Edible – Cooked/Prepared Items/Leftovers: Items that have many food types mixed together as part of cooking or preparation. Examples include lasagna, burritos, falafel, stir-fry, sandwiches, and pizza.
10. Unidentifiable: Used only if necessary
Additionally, waste that was not food was sorted into the following categories: 1. Food-Soiled Paper; 2. Yard Trimmings; 3. Glass; 4. Recyclable Paper and Cardboard (not food-soiled); 5. Metals; 6. Rigid Plastics; 7. Plastic Films and Composites; and 8. All Other Materials.
While categorization of these materials was not the focus of the waste audit, collecting this additional information on wastage rates of commonly recyclable and other materials provides additional context and data on the types of materials found in the waste overall.
C. Discard Destinations: The numbers used for proxy extrapolation are for total food waste generation and thus theoretically represent all discard destinations even though only composted and landfilled waste were collected. Facilities that discarded wasted food in other ways were either asked to collect that material for collection or provide information on their discard to other destinations. Facilities where the material collected or reported did not represent all food waste generation did not have their bin digs extrapolated to pounds per year.

Page 20 ESTIMATING QUANTITIES AND TYPES OF FOOD WASTE AT THE CITY LEVEL: TECHNICAL APPENDICES NRDC
D. Boundary: 1. Food category: All food and beverage items
2. Lifecycle stage: Variable (Consumer-facing businesses & institutions, manufacturing, distribution)
3. Geography: Metropolitan areas of Nashville, TN; Denver, CO; New York City, NY (all boroughs except Staten Island)
4. Organization: 93 facilities were included from the following sectors:
n Airports
n Colleges & Universities
n Corporate Cafeterias
n Correctional Facilities
n Events & Recreation Facilities
n Food Manufacturing & Processing
n Food Rescue Organizations
n Food Wholesalers & Distributors
n Grocers & Markets
n Health Care (Hospitals)
n Hospitality (Hotels)
n K-12 Schools
n Restaurants & Caterers
E. Related Issues – Packaging: Lightweight packaging (such as plastic film) was included in the weight of the food materials, since it generally weighs very little compared with the food material. For food in heavier packaging materials (e.g. metal and glass), if the container was mostly empty (i.e. the weight of the container exceeded the weight of the food), then the item was included in the packaging material’s category. If the container was mostly full (i.e. the weight of the food exceeded the weight of the container), the item was included with the food category and the container type noted.
REQUIREMENTS 4 AND 5: DESCRIBE THE QUANTIFICATION AND SAMPLING METHODSBin digs were performed in Nashville, Denver, and New York City to help understand how much and what types of food are discarded from institutional, commercial, and industrial (ICI) facilities. Facilities were recruited using existing relationships and cold calls in each of the cities. Facilities were given a confidential report of their results and anonymity was promised. The facilities were recruited to get at least a couple of facilities from each sector listed above.
Waste was collected from each facility on their regular trash collection day (or the evening before) and taken to an off-site location to be sorted by a field team. If facilities currently compost (using a hauler), waste material from their organics bins was also collected and sorted. Facilities that discarded wasted food in ways other than trash or compost were either asked to collect those materials for our collection or provide information on their discards to other destinations. Samples of up to 200 pounds of trash (and compost, when available) were collected from each facility, taken off-site, and sorted into 10 food and 8 non-food categories. Sorting protocols and categories were the same as for residential bin digs. Most facilities had one day’s worth or a portion of one day’s worth of trash collected. When samples collected did not represent an entire day’s worth of waste material, the amount of waste that facility would typically generate in a day was estimated if possible from the proportion of total material collected (and used to derive annual generation estimates, as outlined below and in Appendix K).
Additionally, facilities were asked to fill out a survey which included basic information to aid in sample pickup coordination, facility characteristics such as number of employees and annual revenue, and information on current food- and food waste-related behaviors. Participating facilities received a free food waste characterization and a subsequent confidential report providing recommendations specific to their facility.
When feasible, findings from the bin digs were extrapolated to generate annual food waste generation estimates. Two methods of extrapolation were used based on available information: 1) If the bin dig represented all or a known portion

Page 20 ESTIMATING QUANTITIES AND TYPES OF FOOD WASTE AT THE CITY LEVEL: TECHNICAL APPENDICES NRDC Page 21 ESTIMATING QUANTITIES AND TYPES OF FOOD WASTE AT THE CITY LEVEL: TECHNICAL APPENDICES NRDC
of food waste discarded for a known period of time, the amount was extrapolated for an entire year based on the number of days a facility operates per year (if the portion of waste material collected was not known, the bin dig was not extrapolated); and/or 2) If the bin dig represented all trash and/or compost materials discarded by that facility and the facility provided annual estimates of total waste generation in their survey, the percentage of total trash or compost material that food represented by weight in the bin dig was multiplied by the estimate of total food waste discarded per year. In some cases, both methods could be used to generate an estimate and numbers are presented as a range. For most cases, there was only enough information and/or the bin dig only allowed for extrapolation using one method. However, if it was evident that the sampled material did not represent a facility’s normal waste pattern, the bin dig results were not extrapolated.
Using estimated annual food waste generation as determined, “conversion factors” were estimated for each facility, whenever possible. As applicable by facility type, conversion factors include food waste generation per: 1) employee; 2) bed; 3) student; 4) $ of revenue; 5) rooms; and 6) meals. (See Appendix K for food waste generation estimates derived from ICI bin digs.)
REQUIREMENT 6: PROVIDE A QUALITATIVE OR QUANTITATIVE ASSESSMENT OF UNCERTAINTYBin digs were only conducted one time and generally represented between one and three days of waste materials from each facility. As such, these bin digs are “snapshots” and may not represent a facility’s normal waste generation pattern. Additionally, the samples collected were a maximum of 200 pounds of material each; for example, for larger facilities with non-homogeneous waste (e.g., grocers), a single 200-pound sample may not have been “representative” of that facility’s waste. When it was obvious that the sampled material did not represent a facility’s normal waste pattern, the bin dig results were not extrapolated. (See Appendix K for more information on bin dig extrapolation.)

Page 22 ESTIMATING QUANTITIES AND TYPES OF FOOD WASTE AT THE CITY LEVEL: TECHNICAL APPENDICES NRDC
1. STAFFING
A. Recruitment Tacticsn Advertised job on Craigslist, Indeed, and to contacts at universities
n Templates available for job posting language and interview questions
B. Notes on Staffing Logisticsn Staff were expected to enter their hours into a web-based form each evening
n Staff were required to have a passport, or alternative pieces of identification, to complete their T9 form and prove that they were legally able to work in the U.S.
2. KITCHEN DIARY PARTICIPANT RECRUITMENT
A. Staff Training
Webinarn A webinar was hosted for Community Ambassadors in the month prior to on-ground research.
n Staff were provided with Community Ambassador Training Guide
n Staff were provided with Recruitment Script
First Day Training Workshopn On the first day of recruitment, all staff were given 2 hours of in-person training. Topics covered were:
1. Kitchen Diary Kit Materials
2. Daily data entry
3. Practicing the recruitment script
4. Safety measures and Personal Protective Equipment
On-the-Ground Trainingn Tetra Tech field lead was present for the first week of recruitment. Each day, approximately one hour was spent one-
on-one with each Community Ambassador to ensure that messaging was consistent and they were confident in their recruitment skills
B. Safety Considerationsn Staff wore high-visibility vests
n Staff were sent out in teams of 2 or 3 (but knocked on doors independently)
n Staff were instructed to wear weather-appropriate, protective clothing (including footwear to minimize the risk of slipping or falling)
Appendix C: Baseline Assessment Field Methodology
Thanks to Tetra Tech for providing field information. Note: More information and documents referred to in this appendix are available upon request from NRDC.

Page 22 ESTIMATING QUANTITIES AND TYPES OF FOOD WASTE AT THE CITY LEVEL: TECHNICAL APPENDICES NRDC Page 23 ESTIMATING QUANTITIES AND TYPES OF FOOD WASTE AT THE CITY LEVEL: TECHNICAL APPENDICES NRDC
C. Single Family & Small Multi-Familyn Staff worked approximately 6 hour shifts
n Staff were provided with maps of census areas via a shared online map. If they ran out of doors to knock on, they were instructed to go to streets adjacent to the census tracts for additional recruitment.
D. Large Multi-Family Buildings n Multi-family building managers were contacted in advance of the project and asked to send out the participant
sign-up link to all tenants in their buildings
n A recruitment flyer was sent out by email or posted in the building (with manager permission)
n A date was arranged in which Community Ambassadors set up a table in the lobby of the building
n Community Ambassadors gave out the kits to participants who had signed up via the online sign-up link and to new sign-ups
n Remaining kits from online sign-ups were left with the doorperson
E. Online Signupsn Participants were able to directly sign up online. Most online signups received the sign-up link through:
n Receiving a door hanger from a Community Ambassador
n Residing in a targeted multi-family building which had sent out a notice about the project to all tenants
n Remaining kits from online sign-ups were left with the doorperson
F. Materialsn Community Ambassadors were provided with the following materials for door-to-door work:
n Kit Demonstration Folder
1. Quick Start Guide
2. Kitchen Diary
3. Kitchen Diary Kit Manual
4. Background on study
n Data sheets to track participant information
n Door-hangers to leave at residences where people were not home
3. DATA TRACKING FOR RESIDENTIAL PARTICIPANTS
A. Community Ambassador Data Entry n Community Ambassadors were responsible to enter the participants that they had recruited on a daily basis
into a web-based form.
B. Data Management n Researchers off-site managed the spreadsheet of participants, including data entry, data cleaning, verifying each
stage of recruitment and participation, and communicating with field researchers.
4. RESIDENTIAL PARTICIPANT FOLLOW-UPn All participant follow-up correspondence was sent from a central project email address, phone, or text
n Participants were provided with email and phone contacts for questions
n Participant Follow-Up Schedule and Methodology scripts were used to ensure consistency

Page 24 ESTIMATING QUANTITIES AND TYPES OF FOOD WASTE AT THE CITY LEVEL: TECHNICAL APPENDICES NRDC
5. KITCHEN DIARY KIT DELIVERY
A. Kit Assemblyn The following supplies were included in residential study participation kits:
n All kitchen diary and related materials
Quick Start Guide (with fill-in blanks for start date, end date, and survey 2 deadline)
Kitchen Diary
Kitchen Diary Kit Manual
Background on study
Pen
Two pieces of flagging tape per kit, approximately 1 yard each (only necessary in cases where you need to identify which garbage belongs to participants out of mixed source – not necessary where you are collecting from individual carts)
Labels with participant ID number affixed to all the above materials
n Manila envelopes (postage included) if participants had the option to mail back completed diary
n Kitchen scales
B. Kit Deliveryn Most kits were hand-delivered by Community Ambassadors, either on-site at time of recruitment or to multiple
participants over the weekend to all sign-ups from the previous week
n If hand-delivered during recruitment, recruiters must be able to transport kits with them during recruitment (may be less ideal if all recruitment is done on foot)
n Kits were mailed to the following participants:
n Anyone who requested that their kits be mailed to them
n Participants in large multi-family buildings without a doorperson
n Online sign-ups who were located very far away from other participants
n Late sign-ups
6. KITCHEN DIARY RETURNS AND PROCESSINGn In Nashville/Denver, participants returned the kitchen diary via direct pickup by Community Ambassadors
n In NYC, participants were instructed to return their kitchen diary via one of the following methods:
n Mailing it back in the provided manila envelope with prepaid postage
n Scanning the diary and emailing it back to the project email address
7. KITCHEN DIARY DATA ENTRYn Kitchen diaries were entered into a spreadsheet as they were received
n Kitchen diaries were checked for completeness upon receiving. If received by email from the participant, any clarifying questions were asked (e.g. If one page was left blank, participants were asked to clarify why. Did they eat out all day? Did they eat at home but not discard anything? Were they out of town?).

Page 24 ESTIMATING QUANTITIES AND TYPES OF FOOD WASTE AT THE CITY LEVEL: TECHNICAL APPENDICES NRDC Page 25 ESTIMATING QUANTITIES AND TYPES OF FOOD WASTE AT THE CITY LEVEL: TECHNICAL APPENDICES NRDC
8. RESIDENTIAL BIN DIGS
A. Curbside Pick-Upsn Used routing software to create a route of curbside pick-ups for bin digs
n Participants on the curbside route were reminded via email or text message to set out their trash and/or compost (or keep in designated area) before a specified time the following day
n Pick-ups were done either in the early morning (Nashville/Denver) or at night (NYC), often when it was dark, so headlamps were provided to researchers
B. Multi-Family Pick-Upsn Made arrangements with property manager for pick-ups at a specified date/time
n Participants were given tags for their bags and instructed to throw away waste as usual, but to tie a tag around the bag before placing in trash chute or dumpster
9. ICI BIN DIGS
A. Participant Recruitmentn Started recruitment about 6 weeks prior to field work
n Most participants preferred a phone call to discuss what the study would entail, and then the call was used to arrange logistics as well
n Once they agreed to do the study, they received an email with a link to the survey
B. Pick-upsn Scheduling one to two weeks in advance worked best
n Information needed for scheduling pick-ups included:
n Address, including specific area where waste is located
n Access requirements, such as security check-in or gates
n On-site contact (name and phone number)
n Time and date of pick-up
n Description of bins or location where bags will be placed
n Whether there is trash and/or compost
n Information recorded when picking up waste:
n Sample ID
n Bags collected of each type
n Weight of sample, if applicable
n Subsamples collected, if applicable
n What percentage of total waste was represented by amount of waste collected (if only a portion of waste was collected for sample)

Page 26 ESTIMATING QUANTITIES AND TYPES OF FOOD WASTE AT THE CITY LEVEL: TECHNICAL APPENDICES NRDC
10. GENERAL BIN DIG SORTINGn Samples were separated by ID into different piles
n Each sample was pre-weighed
n General set-up:
n Food categories in bins on one side of the table
n Non-food categories in bins on other side of the table
n “Other” (#18) category at end of the table
n One to two people on each side of the table, focusing on the categories on their side to increase speed of sorting
n Samples were sorted according to categories (see below), then weighed bin by bin
n Weights were recorded in a spreadsheet template
n Representative photos of food categories were taken (and some included in individual facility reports)
# CATEGORIES DEFINITION GUIDES FOR WASTE SORT SAMPLE WASTE SORTING PICTURE
1 Inedible
Items not intended for human consumption (acceptable for a small amount of edible material associated with inedible material to be included).
Peels, Pits, Shells, Bones, Husks
2 Edible - Meat & Fish
Uncooked or cooked meat (with mostly edible components) unmixed with other types of food.
Beef, Pork, Poultry, Fish, includes Processed Meats, Fats. Includes small bones which are unavoidable. Meat/fish waste which is primarily bones should be placed in inedible waste category.
3 Edible - Dairy & Eggs
Solid dairy or egg products unmixed with other food types or in original form. Eggs. Milk, Cheese, Yogurt, Butter, Eggs, Sour Cream
4Edible - Vegetables/Fruits
Solid uncooked or cooked vegetables and fruits (with mostly edible components) unmixed with other types of food.
Fruits, Vegetables, Soy and Meat-Like Products, Salads/Greens, Canned Beans, Fresh Herbs. Includes whole fruits and vegetables even though they may contain some inedible parts (e.g. whole orange includes peel). Includes edible peelings (e.g. apple or potato)
5 Edible - Baked Goods
Baked goods and bread-like products unmixed with other food types or in original form, including pastries.
Bread, Tortillas, Naan, Pastry, Muffins, Cakes and Baked Desserts. From the bakery (either home-made or shop bought). No overly processed snacks.
6
Edible - Dry Foods (Grains, Pasta, Cereals)
Cooked or uncooked grains, pastas, or cereals unmixed with other food types or in original form.
Dry Pasta, Rice, Cereal, Couscous, Quinoa, Flour, Oats, Nuts, Dried Lentils and Beans, Baking Supplies
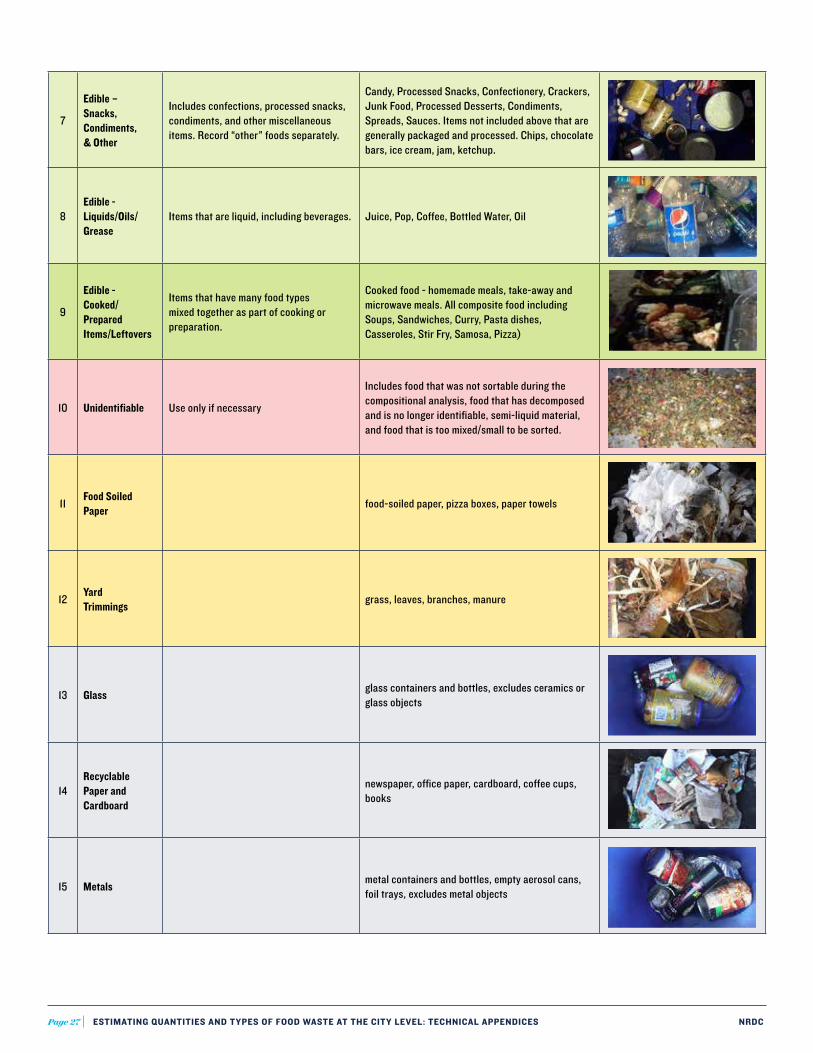
Page 26 ESTIMATING QUANTITIES AND TYPES OF FOOD WASTE AT THE CITY LEVEL: TECHNICAL APPENDICES NRDC Page 27 ESTIMATING QUANTITIES AND TYPES OF FOOD WASTE AT THE CITY LEVEL: TECHNICAL APPENDICES NRDC
7
Edible – Snacks, Condiments, & Other
Includes confections, processed snacks, condiments, and other miscellaneous items. Record “other” foods separately.
Candy, Processed Snacks, Confectionery, Crackers, Junk Food, Processed Desserts, Condiments, Spreads, Sauces. Items not included above that are generally packaged and processed. Chips, chocolate bars, ice cream, jam, ketchup.
8Edible - Liquids/Oils/Grease
Items that are liquid, including beverages. Juice, Pop, Coffee, Bottled Water, Oil
9
Edible - Cooked/Prepared Items/Leftovers
Items that have many food types mixed together as part of cooking or preparation.
Cooked food - homemade meals, take-away and microwave meals. All composite food including Soups, Sandwiches, Curry, Pasta dishes, Casseroles, Stir Fry, Samosa, Pizza)
10 Unidentifiable Use only if necessary
Includes food that was not sortable during the compositional analysis, food that has decomposed and is no longer identifiable, semi-liquid material, and food that is too mixed/small to be sorted.
11 Food Soiled Paper food-soiled paper, pizza boxes, paper towels
12 Yard Trimmings grass, leaves, branches, manure
13 Glass glass containers and bottles, excludes ceramics or glass objects
14Recyclable Paper and Cardboard
newspaper, office paper, cardboard, coffee cups, books
15 Metals metal containers and bottles, empty aerosol cans, foil trays, excludes metal objects

Page 28 ESTIMATING QUANTITIES AND TYPES OF FOOD WASTE AT THE CITY LEVEL: TECHNICAL APPENDICES NRDC
16 Rigid Plastics #1-7 bottles and packaging, excludes compostable plastics, polystyrene foam and plastic products
17 Plastic Films and Composites retail bags and wrap, non-packaging such as zipper
bags, tarps, pallet wrap
18All Other Materials and Fines
polystyrene foam, ceramics, plastic/glass/metal objects (non-packaging), compostable plastics, leather, textiles, rubber, treated wood, furniture, electronics, appliances, construction material, household hazardous waste, items <1” in size

Page 28 ESTIMATING QUANTITIES AND TYPES OF FOOD WASTE AT THE CITY LEVEL: TECHNICAL APPENDICES NRDC Page 29 ESTIMATING QUANTITIES AND TYPES OF FOOD WASTE AT THE CITY LEVEL: TECHNICAL APPENDICES NRDC
Below is additional information that pertains to data collected for the residential study, primarily data derived from kitchen diaries. (See Appendix A for more details related to the residential study.)
1. HISTOGRAMS OF DATA DISTRIBUTIONAs noted in the report, kitchen diary data results in terms of food wasted per household and per capita are not “normally distributed.” A non-normal distribution means that the data are not symmetrically distributed around the mean (see histograms of distribution below). For the statistical calculations used in our analysis, a normal distribution is a required assumption. However, because of the large sample size of our data in all three cities (see Section 2 below), the non-normal distribution is likely to have a minimal effect on the statistical analysis.1
2. SAMPLE SIZE FOR FUTURE STUDIESGiven that similar studies have not been undertaken in the United States and very few have been conducted internationally, there was not enough information prior to the study to accurately estimate the needed sample size. Specifically, the variance for total food wasted by households or per capita was not available. After completing the study, the ideal sample size was back-calculated from the study results.
The ideal sample size depends on a variety of factors, including variance, size of the population of interest, margin of error, and confidence level.
If the purpose of the study is to estimate total food wasted (both edible and inedible portions) per household, the ideal sample size for Nashville is:
n 207 households (10% margin of error, 90% confidence level)
n 297 households (10% margin of error, 95% confidence level)
1 Thomas Lumley, Paula Diehr, Scott Emerson, and Lu Chen, The Importance of the Normality Assumption in Large Public Health Data Sets, Annual Review of Public Health, Volume 23, 2002, http://www.annualreviews.org/doi/pdf/10.1146/annurev.publhealth.23.100901.140546
PER CAPITA
NUM
BER
OF H
OUSE
HOLD
S
PER CAPITA FOOD GENERATION PER WEEK (LBS)
0-.4
91-1
.49
2-2.
493-
3.49
4-4.
495-
5.49
6-6.
497-
7.49
8-8.
499-
9.49
10-10
.49
11-11.
4912
-12.4
913
-13.4
914
-14.4
914
.5-14
.99
NUM
BER
OF H
OUSE
HOLD
S
PER CAPITA FOOD GENERATION PER WEEK (LBS)
0-.4
91-1
.49
2-2.
493-
3.49
4-4.
495-
5.49
6-6.
497-
7.49
8-8.
499-
9.49
10-10
.49
11-11.
4912
-12.4
913
-13.4
914
-14.4
914
.5-14
.99
NUM
BER
OF H
OUSE
HOLD
S
PER CAPITA FOOD GENERATION PER WEEK (LBS)
0-.4
91-1
.49
2-2.
493-
3.49
4-4.
495-
5.49
6-6.
497-
7.49
8-8.
499-
9.49
10-10
.49
11-11.
4912
-12.4
913
-13.4
914
-14.4
914
.5-14
.99
0-.4
9.5
-.99
1-1.4
91.5
-1.99
2-2.
492.
5-2.
993-
3.49
3.5-
3.99
4-4.
494.
5-4.
995-
5.49
5.5-
5.99
6-6.
496.
5-6.
997-
7.49
7.5-7.
998-
8.49
8.5-
8.99
9-9.
499.
5-9.
9910
-10.4
910
.5-10
.99
11-11.
4911.
5-11.
9912
-12.4
912
.5-12
.99
13-13
.49
13.5
-13.9
914
-14.4
914
.5-14
.99
0
2
4
6
8
10
0
5
10
15
20
25
30
0
10
20
30
40
50
60
70
80
Appendix D: Kitchen Diary Background for Analysis
NASHVILLE PER CAPITA DATA DISTRIBUTION NYC PER CAPITA DATA DISTRIBUTIONDENVER PER CAPITA DATA DISTRIBUTION

Page 30 ESTIMATING QUANTITIES AND TYPES OF FOOD WASTE AT THE CITY LEVEL: TECHNICAL APPENDICES NRDC
If the purpose of the study is to specifically estimate edible food wasted per household, the ideal sample size for Nashville is:
n 258 households (10% margin of error, 90% confidence level)
n 370 households (10% margin of error, 95% confidence level)
For this study, 68 Nashville households completed the kitchen diary and 76 completed the surveys.
If the purpose of the study is to estimate total food wasted (both edible and inedible portions) per household, the ideal sample size for Denver is:
n 206 households (10% margin of error, 90% confidence level)
n 294 households (10% margin of error, 95% confidence level)
If the purpose of the study is to specifically estimate edible food wasted per household, the ideal sample size for Denver is:
n 283 households (10% margin of error, 90% confidence level)
n 405 households (10% margin of error, 95% confidence level)
For this study, 198 Denver households completed the kitchen diary and 222 completed the surveys.
If the purpose of the study is to estimate total food wasted (both edible and inedible portions) per household, the ideal sample size for New York City is:
n 228 households (10% margin of error, 90% confidence level)
n 325 households (10% margin of error, 95% confidence level)
If the purpose of the study is to specifically estimate edible food wasted per household, the ideal sample size for New York City is:
n 401 households (10% margin of error, 90% confidence level)
n 573 households (10% margin of error, 95% confidence level)
For this study, 347 New York City households completed the kitchen diary and 428 completed the surveys.
3. LIST OF STANDARDIZED FOOD TYPES USED IN KITCHEN DIARY ANALYSISEach kitchen diary entry had a short description of the food or beverage wasted that was filled in by participants. To determine the most wasted foods (see Section 3.4.5 of the main report), the description given by participants was used by researchers to code each entry with a standardized food name. Entries were separated first into the primary classification of either “edible food” or “inedible parts”; items considered “edible food” were split into two groups: 1) typically edible and 2) questionably edible (see Appendix A for more information on definitions related to edibility). The lists below include all standardized food names for all items tracked in kitchen diaries, separated into the three secondary classifications (inedible parts, questionably edible, and typically edible).

Page 30 ESTIMATING QUANTITIES AND TYPES OF FOOD WASTE AT THE CITY LEVEL: TECHNICAL APPENDICES NRDC Page 31 ESTIMATING QUANTITIES AND TYPES OF FOOD WASTE AT THE CITY LEVEL: TECHNICAL APPENDICES NRDC
List of “Inedible Parts”Below is the list of materials identified in the kitchen diaries and bin digs that were considered “inedible parts” (the list is the same for all three cities). “Inedible parts” were determined to be those which are not typically consumed in the United States (e.g. banana peels) and/or whether significant skill or effort would be required to render this part of food “edible” (e.g. citrus rinds). (See Appendix A for more information.)
• Artichoke leaves (edible parts removed)
• Avocado skins/pits
• Banana/plantain peels
• Bean shells (tough shells including fava and edamame)
• Pepper cores/stems
• Bones
• Citrus rinds
• Coffee grounds
• Corn cobs/husks
• Date pits
• Dragon fruit skin
• Eggshells
• Eggplant tops
• Garlic skins
• Ginger peels
• Hard stems & stalks (including tomato, apple, bean)
• Lychee skins/pits
• Melon skins/seeds
• Okra tops
• Onion skins/root end
• Papaya seeds/peels
• Pineapple skins/tops
• Pomegranate peels
• Shells (mollusks and nut)
• Squash skins/seeds (including butternut and kabocha squash)
• Stone fruit pits
• Strawberry tops
• Tea bags
• Watermelon rinds
List of “Questionably Edible” Food ItemsBelow is the list of materials identified in the kitchen diaries and bin digs that were considered “questionably edible” (the list is the same for all three cities). “Questionably edible” is defined as items that can be safely eaten, but may not be considered edible by a portion of the population due to culture and preference. These items might also require additional processing/cooking to make them desirable to eat. (Note that these items were given a primary classification of “edible food” for this study. See Appendix A for more information.)
• Apple cores/skin
• Asparagus ends
• Broccoli stalks
• Cabbage cores
• Carrot peels/tops
• Cauliflower stalks
• Cheese rinds
• Chive/green onion/scallion ends
• Celery tops
• Cucumber peels
• Herb stems (e.g. cilantro/parsley)
• Leek ends
• Lettuce cores
• Kale stalks
• Kiwi peels
• Meat/fish parts (fat/skin)
• Mushroom stems
• Pear cores/skin
• Pickle juice
• Pineapple core
• Potato peels
• Radish leaves
• Root vegetable peels
• Summer squash peels
• Tomato core/skin

Page 32 ESTIMATING QUANTITIES AND TYPES OF FOOD WASTE AT THE CITY LEVEL: TECHNICAL APPENDICES NRDC
List of “Typically Edible” Food ItemsBelow is the list of materials identified in the kitchen diaries and bin digs that were considered “typically edible” (the list varies for all three cities). “Typically edible” is defined as intended for human consumption and not generally considered inedible. (See Appendix A for more information.) Some items were mixtures of multiple food types, so they were coded in one of three ways:
1. Mixed food items appearing frequently, such as salad, pasta, pizza, and sandwich, were coded as such (e.g. sandwich);
2. Produce-based mixed food items that were unprepared or uncooked and that appeared infrequently (e.g. vegetable scraps of unknown vegetable origin) were categorized as “mixed fruits & vegetables”; and
3. Mixed food items that were cooked or prepared and that appeared infrequently (e.g. lasagna, squash casserole) were categorized as “non-meat dish,” “poultry dish,” “seafood dish,” or “red meat dish.”
“Unidentifiable” was used only in cases where food did not meet any of the criteria above and it could not be determined if food was non-meat-based or meat-based.
Nashville “Typically Edible” Foods
• almond milk
• apple
• artichoke
• arugula
• asparagus
• avocado
• banana
• beans
• beef
• beer
• beet
• berries
• bread
• broccoli
• brownie
• brussels sprout
• burrito
• butter
• cabbage
• cake
• cantaloupe
• carrot
• cauliflower
• celery
• cereal
• cheese
• chicken
• chickpeas
• chips
• chocolate
• coconut milk
• coffee
• cookie
• corn
• couscous
• cracker
• cranberry
• cream cheese
• cucumber
• donut
• egg
• eggplant
• fig
• fish
• garlic
• ginger
• granola
• grape
• grapefruit
• green bean
• greens
• grits
• guacamole
• herb
• hot dog
• ice cream
• jicama
• kale
• kiwi
• kohlrabi
• leek
• lemon
• lentils
• lettuce
• lime
• mango
• melon
• milk
• mixed fruits & vegetables
• muffin
• mushroom
• non-meat dish
• nutritional yeast
• nuts
• oatmeal
• oil
• okra
• olive
• onion
• orange
• pancake
• parsnip
• pasta
• pastry
• peach
• pear
• pepper
• pineapple
• pizza
• pomegranate
• popcorn
• pork
• potato
• poultry dish
• pumpkin
• radish
• raisin
• raspberry
• red meat dish
• rice
• salad
• sandwich
• sauce
• seafood dish
• seitan
• shellfish
• soda
• soup
• sour cream
• spinach
• squash
• strawberry
• sugar
• tea
• tomato
• tortilla
• turkey
• turnip
• unidentifiable
• waffle
• watermelon
• wine
• yogurt
• zucchini

Page 32 ESTIMATING QUANTITIES AND TYPES OF FOOD WASTE AT THE CITY LEVEL: TECHNICAL APPENDICES NRDC Page 33 ESTIMATING QUANTITIES AND TYPES OF FOOD WASTE AT THE CITY LEVEL: TECHNICAL APPENDICES NRDC
Denver “Typically Edible” Foods
• alfalfa sprouts
• almond butter
• almond milk
• apple
• artichoke
• arugula
• asparagus
• avocado
• baby formula
• bamboo shoot
• banana
• beans
• beef
• beer
• beet
• berries
• bread
• broccoli
• brussels sprouts
• burrito
• butter
• cabbage
• cactus pear
• cake
• candy
• cantaloupe
• caramel
• carrot
• cauliflower
• celery
• cereal
• chard
• cheese
• chicken
• chili
• chips
• coconut water
• coffee
• cookie
• corn
• cottage cheese
• couscous
• crackers
• cream cheese
• cucumber
• edamame
• egg
• eggplant
• elk
• fennel
• fish
• flour
• garbanzo beans
• garlic
• ginger
• goat
• granola
• grape
• grapefruit
• green bean
• greens
• guacamole
• herb
• ice cream
• jalapeno
• kale
• kiwi
• kohlrabi
• lamb
• lemon
• lettuce
• lime
• mango
• margarine
• milk
• mixed fruits & vegetables
• mushroom
• non-meat dish
• nuts
• oatmeal
• oil
• olive
• onion
• orange
• pancake
• papaya
• parsley
• passionfruit
• pasta
• pastry
• peach
• peanut butter
• pear
• peas
• pepper
• persimmon
• pheasant
• pineapple
• pistachio
• pizza
• plantain
• plum
• pomegranate
• popcorn
• pork
• potato
• poultry dish
• pretzels
• pumpkin
• radicchio
• radish
• raisin
• red meat dish
• rice
• salad
• salt
• sandwich
• sauce
• seafood dish
• seaweed
• shrimp
• soda
• soup
• sour cream
• soy milk
• spinach
• squash
• sugar
• taro
• tea
• tomato
• tortilla
• turkey
• turnip
• unidentifiable
• vinegar
• waffle
• watermelon
• wine
• yogurt
• zucchini

Page 34 ESTIMATING QUANTITIES AND TYPES OF FOOD WASTE AT THE CITY LEVEL: TECHNICAL APPENDICES NRDC
NYC “Typically Edible” Foods
• apple
• artichoke
• arugula
• asparagus
• avocado
• bamboo shoot
• banana
• beans
• beef
• beer
• beet
• berry
• bok choy
• bread
• broccoli
• brussels sprout
• burrito
• butter
• cabbage
• cake
• candy
• capers
• carrot
• cauliflower
• celery
• cereal
• cereal & milk
• cheese
• cherry
• chicken
• chili
• chinese yam
• chips
• chocolate
• coconut
• coffee
• collard greens
• cookie
• corn
• couscous
• cracker
• cream cheese
• crepe
• cucumber
• dates
• dragon fruit
• dry spices
• duck
• edamame
• egg
• eggplant
• endive
• fig
• fish
• flour
• frosting
• garbanzos
• garlic
• ginger
• grape
• grapefruit
• green bean
• guacamole
• herbs
• honey
• ice cream
• jackfruit
• juice
• kale
• kiwi
• lamb
• leek
• lemon
• lentil
• lettuce
• lime
• lotus
• lychee
• mango
• melon
• milk
• mixed fruits & vegetables
• muffin
• mushroom
• nectarine
• non-meat dish
• nuts
• oatmeal
• oil
• okra
• olive
• onion
• orange
• pancake
• papaya
• parsnip
• pasta
• pastry
• peach
• pear
• peas
• pepper
• persimmon
• pickle
• pineapple
• pizza
• plum
• pomegranate
• pomelo
• popcorn
• pork
• potato
• poultry dish
• pretzel
• prune
• pudding
• pumpkin
• quinoa
• radish
• red currant
• red meat dish
• rice
• salad
• sandwich
• sauce
• seafood dish
• seaweed
• seeds
• smoothie
• soda
• soup
• sour cream
• soursop
• soybean
• spinach
• squash
• sugar
• swiss chard
• tamarind
• taro
• tea
• tomato
• tortilla
• turkey
• turnip
• unidentifiable
• vinegar
• waffle
• watercress
• wheat
• wine
• yogurt
• yucca
• zucchini

Page 34 ESTIMATING QUANTITIES AND TYPES OF FOOD WASTE AT THE CITY LEVEL: TECHNICAL APPENDICES NRDC Page 35 ESTIMATING QUANTITIES AND TYPES OF FOOD WASTE AT THE CITY LEVEL: TECHNICAL APPENDICES NRDC
Appendix E: Kitchen Diary Data
FOOD WASTED BY HOUSEHOLDS (CORRECTED FOR UNDERREPORTING)
NASHVILLE DENVER NYCWEIGHTED AVERAGE
ALL CITIES
AVERAGE TOTAL POUNDS PER HOUSEHOLD 7.5 9.6 8.4 8.7
AVERAGE EDIBLE POUNDS PER HOUSEHOLD 4.6 7.5 5.4 6.0
AVERAGE TOTAL POUNDS PER CAPITA 3.4 4.2 3.2 3.5
AVERAGE EDIBLE POUNDS PER CAPITA 2.1 3.2 2.1 2.5
FOOD WASTED BY EDIBILITY
NASHVILLE DENVER NYC TOTAL
# LB % # LB % # LB % # LB %
Typically Edible 199.1 56% 848.2 66% 1017.1 51% 2064.4 57%
Inedible 130.7 37% 317.1 25% 695.4 35% 1143.2 32%
Questionably Edible 20.2 6% 125.8 10% 264.5 13% 410.4 11%
(blank) 3.5 1% 0.0 0% 0.0 0% 3.5 0%
Total 353.6 100% 1291.0 100% 1977.1 100% 3621.6 100%
FOOD WASTED BY CATEGORY
NASHVILLE DENVER NYC TOTAL
# LB % # LB % # LB % # LB %
Inedible 130.7 37% 317.1 25% 695.4 35% 1143.2 32%
Meat & Fish (edible) 8.6 2% 71.5 6% 61.9 3% 141.9 4%
Dairy & Eggs (edible) 18.5 5% 71.4 6% 77.9 4% 167.8 5%
Fruits & Vegetables (edible) 84.3 24% 371.8 29% 522.7 26% 978.7 27%
Baked Goods (edible) 9.9 3% 67.1 5% 78.8 4% 155.8 4%
Dry Food (edible) 4.1 1% 5.9 0% 20.2 1% 30.2 1%
Snacks & Condiments (edible) 11.9 3% 30.6 2% 28.9 1% 71.3 2%
Liquids, Oils, & Grease (edible) 33.6 10% 111.2 9% 81.7 4% 226.5 6%
Prepared Foods & Leftovers (edible) 47.7 13% 239.9 19% 409.7 21% 697.2 19%
Unidentifiable 4.4 1% 4.5 0% 0.0 0% 8.9 0%
Total 353.6 100% 1291.0 100% 1977.1 100% 3621.6 100%

Page 36 ESTIMATING QUANTITIES AND TYPES OF FOOD WASTE AT THE CITY LEVEL: TECHNICAL APPENDICES NRDC
FOOD WASTED BY DISCARD DESTINATION
NASHVILLE DENVER NYC TOTAL
# LB % # LB % # LB % # LB %
Trash 181.4 52% 696.2 54% 1033.4 52% 1911.1 53%
Home Compost 145.6 11% 97.5 5% 243.0 7%
Curbside Compost 171.8 13% 444.3 22% 616.1 17%
Compost (unspecified) 97.0 28% 97.0 3%
Compost Dropoff 166.6 8% 166.6 5%
Down the Drain 51.8 15% 207.6 16% 141.0 7% 400.4 11%
Feeding Animals 12.1 3% 31.0 2% 21.7 1% 64.9 2%
Other 3.2 1% 1.8 0% 22.4 1% 27.4 1%
(blank) 4.6 1% 37.0 3% 50.2 3% 91.8 3%
Total 350.1 100% 1291.0 100% 1977.1 100% 3618.2 100%
All Compost (above combined) 97.0 28% 317.4 25% 708.3 36% 1122.6 31%
FOOD WASTED BY LOSS REASON
NASHVILLE DENVER NYC TOTAL
# LB % # LB % # LB % # LB %
Improperly Cooked 3.2 1% 2.8 0% 10.8 1% 16.8 0%
Left Out Too Long 24.8 7% 98.8 8% 134.7 7% 258.3 7%
Don't Want As Leftovers 37.7 11% 149.7 12% 206.8 10% 394.1 11%
Past Date on Label 9.5 3% 54.3 4% 76.1 4% 140.0 4%
Too Little to Save 16.1 5% 59.6 5% 84.5 4% 160.3 4%
Moldy or Spoiled 70.5 20% 306.1 24% 334.0 17% 710.6 20%
Doesn't Taste Good 21.6 6% 59.2 5% 85.8 4% 166.7 5%
Inedible Parts 144.7 41% 470.8 36% 978.8 50% 1594.4 44%
Other or Multiple Reasons 18.0 5% 28.7 2% 43.6 2% 90.2 2%
(blank) 9.3 3% 61.0 5% 21.8 1% 92.1 3%
Total 355.4 100% 1291.0 100% 1977.1 100% 3623.5 100%

Page 36 ESTIMATING QUANTITIES AND TYPES OF FOOD WASTE AT THE CITY LEVEL: TECHNICAL APPENDICES NRDC Page 37 ESTIMATING QUANTITIES AND TYPES OF FOOD WASTE AT THE CITY LEVEL: TECHNICAL APPENDICES NRDC
FOOD WASTED BY MEAL
NASHVILLE DENVER NYC TOTAL
# LB % # LB % # LB % # LB %
Breakfast 101.6 29% 286.4 22% 404.7 20% 792.7 22%
Lunch 29.8 8% 133.8 10% 267.0 14% 430.6 12%
Dinner 99.5 28% 431.0 33% 619.2 31% 1149.6 32%
Snacks 31.7 9% 92.3 7% 216.6 11% 340.6 9%
Other & Multiple Meals 90.9 26% 347.6 27% 469.6 24% 908.1 25%
Total 353.6 100% 1291.0 100% 1977.1 100% 3621.6 100%

Page 38 ESTIMATING QUANTITIES AND TYPES OF FOOD WASTE AT THE CITY LEVEL: TECHNICAL APPENDICES NRDC
Appendix F: Survey 1 Data
Q1. WHICH OF THE FOLLOWING BEST DESCRIBES WHO LIVES IN YOUR HOUSEHOLD?
# NASHVILLE % NASHVILLE # DENVER % DENVER # NYC % NYC # TOTAL % TOTAL
FAMILY OR RELATED INDIVIDUALS 48 63% 147 66% 313 73% 508 70%
I LIVE ALONE 16 21% 47 21% 68 16% 131 18%
NON-RELATED INDIVIDUALS (E.G. ROOMMATES)
12 16% 26 12% 45 11% 83 11%
OTHER 0 0% 2 1% 2 <1% 4 1%
TOTAL 76 100% 222 100% 428 100% 726 100%
Q2. HOW MANY PEOPLE LIVE IN YOUR HOUSEHOLD, INCLUDING YOURSELF?
# NASHVILLE % NASHVILLE # DENVER % DENVER # NYC % NYC # TOTAL % TOTAL
1 16 21% 48 22% 71 17% 135 19%
2 26 34% 78 35% 117 27% 221 30%
3 14 18% 48 22% 87 20% 149 21%
4 12 16% 26 12% 94 22% 132 18%
5 3 4% 10 5% 30 7% 43 6%
6 3 4% 7 3% 12 3% 22 3%
7 0 0% 2 1% 7 2% 9 1%
8 0 0% 3 1% 1 0% 4 1%
9 0 0% 0 0% 1 0% 1 0%
10 0 0% 0 0% 1 0% 1 0%
(BLANK) 2 3% 0 0% 7 2% 9 1%
TOTAL 76 100% 222 100% 428 100% 726 100%
Q3. WHAT IS THE AGE OF EACH HOUSEHOLD MEMBER (YEARS)?
# NASHVILLE % NASHVILLE # DENVER % DENVER # NYC % NYC # TOTAL AVG %/AGE
NUMBER OF HOUSEHOLDS WITH CHILDREN (CHILDREN = UNDER 18 YEARS OF AGE)
25 33% 69 31% 155 36% 249 34%
AVERAGE AGE OF OLDEST HOUSEHOLD MEMBER 38.7 46 48.4 46.65
AVERAGE AGE OF ALL PARTICIPANTS OVER 18 YEARS OF AGE
3744 43.5 42.97

Page 38 ESTIMATING QUANTITIES AND TYPES OF FOOD WASTE AT THE CITY LEVEL: TECHNICAL APPENDICES NRDC Page 39 ESTIMATING QUANTITIES AND TYPES OF FOOD WASTE AT THE CITY LEVEL: TECHNICAL APPENDICES NRDC
Q4. WHAT IS THE GENDER OF EACH HOUSEHOLD MEMBER?
NASHVILLEPRIMARY RESPONDENT ALL HOUSEHOLD MEMBERS
# % # %
MALE 19 25% 85 43%
FEMALE 57 75% 111 56%
TRANSGENDER 0 0% 1 1%
NEITHER MALE, FEMALE, OR TRANSGENDER 0 0% 1 1%
(BLANK) 0 0% 0 0%
TOTAL 76 100% 198 100%
DENVERPRIMARY RESPONDENT ALL HOUSEHOLD MEMBERS
# % # %
MALE 79 36% 274 47%
FEMALE 140 63% 303 52%
TRANSGENDER 1 0% 1 0%
NEITHER MALE, FEMALE, OR TRANSGENDER 0 0% 1 0%
(BLANK) 2 1% 2 0%
TOTAL 222 100% 581 100%
NYCPRIMARY RESPONDENT ALL HOUSEHOLD MEMBERS
# % # %
MALE 160 37% 516 44%
FEMALE 238 56% 631 54%
TRANSGENDER 2 0% 2 0%
NEITHER MALE, FEMALE, OR TRANSGENDER 1 0% 1 0%
(BLANK) 27 6% 27 2%
TOTAL 428 100% 1177 100%
TOTALPRIMARY RESPONDENT ALL HOUSEHOLD MEMBERS
# % # %
MALE 258 36% 875 45%
FEMALE 435 60% 1045 53%
TRANSGENDER 3 0% 4 0%
NEITHER MALE, FEMALE, OR TRANSGENDER 1 0% 3 0%
(BLANK) 29 4% 29 1%
TOTAL 726 100% 1956 100%

Page 40 ESTIMATING QUANTITIES AND TYPES OF FOOD WASTE AT THE CITY LEVEL: TECHNICAL APPENDICES NRDC
Q5. WHAT IS THE EMPLOYMENT OF EACH HOUSEHOLD MEMBER?
NASHVILLEPRIMARY RESPONDENT ALL HOUSEHOLD MEMBERS
# % # %
FULL-TIME 44 58% 86 52%
PART-TIME 10 13% 19 12%
STUDENT 12 16% 42 26%
RETIRED 2 3% 3 2%
UNEMPLOYED 5 7% 14 9%
(BLANK) 3 4% 0 0%
TOTAL 76 100% 164 100%
DENVERPRIMARY RESPONDENT ALL HOUSEHOLD MEMBERS
# % # %
FULL-TIME 128 58% 261 49%
PART-TIME 26 12% 53 10%
STUDENT 26 12% 111 21%
RETIRED 5 2% 48 9%
UNEMPLOYED 29 13% 63 12%
(BLANK) 8 4% 2 0%
TOTAL 222 100% 538 100%
NYCPRIMARY RESPONDENT ALL HOUSEHOLD MEMBERS
# % # %
FULL-TIME 195 46% 458 41%
PART-TIME 51 12% 109 10%
STUDENT 44 10% 298 27%
RETIRED 46 11% 86 8%
UNEMPLOYED 45 11% 120 11%
(BLANK) 47 11% 47 4%
TOTAL 428 100% 1118 100%
TOTALPRIMARY RESPONDENT ALL HOUSEHOLD MEMBERS
# % # %
FULL-TIME 367 51% 805 44%
PART-TIME 87 12% 181 10%
STUDENT 82 11% 451 25%
RETIRED 53 7% 137 8%
UNEMPLOYED 79 11% 197 11%
(BLANK) 58 8% 49 3%
TOTAL 726 100% 1820 100%

Page 40 ESTIMATING QUANTITIES AND TYPES OF FOOD WASTE AT THE CITY LEVEL: TECHNICAL APPENDICES NRDC Page 41 ESTIMATING QUANTITIES AND TYPES OF FOOD WASTE AT THE CITY LEVEL: TECHNICAL APPENDICES NRDC
Q6. WHAT IS THE ETHNICITY/RACE OF EACH HOUSEHOLD MEMBER?
HOUSEHOLD MAKE-UP BY ETHNICITY/RACE
# NASHVILLE % NASHVILLE # DENVER % DENVER # NYC % NYC # TOTAL % TOTAL
WHITE (ALL) 52 68% 133 60% 199 46% 384 53%
BLACK OR AFRICAN-AMERICAN (ALL) 8 11% 8 4% 40 9% 56 8%
AMERICAN INDIAN/ALASKAN NATIVE (ALL) 0 0% 1 0% 0 0% 1 0%
HISPANIC/LATINO (ALL) 0 0% 28 13% 15 4% 43 6%
ASIAN OR PACIFIC ISLANDER (ALL) 1 1% 3 1% 46 11% 50 7%
MIXED RACE HOUSEHOLD 11 14% 41 18% 84 20% 136 19%
(BLANK) 4 5% 8 4% 44 10% 56 8%
TOTAL 76 100% 222 100% 428 100% 726 100%
NUMBER OF HOUSEHOLDS WITH AT LEAST ONE MEMBER IDENTIFYING AS THE FOLLOWING
# NASHVILLE % NASHVILLE # DENVER % DENVER # NYC % NYC # TOTAL % TOTAL
WHITE 62 82% 165 74% 258 60% 485 67%
BLACK OR AFRICAN-AMERICAN 11 14% 20 9% 63 15% 94 13%
AMERICAN INDIAN/ALASKAN NATIVE 2 3% 8 4% 4 1% 14 2%
HISPANIC/LATINO 6 8% 47 21% 32 7% 85 12%
PACIFIC ISLANDER 0 0% 0 0% 4 1% 4 1%
ASIAN 5 7% 11 5% 79 18% 95 13%
OTHER 0 0% 0 0% 27 6% 27 4%
Q7. WHAT IS THE PRIMARY LANGUAGE SPOKEN AT HOME?
# NASHVILLE % NASHVILLE # DENVER % DENVER # NYC % NYC # TOTAL % TOTAL
ENGLISH 66 87% 176 79% 287 67% 529 73%
SPANISH 1 1% 6 3% 3 1% 10 1%
CHINESE 0 0% 0 0% 17 4% 17 2%
MORE THAN ONE LANGUAGE SPOKEN AT HOME
0 0% 6 3% 29 7% 35 5%
OTHER 3 4% 0 0% 21 5% 24 3%
(BLANK) 6 8% 34 15% 71 17% 111 15%
TOTAL 76 100% 222 100% 428 100% 726 100%

Page 42 ESTIMATING QUANTITIES AND TYPES OF FOOD WASTE AT THE CITY LEVEL: TECHNICAL APPENDICES NRDC
Q8. WHAT IS THE COUNTRY OF ORIGIN OF EACH HOUSEHOLD MEMBER?
# NASHVILLE % NASHVILLE # DENVER % DENVER # NYC % NYC # TOTAL % TOTAL
HOUSEHOLDS WITH MEMBER BORN OUTSIDE OF UNITED STATES
12 16% 40 18% 160 37% 212 29%
HOUSEHOLDS WITH NO MEMBERS BORN OUTSIDE OF UNITED STATES
53 70% 128 58% 173 40% 354 49%
(BLANK) 11 14% 54 24% 95 22% 160 22%
TOTAL 76 100% 222 100% 428 100% 726 100%
Q9. WHAT IS THE EDUCATION LEVEL OF EACH HOUSEHOLD MEMBER?
HIGHEST LEVEL OF EDUCATION ACHIEVED BY ANY HOUSEHOLD MEMBER
# NASHVILLE % NASHVILLE # DENVER % DENVER # NYC % NYC # TOTAL % TOTAL
K-12 1 1% 4 2% 4 1% 9 1%
HIGH SCHOOL/GED 3 4% 9 4% 29 7% 41 6%
SOME HIGHER EDUCATION 4 5% 32 14% 44 10% 80 11%
BACHELOR'S DEGREE 31 41% 64 29% 90 21% 185 25%
GRADUATE DEGREE 24 32% 57 26% 148 35% 229 32%
PROFESSIONAL DEGREE 6 8% 27 12% 49 11% 82 11%
(BLANK) 7 9% 29 13% 64 15% 100 14%
TOTAL 76 100% 222 100% 428 100% 726 100%
Q10. WHAT IS YOUR APPROXIMATE ANNUAL HOUSEHOLD INCOME?
# NASHVILLE % NASHVILLE # DENVER % DENVER # NYC % NYC # TOTAL % TOTAL
LESS THAN $25K 5 7% 22 10% 58 14% 85 12%
$25K-$35K 10 13% 17 8% 27 6% 54 7%
$35K-$45K 9 12% 22 10% 26 6% 57 8%
$45K-$55K 4 5% 13 6% 20 5% 37 5%
$55K-$65K 10 13% 13 6% 22 5% 45 6%
$65K-$75K 9 12% 16 7% 20 5% 45 6%
$75K-$85K 6 8% 11 5% 22 5% 39 5%
$85K-$95K 3 4% 20 9% 25 6% 48 7%
$95K AND OVER 20 26% 84 38% 192 45% 296 41%
(BLANK) 0 0% 4 2% 16 4% 20 3%
TOTAL 76 100% 222 100% 428 100% 726 100%

Page 42 ESTIMATING QUANTITIES AND TYPES OF FOOD WASTE AT THE CITY LEVEL: TECHNICAL APPENDICES NRDC Page 43 ESTIMATING QUANTITIES AND TYPES OF FOOD WASTE AT THE CITY LEVEL: TECHNICAL APPENDICES NRDC
Q11. APPROXIMATELY HOW MUCH MONEY DOES YOUR HOUSEHOLD SPEND ON FOOD AND BEVERAGES EATEN AT HOME EACH WEEK? (DO NOT INCLUDE FOOD EATEN AWAY FROM HOME)
# NASHVILLE % NASHVILLE # DENVER % DENVER # NYC % NYC # TOTAL % TOTAL
$50 OR LESS 10 13% 34 15% 44 10% 88 12%
$51-$100 29 38% 65 29% 122 29% 216 30%
$101-$150 20 26% 68 31% 107 25% 195 27%
$151-$200 9 12% 28 13% 73 17% 110 15%
$201-$250 6 8% 14 6% 35 8% 55 8%
$251-$300 0 0% 6 3% 26 6% 32 4%
MORE THAN $301 1 1% 6 3% 11 3% 18 2%
(BLANK) 1 1% 1 0% 10 2% 12 2%
TOTAL 76 100% 222 100% 428 100% 726 100%
Q12. APPROXIMATELY HOW MUCH MONEY DOES YOUR HOUSEHOLD SPEND ON FOOD AND BEVERAGES EATEN AWAY FROM HOME EACH WEEK? (DO NOT INCLUDE FOOD EATEN AT HOME)
# NASHVILLE % NASHVILLE # DENVER % DENVER # NYC % NYC # TOTAL % TOTAL
$50 OR LESS 31 41% 96 43% 151 35% 278 38%
$51-$100 30 39% 76 34% 126 29% 232 32%
$101-$150 9 12% 26 12% 69 16% 104 14%
$151-$200 2 3% 12 5% 31 7% 45 6%
$201-$250 1 1% 7 3% 25 6% 33 5%
$251-$300 0 0% 1 0% 7 2% 8 1%
MORE THAN $301 0 0% 1 0% 7 2% 8 1%
(BLANK) 3 4% 3 1% 12 3% 18 2%
TOTAL 76 100% 222 100% 428 100% 726 100%

Page 44 ESTIMATING QUANTITIES AND TYPES OF FOOD WASTE AT THE CITY LEVEL: TECHNICAL APPENDICES NRDC
Q13. ARE YOU FAMILIAR WITH THE ISSUES RELATED TO WASTED FOOD? IF YES, HOW DID YOU LEARN ABOUT IT?
FAMILIAR WITH ISSUES RELATED TO WASTED FOOD? # NASHVILLE % NASHVILLE # DENVER % DENVER # NYC % NYC # TOTAL % TOTAL
YES 53 70% 158 71% 315 74% 526 72%
NO 21 28% 60 27% 105 25% 186 26%
(BLANK) 2 3% 4 2% 8 2% 14 2%
TOTAL 76 100% 222 100% 428 100% 726 100%
Q13. ARE YOU FAMILIAR WITH THE ISSUES RELATED TO WASTED FOOD? IF YES, HOW DID YOU LEARN ABOUT IT? (CONTINUED)
HOW DID HOUSEHOLDS LEARN ABOUT WASTED FOOD? # NASHVILLE % NASHVILLE # DENVER % DENVER # NYC % NYC # TOTAL % TOTAL
SOCIAL MEDIA 24 32% 73 33% 152 36% 249 34%
ONLINE AD 6 8% 8 4% 30 7% 44 6%
BILLBOARD 0 0% 1 0% 11 3% 12 2%
RADIO 12 16% 35 16% 63 15% 110 15%
WORD OF MOUTH 22 29% 61 27% 146 34% 229 32%
DIRECT EMAIL 7 9% 4 2% 20 5% 31 4%
DOCUMENTARY 21 28% 63 28% 124 29% 208 29%
TELEVISION 15 20% 68 31% 144 34% 227 31%
BOOK 10 13% 18 8% 67 16% 95 13%
CLASS/SCHOOLING 9 12% 42 19% 94 22% 145 20%
SHOWING OF “JUST EAT IT” IN NASHVILLE 9 12% N/A N/A N/A N/A 9 1%
OTHER 11 14% 46 21% 93 22% 150 21%
Q14. WHERE, HOW FREQUENTLY, AND USING WHAT MODE OF TRANSPORTATION DOES YOUR HOUSEHOLD NORMALLY PURCHASE FOOD?
NASHVILLE
LESS THAN ONCE PER WEEK
1-2 TIMES PER WEEK3 OR MORE TIMES PER
WEEK TOTAL NASHVILLE
# # # # % OF HH
SUPERSTORE 25 3 2 30 39%
GROCERY STORE 10 50 15 75 99%
CORNER STORE/CONVENIENCE STORE 15 4 4 23 30%
FARMERS’ MARKET 42 8 1 51 67%
FOOD PANTRY 0 0 0 0 0%
BACKYARD GARDEN 11 8 6 25 33%
LOCAL GARDEN (NOT AT YOUR HOUSEHOLD) 6 0 1 7 9%
COMMUNITY SUPPORTED AGRICULTURE 5 1 0 6 8%
ONLINE DELIVERY SERVICE 7 1 0 8 11%

Page 44 ESTIMATING QUANTITIES AND TYPES OF FOOD WASTE AT THE CITY LEVEL: TECHNICAL APPENDICES NRDC Page 45 ESTIMATING QUANTITIES AND TYPES OF FOOD WASTE AT THE CITY LEVEL: TECHNICAL APPENDICES NRDC
Q14. WHERE, HOW FREQUENTLY, AND USING WHAT MODE OF TRANSPORTATION DOES YOUR HOUSEHOLD NORMALLY PURCHASE FOOD? (CONTINUED)
DENVER
LESS THAN ONCE PER WEEK
1-2 TIMES PER WEEK3 OR MORE TIMES PER
WEEK TOTAL DENVER
# # # # % OF HH
SUPERSTORE 97 36 2 135 61%
GROCERY STORE 27 131 53 211 95%
CORNER STORE/CONVENIENCE STORE 55 28 4 87 39%
FARMERS’ MARKET 73 13 2 88 40%
FOOD PANTRY 26 5 2 33 15%
BACKYARD GARDEN 24 29 24 77 35%
LOCAL GARDEN (NOT AT YOUR HOUSEHOLD) 25 4 1 30 14%
COMMUNITY SUPPORTED AGRICULTURE 19 5 2 26 12%
ONLINE DELIVERY SERVICE 39 11 0 50 23%
NYC
LESS THAN ONCE PER WEEK
1-2 TIMES PER WEEK3 OR MORE TIMES PER
WEEK TOTAL NYC
# # # # % OF HH
SUPERSTORE 120 41 23 184 43%
GROCERY STORE 52 175 147 374 87%
CORNER STORE/CONVENIENCE STORE 93 96 54 243 57%
FARMERS’ MARKET 120 41 13 174 41%
FOOD PANTRY 21 4 5 30 7%
BACKYARD GARDEN 31 5 13 49 11%
LOCAL GARDEN (NOT AT YOUR HOUSEHOLD) 26 3 2 31 7%
COMMUNITY SUPPORTED AGRICULTURE 28 6 3 37 9%
ONLINE DELIVERY SERVICE 66 32 11 109 25%
TOTAL
LESS THAN ONCE PER WEEK
1-2 TIMES PER WEEK3 OR MORE TIMES PER
WEEK TOTAL ALL CITIES
# # # # % OF HH
SUPERSTORE 242 80 27 349 48%
GROCERY STORE 89 356 215 660 91%
CORNER STORE/CONVENIENCE STORE 163 128 62 353 49%
FARMERS’ MARKET 235 62 16 313 43%
FOOD PANTRY 47 9 7 63 9%
BACKYARD GARDEN 66 42 43 151 21%
LOCAL GARDEN (NOT AT YOUR HOUSEHOLD) 57 7 4 68 9%
COMMUNITY SUPPORTED AGRICULTURE 52 12 5 69 10%
ONLINE DELIVERY SERVICE 112 44 11 167 23%

Page 46 ESTIMATING QUANTITIES AND TYPES OF FOOD WASTE AT THE CITY LEVEL: TECHNICAL APPENDICES NRDC
Q14. WHERE, HOW FREQUENTLY, AND USING WHAT MODE OF TRANSPORTATION DOES YOUR HOUSEHOLD NORMALLY PURCHASE FOOD? (CONTINUED)
NUMBER/PERCENTAGE SHOPPING AT LOCATION AT LEAST ONCE PER WEEK # NASHVILLE % NASHVILLE # DENVER % DENVER # NYC % NYC # TOTAL % TOTAL
SUPERSTORE 5 7% 38 17% 64 15% 107 15%
GROCERY STORE 65 86% 184 83% 322 75% 571 79%
CORNER STORE/CONVENIENCE STORE 8 11% 32 14% 150 35% 190 26%
FARMERS' MARKET 9 12% 15 7% 54 13% 78 11%
FOOD PANTRY 0 0% 7 3% 9 2% 16 2%
BACKYARD GARDEN 14 18% 53 24% 18 4% 85 12%
LOCAL GARDEN (NOT AT YOUR HOUSEHOLD) 1 1% 5 2% 5 1% 11 2%
COMMUNITY SUPPORTED AGRICULTURE 1 1% 7 3% 9 2% 17 2%
ONLINE DELIVERY SERVICE 1 1% 11 5% 43 10% 55 8%
NUMBER OF HOUSEHOLDS USING MODE OF TRANSPORTATION FOR FOOD SHOPPING # NASHVILLE % NASHVILLE # DENVER % DENVER # NYC % NYC # TOTAL % TOTAL
OWNED CAR 73 96% 209 94% 179 42% 461 63%
BORROWED CAR 4 5% 19 9% 60 14% 83 11%
PUBLIC TRANSPORTATION 2 3% 4 2% 97 23% 103 14%
BICYCLING 7 9% 28 13% 37 9% 72 10%
WALKING 21 28% 80 36% 335 78% 436 60%
DELIVERY 10 13% 10 5% 101 24% 121 17%

Page 46 ESTIMATING QUANTITIES AND TYPES OF FOOD WASTE AT THE CITY LEVEL: TECHNICAL APPENDICES NRDC Page 47 ESTIMATING QUANTITIES AND TYPES OF FOOD WASTE AT THE CITY LEVEL: TECHNICAL APPENDICES NRDC
Q15. ON AVERAGE, HOW FREQUENTLY DOES YOUR HOUSEHOLD PREPARE OR COOK (NOT NECESSARILY EAT) THE FOLLOWING MEALS AT HOME DURING AN AVERAGE WEEK?
NASHVILLEEVERY DAY AT LEAST 5 DAYS BETWEEN 2 - 4 DAYS BETWEEN 1 - 2 DAYS LESS THAN ONCE (BLANK)
# % # % # % # % # % # %
BREAKFAST 38 50% 15 20% 9 12% 6 8% 7 9% 1 1%
LUNCH 14 18% 25 33% 16 21% 15 20% 5 7% 1 1%
DINNER 13 17% 38 50% 17 22% 5 7% 2 3% 1 1%
SNACKS 22 29% 21 28% 10 13% 14 18% 7 9% 2 3%
DENVEREVERY DAY AT LEAST 5 DAYS BETWEEN 2 - 4 DAYS BETWEEN 1 - 2 DAYS LESS THAN ONCE (BLANK)
# % # % # % # % # % # %
BREAKFAST 109 49% 45 20% 31 14% 24 11% 10 5% 3 1%
LUNCH 42 19% 72 32% 53 24% 38 17% 10 5% 7 3%
DINNER 48 22% 100 45% 65 29% 7 3% 1 0% 1 0%
SNACKS 89 40% 43 19% 32 14% 22 10% 23 10% 12 5%
NYCEVERY DAY AT LEAST 5 DAYS BETWEEN 2 - 4 DAYS BETWEEN 1 - 2 DAYS LESS THAN ONCE (BLANK)
# % # % # % # % # % # %
BREAKFAST 217 51% 70 16% 53 12% 45 11% 25 6% 18 4%
LUNCH 86 20% 85 20% 111 26% 80 20% 42 10% 24 6%
DINNER 115 27% 159 37% 100 23% 24 6% 11 3% 19 4%
SNACKS 149 35% 72 17% 66 15% 43 11% 56 13% 42 10%
TOTALEVERY DAY AT LEAST 5 DAYS BETWEEN 2 - 4 DAYS BETWEEN 1 - 2 DAYS LESS THAN ONCE (BLANK)
# % # % # % # % # % # %
BREAKFAST 364 50% 130 18% 93 13% 75 10% 42 6% 22 3%
LUNCH 142 20% 182 25% 180 25% 133 18% 57 8% 32 4%
DINNER 176 24% 297 41% 182 25% 36 5% 14 2% 21 3%
SNACKS 260 36% 136 19% 108 15% 79 11% 86 12% 56 8%
NUMBER/PERCENTAGE WHO RESPONDED THEY PREPARE OR COOK THE FOLLOWING MEALS AT HOME BETWEEN 2-4 DAYS/WEEK OR MORE:
# NASHVILLE % NASHVILLE # DENVER % DENVER # NYC % NYC # TOTAL % TOTAL
BREAKFAST 62 82% 185 83% 340 79% 587 81%
LUNCH 55 72% 167 75% 282 66% 504 69%
DINNER 68 89% 213 96% 374 87% 655 90%
SNACKS 53 70% 164 74% 287 67% 504 69%
NUMBER/PERCENTAGE WHO RESPONDED THEY PREPARE OR COOK THE FOLLOWING MEALS AT HOME BETWEEN 1-2 DAYS/WEEK OR LESS:
# NASHVILLE % NASHVILLE # DENVER % DENVER # NYC % NYC # TOTAL % TOTAL
BREAKFAST 13 17% 34 15% 70 16% 117 16%
LUNCH 20 26% 48 22% 122 29% 190 26%
DINNER 7 9% 8 4% 35 8% 50 7%
SNACKS 21 28% 45 20% 99 24% 165 23%

Page 48 ESTIMATING QUANTITIES AND TYPES OF FOOD WASTE AT THE CITY LEVEL: TECHNICAL APPENDICES NRDC
Q16. ON AVERAGE, HOW FREQUENTLY DOES YOUR HOUSEHOLD EAT (NOT NECESSARILY PREPARE OR COOK) THE FOLLOWING MEALS AT HOME DURING AN AVERAGE WEEK?
NASHVILLEEVERY DAY AT LEAST 5 DAYS BETWEEN 2 - 4 DAYS BETWEEN 1 - 2 DAYS LESS THAN ONCE (BLANK)
# % # % # % # % # % # %
BREAKFAST 38 50% 16 21% 8 11% 8 11% 5 7% 1 1%
LUNCH 11 14% 10 13% 18 24% 30 39% 6 8% 1 1%
DINNER 17 22% 36 47% 13 17% 6 8% 2 3% 2 3%
SNACKS 22 29% 20 26% 18 24% 11 14% 4 5% 1 1%
DENVEREVERY DAY AT LEAST 5 DAYS BETWEEN 2 - 4 DAYS BETWEEN 1 - 2 DAYS LESS THAN ONCE (BLANK)
# % # % # % # % # % # %
BREAKFAST 99 45% 36 16% 28 13% 28 13% 19 9% 12 5%
LUNCH 29 13% 54 24% 47 21% 56 25% 24 11% 12 5%
DINNER 55 25% 93 42% 50 23% 11 5% 8 4% 5 2%
SNACKS 85 38% 42 19% 36 16% 22 10% 21 9% 16 7%
NYCEVERY DAY AT LEAST 5 DAYS BETWEEN 2 - 4 DAYS BETWEEN 1 - 2 DAYS LESS THAN ONCE (BLANK)
# % # % # % # % # % # %
BREAKFAST 206 48% 70 16% 48 11% 44 10% 35 8% 25 6%
LUNCH 72 17% 68 16% 109 25% 92 21% 55 13% 32 7%
DINNER 124 29% 166 39% 79 18% 24 6% 12 3% 23 5%
SNACKS 150 35% 78 18% 74 17% 50 12% 32 7% 44 10%
TOTALEVERY DAY AT LEAST 5 DAYS BETWEEN 2 - 4 DAYS BETWEEN 1 - 2 DAYS LESS THAN ONCE (BLANK)
# % # % # % # % # % # %
BREAKFAST 343 47% 122 17% 84 12% 80 11% 59 8% 38 5%
LUNCH 112 15% 132 18% 174 24% 178 25% 85 12% 45 6%
DINNER 196 27% 295 41% 142 20% 41 6% 22 3% 30 4%
SNACKS 257 35% 140 19% 128 18% 83 11% 57 8% 61 8%
NUMBER/PERCENTAGE WHO RESPONDED THEY EAT THE FOLLOWING MEALS AT HOME BETWEEN 2-4 DAYS/WEEK OR MORE:
# NASHVILLE % NASHVILLE # DENVER % DENVER # NYC % NYC # TOTAL % TOTAL
BREAKFAST 62 82% 163 73% 324 76% 549 76%
LUNCH 39 51% 130 59% 249 58% 418 58%
DINNER 66 87% 198 89% 369 86% 633 87%
SNACKS 60 79% 163 73% 302 71% 525 72%
NUMBER/PERCENTAGE WHO RESPONDED THEY EAT THE FOLLOWING MEALS AT HOME BETWEEN 1-2 DAYS/WEEK OR LESS:
# NASHVILLE % NASHVILLE # DENVER % DENVER # NYC % NYC # TOTAL % TOTAL
BREAKFAST 13 17% 47 21% 79 18% 139 19%
LUNCH 36 47% 80 36% 147 34% 263 36%
DINNER 8 11% 19 9% 36 8% 63 9%
SNACKS 15 20% 43 19% 82 19% 140 19%

Page 48 ESTIMATING QUANTITIES AND TYPES OF FOOD WASTE AT THE CITY LEVEL: TECHNICAL APPENDICES NRDC Page 49 ESTIMATING QUANTITIES AND TYPES OF FOOD WASTE AT THE CITY LEVEL: TECHNICAL APPENDICES NRDC
Q17. IS YOUR PRIMARY REFRIGERATOR GENERALLY…
# NASHVILLE % NASHVILLE # DENVER % DENVER # NYC % NYC # TOTAL % TOTAL
MOSTLY FULL 29 38% 102 46% 219 51% 350 48%
HALF FULL 39 51% 98 44% 164 38% 301 41%
FAIRLY EMPTY 7 9% 21 9% 29 7% 57 8%
DON'T HAVE ONE 0 0% 0 0% 1 0% 1 0%
(BLANK) 1 1% 1 0% 15 4% 17 2%
TOTAL 76 100% 222 100% 428 100% 726 100%
Q18. IS YOUR SECONDARY REFRIGERATOR OR FREEZER GENERALLY…
# NASHVILLE % NASHVILLE # DENVER % DENVER # NYC % NYC # TOTAL % TOTAL
MOSTLY FULL 14 18% 28 13% 55 13% 97 13%
HALF FULL 8 11% 37 17% 62 14% 107 15%
FAIRLY EMPTY 5 7% 23 10% 25 6% 53 7%
DON'T HAVE ONE 47 62% 132 59% 269 63% 448 62%
(BLANK) 2 3% 2 1% 17 4% 21 3%
TOTAL 76 100% 222 100% 428 100% 726 100%
Q19. WHICH OF THE FOLLOWING BEST DESCRIBES YOUR THOUGHTS ABOUT YOUR REFRIGERATOR?
# NASHVILLE % NASHVILLE # DENVER % DENVER # NYC % NYC # TOTAL % TOTAL
IT MAKES ME UNCOMFORTABLE OR NERVOUS IF MY REFRIGERATOR IS TOO EMPTY
21 28% 46 21% 100 23% 167 23%
IT MAKES ME UNCOMFORTABLE OR NERVOUS IF MY REFRIGERATOR IS TOO FULL
18 24% 48 22% 81 19% 147 20%
I DON'T CARE OR DON'T THINK ABOUT HOW FULL MY REFRIGERATOR IS
36 47% 127 57% 231 54% 394 54%
(BLANK) 1 1% 1 0% 16 4% 18 2%
TOTAL 76 100% 222 100% 428 100% 726 100%

Page 50 ESTIMATING QUANTITIES AND TYPES OF FOOD WASTE AT THE CITY LEVEL: TECHNICAL APPENDICES NRDC
Q20. WHEN PLANNING A VISIT TO THE GROCERY STORE OR WHEN SHOPPING FOR FOOD, HOW OFTEN DOES YOUR HOUSEHOLD DO THE FOLLOWING…
NASHVILLENEVER RARELY SOMETIMES OFTEN ALWAYS N/A (BLANK)
# % # % # % # % # % # % # %
MAKE A SHOPPING LIST 2 3% 7 9% 14 18% 22 29% 30 39% 0 0% 1 1%
CHECK TO SEE WHAT IS IN YOUR REFRIGERATOR/FREEZER AND CUPBOARDS BEFORE YOU GO SHOPPING
2 3% 5 7% 12 16% 36 47% 20 26% 0 0% 1 1%
PLAN YOUR MEALS BEFORE SHOPPING 2 3% 13 17% 25 33% 25 33% 10 13% 0 0% 1 1%
ESTIMATE HOW MUCH OF EACH ITEM YOU NEED TO BUY BEFORE GOING SHOPPING
3 4% 8 11% 14 18% 30 39% 20 26% 0 0% 1 1%
BUY ONLY ITEMS ON YOUR SHOPPING LIST IN THE STORE 4 5% 17 22% 20 26% 29 38% 3 4% 2 3% 1 1%
BUY FOOD IN LARGER QUANTITIES THAN DESIRED DUE TO THE WAY FOOD IS PACKAGED
1 1% 20 26% 43 57% 10 13% 1 1% 0 0% 1 1%
PURCHASE MORE OF A PRODUCT THAN YOU NEED BECAUSE IT IS ON SALE 2 3% 17 22% 43 57% 12 16% 1 1% 0 0% 1 1%
PURCHASE MORE OF A PRODUCT THAN YOU NEED BECAUSE IT IS CHEAPER TO BUY IN LARGER PACKAGES OR QUANTITIES
4 5% 18 24% 36 47% 16 21% 1 1% 0 0% 1 1%
PURCHASE SOMETHING UNPLANNED BECAUSE IT LOOKS GOOD AT THE TIME 0 0% 8 11% 42 55% 24 32% 1 1% 0 0% 1 1%
DENVERNEVER RARELY SOMETIMES OFTEN ALWAYS N/A (BLANK)
# % # % # % # % # % # % # %
MAKE A SHOPPING LIST 10 5% 22 10% 37 17% 63 28% 88 40% 0 0% 2 1%
CHECK TO SEE WHAT IS IN YOUR REFRIGERATOR/FREEZER AND CUPBOARDS BEFORE YOU GO SHOPPING
7 3% 16 7% 37 17% 84 38% 76 34% 0 0% 2 1%
PLAN YOUR MEALS BEFORE SHOPPING 9 4% 28 13% 73 33% 75 34% 34 15% 0 0% 3 1%
ESTIMATE HOW MUCH OF EACH ITEM YOU NEED TO BUY BEFORE GOING SHOPPING
10 5% 28 13% 47 21% 73 33% 62 28% 1 0% 1 0%
BUY ONLY ITEMS ON YOUR SHOPPING LIST IN THE STORE 23 10% 52 23% 53 24% 76 34% 12 5% 5 2% 1 0%
BUY FOOD IN LARGER QUANTITIES THAN DESIRED DUE TO THE WAY FOOD IS PACKAGED
9 4% 59 27% 95 43% 52 23% 5 2% 1 0% 1 0%
PURCHASE MORE OF A PRODUCT THAN YOU NEED BECAUSE IT IS ON SALE 10 5% 62 28% 96 43% 46 21% 5 2% 2 1% 1 0%
PURCHASE MORE OF A PRODUCT THAN YOU NEED BECAUSE IT IS CHEAPER TO BUY IN LARGER PACKAGES OR QUANTITIES
14 6% 55 25% 82 37% 58 26% 9 4% 2 1% 2 1%
PURCHASE SOMETHING UNPLANNED BECAUSE IT LOOKS GOOD AT THE TIME 2 1% 31 14% 120 54% 55 25% 10 5% 1 0% 3 1%

Page 50 ESTIMATING QUANTITIES AND TYPES OF FOOD WASTE AT THE CITY LEVEL: TECHNICAL APPENDICES NRDC Page 51 ESTIMATING QUANTITIES AND TYPES OF FOOD WASTE AT THE CITY LEVEL: TECHNICAL APPENDICES NRDC
Q20. WHEN PLANNING A VISIT TO THE GROCERY STORE OR WHEN SHOPPING FOR FOOD, HOW OFTEN DOES YOUR HOUSEHOLD DO THE FOLLOWING… (CONT.)
NYCNEVER RARELY SOMETIMES OFTEN ALWAYS N/A (BLANK)
# % # % # % # % # % # % # %
MAKE A SHOPPING LIST 41 10% 44 10% 90 21% 127 30% 107 25% 4 1% 15 4%
CHECK TO SEE WHAT IS IN YOUR REFRIGERATOR/FREEZER AND CUPBOARDS BEFORE YOU GO SHOPPING
10 2% 30 7% 90 21% 152 36% 127 30% 3 1% 16 4%
PLAN YOUR MEALS BEFORE SHOPPING 25 6% 48 11% 144 34% 118 28% 76 18% 4 1% 13 3%
ESTIMATE HOW MUCH OF EACH ITEM YOU NEED TO BUY BEFORE GOING SHOPPING
20 5% 34 8% 116 27% 135 32% 104 24% 3 1% 16 4%
BUY ONLY ITEMS ON YOUR SHOPPING LIST IN THE STORE 49 11% 89 21% 117 27% 109 25% 24 6% 25 6% 15 4%
BUY FOOD IN LARGER QUANTITIES THAN DESIRED DUE TO THE WAY FOOD IS PACKAGED
23 5% 111 26% 190 44% 73 17% 11 3% 3 1% 17 4%
PURCHASE MORE OF A PRODUCT THAN YOU NEED BECAUSE IT IS ON SALE 37 9% 92 21% 199 46% 64 15% 19 4% 2 0% 15 4%
PURCHASE MORE OF A PRODUCT THAN YOU NEED BECAUSE IT IS CHEAPER TO BUY IN LARGER PACKAGES OR QUANTITIES
42 10% 88 21% 178 42% 84 20% 17 4% 3 1% 16 4%
PURCHASE SOMETHING UNPLANNED BECAUSE IT LOOKS GOOD AT THE TIME 16 4% 52 12% 213 50% 113 26% 20 5% 1 0% 13 3%
TOTALNEVER RARELY SOMETIMES OFTEN ALWAYS N/A (BLANK)
# % # % # % # % # % # % # %
MAKE A SHOPPING LIST 53 7% 73 10% 141 19% 212 29% 225 31% 4 1% 18 2%
CHECK TO SEE WHAT IS IN YOUR REFRIGERATOR/FREEZER AND CUPBOARDS BEFORE YOU GO SHOPPING
19 3% 51 7% 139 19% 272 37% 223 31% 3 0% 19 3%
PLAN YOUR MEALS BEFORE SHOPPING 36 5% 89 12% 242 33% 218 30% 120 17% 4 1% 17 2%
ESTIMATE HOW MUCH OF EACH ITEM YOU NEED TO BUY BEFORE GOING SHOPPING
33 5% 70 10% 177 24% 238 33% 186 26% 4 1% 18 2%
BUY ONLY ITEMS ON YOUR SHOPPING LIST IN THE STORE 76 10% 158 22% 190 26% 214 29% 39 5% 32 4% 17 2%
BUY FOOD IN LARGER QUANTITIES THAN DESIRED DUE TO THE WAY FOOD IS PACKAGED
33 5% 190 26% 328 45% 135 19% 17 2% 4 1% 19 3%
PURCHASE MORE OF A PRODUCT THAN YOU NEED BECAUSE IT IS ON SALE 49 7% 171 24% 338 47% 122 17% 25 3% 4 1% 17 2%
PURCHASE MORE OF A PRODUCT THAN YOU NEED BECAUSE IT IS CHEAPER TO BUY IN LARGER PACKAGES OR QUANTITIES
60 8% 161 22% 296 41% 158 22% 27 4% 5 1% 19 3%
PURCHASE SOMETHING UNPLANNED BECAUSE IT LOOKS GOOD AT THE TIME 18 2% 91 13% 375 52% 192 26% 31 4% 2 0% 17 2%

Page 52 ESTIMATING QUANTITIES AND TYPES OF FOOD WASTE AT THE CITY LEVEL: TECHNICAL APPENDICES NRDC
Q20. WHEN PLANNING A VISIT TO THE GROCERY STORE OR WHEN SHOPPING FOR FOOD, HOW OFTEN DOES YOUR HOUSEHOLD DO THE FOLLOWING… (CONT.)
NUMBER/PERCENTAGE WHO "ALWAYS" OR "OFTEN" DO THE FOLLOWING BEFORE OR DURING SHOPPING FOR FOOD:
# NASHVILLE % NASHVILLE # DENVER % DENVER # NYC % NYC # TOTAL % TOTAL
MAKE A SHOPPING LIST 52 68% 151 68% 234 55% 437 60%
CHECK TO SEE WHAT IS IN YOUR REFRIGERATOR/FREEZER AND CUPBOARDS BEFORE YOU GO SHOPPING
56 74% 160 72% 279 65% 495 68%
PLAN YOUR MEALS BEFORE SHOPPING 35 46% 109 49% 194 45% 338 47%
ESTIMATE HOW MUCH OF EACH ITEM YOU NEED TO BUY BEFORE GOING SHOPPING
50 66% 135 61% 239 56% 424 58%
BUY ONLY ITEMS ON YOUR SHOPPING LIST IN THE STORE
32 42% 88 40% 133 31% 253 35%
BUY FOOD IN LARGER QUANTITIES THAN DESIRED DUE TO THE WAY FOOD IS PACKAGED
11 14% 57 26% 84 20% 152 21%
PURCHASE MORE OF A PRODUCT THAN YOU NEED BECAUSE IT IS ON SALE
13 17% 51 23% 83 19% 147 20%
PURCHASE MORE OF A PRODUCT THAN YOU NEED BECAUSE IT IS CHEAPER TO BUY IN LARGER PACKAGES OR QUANTITIES
17 22% 67 30% 101 24% 185 25%
PURCHASE SOMETHING UNPLANNED BECAUSE IT LOOKS GOOD AT THE TIME
25 33% 65 29% 133 31% 223 31%
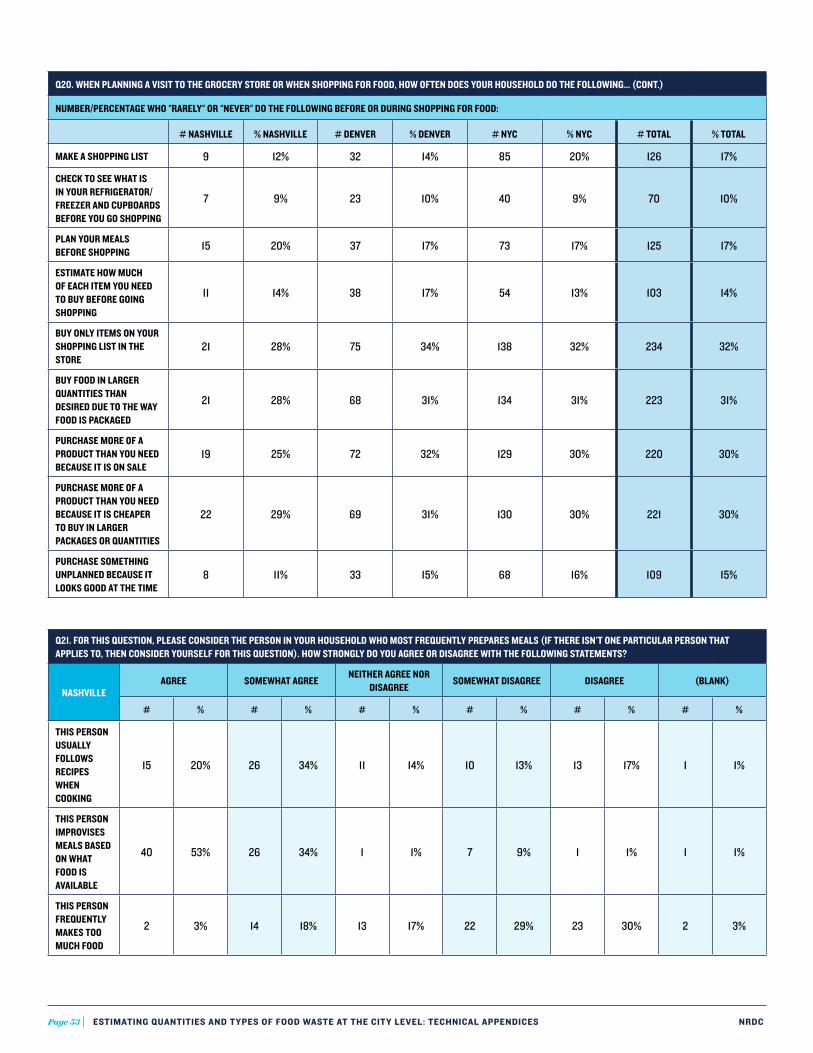
Page 52 ESTIMATING QUANTITIES AND TYPES OF FOOD WASTE AT THE CITY LEVEL: TECHNICAL APPENDICES NRDC Page 53 ESTIMATING QUANTITIES AND TYPES OF FOOD WASTE AT THE CITY LEVEL: TECHNICAL APPENDICES NRDC
Q20. WHEN PLANNING A VISIT TO THE GROCERY STORE OR WHEN SHOPPING FOR FOOD, HOW OFTEN DOES YOUR HOUSEHOLD DO THE FOLLOWING… (CONT.)
NUMBER/PERCENTAGE WHO "RARELY" OR "NEVER" DO THE FOLLOWING BEFORE OR DURING SHOPPING FOR FOOD:
# NASHVILLE % NASHVILLE # DENVER % DENVER # NYC % NYC # TOTAL % TOTAL
MAKE A SHOPPING LIST 9 12% 32 14% 85 20% 126 17%
CHECK TO SEE WHAT IS IN YOUR REFRIGERATOR/FREEZER AND CUPBOARDS BEFORE YOU GO SHOPPING
7 9% 23 10% 40 9% 70 10%
PLAN YOUR MEALS BEFORE SHOPPING 15 20% 37 17% 73 17% 125 17%
ESTIMATE HOW MUCH OF EACH ITEM YOU NEED TO BUY BEFORE GOING SHOPPING
11 14% 38 17% 54 13% 103 14%
BUY ONLY ITEMS ON YOUR SHOPPING LIST IN THE STORE
21 28% 75 34% 138 32% 234 32%
BUY FOOD IN LARGER QUANTITIES THAN DESIRED DUE TO THE WAY FOOD IS PACKAGED
21 28% 68 31% 134 31% 223 31%
PURCHASE MORE OF A PRODUCT THAN YOU NEED BECAUSE IT IS ON SALE
19 25% 72 32% 129 30% 220 30%
PURCHASE MORE OF A PRODUCT THAN YOU NEED BECAUSE IT IS CHEAPER TO BUY IN LARGER PACKAGES OR QUANTITIES
22 29% 69 31% 130 30% 221 30%
PURCHASE SOMETHING UNPLANNED BECAUSE IT LOOKS GOOD AT THE TIME
8 11% 33 15% 68 16% 109 15%
Q21. FOR THIS QUESTION, PLEASE CONSIDER THE PERSON IN YOUR HOUSEHOLD WHO MOST FREQUENTLY PREPARES MEALS (IF THERE ISN'T ONE PARTICULAR PERSON THAT APPLIES TO, THEN CONSIDER YOURSELF FOR THIS QUESTION). HOW STRONGLY DO YOU AGREE OR DISAGREE WITH THE FOLLOWING STATEMENTS?
NASHVILLEAGREE SOMEWHAT AGREE
NEITHER AGREE NOR DISAGREE
SOMEWHAT DISAGREE DISAGREE (BLANK)
# % # % # % # % # % # %
THIS PERSON USUALLY FOLLOWS RECIPES WHEN COOKING
15 20% 26 34% 11 14% 10 13% 13 17% 1 1%
THIS PERSON IMPROVISES MEALS BASED ON WHAT FOOD IS AVAILABLE
40 53% 26 34% 1 1% 7 9% 1 1% 1 1%
THIS PERSON FREQUENTLY MAKES TOO MUCH FOOD
2 3% 14 18% 13 17% 22 29% 23 30% 2 3%

Page 54 ESTIMATING QUANTITIES AND TYPES OF FOOD WASTE AT THE CITY LEVEL: TECHNICAL APPENDICES NRDC
Q21. FOR THIS QUESTION, PLEASE CONSIDER THE PERSON IN YOUR HOUSEHOLD WHO MOST FREQUENTLY PREPARES MEALS (IF THERE ISN'T ONE PARTICULAR PERSON THAT APPLIES TO, THEN CONSIDER YOURSELF FOR THIS QUESTION). HOW STRONGLY DO YOU AGREE OR DISAGREE WITH THE FOLLOWING STATEMENTS? (CONT.)
DENVERAGREE SOMEWHAT AGREE
NEITHER AGREE NOR DISAGREE
SOMEWHAT DISAGREE DISAGREE (BLANK)
# % # % # % # % # % # %
THIS PERSON USUALLY FOLLOWS RECIPES WHEN COOKING
52 23% 67 30% 35 16% 42 19% 23 10% 3 1%
THIS PERSON IMPROVISES MEALS BASED ON WHAT FOOD IS AVAILABLE
83 37% 99 45% 17 8% 13 6% 9 4% 1 0%
THIS PERSON FREQUENTLY MAKES TOO MUCH FOOD
19 9% 47 21% 57 26% 63 28% 35 16% 1 0%
NYCAGREE SOMEWHAT AGREE
NEITHER AGREE NOR DISAGREE
SOMEWHAT DISAGREE DISAGREE (BLANK)
# % # % # % # % # % # %
THIS PERSON USUALLY FOLLOWS RECIPES WHEN COOKING
71 17% 138 32% 73 17% 62 14% 66 15% 18 4%
THIS PERSON IMPROVISES MEALS BASED ON WHAT FOOD IS AVAILABLE
157 37% 185 43% 42 10% 19 4% 8 2% 17 4%
THIS PERSON FREQUENTLY MAKES TOO MUCH FOOD
41 10% 77 18% 85 20% 87 20% 119 28% 19 4%
TOTALAGREE SOMEWHAT AGREE
NEITHER AGREE NOR DISAGREE
SOMEWHAT DISAGREE DISAGREE (BLANK)
# % # % # % # % # % # %
THIS PERSON USUALLY FOLLOWS RECIPES WHEN COOKING
138 19% 231 32% 119 16% 114 16% 102 14% 22 3%
THIS PERSON IMPROVISES MEALS BASED ON WHAT FOOD IS AVAILABLE
280 39% 310 43% 60 8% 39 5% 18 2% 19 3%
THIS PERSON FREQUENTLY MAKES TOO MUCH FOOD
62 9% 138 19% 155 21% 172 24% 177 24% 22 3%

Page 54 ESTIMATING QUANTITIES AND TYPES OF FOOD WASTE AT THE CITY LEVEL: TECHNICAL APPENDICES NRDC Page 55 ESTIMATING QUANTITIES AND TYPES OF FOOD WASTE AT THE CITY LEVEL: TECHNICAL APPENDICES NRDC
Q21. FOR THIS QUESTION, PLEASE CONSIDER THE PERSON IN YOUR HOUSEHOLD WHO MOST FREQUENTLY PREPARES MEALS (IF THERE ISN'T ONE PARTICULAR PERSON THAT APPLIES TO, THEN CONSIDER YOURSELF FOR THIS QUESTION). HOW STRONGLY DO YOU AGREE OR DISAGREE WITH THE FOLLOWING STATEMENTS? (CONT.)
NUMBER/PERCENTAGE WHO RESPONDED "AGREE" OR "SOMEWHAT AGREE" TO THE FOLLOWING STATEMENTS:
# NASHVILLE % NASHVILLE # DENVER % DENVER # NYC % NYC # TOTAL % TOTAL
THE PERSON IN THE HOUSEHOLD WHO MOST FREQUENTLY PREPARES MEALS USUALLY FOLLOWS RECIPES WHEN COOKING
41 54% 119 54% 209 49% 369 51%
THE PERSON IN THE HOUSEHOLD WHO MOST FREQUENTLY PREPARES MEALS IMPROVISES MEALS BASED ON WHAT FOOD IS AVAILABLE
66 87% 182 82% 342 80% 590 81%
THE PERSON IN THE HOUSEHOLD WHO MOST FREQUENTLY PREPARES MEALS FREQUENTLY MAKES TOO MUCH FOOD
16 21% 66 30% 118 28% 200 28%
NUMBER/PERCENTAGE WHO RESPONDED "DISAGREE" OR "SOMEWHAT DISAGREE" TO THE FOLLOWING STATEMENTS:
# NASHVILLE % NASHVILLE # DENVER % DENVER # NYC % NYC # TOTAL % TOTAL
THE PERSON IN THE HOUSEHOLD WHO MOST FREQUENTLY PREPARES MEALS USUALLY FOLLOWS RECIPES WHEN COOKING
23 30% 65 29% 128 30% 216 30%
THE PERSON IN THE HOUSEHOLD WHO MOST FREQUENTLY PREPARES MEALS IMPROVISES MEALS BASED ON WHAT FOOD IS AVAILABLE
8 11% 22 10% 27 6% 57 8%
THE PERSON IN THE HOUSEHOLD WHO MOST FREQUENTLY PREPARES MEALS FREQUENTLY MAKES TOO MUCH FOOD
45 59% 98 44% 206 48% 349 48%

Page 56 ESTIMATING QUANTITIES AND TYPES OF FOOD WASTE AT THE CITY LEVEL: TECHNICAL APPENDICES NRDC
Q22. MANY FOODS YOU PURCHASE ARE MARKED WITH A "USE BY," "SELL BY," OR "BEST BY" DATE. BY FOOD TYPE, WHAT DO YOU GENERALLY DO WITH FOODS AFTER THE DATE PROVIDED ON THE PACKAGING HAS PASSED?
NASHVILLE
DON'T PAY ATTENTION TO DATE LABELS
THROW IT AWAYSMELL OR LOOK AT IT TO DETERMINE IF IT IS
STILL GOOD
EVERYTHING IS EATEN OR FROZEN BEFORE DATE ON PACKAGE
I DON'T CONSUME THIS TYPE OF FOOD
(BLANK)
# % # % # % # % # % # %
MEAT & FISH 1 1% 15 20% 27 36% 26 34% 6 8% 1 1%
EGGS 19 25% 4 5% 31 41% 17 22% 3 4% 2 3%
MILK 0 0% 10 13% 48 63% 12 16% 5 7% 1 1%
BREAD 7 9% 5 7% 48 63% 10 13% 4 5% 2 3%
CHEESES 7 9% 7 9% 50 66% 7 9% 4 5% 1 1%
YOGURT & SOUR CREAM 3 4% 11 14% 51 67% 4 5% 6 8% 1 1%
FRUITS & VEGETABLES 7 9% 6 8% 59 78% 2 3% 0 0% 2 3%
DENVER
DON'T PAY ATTENTION TO DATE LABELS
THROW IT AWAYSMELL OR LOOK AT IT TO DETERMINE IF IT IS
STILL GOOD
EVERYTHING IS EATEN OR FROZEN BEFORE DATE ON PACKAGE
I DON'T CONSUME THIS TYPE OF FOOD
(BLANK)
# % # % # % # % # % # %
MEAT & FISH 8 4% 44 20% 75 34% 81 36% 11 5% 3 1%
EGGS 46 21% 39 18% 69 31% 55 25% 10 5% 3 1%
MILK 3 1% 39 18% 121 55% 34 15% 24 11% 1 0%
BREAD 15 7% 27 12% 129 58% 37 17% 12 5% 2 1%
CHEESES 18 8% 30 14% 130 59% 34 15% 8 4% 2 1%
YOGURT & SOUR CREAM 7 3% 58 26% 113 51% 28 13% 14 6% 2 1%
FRUITS & VEGETABLES 14 6% 30 14% 149 67% 26 12% 0 0% 3 1%
NYC
DON'T PAY ATTENTION TO DATE LABELS
THROW IT AWAYSMELL OR LOOK AT IT TO DETERMINE IF IT IS
STILL GOOD
EVERYTHING IS EATEN OR FROZEN BEFORE DATE ON PACKAGE
I DON'T CONSUME THIS TYPE OF FOOD
(BLANK)
# % # % # % # % # % # %
MEAT & FISH 9 2% 118 28% 138 32% 115 27% 33 8% 15 4%
EGGS 60 14% 103 24% 130 30% 106 25% 15 4% 14 3%
MILK 8 2% 109 25% 211 49% 61 14% 25 6% 14 3%
BREAD 33 8% 69 16% 219 51% 85 20% 9 2% 13 3%
CHEESES 27 6% 86 20% 218 51% 60 14% 23 5% 14 3%
YOGURT & SOUR CREAM 12 3% 124 29% 199 46% 51 12% 28 7% 14 3%
FRUITS & VEGETABLES 32 7% 68 16% 256 60% 56 13% 2 0% 14 3%

Page 56 ESTIMATING QUANTITIES AND TYPES OF FOOD WASTE AT THE CITY LEVEL: TECHNICAL APPENDICES NRDC Page 57 ESTIMATING QUANTITIES AND TYPES OF FOOD WASTE AT THE CITY LEVEL: TECHNICAL APPENDICES NRDC
Q22. MANY FOODS YOU PURCHASE ARE MARKED WITH A "USE BY," "SELL BY," OR "BEST BY" DATE. BY FOOD TYPE, WHAT DO YOU GENERALLY DO WITH FOODS AFTER THE DATE PROVIDED ON THE PACKAGING HAS PASSED? (CONT.)
TOTAL
DON'T PAY ATTENTION TO DATE LABELS
THROW IT AWAYSMELL OR LOOK AT IT TO DETERMINE IF IT IS
STILL GOOD
EVERYTHING IS EATEN OR FROZEN BEFORE DATE ON PACKAGE
I DON'T CONSUME THIS TYPE OF FOOD
(BLANK)
# % # % # % # % # % # %
MEAT & FISH 18 2% 177 24% 240 33% 222 31% 50 7% 19 3%
EGGS 125 17% 146 20% 230 32% 178 25% 28 4% 19 3%
MILK 11 2% 158 22% 380 52% 107 15% 54 7% 16 2%
BREAD 55 8% 101 14% 396 55% 132 18% 25 3% 17 2%
CHEESES 52 7% 123 17% 398 55% 101 14% 35 5% 17 2%
YOGURT & SOUR CREAM 22 3% 193 27% 363 50% 83 11% 48 7% 17 2%
FRUITS & VEGETABLES 53 7% 104 14% 464 64% 84 12% 2 0% 19 3%

Page 58 ESTIMATING QUANTITIES AND TYPES OF FOOD WASTE AT THE CITY LEVEL: TECHNICAL APPENDICES NRDC
Q23. HOW STRONGLY DO YOU AGREE OR DISAGREE WITH THE FOLLOWING STATEMENTS?
NASHVILLEAGREE SOMEWHAT AGREE
NEITHER AGREE NOR DISAGREE
SOMEWHAT DISAGREE
DISAGREE (BLANK)
# % # % # % # % # % # %
WE ARE VERY CAUTIOUS ABOUT AVOIDING FOOD POISONING 22 29% 13 17% 16 21% 17 22% 7 9% 1 1%
DATE LABELS ARE THE MAIN SOURCE OF INFORMATION WE USE WHEN DECIDING WHETHER TO THROW AWAY FOOD
7 9% 15 20% 8 11% 22 29% 23 30% 1 1%
WE FREQUENTLY USE SIGHT, TASTE, OR SMELL TO DETERMINE IF FOOD IS SAFE TO EAT
48 63% 22 29% 2 3% 1 1% 2 3% 1 1%
WE FREQUENTLY PUT FOODS THAT NEED TO BE USED SOON IN A CERTAIN PART OF THE REFRIGERATOR
17 22% 13 17% 7 9% 15 20% 21 28% 3 4%
I WOULD LIKE TO HAVE MORE TIME TO SPEND ON PREPARING AND COOKING FOOD
29 38% 24 32% 9 12% 10 13% 3 4% 1 1%
WE FREQUENTLY PREPARE MEALS A DAY OR MORE IN ADVANCE 13 17% 17 22% 12 16% 19 25% 13 17% 2 3%
WE FREQUENTLY EAT PREPARED OR FROZEN MEALS TO SAVE TIME 8 11% 15 20% 8 11% 20 26% 24 32% 1 1%
I FEEL LESS GUILTY ABOUT WASTING FOOD THAT HAS BEEN IN THE REFRIGERATOR FOR A LONG TIME
13 17% 21 28% 15 20% 8 11% 18 24% 1 1%
I FEEL LESS GUILTY ABOUT WASTING FOOD IF IT IS COMPOSTED 31 41% 19 25% 15 20% 4 5% 6 8% 1 1%
I PREFER FRUITS AND VEGETABLES WITH NO BLEMISHES 13 17% 23 30% 12 16% 14 18% 11 14% 3 4%
AT LEAST ONE PERSON IN THE HOUSEHOLD IS A SKILLED COOK 40 53% 16 21% 8 11% 5 7% 6 8% 1 1%
HAVING REGULAR FAMILY OR HOUSEHOLD MEALS IS IMPORTANT 52 68% 12 16% 9 12% 1 1% 1 1% 1 1%
GENERALLY, PREPARING FOOD FOR FRIENDS AND/OR FAMILY MAKES ME FEEL GOOD
54 71% 13 17% 5 7% 0 0% 3 4% 1 1%
WHEN HOUSEHOLD MEMBERS EAT OUT IT IS USUALLY SPUR OF THE MOMENT, OR PLANNED WITH LESS THAN 48 HOURS' NOTICE
38 50% 17 22% 10 13% 7 9% 2 3% 2 3%
WE CLEAN OUT OUR REFRIGERATOR REGULARLY (AT LEAST EVERY OTHER WEEK)
11 14% 19 25% 6 8% 19 25% 20 26% 1 1%
IT IS IMPORTANT THAT WE FINISH ALL FOOD THAT IS PUT ON OUR PLATES FOR A MEAL
19 25% 31 41% 11 14% 7 9% 7 9% 1 1%

Page 58 ESTIMATING QUANTITIES AND TYPES OF FOOD WASTE AT THE CITY LEVEL: TECHNICAL APPENDICES NRDC Page 59 ESTIMATING QUANTITIES AND TYPES OF FOOD WASTE AT THE CITY LEVEL: TECHNICAL APPENDICES NRDC
Q23. HOW STRONGLY DO YOU AGREE OR DISAGREE WITH THE FOLLOWING STATEMENTS? (CONT.)
DENVERAGREE SOMEWHAT AGREE
NEITHER AGREE NOR DISAGREE
SOMEWHAT DISAGREE
DISAGREE (BLANK)
# % # % # % # % # % # %
WE ARE VERY CAUTIOUS ABOUT AVOIDING FOOD POISONING 89 40% 70 32% 30 14% 30 14% 2 1% 1 0%
DATE LABELS ARE THE MAIN SOURCE OF INFORMATION WE USE WHEN DECIDING WHETHER TO THROW AWAY FOOD
29 13% 68 31% 32 14% 52 23% 40 18% 1 0%
WE FREQUENTLY USE SIGHT, TASTE, OR SMELL TO DETERMINE IF FOOD IS SAFE TO EAT
116 52% 81 36% 15 7% 8 4% 1 0% 1 0%
WE FREQUENTLY PUT FOODS THAT NEED TO BE USED SOON IN A CERTAIN PART OF THE REFRIGERATOR
52 23% 43 19% 35 16% 37 17% 54 24% 1 0%
I WOULD LIKE TO HAVE MORE TIME TO SPEND ON PREPARING AND COOKING FOOD
69 31% 59 27% 49 22% 17 8% 26 12% 2 1%
WE FREQUENTLY PREPARE MEALS A DAY OR MORE IN ADVANCE 40 18% 49 22% 29 13% 58 26% 44 20% 2 1%
WE FREQUENTLY EAT PREPARED OR FROZEN MEALS TO SAVE TIME 12 5% 51 23% 19 9% 65 29% 74 33% 1 0%
I FEEL LESS GUILTY ABOUT WASTING FOOD THAT HAS BEEN IN THE REFRIGERATOR FOR A LONG TIME
51 23% 51 23% 38 17% 38 17% 43 19% 1 0%
I FEEL LESS GUILTY ABOUT WASTING FOOD IF IT IS COMPOSTED 64 29% 60 27% 63 28% 13 6% 20 9% 2 1%
I PREFER FRUITS AND VEGETABLES WITH NO BLEMISHES 44 20% 77 35% 49 22% 34 15% 17 8% 1 0%
AT LEAST ONE PERSON IN THE HOUSEHOLD IS A SKILLED COOK 112 50% 52 23% 33 15% 9 4% 15 7% 1 0%
HAVING REGULAR FAMILY OR HOUSEHOLD MEALS IS IMPORTANT 144 65% 46 21% 23 10% 2 1% 5 2% 2 1%
GENERALLY, PREPARING FOOD FOR FRIENDS AND/OR FAMILY MAKES ME FEEL GOOD
150 68% 43 19% 19 9% 6 3% 2 1% 2 1%
WHEN HOUSEHOLD MEMBERS EAT OUT IT IS USUALLY SPUR OF THE MOMENT, OR PLANNED WITH LESS THAN 48 HOURS' NOTICE
96 43% 74 33% 18 8% 21 9% 12 5% 1 0%
WE CLEAN OUT OUR REFRIGERATOR REGULARLY (AT LEAST EVERY OTHER WEEK)
58 26% 56 25% 33 15% 41 18% 32 14% 2 1%
IT IS IMPORTANT THAT WE FINISH ALL FOOD THAT IS PUT ON OUR PLATES FOR A MEAL
57 26% 74 33% 42 19% 31 14% 15 7% 3 1%

Page 60 ESTIMATING QUANTITIES AND TYPES OF FOOD WASTE AT THE CITY LEVEL: TECHNICAL APPENDICES NRDC
Q23. HOW STRONGLY DO YOU AGREE OR DISAGREE WITH THE FOLLOWING STATEMENTS? (CONT.)
NYCAGREE SOMEWHAT AGREE
NEITHER AGREE NOR DISAGREE
SOMEWHAT DISAGREE
DISAGREE (BLANK)
# % # % # % # % # % # %
WE ARE VERY CAUTIOUS ABOUT AVOIDING FOOD POISONING 200 47% 94 22% 71 17% 35 8% 13 3% 15 4%
DATE LABELS ARE THE MAIN SOURCE OF INFORMATION WE USE WHEN DECIDING WHETHER TO THROW AWAY FOOD
97 23% 115 27% 58 14% 95 22% 49 11% 14 3%
WE FREQUENTLY USE SIGHT, TASTE, OR SMELL TO DETERMINE IF FOOD IS SAFE TO EAT
216 50% 152 36% 21 5% 18 4% 6 1% 15 4%
WE FREQUENTLY PUT FOODS THAT NEED TO BE USED SOON IN A CERTAIN PART OF THE REFRIGERATOR
116 27% 86 20% 58 14% 55 13% 99 23% 14 3%
I WOULD LIKE TO HAVE MORE TIME TO SPEND ON PREPARING AND COOKING FOOD
145 34% 114 27% 72 17% 36 8% 46 11% 15 4%
WE FREQUENTLY PREPARE MEALS A DAY OR MORE IN ADVANCE 70 16% 110 26% 61 14% 76 18% 95 22% 16 4%
WE FREQUENTLY EAT PREPARED OR FROZEN MEALS TO SAVE TIME 40 9% 80 19% 45 11% 89 21% 156 36% 18 4%
I FEEL LESS GUILTY ABOUT WASTING FOOD THAT HAS BEEN IN THE REFRIGERATOR FOR A LONG TIME
86 20% 106 25% 58 14% 53 12% 108 25% 17 4%
I FEEL LESS GUILTY ABOUT WASTING FOOD IF IT IS COMPOSTED 134 31% 115 27% 87 20% 24 6% 50 12% 18 4%
I PREFER FRUITS AND VEGETABLES WITH NO BLEMISHES 119 28% 153 36% 64 15% 47 11% 27 6% 18 4%
AT LEAST ONE PERSON IN THE HOUSEHOLD IS A SKILLED COOK 226 53% 93 22% 42 10% 17 4% 32 7% 18 4%
HAVING REGULAR FAMILY OR HOUSEHOLD MEALS IS IMPORTANT 296 69% 65 15% 35 8% 10 2% 5 1% 17 4%
GENERALLY, PREPARING FOOD FOR FRIENDS AND/OR FAMILY MAKES ME FEEL GOOD
260 61% 94 22% 35 8% 15 4% 5 1% 19 4%
WHEN HOUSEHOLD MEMBERS EAT OUT IT IS USUALLY SPUR OF THE MOMENT, OR PLANNED WITH LESS THAN 48 HOURS' NOTICE
158 37% 132 31% 57 13% 40 9% 22 5% 19 4%
WE CLEAN OUT OUR REFRIGERATOR REGULARLY (AT LEAST EVERY OTHER WEEK)
90 21% 85 20% 66 15% 77 18% 92 21% 18 4%
IT IS IMPORTANT THAT WE FINISH ALL FOOD THAT IS PUT ON OUR PLATES FOR A MEAL
140 33% 140 33% 51 12% 42 10% 37 9% 18 4%

Page 60 ESTIMATING QUANTITIES AND TYPES OF FOOD WASTE AT THE CITY LEVEL: TECHNICAL APPENDICES NRDC Page 61 ESTIMATING QUANTITIES AND TYPES OF FOOD WASTE AT THE CITY LEVEL: TECHNICAL APPENDICES NRDC
Q23. HOW STRONGLY DO YOU AGREE OR DISAGREE WITH THE FOLLOWING STATEMENTS? (CONT.)
TOTALAGREE SOMEWHAT AGREE
NEITHER AGREE NOR DISAGREE
SOMEWHAT DISAGREE
DISAGREE (BLANK)
# % # % # % # % # % # %
WE ARE VERY CAUTIOUS ABOUT AVOIDING FOOD POISONING 311 43% 177 24% 117 16% 82 11% 22 3% 17 2%
DATE LABELS ARE THE MAIN SOURCE OF INFORMATION WE USE WHEN DECIDING WHETHER TO THROW AWAY FOOD
133 18% 198 27% 98 13% 169 23% 112 15% 16 2%
WE FREQUENTLY USE SIGHT, TASTE, OR SMELL TO DETERMINE IF FOOD IS SAFE TO EAT
380 52% 255 35% 38 5% 27 4% 9 1% 17 2%
WE FREQUENTLY PUT FOODS THAT NEED TO BE USED SOON IN A CERTAIN PART OF THE REFRIGERATOR
185 25% 142 20% 100 14% 107 15% 174 24% 18 2%
I WOULD LIKE TO HAVE MORE TIME TO SPEND ON PREPARING AND COOKING FOOD
243 33% 197 27% 130 18% 63 9% 75 10% 18 2%
WE FREQUENTLY PREPARE MEALS A DAY OR MORE IN ADVANCE 123 17% 176 24% 102 14% 153 21% 152 21% 20 3%
WE FREQUENTLY EAT PREPARED OR FROZEN MEALS TO SAVE TIME 60 8% 146 20% 72 10% 174 24% 254 35% 20 3%
I FEEL LESS GUILTY ABOUT WASTING FOOD THAT HAS BEEN IN THE REFRIGERATOR FOR A LONG TIME
150 21% 178 25% 111 15% 99 14% 169 23% 19 3%
I FEEL LESS GUILTY ABOUT WASTING FOOD IF IT IS COMPOSTED 229 32% 194 27% 165 23% 41 6% 76 10% 21 3%
I PREFER FRUITS AND VEGETABLES WITH NO BLEMISHES 176 24% 253 35% 125 17% 95 13% 55 8% 22 3%
AT LEAST ONE PERSON IN THE HOUSEHOLD IS A SKILLED COOK 378 52% 161 22% 83 11% 31 4% 53 7% 20 3%
HAVING REGULAR FAMILY OR HOUSEHOLD MEALS IS IMPORTANT 492 68% 123 17% 67 9% 13 2% 11 2% 20 3%
GENERALLY, PREPARING FOOD FOR FRIENDS AND/OR FAMILY MAKES ME FEEL GOOD
464 64% 150 21% 59 8% 21 3% 10 1% 22 3%
WHEN HOUSEHOLD MEMBERS EAT OUT IT IS USUALLY SPUR OF THE MOMENT, OR PLANNED WITH LESS THAN 48 HOURS' NOTICE
292 40% 223 31% 85 12% 68 9% 36 5% 22 3%
WE CLEAN OUT OUR REFRIGERATOR REGULARLY (AT LEAST EVERY OTHER WEEK)
159 22% 160 22% 105 14% 137 19% 144 20% 21 3%
IT IS IMPORTANT THAT WE FINISH ALL FOOD THAT IS PUT ON OUR PLATES FOR A MEAL
216 30% 245 34% 104 14% 80 11% 59 8% 22 3%

Page 62 ESTIMATING QUANTITIES AND TYPES OF FOOD WASTE AT THE CITY LEVEL: TECHNICAL APPENDICES NRDC
Q23. HOW STRONGLY DO YOU AGREE OR DISAGREE WITH THE FOLLOWING STATEMENTS? (CONT.)
NUMBER/PERCENTAGE WHO RESPONDED "AGREE" OR "SOMEWHAT AGREE" TO THE FOLLOWING STATEMENTS:
# NASHVILLE % NASHVILLE # DENVER % DENVER # NYC % NYC # TOTAL % TOTAL
WE ARE VERY CAUTIOUS ABOUT AVOIDING FOOD POISONING 35 46% 159 72% 294 69% 488 67%
DATE LABELS ARE THE MAIN SOURCE OF INFORMATION WE USE WHEN DECIDING WHETHER TO THROW AWAY FOOD
22 29% 97 44% 212 50% 331 46%
WE FREQUENTLY USE SIGHT, TASTE, OR SMELL TO DETERMINE IF FOOD IS SAFE TO EAT
70 92% 197 89% 368 86% 635 87%
WE FREQUENTLY PUT FOODS THAT NEED TO BE USED SOON IN A CERTAIN PART OF THE REFRIGERATOR
30 39% 95 43% 202 47% 327 45%
I WOULD LIKE TO HAVE MORE TIME TO SPEND ON PREPARING AND COOKING FOOD
53 70% 128 58% 259 61% 440 61%
WE FREQUENTLY PREPARE MEALS A DAY OR MORE IN ADVANCE
30 39% 89 40% 180 42% 299 41%
WE FREQUENTLY EAT PREPARED OR FROZEN MEALS TO SAVE TIME
23 30% 63 28% 120 28% 206 28%
I FEEL LESS GUILTY ABOUT WASTING FOOD THAT HAS BEEN IN THE REFRIGERATOR FOR A LONG TIME
34 45% 102 46% 192 45% 328 45%
I FEEL LESS GUILTY ABOUT WASTING FOOD IF IT IS COMPOSTED
50 66% 124 56% 249 58% 423 58%
I PREFER FRUITS AND VEGETABLES WITH NO BLEMISHES
36 47% 121 55% 272 64% 429 59%
AT LEAST ONE PERSON IN THE HOUSEHOLD IS A SKILLED COOK 56 74% 164 74% 319 75% 539 74%
HAVING REGULAR FAMILY OR HOUSEHOLD MEALS IS IMPORTANT
64 84% 190 86% 361 84% 615 85%
GENERALLY, PREPARING FOOD FOR FRIENDS AND/OR FAMILY MAKES ME FEEL GOOD
67 88% 193 87% 354 83% 614 85%
WHEN HOUSEHOLD MEMBERS EAT OUT IT IS USUALLY SPUR OF THE MOMENT, OR PLANNED WITH LESS THAN 48 HOURS' NOTICE
55 72% 170 77% 290 68% 515 71%
WE CLEAN OUT OUR REFRIGERATOR REGULARLY (AT LEAST EVERY OTHER WEEK)
30 39% 114 51% 175 41% 319 44%
IT IS IMPORTANT THAT WE FINISH ALL FOOD THAT IS PUT ON OUR PLATES FOR A MEAL
50 66% 131 59% 280 65% 461 63%

Page 62 ESTIMATING QUANTITIES AND TYPES OF FOOD WASTE AT THE CITY LEVEL: TECHNICAL APPENDICES NRDC Page 63 ESTIMATING QUANTITIES AND TYPES OF FOOD WASTE AT THE CITY LEVEL: TECHNICAL APPENDICES NRDC
Q23. HOW STRONGLY DO YOU AGREE OR DISAGREE WITH THE FOLLOWING STATEMENTS? (CONT.)
NUMBER/PERCENTAGE WHO RESPONDED "DISAGREE" OR "SOMEWHAT DISAGREE" TO THE FOLLOWING STATEMENTS:
# NASHVILLE % NASHVILLE # DENVER % DENVER # NYC % NYC # TOTAL % TOTAL
WE ARE VERY CAUTIOUS ABOUT AVOIDING FOOD POISONING 24 32% 32 14% 48 11% 104 14%
DATE LABELS ARE THE MAIN SOURCE OF INFORMATION WE USE WHEN DECIDING WHETHER TO THROW AWAY FOOD
45 59% 92 41% 144 34% 281 39%
WE FREQUENTLY USE SIGHT, TASTE, OR SMELL TO DETERMINE IF FOOD IS SAFE TO EAT
3 4% 9 4% 24 6% 36 5%
WE FREQUENTLY PUT FOODS THAT NEED TO BE USED SOON IN A CERTAIN PART OF THE REFRIGERATOR
36 47% 91 41% 154 36% 281 39%
I WOULD LIKE TO HAVE MORE TIME TO SPEND ON PREPARING AND COOKING FOOD
13 17% 43 19% 82 19% 138 19%
WE FREQUENTLY PREPARE MEALS A DAY OR MORE IN ADVANCE
32 42% 102 46% 171 40% 305 42%
WE FREQUENTLY EAT PREPARED OR FROZEN MEALS TO SAVE TIME
44 58% 139 63% 245 57% 428 59%
I FEEL LESS GUILTY ABOUT WASTING FOOD THAT HAS BEEN IN THE REFRIGERATOR FOR A LONG TIME
26 34% 81 36% 161 38% 268 37%
I FEEL LESS GUILTY ABOUT WASTING FOOD IF IT IS COMPOSTED
10 13% 33 15% 74 17% 117 16%
I PREFER FRUITS AND VEGETABLES WITH NO BLEMISHES
25 33% 51 23% 74 17% 150 21%
AT LEAST ONE PERSON IN THE HOUSEHOLD IS A SKILLED COOK 11 14% 24 11% 49 11% 84 12%
HAVING REGULAR FAMILY OR HOUSEHOLD MEALS IS IMPORTANT
2 3% 7 3% 15 4% 24 3%
GENERALLY, PREPARING FOOD FOR FRIENDS AND/OR FAMILY MAKES ME FEEL GOOD
3 4% 8 4% 20 5% 31 4%
WHEN HOUSEHOLD MEMBERS EAT OUT IT IS USUALLY SPUR OF THE MOMENT, OR PLANNED WITH LESS THAN 48 HOURS' NOTICE
9 12% 33 15% 62 14% 104 14%
WE CLEAN OUT OUR REFRIGERATOR REGULARLY (AT LEAST EVERY OTHER WEEK)
39 51% 73 33% 169 39% 281 39%
IT IS IMPORTANT THAT WE FINISH ALL FOOD THAT IS PUT ON OUR PLATES FOR A MEAL
14 18% 46 21% 79 18% 139 19%

Page 64 ESTIMATING QUANTITIES AND TYPES OF FOOD WASTE AT THE CITY LEVEL: TECHNICAL APPENDICES NRDC
Q24. CONSIDERING THE FOOD THROWN AWAY IN YOUR HOUSEHOLD IN THE AVERAGE WEEK, HOW MUCH OF THAT FOOD DISPOSAL DO YOU THINK COULD BE AVOIDED (E.G. THROUGH PLANNING MEALS AHEAD OF TIME, CHANGING FOOD SHOPPING HABITS)?
# NASHVILLE % NASHVILLE # DENVER % DENVER # NYC % NYC # TOTAL % TOTAL
NONE 7 9% 22 10% 45 11% 74 10%
A LITTLE 52 68% 139 63% 243 57% 434 60%
A FAIR AMOUNT 12 16% 47 21% 104 24% 163 22%
A LOT 4 5% 13 6% 23 5% 40 6%
(BLANK) 1 1% 1 0% 13 3% 15 2%
TOTAL 76 100% 222 100% 428 100% 726 100%
Q25. DO YOU THINK THE AMOUNT OF EDIBLE FOOD YOU THROW OUT IS MORE THAN, THE SAME AS, OR LESS THAN THE AVERAGE AMERICAN?
# NASHVILLE % NASHVILLE # DENVER % DENVER # NYC % NYC # TOTAL % TOTAL
A LOT LESS 33 43% 90 41% 179 42% 302 42%
A LITTLE BIT LESS 25 33% 77 35% 147 34% 249 34%
THE SAME 12 16% 38 17% 63 15% 113 16%
A LITTLE BIT MORE 4 5% 10 5% 20 5% 34 5%
A LOT MORE 1 1% 6 3% 6 1% 13 2%
(BLANK) 1 1% 1 0% 13 3% 15 2%
TOTAL 76 100% 222 100% 428 100% 726 100%
Q26. DOES YOUR HOUSEHOLD CURRENTLY COMPOST FOOD?
# NASHVILLE % NASHVILLE # DENVER % DENVER # NYC % NYC # TOTAL % TOTAL
NO 49 64% 149 67% 236 55% 434 58%
YES, WE COMPOST AT OUR HOME 23 30% 38 17% 47 11% 108 14%
YES, WE CONTRIBUTE TO COMMUNITY OR OTHER TYPE OF COMPOSTING
2 3% 7 3% 52 12% 61 8%
YES, WE SUBSCRIBE TO A COMPOSTING SERVICE 1 1% 32 14% 100 23% 133 18%
(BLANK) 1 1% 1 0% 15 4% 17 2%
TOTAL 76 100% 227 102% 450 105% 753 100%
Note that some respondents compost in more than one way, which is why individual city totals may add up to >100%.

Page 64 ESTIMATING QUANTITIES AND TYPES OF FOOD WASTE AT THE CITY LEVEL: TECHNICAL APPENDICES NRDC Page 65 ESTIMATING QUANTITIES AND TYPES OF FOOD WASTE AT THE CITY LEVEL: TECHNICAL APPENDICES NRDC
Q27. HOW OFTEN DO YOU AND OTHER HOUSEHOLD MEMBERS TAKE THE FOLLOWING ACTIONS DURING THE AVERAGE WEEK?
NASHVILLENEVER RARELY SOMETIMES MOST OF THE TIME ALWAYS (BLANK)
# % # % # % # % # % # %
REMOVE AND DISCARD ONLY THE BRUISED PARTS OF FRUITS AND VEGETABLES INSTEAD OF THROWING AWAY THE ENTIRE FOOD
4 5% 7 9% 15 20% 27 36% 22 29% 1 1%
TRY TO USE ALL PARTS OF FOOD ITEMS (E.G. BROCCOLI STALKS, BONES FOR SOUPS, ETC.)
5 7% 15 20% 22 29% 20 26% 13 17% 1 1%
PRIORITIZE EATING LEFTOVERS 0 0% 4 5% 11 14% 34 45% 26 34% 1 1%
FREEZE FOOD IF YOU THINK YOU WILL NOT BE ABLE TO EAT IT IN TIME 3 4% 11 14% 15 20% 25 33% 20 26% 2 3%
DENVERNEVER RARELY SOMETIMES MOST OF THE TIME ALWAYS (BLANK)
# % # % # % # % # % # %
REMOVE AND DISCARD ONLY THE BRUISED PARTS OF FRUITS AND VEGETABLES INSTEAD OF THROWING AWAY THE ENTIRE FOOD
6 3% 22 10% 62 28% 84 38% 47 21% 1 0%
TRY TO USE ALL PARTS OF FOOD ITEMS (E.G. BROCCOLI STALKS, BONES FOR SOUPS, ETC.)
19 9% 53 24% 71 32% 50 23% 27 12% 2 1%
PRIORITIZE EATING LEFTOVERS 5 2% 12 5% 44 20% 105 47% 53 24% 3 1%
FREEZE FOOD IF YOU THINK YOU WILL NOT BE ABLE TO EAT IT IN TIME 12 5% 17 8% 51 23% 76 34% 65 29% 1 0%
NYCNEVER RARELY SOMETIMES MOST OF THE TIME ALWAYS (BLANK)
# % # % # % # % # % # %
REMOVE AND DISCARD ONLY THE BRUISED PARTS OF FRUITS AND VEGETABLES INSTEAD OF THROWING AWAY THE ENTIRE FOOD
19 4% 41 10% 107 25% 125 29% 116 27% 20 5%
TRY TO USE ALL PARTS OF FOOD ITEMS (E.G. BROCCOLI STALKS, BONES FOR SOUPS, ETC.)
29 7% 59 14% 137 32% 120 28% 64 15% 19 4%
PRIORITIZE EATING LEFTOVERS 8 2% 18 4% 103 24% 149 35% 130 30% 20 5%
FREEZE FOOD IF YOU THINK YOU WILL NOT BE ABLE TO EAT IT IN TIME 19 4% 39 9% 81 19% 150 35% 119 28% 20 5%
TOTALNEVER RARELY SOMETIMES MOST OF THE TIME ALWAYS (BLANK)
# % # % # % # % # % # %
REMOVE AND DISCARD ONLY THE BRUISED PARTS OF FRUITS AND VEGETABLES INSTEAD OF THROWING AWAY THE ENTIRE FOOD
29 4% 70 10% 184 25% 236 33% 185 25% 22 3%
TRY TO USE ALL PARTS OF FOOD ITEMS (E.G. BROCCOLI STALKS, BONES FOR SOUPS, ETC.)
53 7% 127 17% 230 32% 190 26% 104 14% 22 3%
PRIORITIZE EATING LEFTOVERS 13 2% 34 5% 158 22% 288 40% 209 29% 24 3%
FREEZE FOOD IF YOU THINK YOU WILL NOT BE ABLE TO EAT IT IN TIME 34 5% 67 9% 147 20% 251 35% 204 28% 23 3%

Page 66 ESTIMATING QUANTITIES AND TYPES OF FOOD WASTE AT THE CITY LEVEL: TECHNICAL APPENDICES NRDC
Q27. HOW OFTEN DO YOU AND OTHER HOUSEHOLD MEMBERS TAKE THE FOLLOWING ACTIONS DURING THE AVERAGE WEEK? (CONT.)
NUMBER/PERCENTAGE WHO "ALWAYS" OR "MOST OF THE TIME" TAKE THE FOLLOWING ACTIONS DURING THE AVERAGE WEEK:
# NASHVILLE % NASHVILLE # DENVER % DENVER # NYC % NYC # TOTAL % TOTAL
REMOVE AND DISCARD ONLY THE BRUISED PARTS OF FRUITS AND VEGETABLES INSTEAD OF THROWING AWAY THE ENTIRE FOOD
49 64% 131 59% 241 56% 421 58%
TRY TO USE ALL PARTS OF FOOD ITEMS (E.G. BROCCOLI STALKS, BONES FOR SOUPS, ETC.)
33 43% 77 35% 184 43% 294 40%
PRIORITIZE EATING LEFTOVERS 60 79% 158 71% 279 65% 497 68%
FREEZE FOOD IF YOU THINK YOU WILL NOT BE ABLE TO EAT IT IN TIME
45 59% 141 64% 269 63% 455 63%
NUMBER/PERCENTAGE WHO "RARELY" OR "NEVER" TAKE THE FOLLOWING ACTIONS DURING THE AVERAGE WEEK:
# NASHVILLE % NASHVILLE # DENVER % DENVER # NYC % NYC # TOTAL % TOTAL
REMOVE AND DISCARD ONLY THE BRUISED PARTS OF FRUITS AND VEGETABLES INSTEAD OF THROWING AWAY THE ENTIRE FOOD
11 14% 28 13% 60 14% 99 14%
TRY TO USE ALL PARTS OF FOOD ITEMS (E.G. BROCCOLI STALKS, BONES FOR SOUPS, ETC.)
20 26% 72 32% 88 21% 180 25%
PRIORITIZE EATING LEFTOVERS 4 5% 17 8% 26 6% 47 6%
FREEZE FOOD IF YOU THINK YOU WILL NOT BE ABLE TO EAT IT IN TIME
14 18% 29 13% 58 14% 101 14%
Q28. IN GENERAL, WHAT HAPPENS TO LEFTOVERS IN YOUR HOUSEHOLD? (SELECT ALL THAT APPLY)
# NASHVILLE % NASHVILLE # DENVER % DENVER # NYC % NYC # TOTAL % TOTAL
LEFTOVERS ARE EATEN AS ANOTHER MEAL WITHOUT ALTERATION
59 78% 169 76% 308 72% 536 74%
LEFTOVERS ARE USED AS PART OF ANOTHER MEAL (OTHER FOOD IS ADDED)
46 61% 124 56% 258 60% 428 59%
LEFTOVERS ARE COMPOSTED 10 13% 20 9% 56 13% 86 12%
LEFTOVERS ARE THROWN IN THE GARBAGE 18 24% 44 20% 77 18% 139 19%
LEFTOVERS GET FED TO ANIMALS 9 12% 36 16% 31 7% 76 10%
WE DON'T HAVE LEFTOVERS 3 4% 12 5% 22 5% 37 5%
(BLANK) 0 0% 0 0% 8 2% 8 1%
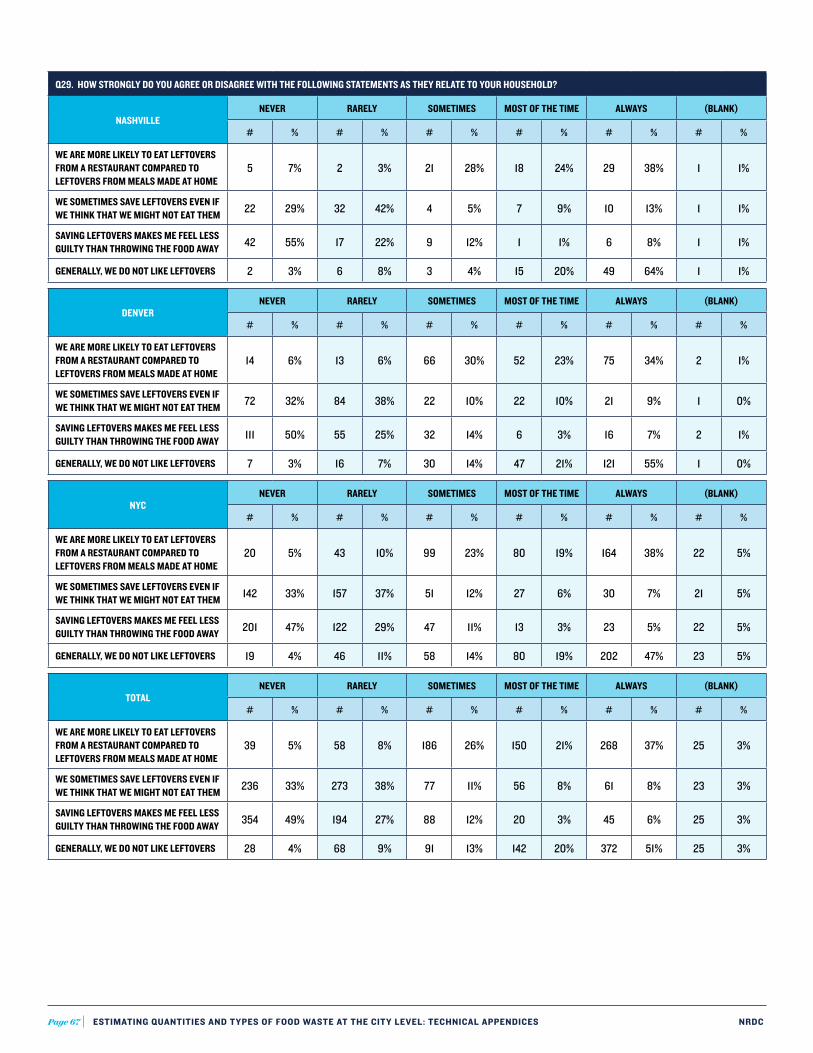
Page 66 ESTIMATING QUANTITIES AND TYPES OF FOOD WASTE AT THE CITY LEVEL: TECHNICAL APPENDICES NRDC Page 67 ESTIMATING QUANTITIES AND TYPES OF FOOD WASTE AT THE CITY LEVEL: TECHNICAL APPENDICES NRDC
Q29. HOW STRONGLY DO YOU AGREE OR DISAGREE WITH THE FOLLOWING STATEMENTS AS THEY RELATE TO YOUR HOUSEHOLD?
NASHVILLENEVER RARELY SOMETIMES MOST OF THE TIME ALWAYS (BLANK)
# % # % # % # % # % # %
WE ARE MORE LIKELY TO EAT LEFTOVERS FROM A RESTAURANT COMPARED TO LEFTOVERS FROM MEALS MADE AT HOME
5 7% 2 3% 21 28% 18 24% 29 38% 1 1%
WE SOMETIMES SAVE LEFTOVERS EVEN IF WE THINK THAT WE MIGHT NOT EAT THEM 22 29% 32 42% 4 5% 7 9% 10 13% 1 1%
SAVING LEFTOVERS MAKES ME FEEL LESS GUILTY THAN THROWING THE FOOD AWAY 42 55% 17 22% 9 12% 1 1% 6 8% 1 1%
GENERALLY, WE DO NOT LIKE LEFTOVERS 2 3% 6 8% 3 4% 15 20% 49 64% 1 1%
DENVERNEVER RARELY SOMETIMES MOST OF THE TIME ALWAYS (BLANK)
# % # % # % # % # % # %
WE ARE MORE LIKELY TO EAT LEFTOVERS FROM A RESTAURANT COMPARED TO LEFTOVERS FROM MEALS MADE AT HOME
14 6% 13 6% 66 30% 52 23% 75 34% 2 1%
WE SOMETIMES SAVE LEFTOVERS EVEN IF WE THINK THAT WE MIGHT NOT EAT THEM 72 32% 84 38% 22 10% 22 10% 21 9% 1 0%
SAVING LEFTOVERS MAKES ME FEEL LESS GUILTY THAN THROWING THE FOOD AWAY 111 50% 55 25% 32 14% 6 3% 16 7% 2 1%
GENERALLY, WE DO NOT LIKE LEFTOVERS 7 3% 16 7% 30 14% 47 21% 121 55% 1 0%
NYCNEVER RARELY SOMETIMES MOST OF THE TIME ALWAYS (BLANK)
# % # % # % # % # % # %
WE ARE MORE LIKELY TO EAT LEFTOVERS FROM A RESTAURANT COMPARED TO LEFTOVERS FROM MEALS MADE AT HOME
20 5% 43 10% 99 23% 80 19% 164 38% 22 5%
WE SOMETIMES SAVE LEFTOVERS EVEN IF WE THINK THAT WE MIGHT NOT EAT THEM 142 33% 157 37% 51 12% 27 6% 30 7% 21 5%
SAVING LEFTOVERS MAKES ME FEEL LESS GUILTY THAN THROWING THE FOOD AWAY 201 47% 122 29% 47 11% 13 3% 23 5% 22 5%
GENERALLY, WE DO NOT LIKE LEFTOVERS 19 4% 46 11% 58 14% 80 19% 202 47% 23 5%
TOTALNEVER RARELY SOMETIMES MOST OF THE TIME ALWAYS (BLANK)
# % # % # % # % # % # %
WE ARE MORE LIKELY TO EAT LEFTOVERS FROM A RESTAURANT COMPARED TO LEFTOVERS FROM MEALS MADE AT HOME
39 5% 58 8% 186 26% 150 21% 268 37% 25 3%
WE SOMETIMES SAVE LEFTOVERS EVEN IF WE THINK THAT WE MIGHT NOT EAT THEM 236 33% 273 38% 77 11% 56 8% 61 8% 23 3%
SAVING LEFTOVERS MAKES ME FEEL LESS GUILTY THAN THROWING THE FOOD AWAY 354 49% 194 27% 88 12% 20 3% 45 6% 25 3%
GENERALLY, WE DO NOT LIKE LEFTOVERS 28 4% 68 9% 91 13% 142 20% 372 51% 25 3%

Page 68 ESTIMATING QUANTITIES AND TYPES OF FOOD WASTE AT THE CITY LEVEL: TECHNICAL APPENDICES NRDC
Q29. HOW STRONGLY DO YOU AGREE OR DISAGREE WITH THE FOLLOWING STATEMENTS AS THEY RELATE TO YOUR HOUSEHOLD? (CONT.)
NUMBER/PERCENTAGE WHO RESPONDED "AGREE" OR "SOMEWHAT AGREE" TO THE FOLLOWING STATEMENTS:
# NASHVILLE % NASHVILLE # DENVER % DENVER # NYC % NYC # TOTAL % TOTAL
WE ARE MORE LIKELY TO EAT LEFTOVERS FROM A RESTAURANT COMPARED TO LEFTOVERS FROM MEALS MADE AT HOME
7 9% 27 12% 63 15% 97 13%
WE SOMETIMES SAVE LEFTOVERS EVEN IF WE THINK THAT WE MIGHT NOT EAT THEM
54 71% 156 70% 299 70% 509 70%
SAVING LEFTOVERS MAKES ME FEEL LESS GUILTY THAN THROWING THE FOOD AWAY
59 78% 166 75% 323 75% 548 75%
GENERALLY, WE DO NOT LIKE LEFTOVERS 8 11% 23 10% 65 15% 96 13%
NUMBER/PERCENTAGE WHO RESPONDED "DISAGREE" OR "SOMEWHAT DISAGREE" TO THE FOLLOWING STATEMENTS:
# NASHVILLE % NASHVILLE # DENVER % DENVER # NYC % NYC # TOTAL % TOTAL
WE ARE MORE LIKELY TO EAT LEFTOVERS FROM A RESTAURANT COMPARED TO LEFTOVERS FROM MEALS MADE AT HOME
47 62% 127 57% 244 57% 418 58%
WE SOMETIMES SAVE LEFTOVERS EVEN IF WE THINK THAT WE MIGHT NOT EAT THEM
17 22% 43 19% 57 13% 117 16%
SAVING LEFTOVERS MAKES ME FEEL LESS GUILTY THAN THROWING THE FOOD AWAY
7 9% 22 10% 36 8% 65 9%
GENERALLY, WE DO NOT LIKE LEFTOVERS 64 84% 168 76% 282 66% 514 71%
Q30. HOW STRONGLY DO YOU AGREE OR DISAGREE WITH THE FOLLOWING STATEMENTS AS THEY RELATE TO YOUR HOUSEHOLD?
NASHVILLEAGREE SOMEWHAT AGREE
NEITHER AGREE NOR DISAGREE
SOMEWHAT DISAGREE
DISAGREE (BLANK)
# % # % # % # % # % # %
IN THE PAST YEAR, MY HOUSEHOLD HAS MADE AN EFFORT TO REDUCE THE AMOUNT OF FOOD WE THROW AWAY
19 25% 21 28% 18 24% 4 5% 12 16% 2 3%
MY HOUSEHOLD HAS COMPLETE CONTROL OVER REDUCING THE AMOUNT OF FOOD WE THROW AWAY
34 45% 18 24% 12 16% 8 11% 3 4% 1 1%
PEOPLE AROUND ME BELIEVE MY HOUSEHOLD SHOULD REDUCE THE AMOUNT OF FOOD WE THROW AWAY
2 3% 7 9% 25 33% 3 4% 38 50% 1 1%
MY HOUSEHOLD BELIEVES THAT REDUCING THE AMOUNT OF FOOD WE THROW AWAY WOULD BE GOOD
43 57% 17 22% 11 14% 0 0% 4 5% 1 1%
MY HOUSEHOLD INTENDS TO REDUCE THE AMOUNT OF FOOD WE THROW AWAY 34 45% 14 18% 21 28% 2 3% 4 5% 1 1%
GIVEN THE AMOUNT OF FOOD THAT IS THROWN AWAY IN THIS COUNTRY, THE ACTIONS OF MY HOUSEHOLD WON'T MAKE A MEANINGFUL DIFFERENCE IN THE AMOUNT OF FOOD BEING WASTED
5 7% 13 17% 11 14% 14 18% 32 42% 1 1%

Page 68 ESTIMATING QUANTITIES AND TYPES OF FOOD WASTE AT THE CITY LEVEL: TECHNICAL APPENDICES NRDC Page 69 ESTIMATING QUANTITIES AND TYPES OF FOOD WASTE AT THE CITY LEVEL: TECHNICAL APPENDICES NRDC
Q30. HOW STRONGLY DO YOU AGREE OR DISAGREE WITH THE FOLLOWING STATEMENTS AS THEY RELATE TO YOUR HOUSEHOLD? (CONT.)
DENVERAGREE SOMEWHAT AGREE
NEITHER AGREE NOR DISAGREE
SOMEWHAT DISAGREE
DISAGREE (BLANK)
# % # % # % # % # % # %
IN THE PAST YEAR, MY HOUSEHOLD HAS MADE AN EFFORT TO REDUCE THE AMOUNT OF FOOD WE THROW AWAY
64 29% 66 30% 59 27% 18 8% 14 6% 1 0%
MY HOUSEHOLD HAS COMPLETE CONTROL OVER REDUCING THE AMOUNT OF FOOD WE THROW AWAY
95 43% 73 33% 33 15% 16 7% 4 2% 1 0%
PEOPLE AROUND ME BELIEVE MY HOUSEHOLD SHOULD REDUCE THE AMOUNT OF FOOD WE THROW AWAY
15 7% 20 9% 68 31% 16 7% 102 46% 1 0%
MY HOUSEHOLD BELIEVES THAT REDUCING THE AMOUNT OF FOOD WE THROW AWAY WOULD BE GOOD
133 60% 54 24% 27 12% 3 1% 3 1% 2 1%
MY HOUSEHOLD INTENDS TO REDUCE THE AMOUNT OF FOOD WE THROW AWAY 102 46% 67 30% 41 18% 5 2% 5 2% 2 1%
GIVEN THE AMOUNT OF FOOD THAT IS THROWN AWAY IN THIS COUNTRY, THE ACTIONS OF MY HOUSEHOLD WON'T MAKE A MEANINGFUL DIFFERENCE IN THE AMOUNT OF FOOD BEING WASTED
16 7% 34 15% 33 15% 52 23% 86 39% 1 0%
NYCAGREE SOMEWHAT AGREE
NEITHER AGREE NOR DISAGREE
SOMEWHAT DISAGREE
DISAGREE (BLANK)
# % # % # % # % # % # %
IN THE PAST YEAR, MY HOUSEHOLD HAS MADE AN EFFORT TO REDUCE THE AMOUNT OF FOOD WE THROW AWAY
138 32% 113 26% 89 21% 29 7% 38 9% 21 5%
MY HOUSEHOLD HAS COMPLETE CONTROL OVER REDUCING THE AMOUNT OF FOOD WE THROW AWAY
157 37% 132 31% 69 16% 39 9% 9 2% 22 5%
PEOPLE AROUND ME BELIEVE MY HOUSEHOLD SHOULD REDUCE THE AMOUNT OF FOOD WE THROW AWAY
28 7% 35 8% 115 27% 36 8% 189 44% 25 6%
MY HOUSEHOLD BELIEVES THAT REDUCING THE AMOUNT OF FOOD WE THROW AWAY WOULD BE GOOD
218 51% 100 23% 70 16% 7 2% 9 2% 24 6%
MY HOUSEHOLD INTENDS TO REDUCE THE AMOUNT OF FOOD WE THROW AWAY 172 40% 120 28% 86 20% 15 4% 9 2% 26 6%
GIVEN THE AMOUNT OF FOOD THAT IS THROWN AWAY IN THIS COUNTRY, THE ACTIONS OF MY HOUSEHOLD WON'T MAKE A MEANINGFUL DIFFERENCE IN THE AMOUNT OF FOOD BEING WASTED
35 8% 67 16% 75 18% 76 18% 151 35% 24 6%

Page 70 ESTIMATING QUANTITIES AND TYPES OF FOOD WASTE AT THE CITY LEVEL: TECHNICAL APPENDICES NRDC
Q30. HOW STRONGLY DO YOU AGREE OR DISAGREE WITH THE FOLLOWING STATEMENTS AS THEY RELATE TO YOUR HOUSEHOLD? (CONT.)
TOTALAGREE SOMEWHAT AGREE
NEITHER AGREE NOR DISAGREE
SOMEWHAT DISAGREE
DISAGREE (BLANK)
# % # % # % # % # % # %
IN THE PAST YEAR, MY HOUSEHOLD HAS MADE AN EFFORT TO REDUCE THE AMOUNT OF FOOD WE THROW AWAY
221 30% 200 28% 166 23% 51 7% 64 9% 24 3%
MY HOUSEHOLD HAS COMPLETE CONTROL OVER REDUCING THE AMOUNT OF FOOD WE THROW AWAY
286 39% 223 31% 114 16% 63 9% 16 2% 24 3%
PEOPLE AROUND ME BELIEVE MY HOUSEHOLD SHOULD REDUCE THE AMOUNT OF FOOD WE THROW AWAY
45 6% 62 9% 208 29% 55 8% 329 45% 27 4%
MY HOUSEHOLD BELIEVES THAT REDUCING THE AMOUNT OF FOOD WE THROW AWAY WOULD BE GOOD
394 54% 171 24% 108 15% 10 1% 16 2% 27 4%
MY HOUSEHOLD INTENDS TO REDUCE THE AMOUNT OF FOOD WE THROW AWAY 308 42% 201 28% 148 20% 22 3% 18 2% 29 4%
GIVEN THE AMOUNT OF FOOD THAT IS THROWN AWAY IN THIS COUNTRY, THE ACTIONS OF MY HOUSEHOLD WON'T MAKE A MEANINGFUL DIFFERENCE IN THE AMOUNT OF FOOD BEING WASTED
56 8% 114 16% 119 16% 142 20% 269 37% 26 4%
NUMBER/PERCENTAGE WHO RESPONDED "AGREE" OR "SOMEWHAT AGREE" TO THE FOLLOWING STATEMENTS:
# NASHVILLE % NASHVILLE # DENVER % DENVER # NYC % NYC # TOTAL % TOTAL
IN THE PAST YEAR, MY HOUSEHOLD HAS MADE AN EFFORT TO REDUCE THE AMOUNT OF FOOD WE THROW AWAY
40 53% 130 59% 251 59% 421 58%
MY HOUSEHOLD HAS COMPLETE CONTROL OVER REDUCING THE AMOUNT OF FOOD WE THROW AWAY
52 68% 168 76% 289 68% 509 70%
PEOPLE AROUND ME BELIEVE MY HOUSEHOLD SHOULD REDUCE THE AMOUNT OF FOOD WE THROW AWAY
9 12% 35 16% 63 15% 107 15%
MY HOUSEHOLD BELIEVES THAT REDUCING THE AMOUNT OF FOOD WE THROW AWAY WOULD BE GOOD
60 79% 187 84% 318 74% 565 78%
MY HOUSEHOLD INTENDS TO REDUCE THE AMOUNT OF FOOD WE THROW AWAY
48 63% 169 76% 292 68% 509 70%
GIVEN THE AMOUNT OF FOOD THAT IS THROWN AWAY IN THIS COUNTRY, THE ACTIONS OF MY HOUSEHOLD WON'T MAKE A MEANINGFUL DIFFERENCE IN THE AMOUNT OF FOOD BEING WASTED
18 24% 50 23% 102 24% 170 23%

Page 70 ESTIMATING QUANTITIES AND TYPES OF FOOD WASTE AT THE CITY LEVEL: TECHNICAL APPENDICES NRDC Page 71 ESTIMATING QUANTITIES AND TYPES OF FOOD WASTE AT THE CITY LEVEL: TECHNICAL APPENDICES NRDC
Q30. HOW STRONGLY DO YOU AGREE OR DISAGREE WITH THE FOLLOWING STATEMENTS AS THEY RELATE TO YOUR HOUSEHOLD? (CONT.)
NUMBER/PERCENTAGE WHO RESPONDED "DISAGREE" OR "SOMEWHAT DISAGREE" TO THE FOLLOWING STATEMENTS:
# NASHVILLE % NASHVILLE # DENVER % DENVER # NYC % NYC # TOTAL % TOTAL
IN THE PAST YEAR, MY HOUSEHOLD HAS MADE AN EFFORT TO REDUCE THE AMOUNT OF FOOD WE THROW AWAY
16 21% 32 14% 67 16% 115 16%
MY HOUSEHOLD HAS COMPLETE CONTROL OVER REDUCING THE AMOUNT OF FOOD WE THROW AWAY
11 14% 20 9% 48 11% 79 11%
PEOPLE AROUND ME BELIEVE MY HOUSEHOLD SHOULD REDUCE THE AMOUNT OF FOOD WE THROW AWAY
41 54% 118 53% 225 53% 384 53%
MY HOUSEHOLD BELIEVES THAT REDUCING THE AMOUNT OF FOOD WE THROW AWAY WOULD BE GOOD
4 5% 6 3% 16 4% 26 4%
MY HOUSEHOLD INTENDS TO REDUCE THE AMOUNT OF FOOD WE THROW AWAY
6 8% 10 5% 24 6% 40 6%
GIVEN THE AMOUNT OF FOOD THAT IS THROWN AWAY IN THIS COUNTRY, THE ACTIONS OF MY HOUSEHOLD WON'T MAKE A MEANINGFUL DIFFERENCE IN THE AMOUNT OF FOOD BEING WASTED
46 61% 138 62% 227 53% 411 57%
Q31. HOW STRONGLY DO YOU AGREE OR DISAGREE WITH THE FOLLOWING STATEMENTS AS THEY RELATE TO YOUR HOUSEHOLD?
NASHVILLEAGREE SOMEWHAT AGREE
NEITHER AGREE NOR DISAGREE
SOMEWHAT DISAGREE
DISAGREE (BLANK)
# % # % # % # % # % # %
REDUCING MY HOUSEHOLD'S FOOD WASTE WOULD SAVE ENERGY 41 54% 19 25% 11 14% 0 0% 4 5% 2 3%
REDUCING MY HOUSEHOLD'S FOOD WASTE WOULD SAVE WATER 45 59% 16 21% 10 13% 1 1% 3 4% 1 1%
REDUCING MY HOUSEHOLD'S FOOD WASTE WOULD FEED HUNGRY PEOPLE 16 21% 16 21% 15 20% 19 25% 9 12% 1 1%
REDUCING MY HOUSEHOLD'S FOOD WASTE WOULD IMPROVE THE HEALTH OF MY HOUSEHOLD
18 24% 18 24% 24 32% 7 9% 8 11% 1 1%
REDUCING MY HOUSEHOLD'S FOOD WASTE WOULD SAVE MY HOUSEHOLD MONEY
56 74% 11 14% 4 5% 2 3% 2 3% 1 1%
REDUCING MY HOUSEHOLD'S FOOD WASTE WOULD DECREASE LANDFILL USE 56 74% 6 8% 6 8% 2 3% 4 5% 2 3%
REDUCING MY HOUSEHOLD'S FOOD WASTE WOULD DECREASE CARBON EMISSIONS
48 63% 13 17% 9 12% 2 3% 3 4% 1 1%
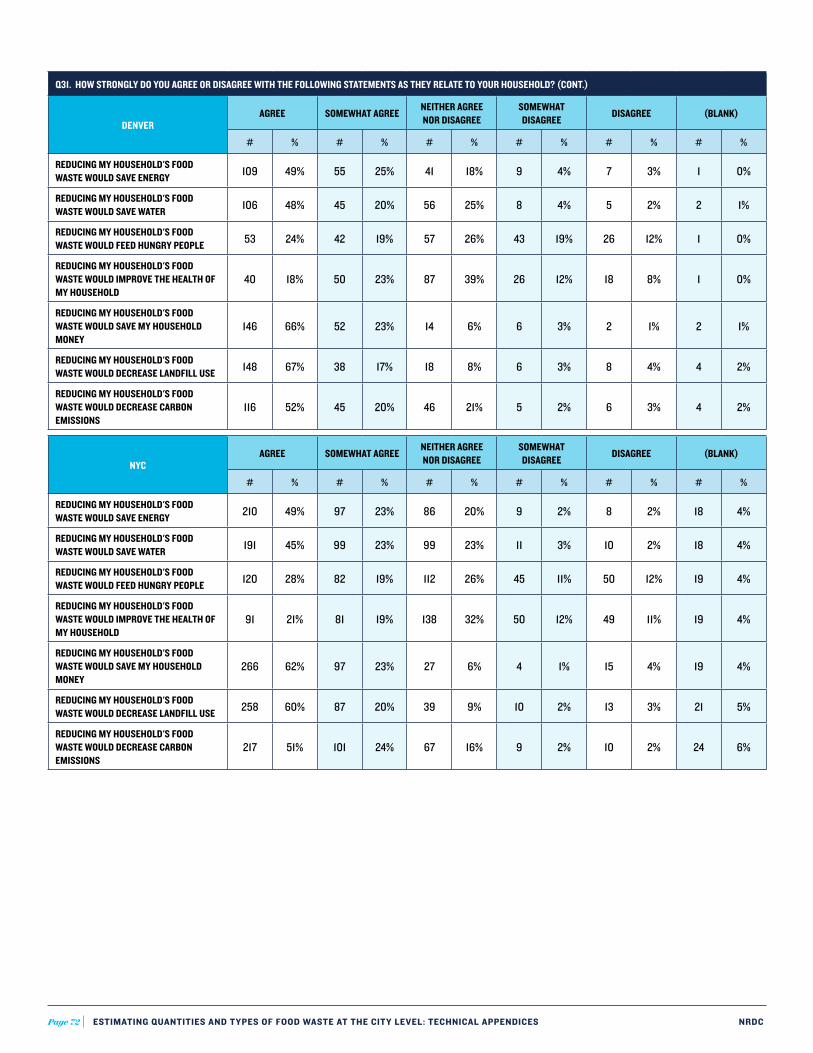
Page 72 ESTIMATING QUANTITIES AND TYPES OF FOOD WASTE AT THE CITY LEVEL: TECHNICAL APPENDICES NRDC
Q31. HOW STRONGLY DO YOU AGREE OR DISAGREE WITH THE FOLLOWING STATEMENTS AS THEY RELATE TO YOUR HOUSEHOLD? (CONT.)
DENVERAGREE SOMEWHAT AGREE
NEITHER AGREE NOR DISAGREE
SOMEWHAT DISAGREE
DISAGREE (BLANK)
# % # % # % # % # % # %
REDUCING MY HOUSEHOLD'S FOOD WASTE WOULD SAVE ENERGY 109 49% 55 25% 41 18% 9 4% 7 3% 1 0%
REDUCING MY HOUSEHOLD'S FOOD WASTE WOULD SAVE WATER 106 48% 45 20% 56 25% 8 4% 5 2% 2 1%
REDUCING MY HOUSEHOLD'S FOOD WASTE WOULD FEED HUNGRY PEOPLE 53 24% 42 19% 57 26% 43 19% 26 12% 1 0%
REDUCING MY HOUSEHOLD'S FOOD WASTE WOULD IMPROVE THE HEALTH OF MY HOUSEHOLD
40 18% 50 23% 87 39% 26 12% 18 8% 1 0%
REDUCING MY HOUSEHOLD'S FOOD WASTE WOULD SAVE MY HOUSEHOLD MONEY
146 66% 52 23% 14 6% 6 3% 2 1% 2 1%
REDUCING MY HOUSEHOLD'S FOOD WASTE WOULD DECREASE LANDFILL USE 148 67% 38 17% 18 8% 6 3% 8 4% 4 2%
REDUCING MY HOUSEHOLD'S FOOD WASTE WOULD DECREASE CARBON EMISSIONS
116 52% 45 20% 46 21% 5 2% 6 3% 4 2%
NYCAGREE SOMEWHAT AGREE
NEITHER AGREE NOR DISAGREE
SOMEWHAT DISAGREE
DISAGREE (BLANK)
# % # % # % # % # % # %
REDUCING MY HOUSEHOLD'S FOOD WASTE WOULD SAVE ENERGY 210 49% 97 23% 86 20% 9 2% 8 2% 18 4%
REDUCING MY HOUSEHOLD'S FOOD WASTE WOULD SAVE WATER 191 45% 99 23% 99 23% 11 3% 10 2% 18 4%
REDUCING MY HOUSEHOLD'S FOOD WASTE WOULD FEED HUNGRY PEOPLE 120 28% 82 19% 112 26% 45 11% 50 12% 19 4%
REDUCING MY HOUSEHOLD'S FOOD WASTE WOULD IMPROVE THE HEALTH OF MY HOUSEHOLD
91 21% 81 19% 138 32% 50 12% 49 11% 19 4%
REDUCING MY HOUSEHOLD'S FOOD WASTE WOULD SAVE MY HOUSEHOLD MONEY
266 62% 97 23% 27 6% 4 1% 15 4% 19 4%
REDUCING MY HOUSEHOLD'S FOOD WASTE WOULD DECREASE LANDFILL USE 258 60% 87 20% 39 9% 10 2% 13 3% 21 5%
REDUCING MY HOUSEHOLD'S FOOD WASTE WOULD DECREASE CARBON EMISSIONS
217 51% 101 24% 67 16% 9 2% 10 2% 24 6%
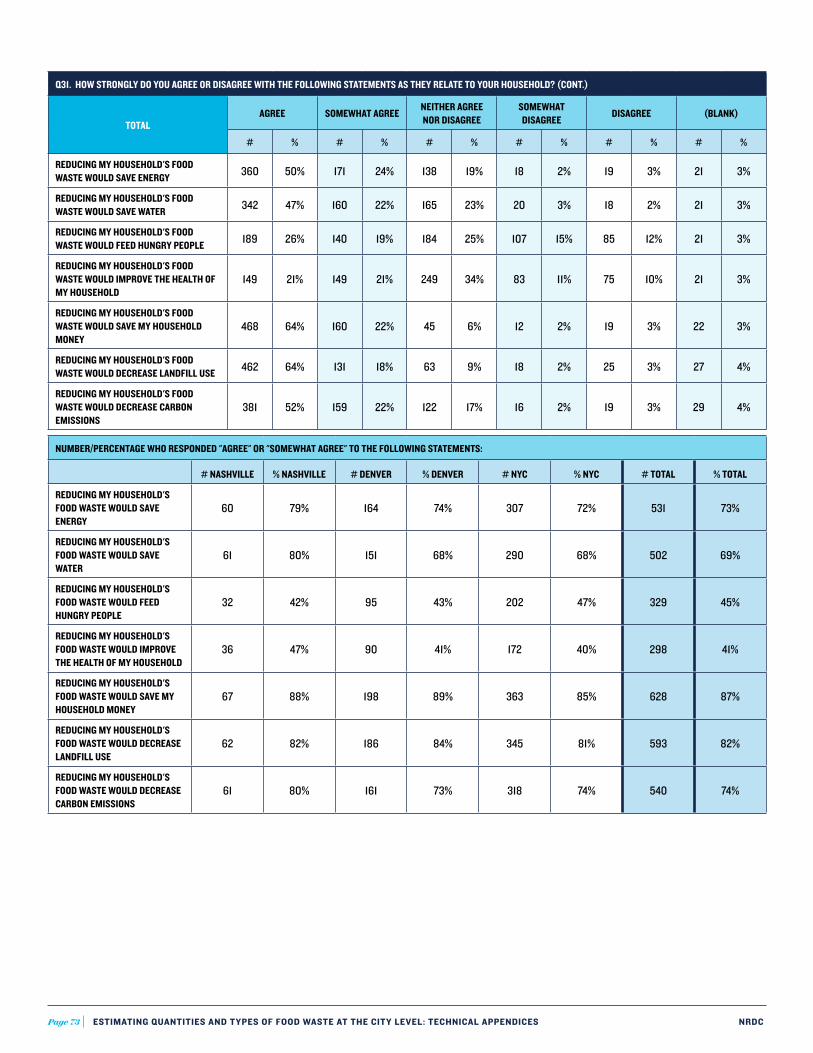
Page 72 ESTIMATING QUANTITIES AND TYPES OF FOOD WASTE AT THE CITY LEVEL: TECHNICAL APPENDICES NRDC Page 73 ESTIMATING QUANTITIES AND TYPES OF FOOD WASTE AT THE CITY LEVEL: TECHNICAL APPENDICES NRDC
Q31. HOW STRONGLY DO YOU AGREE OR DISAGREE WITH THE FOLLOWING STATEMENTS AS THEY RELATE TO YOUR HOUSEHOLD? (CONT.)
TOTALAGREE SOMEWHAT AGREE
NEITHER AGREE NOR DISAGREE
SOMEWHAT DISAGREE
DISAGREE (BLANK)
# % # % # % # % # % # %
REDUCING MY HOUSEHOLD'S FOOD WASTE WOULD SAVE ENERGY 360 50% 171 24% 138 19% 18 2% 19 3% 21 3%
REDUCING MY HOUSEHOLD'S FOOD WASTE WOULD SAVE WATER 342 47% 160 22% 165 23% 20 3% 18 2% 21 3%
REDUCING MY HOUSEHOLD'S FOOD WASTE WOULD FEED HUNGRY PEOPLE 189 26% 140 19% 184 25% 107 15% 85 12% 21 3%
REDUCING MY HOUSEHOLD'S FOOD WASTE WOULD IMPROVE THE HEALTH OF MY HOUSEHOLD
149 21% 149 21% 249 34% 83 11% 75 10% 21 3%
REDUCING MY HOUSEHOLD'S FOOD WASTE WOULD SAVE MY HOUSEHOLD MONEY
468 64% 160 22% 45 6% 12 2% 19 3% 22 3%
REDUCING MY HOUSEHOLD'S FOOD WASTE WOULD DECREASE LANDFILL USE 462 64% 131 18% 63 9% 18 2% 25 3% 27 4%
REDUCING MY HOUSEHOLD'S FOOD WASTE WOULD DECREASE CARBON EMISSIONS
381 52% 159 22% 122 17% 16 2% 19 3% 29 4%
NUMBER/PERCENTAGE WHO RESPONDED "AGREE" OR "SOMEWHAT AGREE" TO THE FOLLOWING STATEMENTS:
# NASHVILLE % NASHVILLE # DENVER % DENVER # NYC % NYC # TOTAL % TOTAL
REDUCING MY HOUSEHOLD'S FOOD WASTE WOULD SAVE ENERGY
60 79% 164 74% 307 72% 531 73%
REDUCING MY HOUSEHOLD'S FOOD WASTE WOULD SAVE WATER
61 80% 151 68% 290 68% 502 69%
REDUCING MY HOUSEHOLD'S FOOD WASTE WOULD FEED HUNGRY PEOPLE
32 42% 95 43% 202 47% 329 45%
REDUCING MY HOUSEHOLD'S FOOD WASTE WOULD IMPROVE THE HEALTH OF MY HOUSEHOLD
36 47% 90 41% 172 40% 298 41%
REDUCING MY HOUSEHOLD'S FOOD WASTE WOULD SAVE MY HOUSEHOLD MONEY
67 88% 198 89% 363 85% 628 87%
REDUCING MY HOUSEHOLD'S FOOD WASTE WOULD DECREASE LANDFILL USE
62 82% 186 84% 345 81% 593 82%
REDUCING MY HOUSEHOLD'S FOOD WASTE WOULD DECREASE CARBON EMISSIONS
61 80% 161 73% 318 74% 540 74%

Page 74 ESTIMATING QUANTITIES AND TYPES OF FOOD WASTE AT THE CITY LEVEL: TECHNICAL APPENDICES NRDC
Q31. HOW STRONGLY DO YOU AGREE OR DISAGREE WITH THE FOLLOWING STATEMENTS AS THEY RELATE TO YOUR HOUSEHOLD? (CONT.)
NUMBER/PERCENTAGE WHO RESPONDED "DISAGREE" OR "SOMEWHAT DISAGREE" TO THE FOLLOWING STATEMENTS:
# NASHVILLE % NASHVILLE # DENVER % DENVER # NYC % NYC # TOTAL % TOTAL
REDUCING MY HOUSEHOLD'S FOOD WASTE WOULD SAVE ENERGY
4 5% 16 7% 17 4% 37 5%
REDUCING MY HOUSEHOLD'S FOOD WASTE WOULD SAVE WATER
4 5% 13 6% 21 5% 38 5%
REDUCING MY HOUSEHOLD'S FOOD WASTE WOULD FEED HUNGRY PEOPLE
28 37% 69 31% 95 22% 192 26%
REDUCING MY HOUSEHOLD'S FOOD WASTE WOULD IMPROVE THE HEALTH OF MY HOUSEHOLD
15 20% 44 20% 99 23% 158 22%
REDUCING MY HOUSEHOLD'S FOOD WASTE WOULD SAVE MY HOUSEHOLD MONEY
4 5% 8 4% 19 4% 31 4%
REDUCING MY HOUSEHOLD'S FOOD WASTE WOULD DECREASE LANDFILL USE
6 8% 14 6% 23 5% 43 6%
REDUCING MY HOUSEHOLD'S FOOD WASTE WOULD DECREASE CARBON EMISSIONS
5 7% 11 5% 19 4% 35 5%

Page 74 ESTIMATING QUANTITIES AND TYPES OF FOOD WASTE AT THE CITY LEVEL: TECHNICAL APPENDICES NRDC Page 75 ESTIMATING QUANTITIES AND TYPES OF FOOD WASTE AT THE CITY LEVEL: TECHNICAL APPENDICES NRDC
Appendix G: Residential Bin Dig Data
NASHVILLE ALL RESIDENTIAL TRASH BIN DIG SUMMARY
FOODTOTAL
POUNDS% OF WASTED
FOOD% OF
TRASH
INEDIBLE 139 23% 6%
MEAT & FISH 18 3% 1%
DAIRY & EGGS 8 1% 0%
FRUITS & VEGETABLES 137 23% 6%
BAKED GOODS 34 6% 1%
DRY FOOD 22 4% 1%
SNACKS & CONDIMENTS 26 4% 1%
LIQUIDS, OILS, & GREASE 47 8% 2%
PREPARED FOODS & LEFTOVERS 172 28% 7%
UNIDENTIFIABLE 4 1% 0%
SUBTOTAL EDIBLE 468 77% 20%
SUBTOTAL FOOD WASTE 607 100% 26%
NON-FOOD
FOOD SOILED PAPER 138 N/A 6%
YARD WASTE 11 N/A 0%
GLASS 242 N/A 10%
PAPER 256 N/A 11%
METAL 83 N/A 4%
RIGID PLASTIC 117 N/A 5%
PLASTIC FILM 146 N/A 6%
OTHER 718 N/A 31%
SUBTOTAL NON-FOOD 1711 N/A 74%
TOTAL TRASH 2318 N/A 100%
DENVER ALL RESIDENTIAL TRASH BIN DIG SUMMARY
FOODTOTAL
POUNDS% OF WASTED
FOOD% OF TRASH
INEDIBLE 192 38% 10%
MEAT & FISH 17 3% 1%
DAIRY & EGGS 7 1% 0%
FRUITS & VEGETABLES 119 24% 6%
BAKED GOODS 30 6% 2%
DRY FOOD 5 1% 0%
SNACKS & CONDIMENTS 26 5% 1%
LIQUIDS, OILS, & GREASE 30 6% 2%
PREPARED FOODS & LEFTOVERS 79 16% 4%
UNIDENTIFIABLE 1 0% 0%
SUBTOTAL EDIBLE 314 62% 16%
SUBTOTAL FOOD WASTE 506 100% 26%
NON-FOOD
FOOD SOILED PAPER 104 N/A 5%
YARD WASTE 465 N/A 24%
GLASS 35 N/A 2%
PAPER 101 N/A 5%
METAL 31 N/A 2%
RIGID PLASTIC 43 N/A 2%
PLASTIC FILM 80 N/A 4%
OTHER 612 N/A 31%
SUBTOTAL NON-FOOD 1471 N/A 74%
TOTAL TRASH 1977 N/A 100%
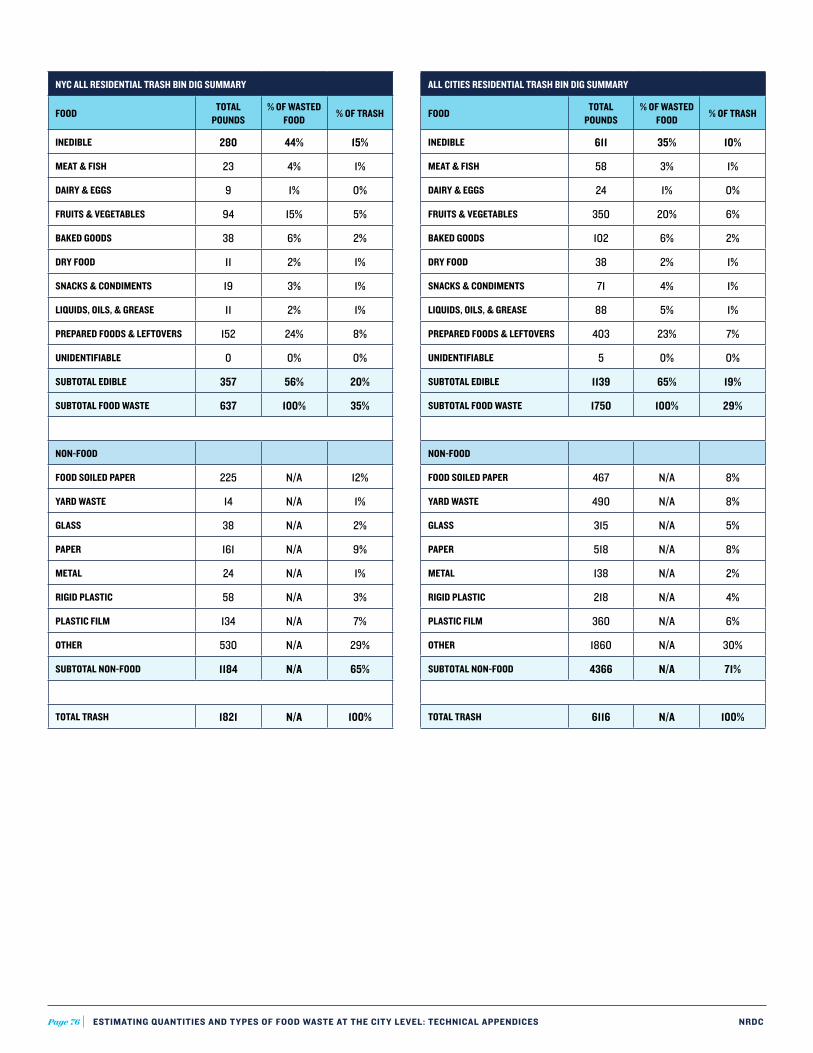
Page 76 ESTIMATING QUANTITIES AND TYPES OF FOOD WASTE AT THE CITY LEVEL: TECHNICAL APPENDICES NRDC
NYC ALL RESIDENTIAL TRASH BIN DIG SUMMARY
FOODTOTAL
POUNDS% OF WASTED
FOOD% OF TRASH
INEDIBLE 280 44% 15%
MEAT & FISH 23 4% 1%
DAIRY & EGGS 9 1% 0%
FRUITS & VEGETABLES 94 15% 5%
BAKED GOODS 38 6% 2%
DRY FOOD 11 2% 1%
SNACKS & CONDIMENTS 19 3% 1%
LIQUIDS, OILS, & GREASE 11 2% 1%
PREPARED FOODS & LEFTOVERS 152 24% 8%
UNIDENTIFIABLE 0 0% 0%
SUBTOTAL EDIBLE 357 56% 20%
SUBTOTAL FOOD WASTE 637 100% 35%
NON-FOOD
FOOD SOILED PAPER 225 N/A 12%
YARD WASTE 14 N/A 1%
GLASS 38 N/A 2%
PAPER 161 N/A 9%
METAL 24 N/A 1%
RIGID PLASTIC 58 N/A 3%
PLASTIC FILM 134 N/A 7%
OTHER 530 N/A 29%
SUBTOTAL NON-FOOD 1184 N/A 65%
TOTAL TRASH 1821 N/A 100%
ALL CITIES RESIDENTIAL TRASH BIN DIG SUMMARY
FOODTOTAL
POUNDS% OF WASTED
FOOD% OF TRASH
INEDIBLE 611 35% 10%
MEAT & FISH 58 3% 1%
DAIRY & EGGS 24 1% 0%
FRUITS & VEGETABLES 350 20% 6%
BAKED GOODS 102 6% 2%
DRY FOOD 38 2% 1%
SNACKS & CONDIMENTS 71 4% 1%
LIQUIDS, OILS, & GREASE 88 5% 1%
PREPARED FOODS & LEFTOVERS 403 23% 7%
UNIDENTIFIABLE 5 0% 0%
SUBTOTAL EDIBLE 1139 65% 19%
SUBTOTAL FOOD WASTE 1750 100% 29%
NON-FOOD
FOOD SOILED PAPER 467 N/A 8%
YARD WASTE 490 N/A 8%
GLASS 315 N/A 5%
PAPER 518 N/A 8%
METAL 138 N/A 2%
RIGID PLASTIC 218 N/A 4%
PLASTIC FILM 360 N/A 6%
OTHER 1860 N/A 30%
SUBTOTAL NON-FOOD 4366 N/A 71%
TOTAL TRASH 6116 N/A 100%

Page 76 ESTIMATING QUANTITIES AND TYPES OF FOOD WASTE AT THE CITY LEVEL: TECHNICAL APPENDICES NRDC Page 77 ESTIMATING QUANTITIES AND TYPES OF FOOD WASTE AT THE CITY LEVEL: TECHNICAL APPENDICES NRDC
COMPARISON OF TRASH BIN DIGS TO DIARIES (ALL DISCARD DESTINATIONS): NASHVILLE
BIN DIGS DIARIES
DIFFERENCE IN % OF WASTED FOOD (DIARIES MINUS BIN DIGS)TOTAL POUNDS
% OF WASTED FOOD TOTAL POUNDS
% OF WASTED FOOD
INEDIBLE 139 23% 131 37% 14%
MEAT & FISH 18 3% 9 2% -1%
DAIRY & EGGS 8 1% 18 5% 4%
FRUITS & VEGETABLES 137 23% 84 24% 2%
BAKED GOODS 34 6% 10 3% -3%
DRY FOOD 22 4% 4 1% -2%
SNACKS & CONDIMENTS 26 4% 12 3% -1%
LIQUIDS, OILS, & GREASE 47 8% 34 10% 2%
PREPARED FOODS & LEFTOVERS 172 28% 48 14% -15%
UNIDENTIFIABLE 4 1% 1 0% 0%
SUBTOTAL EDIBLE 468 77% 219 63% -14%
TOTAL FOOD WASTE 607 100% 350 100% 0%
COMPARISON OF TRASH BIN DIGS TO DIARIES (ALL DISCARD DESTINATIONS): DENVER
BIN DIGS DIARIES
DIFFERENCE IN % OF WASTED FOOD (DIARIES MINUS BIN DIGS)TOTAL POUNDS
% OF WASTED FOOD TOTAL POUNDS
% OF WASTED FOOD
INEDIBLE 192 38% 317 25% -13%
MEAT & FISH 17 3% 72 6% 2%
DAIRY & EGGS 7 1% 71 6% 4%
FRUITS & VEGETABLES 119 24% 372 29% 5%
BAKED GOODS 30 6% 67 5% -1%
DRY FOOD 5 1% 6 0% -1%
SNACKS & CONDIMENTS 26 5% 31 2% -3%
LIQUIDS, OILS, & GREASE 30 6% 111 9% 3%
PREPARED FOODS & LEFTOVERS 79 16% 240 19% 3%
UNIDENTIFIABLE 1 0% 5 0% 0%
SUBTOTAL EDIBLE 314 62% 974 75% 13%
TOTAL FOOD WASTE 506 100% 1291 100% 0%

Page 78 ESTIMATING QUANTITIES AND TYPES OF FOOD WASTE AT THE CITY LEVEL: TECHNICAL APPENDICES NRDC
COMPARISON OF TRASH BIN DIGS TO DIARIES (ALL DISCARD DESTINATIONS): NYC
BIN DIGS DIARIES
DIFFERENCE IN % OF WASTED FOOD (DIARIES MINUS BIN DIGS)TOTAL POUNDS
% OF WASTED FOOD TOTAL POUNDS
% OF WASTED FOOD
INEDIBLE 280 44% 695 35% -9%
MEAT & FISH 23 4% 62 3% 0%
DAIRY & EGGS 9 1% 78 4% 3%
FRUITS & VEGETABLES 94 15% 523 26% 12%
BAKED GOODS 38 6% 79 4% -2%
DRY FOOD 11 2% 20 1% -1%
SNACKS & CONDIMENTS 19 3% 29 1% -2%
LIQUIDS, OILS, & GREASE 11 2% 82 4% 2%
PREPARED FOODS & LEFTOVERS 152 24% 410 21% -3%
UNIDENTIFIABLE 0 0% 0 0% 0%
SUBTOTAL EDIBLE 357 56% 1282 65% 9%
TOTAL FOOD WASTE 637 100% 1977 100% 0%
COMPARISON OF TRASH BIN DIGS TO DIARIES (ALL DISCARD DESTINATIONS): ALL CITIES
BIN DIGS DIARIES
DIFFERENCE IN % OF WASTED FOOD (DIARIES MINUS BIN DIGS)TOTAL POUNDS
% OF WASTED FOOD TOTAL POUNDS
% OF WASTED FOOD
INEDIBLE 611 35% 1143 32% -3%
MEAT & FISH 58 3% 142 4% 1%
DAIRY & EGGS 24 1% 168 5% 3%
FRUITS & VEGETABLES 350 20% 979 27% 7%
BAKED GOODS 102 6% 156 4% -2%
DRY FOOD 38 2% 30 1% -1%
SNACKS & CONDIMENTS 71 4% 71 2% -2%
LIQUIDS, OILS, & GREASE 88 5% 226 6% 1%
PREPARED FOODS & LEFTOVERS 403 23% 697 19% -4%
UNIDENTIFIABLE 5 0% 5 0% 0%
SUBTOTAL EDIBLE 1139 65% 2475 68% 3%
TOTAL FOOD WASTE 1750 100% 3618 100% 0%
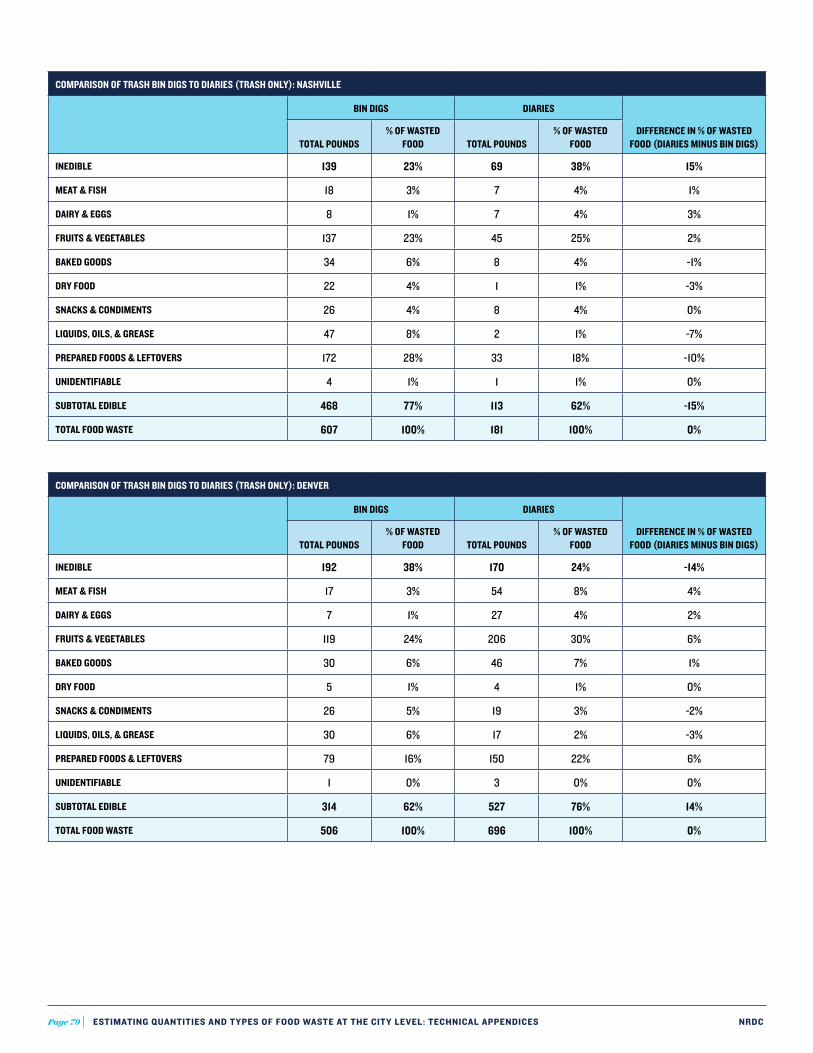
Page 78 ESTIMATING QUANTITIES AND TYPES OF FOOD WASTE AT THE CITY LEVEL: TECHNICAL APPENDICES NRDC Page 79 ESTIMATING QUANTITIES AND TYPES OF FOOD WASTE AT THE CITY LEVEL: TECHNICAL APPENDICES NRDC
COMPARISON OF TRASH BIN DIGS TO DIARIES (TRASH ONLY): NASHVILLE
BIN DIGS DIARIES
DIFFERENCE IN % OF WASTED FOOD (DIARIES MINUS BIN DIGS)TOTAL POUNDS
% OF WASTED FOOD TOTAL POUNDS
% OF WASTED FOOD
INEDIBLE 139 23% 69 38% 15%
MEAT & FISH 18 3% 7 4% 1%
DAIRY & EGGS 8 1% 7 4% 3%
FRUITS & VEGETABLES 137 23% 45 25% 2%
BAKED GOODS 34 6% 8 4% -1%
DRY FOOD 22 4% 1 1% -3%
SNACKS & CONDIMENTS 26 4% 8 4% 0%
LIQUIDS, OILS, & GREASE 47 8% 2 1% -7%
PREPARED FOODS & LEFTOVERS 172 28% 33 18% -10%
UNIDENTIFIABLE 4 1% 1 1% 0%
SUBTOTAL EDIBLE 468 77% 113 62% -15%
TOTAL FOOD WASTE 607 100% 181 100% 0%
COMPARISON OF TRASH BIN DIGS TO DIARIES (TRASH ONLY): DENVER
BIN DIGS DIARIES
DIFFERENCE IN % OF WASTED FOOD (DIARIES MINUS BIN DIGS)TOTAL POUNDS
% OF WASTED FOOD TOTAL POUNDS
% OF WASTED FOOD
INEDIBLE 192 38% 170 24% -14%
MEAT & FISH 17 3% 54 8% 4%
DAIRY & EGGS 7 1% 27 4% 2%
FRUITS & VEGETABLES 119 24% 206 30% 6%
BAKED GOODS 30 6% 46 7% 1%
DRY FOOD 5 1% 4 1% 0%
SNACKS & CONDIMENTS 26 5% 19 3% -2%
LIQUIDS, OILS, & GREASE 30 6% 17 2% -3%
PREPARED FOODS & LEFTOVERS 79 16% 150 22% 6%
UNIDENTIFIABLE 1 0% 3 0% 0%
SUBTOTAL EDIBLE 314 62% 527 76% 14%
TOTAL FOOD WASTE 506 100% 696 100% 0%

Page 80 ESTIMATING QUANTITIES AND TYPES OF FOOD WASTE AT THE CITY LEVEL: TECHNICAL APPENDICES NRDC
COMPARISON OF TRASH BIN DIGS TO DIARIES (TRASH ONLY): NYC
BIN DIGS DIARIES
DIFFERENCE IN % OF WASTED FOOD (DIARIES MINUS BIN DIGS)TOTAL POUNDS
% OF WASTED FOOD TOTAL POUNDS
% OF WASTED FOOD
INEDIBLE 280 44% 367 36% -8%
MEAT & FISH 23 4% 44 4% 1%
DAIRY & EGGS 9 1% 21 2% 1%
FRUITS & VEGETABLES 94 15% 286 28% 13%
BAKED GOODS 38 6% 48 5% -1%
DRY FOOD 11 2% 9 1% -1%
SNACKS & CONDIMENTS 19 3% 19 2% -1%
LIQUIDS, OILS, & GREASE 11 2% 10 1% -1%
PREPARED FOODS & LEFTOVERS 152 24% 230 22% -2%
UNIDENTIFIABLE 0 0% 0 0% 0%
SUBTOTAL EDIBLE 357 56% 666 64% 8%
TOTAL FOOD WASTE 637 100% 1033 100% 0%
COMPARISON OF TRASH BIN DIGS TO DIARIES (TRASH ONLY): ALL CITIES
BIN DIGS DIARIES
DIFFERENCE IN % OF WASTED FOOD (DIARIES MINUS BIN DIGS)TOTAL POUNDS
% OF WASTED FOOD TOTAL POUNDS
% OF WASTED FOOD
INEDIBLE 611 35% 605 32% -3%
MEAT & FISH 58 3% 106 6% 2%
DAIRY & EGGS 24 1% 56 3% 2%
FRUITS & VEGETABLES 350 20% 537 28% 8%
BAKED GOODS 102 6% 101 5% -1%
DRY FOOD 38 2% 15 1% -1%
SNACKS & CONDIMENTS 71 4% 45 2% -2%
LIQUIDS, OILS, & GREASE 88 5% 29 2% -4%
PREPARED FOODS & LEFTOVERS 403 23% 413 22% -1%
UNIDENTIFIABLE 5 0% 4 0% 0%
SUBTOTAL EDIBLE 1,139 65% 1,306 68% 3%
TOTAL FOOD WASTE 1,750 100% 1,911 100% 0%

Page 80 ESTIMATING QUANTITIES AND TYPES OF FOOD WASTE AT THE CITY LEVEL: TECHNICAL APPENDICES NRDC Page 81 ESTIMATING QUANTITIES AND TYPES OF FOOD WASTE AT THE CITY LEVEL: TECHNICAL APPENDICES NRDC
DENVER ALL RESIDENTIAL COMPOST BIN DIG SUMMARY
FOODTOTAL
POUNDS% OF WASTED
FOOD% OF
TRASH
INEDIBLE 73 65% 15%
MEAT & FISH 4 4% 1%
DAIRY & EGGS 0 0% 0%
FRUITS & VEGETABLES 28 25% 6%
BAKED GOODS 4 4% 1%
DRY FOOD 0 0% 0%
SNACKS & CONDIMENTS 0 0% 0%
LIQUIDS, OILS, & GREASE 0 0% 0%
PREPARED FOODS & LEFTOVERS 4 4% 1%
UNIDENTIFIABLE 0 0% 0%
SUBTOTAL EDIBLE 40 35% 8%
SUBTOTAL FOOD WASTE 113 100% 23%
NON-FOOD
FOOD SOILED PAPER 22 N/A 4%
YARD WASTE 350 N/A 70%
GLASS 4 N/A 1%
PAPER 3 N/A 1%
METAL 1 N/A 0%
RIGID PLASTIC 1 N/A 0%
PLASTIC FILM 1 N/A 0%
OTHER 4 N/A 1%
SUBTOTAL NON-FOOD 386 N/A 77%
TOTAL COMPOST 499 N/A 100%
NYC ALL RESIDENTIAL COMPOST BIN DIG SUMMARY
FOODTOTAL
POUNDS% OF WASTED
FOOD% OF
TRASH
INEDIBLE 133 75% 64%
MEAT & FISH 5 3% 2%
DAIRY & EGGS 2 1% 1%
FRUITS & VEGETABLES 16 9% 8%
BAKED GOODS 6 3% 3%
DRY FOOD 1 1% 0%
SNACKS & CONDIMENTS 4 2% 2%
LIQUIDS, OILS, & GREASE 0 0% 0%
PREPARED FOODS & LEFTOVERS 11 6% 5%
UNIDENTIFIABLE 0 0% 0%
SUBTOTAL EDIBLE 45 25% 22%
SUBTOTAL FOOD WASTE 178 100% 86%
NON-FOOD
FOOD SOILED PAPER 18 N/A 9%
YARD WASTE 9 N/A 4%
GLASS 0 N/A 0%
PAPER 0 N/A 0%
METAL 0 N/A 0%
RIGID PLASTIC 0 N/A 0%
PLASTIC FILM 2 N/A 1%
OTHER 0 N/A 0%
SUBTOTAL NON-FOOD 29 N/A 14%
TOTAL COMPOST 207 N/A 100%

Page 82 ESTIMATING QUANTITIES AND TYPES OF FOOD WASTE AT THE CITY LEVEL: TECHNICAL APPENDICES NRDC
ALL CITIES RESIDENTIAL COMPOST BIN DIG SUMMARY
FOODTOTAL
POUNDS% OF WASTED
FOOD% OF
COMPOST
INEDIBLE 206 71% 29%
MEAT & FISH 9 3% 1%
DAIRY & EGGS 2 1% 0%
FRUITS & VEGETABLES 44 15% 6%
BAKED GOODS 10 3% 1%
DRY FOOD 1 0% 0%
SNACKS & CONDIMENTS 4 1% 1%
LIQUIDS, OILS, & GREASE 0 0% 0%
PREPARED FOODS & LEFTOVERS 15 5% 2%
UNIDENTIFIABLE 0 0% 0%
SUBTOTAL EDIBLE 85 29% 12%
SUBTOTAL FOOD WASTE 291 100% 41%
NON-FOOD
FOOD SOILED PAPER 40 N/A 6%
YARD WASTE 359 N/A 51%
GLASS 4 N/A 1%
PAPER 3 N/A 0%
METAL 1 N/A 0%
RIGID PLASTIC 1 N/A 0%
PLASTIC FILM 3 N/A 0%
OTHER 4 N/A 1%
SUBTOTAL NON-FOOD 415 N/A 59%
TOTAL TRASH 706 N/A 100%

Page 82 ESTIMATING QUANTITIES AND TYPES OF FOOD WASTE AT THE CITY LEVEL: TECHNICAL APPENDICES NRDC Page 83 ESTIMATING QUANTITIES AND TYPES OF FOOD WASTE AT THE CITY LEVEL: TECHNICAL APPENDICES NRDC
COMPARISON OF COMPOST BIN DIGS TO DIARIES (COMPOST ONLY): DENVER
BIN DIGS DIARIES
DIFFERENCE IN % OF WASTED FOOD (DIARIES MINUS BIN DIGS)TOTAL POUNDS
% OF WASTED FOOD TOTAL POUNDS
% OF WASTED FOOD
INEDIBLE 73 65% 66 38% -26%
MEAT & FISH 4 4% 7 4% 0%
DAIRY & EGGS 0 0% 1 1% 1%
FRUITS & VEGETABLES 28 25% 56 33% 8%
BAKED GOODS 4 4% 7 4% 0%
DRY FOOD 0 0% 1 0% 0%
SNACKS & CONDIMENTS 0 0% 1 1% 1%
LIQUIDS, OILS, & GREASE 0 0% 1 0% 0%
PREPARED FOODS & LEFTOVERS 4 4% 32 19% 15%
UNIDENTIFIABLE 0 0% 0 0% 0%
SUBTOTAL EDIBLE 40 35% 106 62% 26%
TOTAL FOOD WASTE 113 100% 172 100% 0%
COMPARISON OF COMPOST BIN DIGS TO DIARIES (COMPOST ONLY): NYC
BIN DIGS DIARIES
DIFFERENCE IN % OF WASTED FOOD (DIARIES MINUS BIN DIGS)TOTAL POUNDS
% OF WASTED FOOD TOTAL POUNDS
% OF WASTED FOOD
INEDIBLE 133 75% 179 40% -35%
MEAT & FISH 5 3% 11 3% 0%
DAIRY & EGGS 2 1% 11 3% 1%
FRUITS & VEGETABLES 16 9% 130 29% 20%
BAKED GOODS 6 3% 22 5% 2%
DRY FOOD 1 1% 6 1% 1%
SNACKS & CONDIMENTS 4 2% 4 1% -1%
LIQUIDS, OILS, & GREASE 0 0% 5 1% 1%
PREPARED FOODS & LEFTOVERS 11 6% 77 17% 11%
UNIDENTIFIABLE 0 0% 0 0% 0%
SUBTOTAL EDIBLE 45 25% 266 60% 35%
TOTAL FOOD WASTE 178 100% 444 100% 0%

Page 84 ESTIMATING QUANTITIES AND TYPES OF FOOD WASTE AT THE CITY LEVEL: TECHNICAL APPENDICES NRDC
COMPARISON OF COMPOST BIN DIGS TO DIARIES (COMPOST ONLY): ALL CITIES
BIN DIGS DIARIES
DIFFERENCE IN % OF WASTED FOOD (DIARIES MINUS BIN DIGS)TOTAL POUNDS
% OF WASTED FOOD TOTAL POUNDS
% OF WASTED FOOD
INEDIBLE 206 71% 244 40% -31%
MEAT & FISH 9 3% 18 3% 0%
DAIRY & EGGS 2 1% 13 2% 1%
FRUITS & VEGETABLES 44 15% 186 30% 15%
BAKED GOODS 10 3% 29 5% 1%
DRY FOOD 1 0% 6 1% 1%
SNACKS & CONDIMENTS 4 1% 5 1% -1%
LIQUIDS, OILS, & GREASE 0 0% 5 1% 1%
PREPARED FOODS & LEFTOVERS 15 5% 109 18% 13%
UNIDENTIFIABLE 0 0% 0 0% 0%
SUBTOTAL EDIBLE 85 29% 372 60% 31%
TOTAL FOOD WASTE 291 100% 616 100% 0%
The following charts compare Denver households that indicated they participate in city composting with Denver households that indicated they do not participate in city composting. Highlighted cells are those associated with t-tests. Asterisked numbers are those that are statistically significant (P<0.1). Note: Of the 25 households that claimed to compost, only 14 actually set out compost. One of the homes only set out compost without trash, so the number of trash samples was 24 instead of 25.
DENVER COMPARISON PER CAPITA (TRASH AND COMPOST)
DOES NOT COMPOST COMPOSTS
TRASH COMPOST TRASH TRASH+COMPOST
POUNDS WASTED
FOOD PER CAPITA
POUNDS EDIBLE
FOOD PER CAPITA % EDIBLE
POUNDS WASTED
FOOD PER CAPITA
POUNDS EDIBLE
FOOD PER CAPITA % EDIBLE
POUNDS WASTED
FOOD PER CAPITA
POUNDS EDIBLE
FOOD PER CAPITA % EDIBLE
POUNDS WASTED
FOOD PER CAPITA
POUNDS EDIBLE
FOOD PER CAPITA % EDIBLE
Average 5.3 2.7 52% 2.5 0.9 24% 0.9 0.5 37% 2.2 1.0 38%
St Dev 4.5 2.8 32% 2.8 1.4 27% 1.7 1.1 45% 2.6 1.4 37%
n 17 17 17 14 14 14 24 24 24 25 25 25
T-Test Score 0.020* 0.032* 0.207
DENVER COMPARISON BY HOUSEHOLD (TRASH AND COMPOST)
DOES NOT COMPOST COMPOSTS
TRASH COMPOST TRASH TRASH+COMPOST
POUNDS WASTED
FOOD PER HOUSEHOLD
POUNDS EDIBLE
FOOD PER HOUSEHOLD % EDIBLE
POUNDS WASTED
FOOD
POUNDS EDIBLE
FOOD PER HOUSEHOLD % EDIBLE
POUNDS WASTED
FOOD PER HOUSEHOLD
POUNDS EDIBLE
FOOD PER HOUSEHOLD % EDIBLE
POUNDS WASTED
FOOD PER HOUSEHOLD
POUNDS EDIBLE
FOOD PER HOUSEHOLD % EDIBLE
Average 11.9 5.5 52% 7.8 2.8 24% 2.4 1.5 37% 6.7 3.1 38%
St Dev 12.8 6.3 32% 9.6 4.4 27% 4.7 2.9 45% 8.4 4.3 37%
n 17 17 17 14 14 14 24 24 24 25 25 25
T-Test Score 0.156 0.170 0.207

Page 84 ESTIMATING QUANTITIES AND TYPES OF FOOD WASTE AT THE CITY LEVEL: TECHNICAL APPENDICES NRDC Page 85 ESTIMATING QUANTITIES AND TYPES OF FOOD WASTE AT THE CITY LEVEL: TECHNICAL APPENDICES NRDC
DENVER COMPARISON PER CAPITA (TRASH ONLY)
DOES NOT COMPOST COMPOSTS
POUNDS TRASH
PER CAPITA
POUNDS WASTED FOOD
PER CAPITAPOUNDS EDIBLE
PER CAPITA% FOOD IN
TRASHPOUNDS TRASH
PER CAPITA
POUNDS WASTED FOOD
PER CAPITAPOUNDS EDIBLE
PER CAPITA% FOOD IN
TRASH
Average 22.4 5.3 2.7 35% 8.3 0.9 0.5 11%
St Dev 28.2 4.5 2.8 21% 8.4 1.7 1.1 20%
n 17 17 17 17 24 24 24 24
T-Test Score 0.061* 0.001* 0.006* 0.001*
DENVER COMPARISON BY HOUSEHOLD (TRASH ONLY)
DOES NOT COMPOST COMPOSTS
POUNDS TRASH
PER HOUSEHOLD
POUNDS WASTED FOOD
PER HOUSEHOLDPOUNDS EDIBLE PER HOUSEHOLD
% FOOD IN TRASH
POUNDS TRASH PER HOUSEHOLD
POUNDS WASTED FOOD
PER HOUSEHOLDPOUNDS EDIBLE PER HOUSEHOLD
% FOOD IN TRASH
Average 40.5 11.9 5.5 35% 22.7 2.4 1.5 11%
St Dev 35.4 12.8 6.3 21% 24.2 4.7 2.9 20%
n 17 17 17 17 24 24 24 24
T-Test Score 0.083* 0.009* 0.024* 0.001*
The following charts compare NYC households that indicated they participate in city composting with NYC households that indicated they do not participate in city composting. Highlighted cells are those associated with t-tests. Asterisked numbers are those that are statistically significant (P<0.1). Note: Of the 27 households that claimed to compost, only 7 actually set out compost. One of the homes only set out compost without trash, so there were only 6 trash samples for the composting group.
NYC COMPARISON PER CAPITA (TRASH AND COMPOST)
DOES NOT COMPOST COMPOSTS
TRASH COMPOST TRASH TRASH+COMPOST
POUNDS WASTED
FOOD PER CAPITA
POUNDS EDIBLE
FOOD PER CAPITA % EDIBLE
POUNDS WASTED
FOOD PER CAPITA
POUNDS EDIBLE
FOOD PER CAPITA % EDIBLE
POUNDS WASTED
FOOD PER CAPITA
POUNDS EDIBLE
FOOD PER CAPITA % EDIBLE
POUNDS WASTED
FOOD PER CAPITA
POUNDS EDIBLE
FOOD PER CAPITA % EDIBLE
Average 2.5 1.7 52% 3.0 1.2 28% 0.9 0.7 57% 1.7 1.0 53%
St Dev 2.8 2.2 36% 2.1 1.5 30% 1.4 1.1 39% 2.4 1.6 38%
n 34 34 34 7 7 7 26 26 26 27 27 27
T-Test Score 0.213 0.125 0.882

Page 86 ESTIMATING QUANTITIES AND TYPES OF FOOD WASTE AT THE CITY LEVEL: TECHNICAL APPENDICES NRDC
NYC COMPARISON BY HOUSEHOLD (TRASH AND COMPOST)
DOES NOT COMPOST COMPOSTS
TRASH COMPOST TRASH TRASH+COMPOST
POUNDS WASTED
FOOD PER HOUSEHOLD
POUNDS EDIBLE
FOOD PER HOUSEHOLD % EDIBLE
POUNDS WASTED
FOOD PER HOUSEHOLD
POUNDS EDIBLE
FOOD PER HOUSEHOLD % EDIBLE
POUNDS WASTED
FOOD PER HOUSEHOLD
POUNDS EDIBLE
FOOD PER HOUSEHOLD % EDIBLE
POUNDS WASTED
FOOD PER HOUSEHOLD
POUNDS EDIBLE
FOOD PER HOUSEHOLD % EDIBLE
Average 7.3 4.6 52% 12.2 4.4 28% 3.0 2.0 57% 6.0 3.1 53%
St Dev 7.9 5.7 36% 9.6 4.5 30% 3.9 2.8 39% 9.4 5.1 38%
n 34 34 34 7 7 7 26 26 26 27 27 27
T-Test Score 0.586 0.270 0.882
NYC COMPARISON PER CAPITA (TRASH ONLY)
DOES NOT COMPOST COMPOSTS
POUNDS TRASH
PER CAPITA
POUNDS WASTED FOOD
PER CAPITAPOUNDS EDIBLE
PER CAPITA% FOOD IN
TRASHPOUNDS TRASH
PER CAPITA
POUNDS WASTED FOOD
PER CAPITAPOUNDS EDIBLE
PER CAPITA% FOOD IN
TRASH
Average 6.1 2.5 1.7 42% 4.5 0.9 0.7 21%
St Dev 8.0 2.8 2.2 27% 5.6 1.4 1.1 18%
n 34 34 34 34 26 26 26 26
T-Test Score 0.353 0.007* 0.019* 0.001*
NYC COMPARISON BY HOUSEHOLD (TRASH ONLY)
DOES NOT COMPOST COMPOSTS
POUNDS TRASH
PER HOUSEHOLD
POUNDS WASTED FOOD
PER HOUSEHOLDPOUNDS EDIBLE PER HOUSEHOLD
% FOOD IN TRASH
POUNDS TRASH PER HOUSEHOLD
POUNDS WASTED FOOD
POUNDS EDIBLE PER HOUSEHOLD
% FOOD IN TRASH
Average 18.0 7.3 4.6 42% 14.4 3.0 2.0 21%
St Dev 23.9 7.9 5.7 27% 17.5 3.9 2.8 18%
n 34 34 34 34 26 26 26 26
T-Test Score 0.510 0.008* 0.024* 0.001*

Page 86 ESTIMATING QUANTITIES AND TYPES OF FOOD WASTE AT THE CITY LEVEL: TECHNICAL APPENDICES NRDC Page 87 ESTIMATING QUANTITIES AND TYPES OF FOOD WASTE AT THE CITY LEVEL: TECHNICAL APPENDICES NRDC
Appendix H: Comparing Demographics with Wasted Food Generation
The following analysis compares per capita-level total and edible food waste generated (as determined by kitchen diaries) to household demographics collected in the first survey. To do this, t-tests were performed to determine relationships between amount of food waste generated per capita and demographic variables (e.g. presence of children in the household, income). T-tests are tests of significance to help determine if two groups are likely to be different or if their difference is likely a result of randomness. The outcome of the t-test is a p-value. The lower the p-value, the more likely the difference between the two groups is not a result of random chance. For the purposes of this analysis, we will consider any p-value of under .1 (or 10% chance of being a result of random chance) to be “significant.” Please note that a “significant” t-test does not provide definitive evidence of association, but does indicate there is a high likelihood of association. A t-test will not prove causation of any kind.
Table 1 provides a summary of which demographics had statistically significant relationships with per capita food waste generation for all three cities. Tables 2-4 provide more detailed information about the results by city.
For example (see Row 2 in Table 2 for Nashville below), a t-test was performed to determine whether household size (single-person or multi-person household) is related to amounts of total and edible food waste generated in Nashville. P-values of .02 for total food waste and .03 for edible food waste were calculated. These p-values (both less than .1) indicate that household size is likely related to the amount of food wasted. From examining the data, the direction of the relationship can be noted. Single-person households generate more wasted food per capita than multi-person households.
Note 1: The results in terms of food wasted per capita are not “normally distributed” (see histograms of distribution in Appendix D). For the statistical calculations used in our analysis, a normal distribution is a required assumption. However, because of the large sample size of our data in all three cities, the non-normal distribution is likely to have a minimal effect on the statistical analysis.1
Note 2: We found that per capita is the appropriate level of analysis for this compared to household, because household size confounds the relationships. Specifically, we found that many demographics are tightly related to household size. For example, in our study population, households in which ethnicity of members was primarily identified as white have a lower average household size compared to non-white households, so an analysis at the household level would likely show higher food waste generation in non-white households, solely because there are more people in those households. However, doing the same analysis at the per capita level may indicate that for those two groups, food waste generation may be lower in the non-white households.
1 Thomas Lumley, Paula Diehr, Scott Emerson, and Lu Chen, The Importance of the Normality Assumption in Large Public Health Data Sets, Annual Review of Public Health, Volume 23, 2002, http://www.annualreviews.org/doi/pdf/10.1146/annurev.publhealth.23.100901.140546.
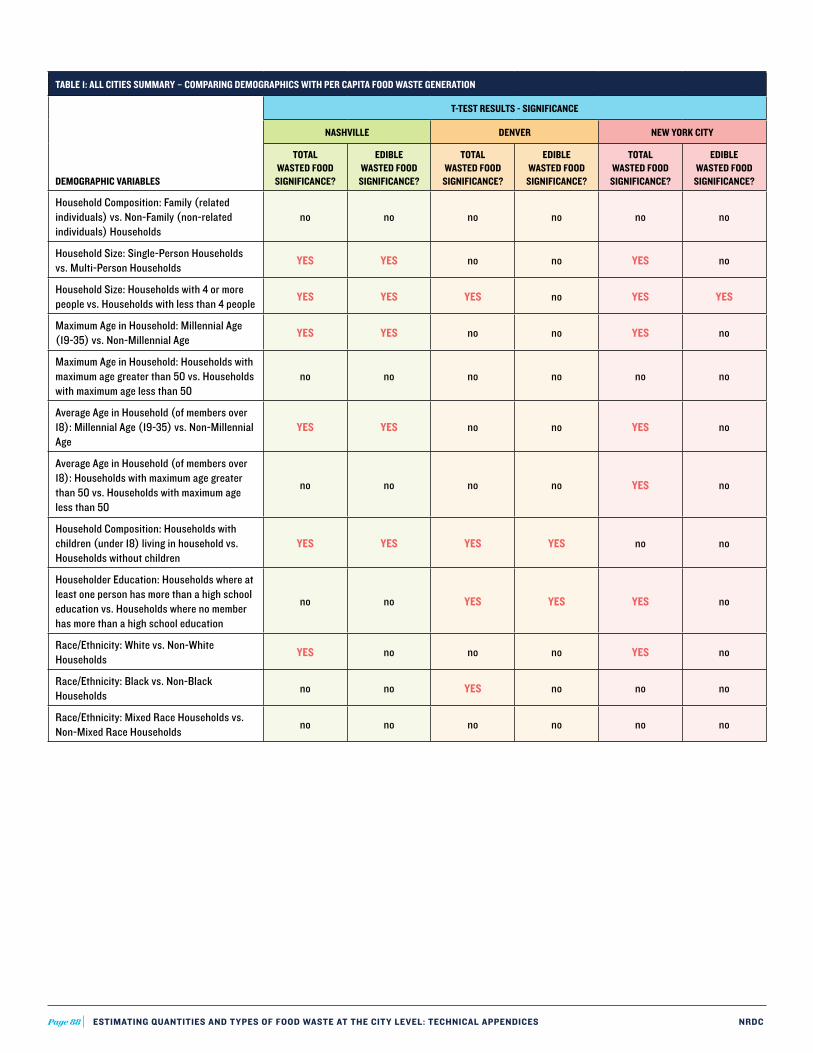
Page 88 ESTIMATING QUANTITIES AND TYPES OF FOOD WASTE AT THE CITY LEVEL: TECHNICAL APPENDICES NRDC
TABLE 1: ALL CITIES SUMMARY – COMPARING DEMOGRAPHICS WITH PER CAPITA FOOD WASTE GENERATION
DEMOGRAPHIC VARIABLES
T-TEST RESULTS - SIGNIFICANCE
NASHVILLE DENVER NEW YORK CITY
TOTAL WASTED FOOD
SIGNIFICANCE?
EDIBLE WASTED FOOD
SIGNIFICANCE?
TOTAL WASTED FOOD
SIGNIFICANCE?
EDIBLE WASTED FOOD
SIGNIFICANCE?
TOTAL WASTED FOOD
SIGNIFICANCE?
EDIBLE WASTED FOOD
SIGNIFICANCE?
Household Composition: Family (related individuals) vs. Non-Family (non-related individuals) Households
no no no no no no
Household Size: Single-Person Households vs. Multi-Person Households YES YES no no YES no
Household Size: Households with 4 or more people vs. Households with less than 4 people YES YES YES no YES YES
Maximum Age in Household: Millennial Age (19-35) vs. Non-Millennial Age YES YES no no YES no
Maximum Age in Household: Households with maximum age greater than 50 vs. Households with maximum age less than 50
no no no no no no
Average Age in Household (of members over 18): Millennial Age (19-35) vs. Non-Millennial Age
YES YES no no YES no
Average Age in Household (of members over 18): Households with maximum age greater than 50 vs. Households with maximum age less than 50
no no no no YES no
Household Composition: Households with children (under 18) living in household vs. Households without children
YES YES YES YES no no
Householder Education: Households where at least one person has more than a high school education vs. Households where no member has more than a high school education
no no YES YES YES no
Race/Ethnicity: White vs. Non-White Households YES no no no YES no
Race/Ethnicity: Black vs. Non-Black Households no no YES no no no
Race/Ethnicity: Mixed Race Households vs. Non-Mixed Race Households no no no no no no

Page 88 ESTIMATING QUANTITIES AND TYPES OF FOOD WASTE AT THE CITY LEVEL: TECHNICAL APPENDICES NRDC Page 89 ESTIMATING QUANTITIES AND TYPES OF FOOD WASTE AT THE CITY LEVEL: TECHNICAL APPENDICES NRDC
TABLE 1: ALL CITIES SUMMARY – COMPARING DEMOGRAPHICS WITH PER CAPITA FOOD WASTE GENERATION (CONT.)
DEMOGRAPHIC VARIABLES
T-TEST RESULTS - SIGNIFICANCE
NASHVILLE DENVER NEW YORK CITY
TOTAL WASTED FOOD
SIGNIFICANCE?
EDIBLE WASTED FOOD
SIGNIFICANCE?
TOTAL WASTED FOOD
SIGNIFICANCE?
EDIBLE WASTED FOOD
SIGNIFICANCE?
TOTAL WASTED FOOD
SIGNIFICANCE?
EDIBLE WASTED FOOD
SIGNIFICANCE?
Primary Language Spoken at Home: English vs. Non-English no no no no no no
National Origin: Households with at least one member born outside of US vs. All members born in US
no no no no no no
Income: Household incomes less than median household income vs. Household incomes greater than median (different threshold for each city)
no no no no no no
Income: Household incomes less than mean household income vs. Household incomes greater than mean (different threshold for each city)
no no no no no no
Food Expenditures for food eaten at home: Households spending less than $50 per week vs. Households spending more than $50 per week
no no no no no no
Food Expenditures for food eaten at home: Households spending less than $201 per week vs. Households spending more than $201 per week
YES YES no no no no
Food Expenditures for food eaten away from home: Households spending less than $50 per week vs. Households spending more than $50 per week
no no no no no no
Food Expenditures for food eaten away from home: Households spending less than $101 per week vs. Households spending more than $101 per week
no no no no no no
Knowledge of Food Waste Issues: Households that know about the issue of wasted food vs. Households that don’t know about the issue of wasted food
no no no no no no
Compost: Households that currently compost wasted food vs. Households that do not currently compost
n/a n/a no no YES no

Page 90 ESTIMATING QUANTITIES AND TYPES OF FOOD WASTE AT THE CITY LEVEL: TECHNICAL APPENDICES NRDC
TABLE 2: NASHVILLE – COMPARING DEMOGRAPHICS WITH PER CAPITA FOOD WASTE GENERATION
P-VALUE FOR TOTAL FOOD
WASTED SIGNIFICANT?
P-VALUE FOR EDIBLE FOOD
WASTED SIGNIFICANT? NOTES ON RELATIONSHIP
Household Composition: Family (related individuals) vs. Non-Family (non-related individuals) Households
.37 no .22 no
Household Size: Single-Person Households vs. Multi-Person Households .02 YES .03 YES
Single-person households waste more food per capita (total and edible) than multi-person households.
Household Size: Households with 4 or more people vs. Households with less than 4 people .01 YES .03 YES
Households with 3 or fewer people waste more food per capita (total and edible) than households with more than 4 people.
Maximum Age in Household: Millennial Age (19-35) vs. Non-Millennial Age .01 YES .03 YES
Households with maximum age in the non-millennial range waste more food per capita (total and edible) than millennials (19-35 range).
Maximum Age in Household: Households with maximum age greater than 50 vs. Households with maximum age less than 50
.70 no .64 no
Average Age in Household (of members over 18): Millennial Age (19-35) vs. Non-Millennial Age .00 YES .02 YES
Households with average age in the non-millennial range waste more food per capita (total and edible) than millennials (19-35 range).
Average Age in Household (of members over 18): Households with maximum age greater than 50 vs. Households with maximum age less than 50
.70 no .64 no
Household Composition: Households with children (under 18) living in household vs. Households without children
.04 YES .07 YESHouseholds without children waste more food per capita (total and edible) than households with children.
Householder Education: Households where at least one person has more than a high school education vs. Households where no member has more than a high school education
.84 no .94 no
Race/Ethnicity: White vs. Non-White Households .05 YES .20 no White households waste more total food per capita than non-white households.
Race/Ethnicity: Black vs. Non-Black Households .31 no .99 no
Race/Ethnicity: Mixed Race Households vs. Non-Mixed Race Households .29 no .24 no
Primary Language Spoken at Home: English vs. Non-English .96 no .83 no
National Origin: Households with at least one member born outside of US vs. All members born in US
.83 no .62 no
Income: Household incomes less than $45k vs. Household incomes more than $45k (based on Nashville median household income)
.52 no .22 no
Income: Household incomes less than $65k vs. Household incomes more than $65k (based on Nashville mean household income)
.14 no .27 no

Page 90 ESTIMATING QUANTITIES AND TYPES OF FOOD WASTE AT THE CITY LEVEL: TECHNICAL APPENDICES NRDC Page 91 ESTIMATING QUANTITIES AND TYPES OF FOOD WASTE AT THE CITY LEVEL: TECHNICAL APPENDICES NRDC
TABLE 2: NASHVILLE – COMPARING DEMOGRAPHICS WITH PER CAPITA FOOD WASTE GENERATION (CONT.)
P-VALUE FOR TOTAL FOOD
WASTED SIGNIFICANT?
P-VALUE FOR EDIBLE FOOD
WASTED SIGNIFICANT? NOTES ON RELATIONSHIP
Food Expenditures for food eaten at home: Households spending less than $50 per week vs. Households spending more than $50 per week
.27 no .66 no
Food Expenditures for food eaten at home: Households spending less than $201 per week vs. Households spending more than $201 per week
.00 YES .05 YES
Households spending less than $201 per week on food eaten at home waste more food per capita (total and edible) than those spending more than $201 per week.
Food Expenditures for food eaten away from home: Households spending less than $50 per week vs. Households spending more than $50 per week
.90 no .77 no
Food Expenditures for food eaten away from home: Households spending less than $101 per week vs. Households spending more than $101 per week
.85 no .58 no
Knowledge of Food Waste Issues: Households that know about the issue of wasted food vs. Households that don’t know about the issue of wasted food
.63 no .74 no
TABLE 3: DENVER – COMPARING DEMOGRAPHICS WITH PER CAPITA FOOD WASTE GENERATION
P-VALUE FOR TOTAL FOOD
WASTED SIGNIFICANT?
P-VALUE FOR EDIBLE FOOD
WASTED SIGNIFICANT? NOTES ON RELATIONSHIP
Household Composition: Family (related individuals) vs. Non-Family (non-related individuals) Households
.76 no .60 no
Household Size: Single- Person Households vs. Multi-Person Households .20 no .18 no
Household Size: Households with 4 or more people vs. Households with less than 4 people .00 YES .18 no
Households with 3 or fewer people waste more total food per capita than households with 4 or more.
Maximum Age in Household: Millennial Age (19-35) vs. Non-Millennial Age .16 no .21 no
Maximum Age in Household: Households with maximum age greater than 65 vs. Households with maximum age less than 65
.83 no .78 no
Average Age in Household (of members over 18): Millennial Age (19-35) vs. Non-Millennial Age .25 no .53 no
Average Age in Household (of members over 18): Households with maximum age greater than 65 vs. Households with maximum age less than 65
.58 no .28 no
Household Composition: Households with children (under 18) living in household vs. Households without children
.00 YES .02 YESHouseholds without children waste more food per capita (total and edible) than households with children.

Page 92 ESTIMATING QUANTITIES AND TYPES OF FOOD WASTE AT THE CITY LEVEL: TECHNICAL APPENDICES NRDC
TABLE 3: DENVER – COMPARING DEMOGRAPHICS WITH PER CAPITA FOOD WASTE GENERATION (CONT.)
P-VALUE FOR TOTAL FOOD
WASTED SIGNIFICANT?
P-VALUE FOR EDIBLE FOOD
WASTED SIGNIFICANT? NOTES ON RELATIONSHIP
Householder Education: Households where at least one person has more than a high school education vs. Households where no member has more than a high school education
.08 YES .09 YES
Households where at least one person has more than a high school education waste more food per capita (total and edible) than households where no member has more than a high school education.
Race/Ethnicity: White vs. Non-White Households .41 no .96 no
Race/Ethnicity: Hispanic vs. Non-Hispanic Households .10 YES .27 no
Non-Hispanic households waste more total food per capita than Hispanic households.
Race/Ethnicity: Mixed Race Households vs. Non-Mixed Race Households .50 no .66 no
Primary Language Spoken at Home: English vs. Non-English .70 no .45 no
Primary Language Spoken at Home: Spanish vs. Non-Spanish .63 no .89 no
National Origin: Households with at least one member born outside of U.S. vs. All members born in U.S.
.89 no .96 no
Income: Household incomes less than $55k vs. Household incomes more than $55k (based on Denver median household income)
.72 no .38 no
Income: Household incomes less than $85k vs. Household incomes more than $85k (based on Denver mean household income)
.72 no .30 no
Food Expenditures for food eaten at home: Households spending less than $50 per week vs. Households spending more than $50 per week
.16 no .43 no
Food Expenditures for food eaten at home: Households spending less than $301 per week vs. Households spending more than $301 per week
.29 no .57 no
Food Expenditures for food eaten away from home: Households spending less than $50 per week vs. Households spending more than $50 per week
.45 no .78 no
Food Expenditures for food eaten away from home: Households spending less than $251 per week vs. Households spending more than $251 per week
.64 no .57 no
Knowledge of Food Waste Issues: Households that know about the issue of wasted food vs. Households that don’t know about the issue of wasted food
.82 no .63 no
Compost: Households that currently compost wasted food vs. Households that do not currently compost
.88 no .32 no

Page 92 ESTIMATING QUANTITIES AND TYPES OF FOOD WASTE AT THE CITY LEVEL: TECHNICAL APPENDICES NRDC Page 93 ESTIMATING QUANTITIES AND TYPES OF FOOD WASTE AT THE CITY LEVEL: TECHNICAL APPENDICES NRDC
TABLE 3: NYC – COMPARING DEMOGRAPHICS WITH PER CAPITA FOOD WASTE GENERATION
P-VALUE FOR TOTAL FOOD
WASTED SIGNIFICANT?
P-VALUE FOR EDIBLE FOOD
WASTED SIGNIFICANT? NOTES ON RELATIONSHIP
Household Composition: Family (related individuals) vs. Non-Family (non-related individuals) Households
.50 no .55 no
Household Size: Single-Person Households vs. Multi-Person Households .01 YES .29 no
Single-person households waste more total food per capita than multi-person households.
Household Size: Households with 4 or more people vs. Households with less than 4 people .00 YES .01 YES
Households with 3 or fewer people waste more food (total and edible) per capita than households with 4 or more.
Maximum Age in Household: Millennial Age (19-35) vs. Non-Millennial Age .10 YES .51 no
Households where the oldest person is over 35 waste more total food per capita than households where the oldest person is a millennial (19-35 range).
Maximum Age in Household: Households with maximum age greater than 65 vs. Households with maximum age less than 65
.20 no .83 no
Average Age in Household (of members over 18): Millennial Age (19-35) vs. Non-Millennial Age .01 YES .25 no
Households where the average age of people over 18 is greater than 35 (non-millennial) waste more total food per capita than households with average ages between 19-35.
Average Age in Household (of members over 18): Households with maximum age greater than 65 vs. Households with maximum age less than 65
.04 YES .30 no
Households with average age greater than 65 waste more total food per capita than households with average age less than 65.
Household Composition: Households with children (under 18) living in household vs. Households without children
.23 no .86 no
Householder Education: Households where at least one person has more than a high school education vs. Households where no member has more than a high school education
.01 YES .19 no
Households where at least one person has more than a high school education waste more total food per capita than households where no member has more than a high school education.
Race/Ethnicity: White vs. Non-White Households .02 YES .17 no White households waste more total food per capita than non-white households.
Race/Ethnicity: Hispanic vs. Non-Hispanic Households .23 no .74 no
Race/Ethnicity: Asian vs. Non-Asian Households .83 no .76 no
Race/Ethnicity: Mixed Race Households vs. Non-Mixed Race Households .33 no .21 no
Primary Language Spoken at Home: English vs. Non-English .68 no .51 no
Primary Language Spoken at Home: Spanish vs. Non-Spanish .40 no .63 no
Primary Language Spoken at Home: Chinese vs. Non-Chinese .30 no .54 no

Page 94 ESTIMATING QUANTITIES AND TYPES OF FOOD WASTE AT THE CITY LEVEL: TECHNICAL APPENDICES NRDC
TABLE 3: NYC – COMPARING DEMOGRAPHICS WITH PER CAPITA FOOD WASTE GENERATION (CONT.)
P-VALUE FOR TOTAL FOOD
WASTED SIGNIFICANT?
P-VALUE FOR EDIBLE FOOD
WASTED SIGNIFICANT? NOTES ON RELATIONSHIP
National Origin: Households with at least one member born outside of US vs. All members born in US
.80 no .82 no
Income: Household incomes less than $55k vs. Household incomes more than $55k (based on NYC median household income)
.22 no .31 no
Income: Household incomes less than $85k vs. Household incomes more than $85k (based on NYC mean household income)
.27 no .39 no
Food Expenditures for food eaten at home: Households spending less than $50 per week vs. Households spending more than $50 per week
.51 no .35 no
Food Expenditures for food eaten at home: Households spending less than $301 per week vs. Households spending more than $301 per week
.74 no .77 no
Food Expenditures for food eaten away from home: Households spending less than $50 per week vs. Households spending more than $50 per week
.47 no .11 no
Food Expenditures for food eaten away from home: Households spending less than $251 per week vs. Households spending more than $251 per week
.41 no .51 no
Knowledge of Food Waste Issues: Households that know about the issue of wasted food vs. Households that don’t know about the issue of wasted food
.88 no .46 no
Compost: Households that currently compost wasted food vs. Households that do not currently compost
.02 YES .70 noHouseholds that compost waste more total food per capita than households that do not compost.

Page 94 ESTIMATING QUANTITIES AND TYPES OF FOOD WASTE AT THE CITY LEVEL: TECHNICAL APPENDICES NRDC Page 95 ESTIMATING QUANTITIES AND TYPES OF FOOD WASTE AT THE CITY LEVEL: TECHNICAL APPENDICES NRDC
Appendix I: Comparing Attitudes and Behaviors with Wasted Food Generation
The following analysis compares per capita total and edible food waste generated (as determined by kitchen diaries) to household attitudes and behaviors collected in the first survey. To do this, two-tailed t-tests were performed to determine relationships between amount of food generated per capita and demographic variables (e.g. presence of children in the household, income). T-tests are tests of significance to help determine if two groups are likely to be different or if their difference is likely a result of randomness. The outcome of the t-test is a p-value. The lower the p-value, the more likely the difference between the two groups is not a result of random chance. For the purposes of this analysis, we will consider any p-value of under .1 (or 10% chance of being a result of random chance) to be “significant.” Please note that a “significant” t-test does not provide definitive evidence of association, but does indicate there is a high likelihood of association. A t-test will not prove causation of any kind.
Note: Only variables with statistically significant relationships are listed below.
TABLE 1: PER CAPITA COMPARISONS OF ATTITUDES AND BEHAVIOR WITH WASTED FOOD GENERATION – ALL CITIES
ATTITUDE/BEHAVIOR VARIABLES
NASHVILLE DENVER NEW YORK CITY
P-VALUE FOR TOTAL WASTED FOOD (P-VALUE
FOR EDIBLE WASTED FOOD)
DIRECTION OF RELATIONSHIP?
P-VALUE FOR TOTAL WASTED FOOD (P-VALUE
FOR EDIBLE WASTED FOOD)
DIRECTION OF RELATIONSHIP?
P-VALUE FOR TOTAL WASTED FOOD (P-VALUE
FOR EDIBLE WASTED FOOD)
DIRECTION OF RELATIONSHIP?
Borrowed Car: Households using borrowed car vs. households that don’t use a borrowed car for food shopping
.08
Households that don’t use a borrowed car for food shopping waste more total food per
capita.
.08 (.01)
Households that use a borrowed car for food shopping waste more
food (total and edible) per capita.
Farmers Markets/CSAs: Households that get food from Farmers Markets & CSAs vs. those that don’t
.01
Households that do not get food from
Farmers Markets and CSA waste more total
food per capita.
Backyard Gardens: Households that get food from their backyard garden vs. those that don’t
.07
Households that get food from their
backyard garden waste more total food per
capita.
Planning Meals Before Shopping: Households that always or often plan meals before shopping vs. households that sometimes, rarely, or never plan meals before shopping
.09
Households that plan meals before shopping waste more total food
per capita.
Purchasing Unplanned Items: Households that never or rarely purchased unplanned items vs. households that sometimes, often, or always purchase unplanned items
.02 (.06)
Households that always/often/
sometimes purchased unplanned items
waste more food (total and edible) per capita.

Page 96 ESTIMATING QUANTITIES AND TYPES OF FOOD WASTE AT THE CITY LEVEL: TECHNICAL APPENDICES NRDC
TABLE 1: PER CAPITA COMPARISONS OF ATTITUDES AND BEHAVIOR WITH WASTED FOOD GENERATION – ALL CITIES (CONT.)
ATTITUDE/BEHAVIOR VARIABLES
NASHVILLE DENVER NEW YORK CITY
P-VALUE FOR TOTAL WASTED FOOD (P-VALUE
FOR EDIBLE WASTED FOOD)
DIRECTION OF RELATIONSHIP?
P-VALUE FOR TOTAL WASTED FOOD (P-VALUE
FOR EDIBLE WASTED FOOD)
DIRECTION OF RELATIONSHIP?
P-VALUE FOR TOTAL WASTED FOOD (P-VALUE
FOR EDIBLE WASTED FOOD)
DIRECTION OF RELATIONSHIP?
Very Cautious to Avoid Food Poisoning: Households that agree or somewhat agree that they are very cautious to avoid food poisoning vs. those that neither agree nor disagree, somewhat disagree, or disagree
.05 (.03)
Households that are very cautious to avoid food poisoning waste more food (total and
edible) per capita.
Preparing Food for Family/Friends: Households that agree or somewhat agree that generally, preparing food for friends and family makes me feel good vs. those that neither agree nor disagree, somewhat disagree, or disagree
.07
Households for which preparing food for friends and family
makes them feel good waste more total food
per capita.
Avoidable Food Waste: Households who characterize their avoidable food waste as a lot or a fair amount vs. none or a little
.02 (.00)
Households that characterize their
avoidable food waste as a lot or a fair
amount waste more food (total and edible)
per capita.
.05 (.03)
Households that characterize their
avoidable food waste as a lot or a fair
amount waste more food (total and edible)
per capita.
Remove Bruised Parts of Fruits & Veggies: Households that always or most of the time remove and discard bruised parts of fruits and veggies vs. those that do it sometimes, rarely, or never
.08
Households that always/most of the
time discard bruised parts of fruits/
vegetables waste more total food per capita.
Try to Use All Parts of Food: Households that always or most of the time try to use all parts of food vs. those that do it sometimes, rarely, or never
.08
Households that sometimes/rarely/never try to use all parts of food waste more total food per
capita.
.02
Households that always/most of the time try to use all
parts of food waste more total food per
capita.
Preparing Dinner at Home: Households that prepare dinner no more than 1-2 days per week at home vs. those that prepare dinner at least 2-4 days per week at home
.01 (.01)
Households that cook dinner at least 2-4 or
more days per week at home waste more food (total and edible) per
capita.
Eating Dinner at Home: Households that eat dinner no more than 1-2 days per week at home vs. those that eat dinner at least 2-4 days per week at home
.08
Households that eat dinner at least 2-4
days per week at home waste more total food
per capita.
.03 (.02)
Households that eat dinner at least 2-4
days per week at home are more likely to
waste more food (total and edible) per capita.

Page 96 ESTIMATING QUANTITIES AND TYPES OF FOOD WASTE AT THE CITY LEVEL: TECHNICAL APPENDICES NRDC Page 97 ESTIMATING QUANTITIES AND TYPES OF FOOD WASTE AT THE CITY LEVEL: TECHNICAL APPENDICES NRDC
TABLE 1: PER CAPITA COMPARISONS OF ATTITUDES AND BEHAVIOR WITH WASTED FOOD GENERATION – ALL CITIES (CONT.)
ATTITUDE/BEHAVIOR VARIABLES
NASHVILLE DENVER NEW YORK CITY
P-VALUE FOR TOTAL WASTED FOOD (P-VALUE
FOR EDIBLE WASTED FOOD)
DIRECTION OF RELATIONSHIP?
P-VALUE FOR TOTAL WASTED FOOD (P-VALUE
FOR EDIBLE WASTED FOOD)
DIRECTION OF RELATIONSHIP?
P-VALUE FOR TOTAL WASTED FOOD (P-VALUE
FOR EDIBLE WASTED FOOD)
DIRECTION OF RELATIONSHIP?
Owning a Car: Households that use a car to shop for food more than once per week vs. those that use a car to shop less than once per week (does not include households without cars)
.09 (.10)
Households that use a car to shop for food more than once per
week waste more food (total and edible) per
capita.
Preparing Too Much Food: Households that agree or somewhat agree that the person that most frequently prepares food frequently makes too much food vs. those that neither agree nor disagree, somewhat disagree, or disagree
.10 (.07)
Households that agree/somewhat agree that the primary food preparer frequently
makes too much food waste more food (total and edible) per capita.
Walking: Households that walk to shop for food more than once per week vs. those that walk to shop less than once per week (does not include households that do not use walking as a mode of transportation for food shopping)
.09
Households that walk to shop for food less
than once a week waste more total food
per capita.
Estimate How Much Before Shopping: Households that always or often estimate how much of each item to buy before going shopping vs. those that sometimes, rarely, or never
.00 (.01)
Households that always or often
estimate how much before shopping waste
more food (total and edible) per capita.
Reducing Wasted Food = Good: Households that agree or somewhat agree that reducing the amount of food they throw away is good vs. those that neither agree nor disagree, somewhat disagree, or disagree
.01 (.09)
Households that agree/somewhat agree
that reducing the amount of food they waste is good waste more food (total and
edible) per capita.
Spur of the Moment Eating Out: Households that agree or somewhat agree that household members usually eat out spur of the moment (less than 48 hours’ notice) vs those that neither agree nor disagree, somewhat disagree, or disagree
.00
Households that do not usually eat out spur of the moment
waste more total food per capita.

Page 98 ESTIMATING QUANTITIES AND TYPES OF FOOD WASTE AT THE CITY LEVEL: TECHNICAL APPENDICES NRDC
Comparing Demographics, Attitudes and Behaviors (From Survey #1) with Wasted Food Generation – Multivariate and Categorical Analysis
The following analysis compares the following:
1. Per capita total food waste (as reported in the kitchen diaries) with selected demographics, behaviors and attitudes reported in survey #1 using multivariate analysis (ANOVA). ANOVA allows for the comparison of multiple groups of people in terms of the mean per capita total (not edible) food waste generation (in comparison to t-tests which only allow for two groups to be compared). ANOVA is a test of significance to help determine if the compared groups are likely to be different or if their difference is likely a result of randomness.
2. Reported demographics, attitudes and behaviors with other demographics, attitudes and behaviors. We used categorical analysis (Pearson’s Chi-Squared Test) to test correlation between two attitudes, behaviors, or demographics that do not have specific numerical values.
The output of both ANOVA and Pearson’s Chi-Squared is a p-value. The lower the p-value, the more likely the difference between the two groups is not a result of random chance. For the purposes of this analysis, we will consider any p-value of under .1 (or 10% chance of being a result of random chance) to be “significant.” Please note that a “significant” t-test does not provide definitive evidence of association or indicate the strength of the association, but does indicate there is a high likelihood of association. Neither of these tests provide causation of any kind.
Note 1: Only variables with statistically significant relationships are listed below.
Note 2: The multivariate and categorical analysis was performed only for Denver and NYC, as Nashville’s sample size was too small for this type of test.
TABLE 2: MULTIVARIATE AND CATEGORICAL PER CAPITA COMPARISONS OF DEMOGRAPHICS, ATTITUDES AND BEHAVIOR WITH WASTED FOOD GENERATION – DENVER & NYC
RELATIONSHIP ANALYZED (TEST USED)
DENVER NEW YORK CITY
P-VALUE BRIEF DESCRIPTION OF RELATIONSHIP P-VALUE BRIEF DESCRIPTION OF RELATIONSHIP
Average Age of Household Members with Per Capita Food Waste Generation (ANOVA)
Groups:1. Millennials (19-35)2. Middle (36-64)3. Older (65+)
.00
Households with older average age waste more food per capita.
Average Food Waste Generation Per Capita in lbs/week by group: Millennials (19-35): 1.8 lbs Middle (36-64): 2.3 lbs Older (65+): 3.0 lbs
Household Size with Per Capita Food Waste Generation (ANOVA)
Groups:1. Living Alone2. 2 to 4 people3. 5 or more people
.03
Smaller households waste more food per capita.
Average Food Waste Generation Per Capita in lbs/week by group: Living Alone: 3.3 lbs 2 to 4 people: 2.8 lbs 5 or more people: 1.5 lbs
.00
Smaller households waste more food per capita.
Average Food Waste Generation Per Capita in lbs/week by group: Living Alone: 2.9 lbs 2 to 4 people: 2.1 lbs 5 or more people: 1.5 lbs
Food Waste Compared to Average American with Avoidable Food Waste (Chi-Squared)
Groups for Average American:1. A Lot More & A Little Bit More2. The Same3. A Lot Less and A Little Bit Less
Groups for Avoidable Food Waste:1. A Lot & A Fair Amount2. None & A Little
.00
People who say they have a lot or a fair amount of avoidable food waste also say they waste more or the same amount of food than the average American.
.00
People who say they have a lot or a fair amount of avoidable food waste also say they waste more or the same amount of food than the average American.

Page 98 ESTIMATING QUANTITIES AND TYPES OF FOOD WASTE AT THE CITY LEVEL: TECHNICAL APPENDICES NRDC Page 99 ESTIMATING QUANTITIES AND TYPES OF FOOD WASTE AT THE CITY LEVEL: TECHNICAL APPENDICES NRDC
TABLE 2: MULTIVARIATE AND CATEGORICAL PER CAPITA COMPARISONS OF DEMOGRAPHICS, ATTITUDES AND BEHAVIOR WITH WASTED FOOD GENERATION – DENVER & NYC
RELATIONSHIP ANALYZED (TEST USED)
DENVER NEW YORK CITY
P-VALUE BRIEF DESCRIPTION OF RELATIONSHIP P-VALUE BRIEF DESCRIPTION OF RELATIONSHIP
Whether Household Composts with Less Guilt If Food is Composted (Chi-Squared)
Groups for Less Guilt if Food is Composted: 1. Agree & Somewhat Agree2. Neither Agree Nor Disagree3. Disagree & Somewhat Disagree
.00People who compost feel less guilty about wasted food if it is composted.
.00People who compost feel less guilty about wasted food if it is composted.
Whether Household Composts with Food Waste Compared to Average American (Chi-Squared)
Groups:1. A Lot More & A Little Bit More2. The Same3. A Lot Less and A Little Bit Less
.01People who compost say they waste less than the average American.
Maximum Age of Household with Cooking/Preparing Dinners at Home (Chi-Squared)
Groups for Age:1. Millennials (19-35)2. Over 35
Groups for Cooking/Preparing Dinner at Home:1. 2 or Fewer Times Per Week2. 3 or More Times Per Week
.00
Households with a maximum age of 35 or less (millennials) cook/prepare 2 or fewer dinners at home per week.
Maximum Age of Household with Eating Out Spur of the Moment (Chi-Squared)
Groups for Age:1. Millennials (19-35)2. Over 35
Groups for Eating Out Spur of the Moment:1. Agree & Somewhat Agree2. Neither Agree Nor Disagree3. Disagree & Somewhat Disagree
.04Households with maximum age over 35 are more likely to eat out spur of the moment.

Page 100 ESTIMATING QUANTITIES AND TYPES OF FOOD WASTE AT THE CITY LEVEL: TECHNICAL APPENDICES NRDC
Appendix J: Survey 1 and 2 Comparison and Survey 2 Unique Questions
Comparison to Survey 1: Questions Repeated in Survey 2 from Survey 1A subset of questions in residential surveys given to respondents in survey 1 (completed before the kitchen diary period) were identical to questions in survey 2 (completed after the kitchen diary period). Tables Q1 through Q15 show the direction of change in responses to the questions repeated in Survey 2 as compared to initial responses by the same respondents to the same questions in Survey 1. Q16 through Q24 summarize responses to questions unique to Survey 2.
Q1. CONSIDERING THE FOOD THROWN AWAY IN YOUR HOUSEHOLD IN THE AVERAGE WEEK, HOW MUCH OF THAT FOOD DISPOSAL DO YOU THINK COULD BE AVOIDED (E.G. THROUGH PLANNING MEALS AHEAD OF TIME, CHANGING FOOD SHOPPING HABITS)?
# NASHVILLE % NASHVILLE # DENVER % DENVER # NYC % NYC # TOTAL % TOTAL
PERCEPTION OF AMOUNT THAT COULD BE AVOIDED INCREASED 9 13% 26 13% 46 13% 81 13%
STAYED THE SAME 47 66% 119 61% 207 59% 373 61%
PERCEPTION OF AMOUNT THAT COULD BE AVOIDED DECREASED 13 18% 48 25% 89 26% 150 25%
(BLANK) 2 3% 1 1% 6 2% 9 1%
Q2. DO YOU THINK THE AMOUNT OF EDIBLE FOOD YOU THROW OUT IS MORE THAN, THE SAME AS, OR LESS THAN THE AVERAGE AMERICAN?
# NASHVILLE % NASHVILLE # DENVER % DENVER # NYC % NYC # TOTAL % TOTAL
PERCEPTION OF AMOUNT OF EDIBLE FOOD THROWN AWAY COMPARED TO AVERAGE AMERICAN INCREASED
6 8% 22 11% 43 12% 71 12%
STAYED THE SAME 52 73% 108 56% 221 64% 381 62%
PERCEPTION OF AMOUNT OF EDIBLE FOOD THROWN AWAY COMPARED TO AVERAGE AMERICAN DECREASED
13 18% 64 33% 78 22% 155 25%
(BLANK) 0 0% 0 0% 6 2% 6 1%
Q3. HOW STRONGLY DO YOU AGREE OR DISAGREE WITH THE FOLLOWING STATEMENT? “IN THE PAST YEAR, MY HOUSEHOLD HAS MADE AN EFFORT TO REDUCE THE AMOUNT OF FOOD WE THROW AWAY”
# NASHVILLE % NASHVILLE # DENVER % DENVER # NYC % NYC # TOTAL % TOTAL
RESPONDENT AGREED MORE STRONGLY 30 42% 47 24% 117 34% 194 32%
STAYED THE SAME 29 41% 97 50% 175 50% 301 49%
RESPONDENT DISAGREED MORE STRONGLY 12 17% 50 26% 47 14% 109 18%
(BLANK) 0 0% 0 0% 9 3% 9 1%

Page 100 ESTIMATING QUANTITIES AND TYPES OF FOOD WASTE AT THE CITY LEVEL: TECHNICAL APPENDICES NRDC Page 101 ESTIMATING QUANTITIES AND TYPES OF FOOD WASTE AT THE CITY LEVEL: TECHNICAL APPENDICES NRDC
Q4. HOW STRONGLY DO YOU AGREE OR DISAGREE WITH THE FOLLOWING STATEMENT? “MY HOUSEHOLD HAS COMPLETE CONTROL OVER REDUCING THE AMOUNT OF FOOD WE THROW AWAY”
# NASHVILLE % NASHVILLE # DENVER % DENVER # NYC % NYC # TOTAL % TOTAL
RESPONDENT AGREED MORE STRONGLY 14 20% 48 25% 90 26% 152 25%
STAYED THE SAME 40 56% 97 50% 168 48% 305 50%
RESPONDENT DISAGREED MORE STRONGLY 17 24% 49 25% 79 23% 145 24%
(BLANK) 0 0% 0 0% 11 3% 11 2%
Q5. HOW STRONGLY DO YOU AGREE OR DISAGREE WITH THE FOLLOWING STATEMENT? “PEOPLE AROUND ME BELIEVE MY HOUSEHOLD SHOULD REDUCE THE AMOUNT OF FOOD WE THROW AWAY”
# NASHVILLE % NASHVILLE # DENVER % DENVER # NYC % NYC # TOTAL % TOTAL
RESPONDENT AGREED MORE STRONGLY 16 23% 43 22% 97 28% 156 26%
STAYED THE SAME 40 56% 102 53% 164 47% 306 50%
RESPONDENT DISAGREED MORE STRONGLY 15 21% 49 25% 73 21% 137 22%
(BLANK) 0 0% 0 0% 14 4% 14 2%
Q6. HOW STRONGLY DO YOU AGREE OR DISAGREE WITH THE FOLLOWING STATEMENT? “MY HOUSEHOLD BELIEVES THAT REDUCING THE AMOUNT OF FOOD WE THROW AWAY WOULD BE GOOD”
# NASHVILLE % NASHVILLE # DENVER % DENVER # NYC % NYC # TOTAL % TOTAL
RESPONDENT AGREED MORE STRONGLY 23 32% 27 14% 104 30% 154 25%
STAYED THE SAME 42 59% 121 62% 198 57% 361 59%
RESPONDENT DISAGREED MORE STRONGLY 6 8% 46 24% 32 9% 84 14%
(BLANK) 0 0% 0 0% 14 4% 14 2%
Q7. HOW STRONGLY DO YOU AGREE OR DISAGREE WITH THE FOLLOWING STATEMENT? “MY HOUSEHOLD INTENDS TO REDUCE THE AMOUNT OF FOOD WE THROW AWAY”
# NASHVILLE % NASHVILLE # DENVER % DENVER # NYC % NYC # TOTAL % TOTAL
RESPONDENT AGREED MORE STRONGLY 20 28% 39 20% 115 33% 174 29%
STAYED THE SAME 41 58% 107 55% 173 50% 321 53%
RESPONDENT DISAGREED MORE STRONGLY 10 14% 48 25% 45 13% 103 17%
(BLANK) 0 0% 0 0% 15 4% 15 2%

Page 102 ESTIMATING QUANTITIES AND TYPES OF FOOD WASTE AT THE CITY LEVEL: TECHNICAL APPENDICES NRDC
Q8. HOW STRONGLY DO YOU AGREE OR DISAGREE WITH THE FOLLOWING STATEMENT? “GIVEN THE AMOUNT OF FOOD THAT IS THROWN AWAY IN THIS COUNTRY, THE ACTIONS OF MY HOUSEHOLD WON'T MAKE A MEANINGFUL DIFFERENCE IN THE AMOUNT OF FOOD BEING WASTED”
# NASHVILLE % NASHVILLE # DENVER % DENVER # NYC % NYC # TOTAL % TOTAL
RESPONDENT AGREED MORE STRONGLY 15 21% 41 21% 62 18% 118 19%
STAYED THE SAME 46 65% 100 52% 167 48% 313 51%
RESPONDENT DISAGREED MORE STRONGLY 10 14% 53 27% 106 30% 169 28%
(BLANK) 0 0% 0 0% 13 4% 13 2%
Q9. HOW STRONGLY DO YOU AGREE OR DISAGREE WITH THE FOLLOWING STATEMENT? “REDUCING MY HOUSEHOLD'S FOOD WASTE WOULD SAVE ENERGY”
# NASHVILLE % NASHVILLE # DENVER % DENVER # NYC % NYC # TOTAL % TOTAL
RESPONDENT AGREED MORE STRONGLY 12 17% 46 24% 74 21% 132 22%
STAYED THE SAME 47 66% 110 57% 200 57% 357 59%
RESPONDENT DISAGREED MORE STRONGLY 12 17% 38 20% 65 19% 115 19%
(BLANK) 0 0% 0 0% 9 3% 9 1%
Q10. HOW STRONGLY DO YOU AGREE OR DISAGREE WITH THE FOLLOWING STATEMENT? “REDUCING MY HOUSEHOLD'S FOOD WASTE WOULD SAVE WATER”
# NASHVILLE % NASHVILLE # DENVER % DENVER # NYC % NYC # TOTAL % TOTAL
RESPONDENT AGREED MORE STRONGLY 11 15% 48 25% 80 23% 139 23%
STAYED THE SAME 42 59% 106 55% 191 55% 339 56%
RESPONDENT DISAGREED MORE STRONGLY 18 25% 40 21% 67 19% 125 20%
(BLANK) 0 0% 0 0% 10 3% 10 2%
Q11. HOW STRONGLY DO YOU AGREE OR DISAGREE WITH THE FOLLOWING STATEMENT? “REDUCING MY HOUSEHOLD'S FOOD WASTE WOULD FEED HUNGRY PEOPLE”
# NASHVILLE % NASHVILLE # DENVER % DENVER # NYC % NYC # TOTAL % TOTAL
RESPONDENT AGREED MORE STRONGLY 19 27% 47 24% 88 25% 154 25%
STAYED THE SAME 32 45% 98 51% 157 45% 287 47%
RESPONDENT DISAGREED MORE STRONGLY 19 27% 49 25% 93 27% 161 26%
(BLANK) 1 1% 0 0% 10 3% 11 2%

Page 102 ESTIMATING QUANTITIES AND TYPES OF FOOD WASTE AT THE CITY LEVEL: TECHNICAL APPENDICES NRDC Page 103 ESTIMATING QUANTITIES AND TYPES OF FOOD WASTE AT THE CITY LEVEL: TECHNICAL APPENDICES NRDC
Q12. HOW STRONGLY DO YOU AGREE OR DISAGREE WITH THE FOLLOWING STATEMENT? “REDUCING MY HOUSEHOLD'S FOOD WASTE WOULD IMPROVE THE HEALTH OF MY HOUSEHOLD”
# NASHVILLE % NASHVILLE # DENVER % DENVER # NYC % NYC # TOTAL % TOTAL
RESPONDENT AGREED MORE STRONGLY 18 25% 48 25% 52 15% 118 19%
STAYED THE SAME 33 46% 94 48% 217 62% 344 56%
RESPONDENT DISAGREED MORE STRONGLY 20 28% 52 27% 67 19% 139 23%
(BLANK) 0 0% 0 0% 12 3% 12 2%
Q13. HOW STRONGLY DO YOU AGREE OR DISAGREE WITH THE FOLLOWING STATEMENT? “REDUCING MY HOUSEHOLD'S FOOD WASTE WOULD SAVE MY HOUSEHOLD MONEY”
# NASHVILLE % NASHVILLE # DENVER % DENVER # NYC % NYC # TOTAL % TOTAL
RESPONDENT AGREED MORE STRONGLY 8 11% 43 22% 64 18% 115 19%
STAYED THE SAME 51 72% 115 59% 213 61% 379 62%
RESPONDENT DISAGREED MORE STRONGLY 10 14% 36 19% 61 18% 107 18%
(BLANK) 2 3% 0 0% 10 3% 12 2%
Q14. HOW STRONGLY DO YOU AGREE OR DISAGREE WITH THE FOLLOWING STATEMENT:? “REDUCING MY HOUSEHOLD'S FOOD WASTE WOULD DECREASE LANDFILL USE”
# NASHVILLE % NASHVILLE # DENVER % DENVER # NYC % NYC # TOTAL % TOTAL
RESPONDENT AGREED MORE STRONGLY 8 11% 41 21% 74 21% 123 20%
STAYED THE SAME 49 69% 126 65% 203 58% 378 62%
RESPONDENT DISAGREED MORE STRONGLY 12 17% 27 14% 58 17% 97 16%
(BLANK) 2 3% 0 0% 13 4% 15 2%
Q15. HOW STRONGLY DO YOU AGREE OR DISAGREE WITH THE FOLLOWING STATEMENT? “REDUCING MY HOUSEHOLD'S FOOD WASTE WOULD DECREASE CARBON EMISSIONS”
# NASHVILLE % NASHVILLE # DENVER % DENVER # NYC % NYC # TOTAL % TOTAL
RESPONDENT AGREED MORE STRONGLY 11 15% 39 20% 39 20% 89 15%
STAYED THE SAME 45 63% 113 58% 113 58% 271 44%
RESPONDENT DISAGREED MORE STRONGLY 15 21% 42 22% 42 22% 99 16%
(BLANK) 0 0% 0 0% 0 0% 0 0%

Page 104 ESTIMATING QUANTITIES AND TYPES OF FOOD WASTE AT THE CITY LEVEL: TECHNICAL APPENDICES NRDC
Questions Unique to Survey 2Q16. HOW STRONGLY DO YOU AGREE OR DISAGREE WITH THE FOLLOWING STATEMENT AS IT RELATES TO YOUR HOUSEHOLD? “MEASURING THE FOOD THAT WAS DISCARDED IN OUR HOUSEHOLD CHANGED HOW MUCH WE THROW AWAY”
# NASHVILLE % NASHVILLE # DENVER % DENVER # NYC % NYC # TOTAL % TOTAL
AGREE 15 21% 37 18% 67 19% 119 19%
SOMEWHAT AGREE 20 28% 62 31% 111 31% 193 31%
NEITHER AGREE NOR DISAGREE 12 17% 43 21% 78 22% 133 21%
SOMEWHAT DISAGREE 16 23% 23 11% 42 12% 81 13%
DISAGREE 8 11% 36 18% 54 15% 98 16%
(BLANK) 0 0% 2 1% 5 1% 7 1%
Q17. HOW STRONGLY DO YOU AGREE OR DISAGREE WITH THE FOLLOWING STATEMENT AS IT RELATES TO YOUR HOUSEHOLD? “AFTER MEASURING THE FOOD THAT WAS DISCARDED IN OUR HOUSEHOLD, I NOW BELIEVE THAT OUR HOUSEHOLD WASTES MORE THAN I PREVIOUSLY THOUGHT”
# NASHVILLE % NASHVILLE # DENVER % DENVER # NYC % NYC # TOTAL % TOTAL
AGREE 6 8% 14 7% 35 10% 55 9%
SOMEWHAT AGREE 12 17% 35 17% 52 15% 99 16%
NEITHER AGREE NOR DISAGREE 9 13% 22 11% 67 19% 98 16%
SOMEWHAT DISAGREE 14 20% 50 25% 71 20% 135 21%
DISAGREE 30 42% 80 39% 125 35% 235 37%
(BLANK) 0 0% 2 1% 7 2% 9 1%
Q18. HOW FREQUENTLY DID YOU TALK TO A MEMBER OF YOUR HOUSEHOLD ABOUT FOOD WASTE BECAUSE OF PARTICIPATING IN THE STUDY?
# NASHVILLE % NASHVILLE # DENVER % DENVER # NYC % NYC # TOTAL % TOTAL
NEVER 15 21% 46 23% 66 18% 127 20%
ONE TIME 3 4% 13 6% 45 13% 61 10%
A COUPLE OF TIMES 24 34% 81 40% 132 37% 237 38%
MANY TIMES 29 41% 60 30% 105 29% 194 31%
(BLANK) 0 0% 3 1% 9 3% 12 2%
Q19. HOW FREQUENTLY DID YOU TALK TO SOMEONE OUTSIDE OF YOUR HOUSEHOLD ABOUT FOOD WASTE BECAUSE OF PARTICIPATING IN THE STUDY?
# NASHVILLE % NASHVILLE # DENVER % DENVER # NYC % NYC # TOTAL % TOTAL
NEVER 10 14% 59 29% 115 32% 184 29%
ONE TIME 10 14% 40 20% 76 21% 126 20%
A COUPLE OF TIMES 38 54% 85 42% 135 38% 258 41%
MANY TIMES 13 18% 16 8% 22 6% 51 8%
(BLANK) 0 0% 3 1% 9 3% 12 2%

Page 104 ESTIMATING QUANTITIES AND TYPES OF FOOD WASTE AT THE CITY LEVEL: TECHNICAL APPENDICES NRDC Page 105 ESTIMATING QUANTITIES AND TYPES OF FOOD WASTE AT THE CITY LEVEL: TECHNICAL APPENDICES NRDC
Survey #2 Results: Unique Questions (Part 2)
OPEN-ENDED QUESTIONSThe following are major themes from answers to the following open-ended questions in Survey 2. Themes represent summaries of responses and the number of responses fitting each theme is identified in parentheses. Not all answers are captured below.
Q20. What (if anything) would have made it easier to complete the kitchen diary? • Nothing/it was easy (209)
• Online or electronic version of the kitchen diary (68)
• More space to write on the kitchen diary (41)
• Being able to lump food items together instead of weigh them separately (18)
• Simpler instructions (7)
• Take pictures of wasted food instead of writing it down (6)
• Start on any day that is convenient (2)
• Add column for things dropped on floor or wasted by children (2)
Q21. What (if anything) would have made it easier to be a participant in the study?• Nothing (209)
• Online or electronic version of the kitchen diary (24)
• Reduce time needed to complete (20)
• Make it easier to record food wasted outside of the home (8)
• Make it easier to track all household members (8)
• Clearer instructions (8)
• Being able to lump food items together instead of weigh them separately (7)
• Start on any day that is convenient (7)
• More publicity on the study and initiative (4)
• Questions and kitchen diary were geared towards family units and/or single persons; hard for roommates or non-conventional housing situations (2)
Q22. What did you learn (if anything) from participating in this study?• Household wastes less food than previously thought or household is doing a good job not wasting (118)
• More aware of the significant quantities of food thrown away (86)
• Participating increased desire to compost (38)
• Most of the food wasted was inedible (16)
• Household needs to be more aware of the issue (12)
• Need to change purchasing habits to waste less (19)
• Waste a lot of one item (7)
• Household eats out a lot (6)
• Most of the waste related to food is packaging (6)
• Waste a lot of coffee (2)

Page 106 ESTIMATING QUANTITIES AND TYPES OF FOOD WASTE AT THE CITY LEVEL: TECHNICAL APPENDICES NRDC
Additional Responses to Q22: “I marked much of our food waste as ‘inedible parts,’ but even many of those inedible parts (onion skins, stems from greens, carrot peelings) could have been used another time to make broths, smoothies, teas, etc. We cook almost every night in our home (significant investment of time) but as a family of four with two working parents going the extra mile to save compostable kitchen scraps for second use (like uses listed above), it feels like it tips us over the edge of what kind of time we can give to maintaining our kitchen. I also learned that cooking large quantities of meals (pasta especially) to eat all week for lunches contributed to wasting food (surprised me) because we ultimately get sick of eating the leftovers around the fourth day in a row.”
“That my personal household does not produce much food waste. I think that primary focus should be on restaurants, events spaces, festivals and sporting events.”
“That most of the food we throw out is when we clean out the fridge when we take out the trash.”
“All of the little food wastes accumulate to something.”
“Some of the things we throw away probably could be composted (egg shells, coffee grounds, moldy vegetables), but also that we tend to waste more when we eat away from home. I don’t know if it’s because I’m not actually preparing it (don’t have a vested interest in not seeing it go to waste), or because our child is picky, but we all tend to waste less when we eat at home.”
“I learned that each individual is in complete control of how much food they throw away. The food we throw away directly relates to many other important factors in the world we live in today. Thank you for allowing me to be a part of this study and helping me realize the impact and control I have over the food I throw away.”
“That I need to stop wasting food as much. I want to minimize buying a ton of produce at a time and maybe make more frequent stops at the store.”
“I plan to go to the store more often, start meal planning more, and eat the food we have before buying new. For example, we have two bananas that are pretty ripe but totally fine to eat. I was at the store and I was going to grab bananas but I thought about how we have two at home. We found ourselves reaching toward the newly purchased bananas rather than eating the ones that are a bit more ripe. Then those would get too ripe and we would toss them.”
“I learned that our household food waste was not so much, but that if we caught me during a fridge cleanout week, it would be huge. Also we eat out a lot, and I believe restaurant per capita food waste would be greater than if we ate at home all the time.”
“I don’t waste as much as I thought. I have great portion control. My problem is I am the Queen of Freeze, and this particular week I did not do a big ‘throw out’ from my freezer. Such periodic tossing occurs about once every two months and waste from it probably adds up over a year. I freeze things and do NOT eat them in the long run.”
“I waste more than I want, but less than I feared.”
“It’s the packaging, not the food, that’s the biggest waste.”
“A much greater percentage of waste was due to food packaging. Though we recycle everything we can, we’re still getting food packaged in styrofoam, which can’t be recycled. Also, the amount of plastic food is packaged in is incredible. Even if it is recycled the plastic we discarded (into recycling) was 10 times the amount of food we discarded in a week.”
“I learned that our food waste habits vary from week to week. The week of the study we hardly wasted any food at all, but the following week our food waste was higher because of some food that was spoiling.”
“I throw away a lot more food when I eat out than when I cook and eat at home.”
“Generally, I throw out very little, but saw I could throw out less. I became more thoughtful about it.”
“When weighing the items I would think to myself, ‘Is there any other application I can think of where I can use this item rather than throwing it out?’ - it helped push me to keep coffee grinds as a shower scrub, and some lemon peels for air freshener sprays. The study helped spark creativity in ways to reuse the food rather than tossing it.”
“My household actually wastes a considerable amount of food without thinking. We let food go past due dates and on whim, when we eat out, we don’t consider food that’s already in the fridge.”
“Now I cook only the amount of food for the people that are in the house. Sometimes I would cook extra because someone called to say that they are coming over and they never show up. Now I will wait until they come. If they don’t show up by the time they say they are coming. I will only cook for the ones that are here.”

Page 106 ESTIMATING QUANTITIES AND TYPES OF FOOD WASTE AT THE CITY LEVEL: TECHNICAL APPENDICES NRDC Page 107 ESTIMATING QUANTITIES AND TYPES OF FOOD WASTE AT THE CITY LEVEL: TECHNICAL APPENDICES NRDC
Q23a. What do you think Nashville can do to help residents waste less food? • Provide education on issues of food waste (28)
• Promote awareness of food waste through the Mayor’s office and issue a challenge for the community to strive to reduce food waste
• Focus on education in elementary schools
• Promote outreach through neighborhood association groups
• Provide tips for reducing food waste (10)
• Smaller and more frequent shopping trips
• Meal planning
• Date labels
• Composting or anaerobic digestion (20)
• Make cheaper
• Make available city-wide
• Offer deals on compost bins
• Neighborhood compost sites
• Make it possible to buy food in smaller portions in stores and restaurants, especially for small households (4)
Additional Responses to Q23a (Nashville): “I don’t understand the expiration dates on products. Some say ‘sell by’ (but then by when do I need to use them?); canned or jarred products just have a date, but once opened, when do they need to be thrown away? How long do things like spices last? Seems to me there is a lot of confusion regarding these dates and this causes me to err on the side of caution and throw away products that are perfectly good just because of confusing expiration dates.”
“They could start an ad campaign with slogans like: ‘Save your cash, don’t throw food in the trash!’, ‘Food didn’t come to Nashville for a bachelorette party, don’t let it get wasted!’, or ‘Truth be told, that bread is old, but it still is viable if you scrape off the mold!’”
“Educate Nashvillians on what the causes of wasted food are and what the consequences of that are —I need suggestions for creating less waste that is the result of inedible parts of fruits and vegetables. It would also be helpful if there were smaller portions that meet the needs of single households available when purchasing fruits like melon and vegetables like spinach.”
“Nashville needs to make healthy food more affordable, so people don’t have to wait until it goes on sale and ‘stock up.’ That leads to waste (at least in our household).”
Q23b. What do you think Denver can do to help residents waste less food? • Provide education on issues of food waste (57)
• Provide tips for reducing food waste (14)
• Composting (71)
• Make cheaper or free
• Make available city-wide
• Make it possible to buy food in smaller portions in stores and restaurants, especially for small households (7)
• Do more studies and surveys on food waste (9)

Page 108 ESTIMATING QUANTITIES AND TYPES OF FOOD WASTE AT THE CITY LEVEL: TECHNICAL APPENDICES NRDC
• Don’t really know how a city can help since it is more of an individual issue (4)
• Provide incentives (3)
• Focus on restaurants and grocers to reduce food waste (6)
Additional Responses to Q23b (Denver): “Currently we pay a separate fee to have curbside compost pickup. We think it should be included in our current waste management fees for trash and recycle pickup. It might encourage more people to participate.”
“Have families take the challenge. I thought we would waste more but because we were doing this study, I wanted to eat the food we have. My husband would look at expiration dates and put the food about to expire toward the front of the fridge. It made us think about it and will probably do it more in the future.”
“Reminders in the produce section of the store how long certain items may last in the fridge and maybe a fun campaign that includes in-store reminders to buy what you need. “
“Create opportunities for restaurants and grocery stores to get their waste to people in need, even if that was just having a time and a ‘clean’ dumpster where people could expect items to be thrown out.”
“I think a huge part of food waste stems from restaurants and grocery stores. I think there need to be more programs in place for food that is wasted from those venues, to disseminate those products to people who might need them.”
“I think that while residential food waste is certainly a problem, it isn’t THE problem. Most of the food waste comes before the consumer takes it home. I’ve volunteered with Denver Food Rescue and seen how much grocery stores get rid of that is still 100% edible EVERY DAY and I know that even more (especially produce) never even makes it to the grocery store because it isn’t pretty enough.”
“Add an extra hour in the day :) I really don’t think there is much we can do. I mean my recycle bin is right next to my trash bin and I still throw recyclables away. Incentivize it??”
Q23c. What do you think New York City can do to help residents waste less food? • Provide education on issues of food waste (77)
• Education in schools
• Billboards, ads, etc.
• Provide tips for reducing food waste (19)
• Composting (81)
• Make cheaper or free
• Make available city-wide
• Make it possible to buy food in smaller portions in stores and restaurants, especially for small households (19)
• Do more studies and surveys on food waste (11)
• Don’t really know how a city can help since it is more of an individual issue (5)
• Focus on restaurants and grocers to reduce food waste (8)
Additional Responses to Q23c (New York City): “We need to quit buying in ‘bulk’ since people’s good intentions (cooking homecooked meals throughout the week) can get sidetracked by hunger, something else popping up, etc., and that ‘bulk’ food can be forgotten.”
“Inform people of the facts. Such as whether you can still eat food if it is past the date on the package—I know you can still eat it unless it has ‘gone bad,’ but some people throw it out as soon as it is past the date on the package. I personally would like to know whether egg yolks are still viewed as bad for your heart, because I don’t like throwing out egg yolks, but I also don’t want to eat too many egg yolks if they are bad for my health.”
“Compared to the companies the consumer is small potatoes and we are fighting a losing battle.”

Page 108 ESTIMATING QUANTITIES AND TYPES OF FOOD WASTE AT THE CITY LEVEL: TECHNICAL APPENDICES NRDC Page 109 ESTIMATING QUANTITIES AND TYPES OF FOOD WASTE AT THE CITY LEVEL: TECHNICAL APPENDICES NRDC
“Make them aware of the size of the total problem. Make it clear that even though it seems that each family’s waste is a tiny percentage of the whole, it all adds up, so everyone should do their bit. It’s the same idea as voting, or lowering the amount of electricity, gas and gasoline we use.”
“Make it easier to compost and recycle—like many NYCers I live in a small place and mice and cockroaches come up often. That means we have to keep our trash on a specific counter. Since we have to already split up our paper recycling, and have trash, there is no room for four bins!!! When we lived in San Francisco and we could throw all recycling in one bin, we composted a lot more often.”
“The problem is the grocery stores—it can be hard to buy some things in small quantities.”
“I think more education would be good—I have the composting bucket, but honestly all it did was create a haven for fruit flies. Then when I’d go to dump it, it was a disgusting mess.”
“I don’t think the city can do anything. This is where personal responsibility plays a role.”
“Run ads kind of similar to the ones in the early 2000’s: like the one with the dinosaurs that taught kids to not let the water run while brushing your teeth, or the talking trash cans that taught you how to recycle cardboard, plastic and metal. Something actually fun and not guilt trippy?”
“I do not think that residents of metropolitan NYC waste much food, since they buy only as much food as they can carry by foot, it really forces one to plan all the meals. The same with takeouts—portions are small and delicious; plates are licked out!”
“Make it easier to buy fresh food more frequently, discouraging bulk/excess purchasing. More blame is on the retail economy than the consumer.”
Q24. What suggestions do you have for the study team to improve the experience for participants in the study? • Nothing (183)
• Provide kitchen diary electronically or online (52)
• The collection of garbage as part of the study was off-putting or confusing (11)
• Be clearer about the process to participate in the study (10)
• Share the study results (9)
• More incentives (5)
• Study should be longer than one week to better capture how much food is wasted (3)

Page 110 ESTIMATING QUANTITIES AND TYPES OF FOOD WASTE AT THE CITY LEVEL: TECHNICAL APPENDICES NRDC
Bin digs were performed in Nashville, Denver, and New York City to help understand how much and what types of food are discarded from institutional, commercial, and industrial (ICI) facilities. Samples of up to 200 pounds of trash (and compost, when available) were collected from each facility and sorted into 10 food and 8 non-food categories. Additionally, facilities were asked to fill out a survey which included basic information to aid in sample pickup coordination, facility characteristics such as number of employees and annual revenue, and information on current food- and food waste-related behaviors.
When feasible, findings from the bin digs were extrapolated to generate annual food waste generation estimates. Two methods of extrapolation were used based on available information: 1) If the bin dig represented all or a known portion of food waste discarded for a known period of time, the amount was extrapolated for an entire year based on the number of days a facility operates per year (if the portion of waste material collected was not known, the bin dig was not extrapolated); and/or 2) If the bin dig represented all trash and/or compost materials disposed by that facility and the facility provided annual estimates of total waste generation in their survey, the percentage of total trash or compost material that food represented by weight in the bin dig was multiplied by the estimate of total food waste disposed per year. In some cases, both methods could be used to generate an estimate and numbers are presented as a range. For most cases, there was only enough information and/or the bin dig only allowed for extrapolation using one method. However, if it was evident that the sampled material did not represent a facility’s normal waste pattern, the bin dig results were not extrapolated.
Bin digs were only conducted one time and generally represented one day’s worth of waste materials from each facility. As such, these bin digs are “snapshots” and may not represent a facility’s normal waste generation pattern. Additionally, the samples collected were a maximum of 200 pounds of material each; for example, for larger facilities with non-homogeneous waste (e.g., grocers), a single 200-pound sample may not have been “representative” of that facility’s waste. When it was obvious that the sampled material did not represent a facility’s normal waste pattern, the bin dig results were not extrapolated.
Using estimated annual food waste generation as determined, “conversion factors” were estimated for each facility, whenever possible. As applicable by facility type, conversion factors include food waste generation per: 1) employee; 2) bed; 3) student; 4) $ of revenue; 5) rooms; and 6) meals.
Below are the conversion factors calculated below by facility type. For each facility, the following information is provided: 1) Anonymized sample ID; 2) Facility Characteristics (e.g. Public Elementary School); 3) Conversion Factors as applicable; 4) Method of Extrapolation (see paragraph two for description of each; note that method 1 above corresponds to “bin dig” and method 2 corresponds to “self-reported”); 5) Notes Relevant to Estimate. Prior to the table for each sector, there is a list of conversion factors currently used or generated by EPA, Massachusetts, California, or MetroVancouver for comparison. See Appendix L for specific conversion factors and citations for these references.
COLLEGES & UNIVERSITIESThe following conversion factor was derived from previous studies: .35 lbs/meal*
SAMPLE ID (CITY)FACILITY
CHARACTERISTICSBY EMPLOYEE
(LBS/EMPLOYEE/YR)BY BED
(LBS/BED/YR)BY MEAL
(LBS/MEAL)
METHOD OF EXTRAPOLATION: BIN DIG OR SELF-
REPORTED? NOTES
T39/C39 (NYC) University 60 lbs/bed/yr Bin Dig Residence Hall and Dining Hall
T45/C45 (NYC) University 161.5 lbs/employee/yr Bin Dig Dining Hall Only
T13 (Denver) University 931 lbs/employee/yr .17 lbs/meal Bin Dig Dining Hall Only
Appendix K: ICI Bin Digs Conversion Factors
* Used in NRDC’s ICI Food Waste Estimates

Page 110 ESTIMATING QUANTITIES AND TYPES OF FOOD WASTE AT THE CITY LEVEL: TECHNICAL APPENDICES NRDC Page 111 ESTIMATING QUANTITIES AND TYPES OF FOOD WASTE AT THE CITY LEVEL: TECHNICAL APPENDICES NRDC
CORPORATE CAFETERIAS AND BREAKROOMS Corporate cafeterias and breakrooms were not included as a sector of interest in the city-level food waste estimations; however, the results below indicate that they could be a significant generator of wasted food. By employee, corporate cafeteria food waste generation ranged from 5 lbs/employee/yr to 80 lbs/employee/yr.
SAMPLE ID (CITY) FACILITY CHARACTERISTICSBY EMPLOYEE (LBS/EMPLOYEE/YR)
METHOD OF EXTRAPOLATION: BIN DIG OR SELF-REPORTED? NOTES
ICI-09/10 (Nashville) Corporate Cafeteria/ Breakroom 5 lbs/employee/yr Bin Dig
ICI-21 (Nashville) Corporate Cafeteria/ Breakroom 29 lbs/employee/yr Bin Dig
T43/C43 (NYC) Corporate Cafeteria/ Breakroom 63 lbs/employee/yr Bin Dig
T42 (NYC) Corporate Cafeteria/ Breakroom 16 lbs/employee/yr Bin Dig
T15/C15 (NYC) Corporate Cafeteria/ Breakroom 22 to 25 lbs/employee/yr Both
T36 (NYC) Corporate Cafeteria/ Breakroom 9 lbs/employee/yr Bin Dig
T13/C13 (NYC) Corporate Cafeteria/ Breakroom 74 lbs/employee/yr Bin Dig
T12 (NYC) Corporate Cafeteria/ Breakroom 80 lbs/employee/yr Self-Reported
T35/C35 (NYC) Corporate Cafeteria/ Breakroom 38 lbs/employee/yr Self-Reported
T15/C15 (Denver) Corporate Cafeteria/ Breakroom 54 lbs/employee/yr Bin Dig
T18 (Denver) Corporate Cafeteria/ Breakroom 53 lbs/employee/yr Bin Dig
T07/C07 (Denver) Corporate Cafeteria/ Breakroom 49.2 lbs/employee/yr Bin Dig
CORRECTIONAL FACILITIESThe following conversion factors were derived from previous studies:
• 1 lbs/inmate/day (365 lbs/inmate/yr)*
• 2 lbs/inmate/day (730 lbs/inmate/yr)
SAMPLE ID (CITY)FACILITY
CHARACTERISTICSBY EMPLOYEE
(LBS/EMPLOYEE/YR)BY BED
(LBS/BED/YR)BY MEAL
(LBS/MEAL)METHOD OF EXTRAPOLATION: BIN DIG OR SELF-REPORTED? NOTES
ICI-13 (Nashville) Correctional Facility 629 lbs/employee/yr 99 lbs/bed/yr .09 lbs/meal Bin Dig
EVENTS & RECREATION FACILITIES As expected, the amount of wasted food generated by Events & Recreation facilities greatly varies at least partially due to the varying uses of these facilities. Additionally, large variations in waste generation are expected throughout the year based on event frequency and type.
The following conversion factors were derived from previous studies:
• .6 lbs/seat/day*
• .45 lbs/visitor*
• 1 lb/meal
• 1 ton/employee/yr (2000 lbs/employee/yr)
• .53 tons/1,000 visitors/yr (1 lb/visitor)
* Used in NRDC’s ICI Food Waste Estimates
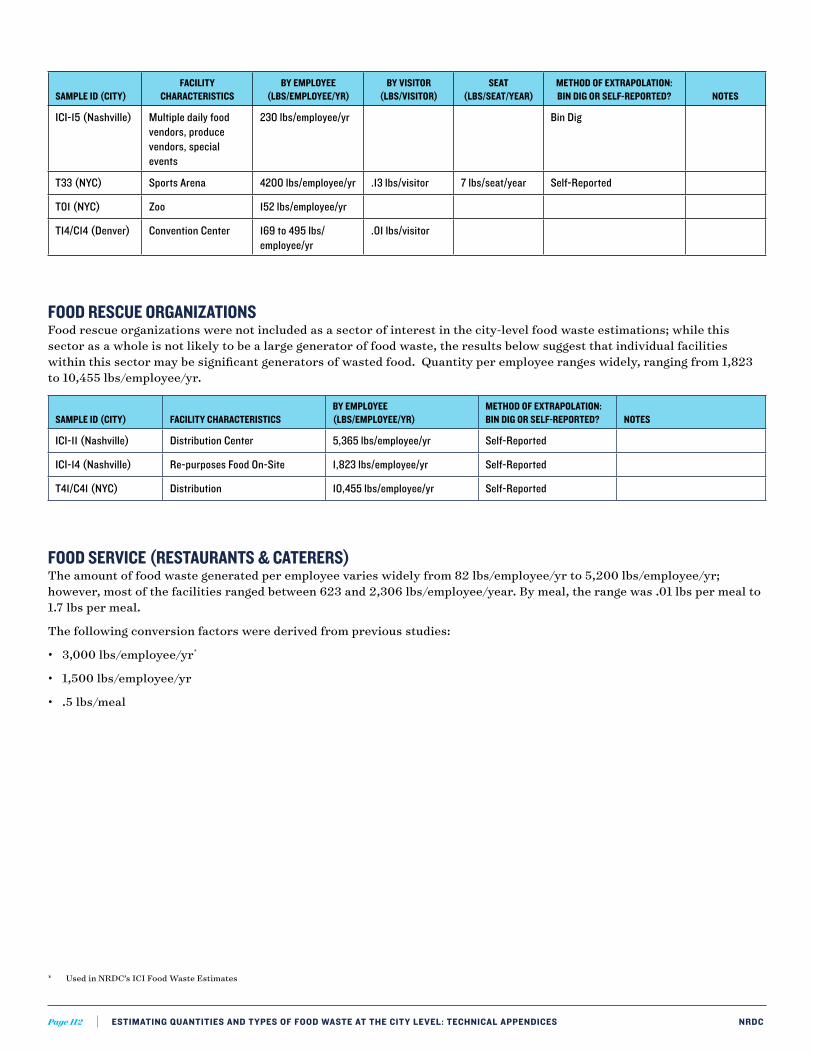
Page 112 ESTIMATING QUANTITIES AND TYPES OF FOOD WASTE AT THE CITY LEVEL: TECHNICAL APPENDICES NRDC
SAMPLE ID (CITY)FACILITY
CHARACTERISTICSBY EMPLOYEE
(LBS/EMPLOYEE/YR)BY VISITOR
(LBS/VISITOR)SEAT
(LBS/SEAT/YEAR)METHOD OF EXTRAPOLATION: BIN DIG OR SELF-REPORTED? NOTES
ICI-15 (Nashville) Multiple daily food vendors, produce vendors, special events
230 lbs/employee/yr Bin Dig
T33 (NYC) Sports Arena 4200 lbs/employee/yr .13 lbs/visitor 7 lbs/seat/year Self-Reported
T01 (NYC) Zoo 152 lbs/employee/yr
T14/C14 (Denver) Convention Center 169 to 495 lbs/employee/yr
.01 lbs/visitor
FOOD RESCUE ORGANIZATIONSFood rescue organizations were not included as a sector of interest in the city-level food waste estimations; while this sector as a whole is not likely to be a large generator of food waste, the results below suggest that individual facilities within this sector may be significant generators of wasted food. Quantity per employee ranges widely, ranging from 1,823 to 10,455 lbs/employee/yr.
SAMPLE ID (CITY) FACILITY CHARACTERISTICSBY EMPLOYEE (LBS/EMPLOYEE/YR)
METHOD OF EXTRAPOLATION: BIN DIG OR SELF-REPORTED? NOTES
ICI-11 (Nashville) Distribution Center 5,365 lbs/employee/yr Self-Reported
ICI-14 (Nashville) Re-purposes Food On-Site 1,823 lbs/employee/yr Self-Reported
T41/C41 (NYC) Distribution 10,455 lbs/employee/yr Self-Reported
FOOD SERVICE (RESTAURANTS & CATERERS) The amount of food waste generated per employee varies widely from 82 lbs/employee/yr to 5,200 lbs/employee/yr; however, most of the facilities ranged between 623 and 2,306 lbs/employee/year. By meal, the range was .01 lbs per meal to 1.7 lbs per meal.
The following conversion factors were derived from previous studies:
• 3,000 lbs/employee/yr*
• 1,500 lbs/employee/yr
• .5 lbs/meal
* Used in NRDC’s ICI Food Waste Estimates

Page 112 ESTIMATING QUANTITIES AND TYPES OF FOOD WASTE AT THE CITY LEVEL: TECHNICAL APPENDICES NRDC Page 113 ESTIMATING QUANTITIES AND TYPES OF FOOD WASTE AT THE CITY LEVEL: TECHNICAL APPENDICES NRDC
SAMPLE ID (CITY)FACILITY
CHARACTERISTICSBY EMPLOYEE
(LBS/EMPLOYEE/YR)BY REVENUE
(LBS/$ REVENUE)BY MEAL
(LBS/MEAL)
METHOD OF EXTRAPOLATION: BIN DIG OR SELF-
REPORTED? NOTES
ICI-01 (Nashville) Full Service Restaurant
465 to 791 lbs/employee/yr
.004 to .006 lbs/$ revenue
.1 to .16 lbs/meal Both
ICI-03 (Nashville) Full Service Restaurant
760.83 lbs/employee/yr
.01 lbs/$ revenue .79 lbs/meal Bin Dig UNDERESTIMATE. Does not count food going to compost collection. Trash only.
ICI-12 (Nashville) Full Service Restaurant
335.60 lbs/employee/yr
Bin Dig UNDERESTIMATE. Was not one full day of service. Picked up in late evening but before restaurant closed.
ICI-22 (Nashville) Limited Service Restaurant
623 to 3,242 lbs/employee/yr
.01 to .08 lbs/$ revenue
.09 to .48 lbs/meal
Both Large range due to discrepancy in self-reported waste rate vs. bin dig
T21 (NYC) Limited Service Restaurant
5200 lbs/employee/year
.26 lbs/meal Bin Dig
T22/C22 (NYC) Limited Service Restaurant
82 lbs/ employee/year
.01 lbs/meal Bin Dig Seems like an outlier
T19/C19 (NYC) Limited Service Restaurant
1522 to 2306 lbs/employee/year
.02 to .03 lbs/ $ revenue
.24 to .36 lbs/meal
Both
T05/C05 (Denver)
Full Service Restaurant
838 to 3263 lbs/employee/yr
.01 to .5 lbs/$ revenue
.17 to .67 lbs/meal
Both
T17 (Denver) Full Service Restaurant
1672 lbs/ employee/yr
1.7 lbs/meal Bin Dig
GROCERS & MARKETSThe following conversion factors were derived from previous studies:
• 3,000 lbs/employee/yr*
• 5,577 lbs/employee/yr
SAMPLE ID (CITY) FACILITY CHARACTERISTICSBY EMPLOYEE (LBS/EMPLOYEE/YR)
METHOD OF EXTRAPOLATION: BIN DIG OR SELF-REPORTED? NOTES
T31/C31 (NYC) Small Grocer/Market 1700 lbs/employee/yr Bin Dig
HEALTH CARE: HOSPITALSBy employee, food waste generation ranged widely from 31.6 to 3500 lbs/employee. However, multiple facilities had a factor of .07 lbs of wasted food per meal. Note that many of these are underestimates, as only a portion of discarded food was captured in the bin digs.
The following conversion factors were derived from previous studies:
• 3.42 lbs/bed/day* (1,248.3 lbs/bed/yr)
• .6 lbs/meal
• .16 tons/employee/yr (320 lbs/employee/yr)
• 3.12 lbs/bed/day (1,138.8 lbs/bed/yr)
* Used in NRDC’s ICI Food Waste Estimates

Page 114 ESTIMATING QUANTITIES AND TYPES OF FOOD WASTE AT THE CITY LEVEL: TECHNICAL APPENDICES NRDC
SAMPLE ID (CITY)FACILITY
CHARACTERISTICSBY EMPLOYEE
(LBS/EMPLOYEE/YR)BY BED
(LBS/BED/YR)BY MEAL
(LBS/MEAL)
METHOD OF EXTRAPOLATION: BIN DIG OR SELF-
REPORTED? NOTES
ICI-19/20 (Nashville)
Hospital. Cafeteria and Food Production.
293 lbs/ employee/yr
51 lbs/bed/yr .07 lbs/meal Bin Dig UNDERESTIMATE. Does not include plate waste from patient rooms.
T11 (NYC) Hospital 244 lbs/bed/yr Bin Dig Kitchen & Post-Consumer
T29 (NYC) Hospital 3500 lbs/employee/yr
512 lbs/bed/yr .31 lbs/meal Bin Dig Kitchen & Post-Consumer
T25 (Denver) Hospital 31.6 lbs/ employee/yr
.07lbs/meal Self-Reported
T28 (Denver) Hospital .07 lbs/meal Bin Dig UNDERESTIMATE: Kitchen waste only
HOSPITALITY (HOTELS)The following conversion factors have been used:
• 1,984 lbs/employee/yr*
• 1 lb/guest/day
• 345 lbs/room/yr
• 1.31 tons/room/yr (2,620 lbs/room/yr)
• 1,370 lbs/employee/yr
SAMPLE ID (CITY)FACILITY
CHARACTERISTICSBY EMPLOYEE
(LBS/EMPLOYEE/YR)BY ROOM
(LBS/ROOM/YR)
METHOD OF EXTRAPOLATION: BIN DIG OR SELF-
REPORTED? NOTES
T25/C25 (NYC) Hotel 600 lbs/ employee/yr
600 lbs/room/yr Bin Dig Kitchen, dish pit, and employee commissary
K-12 SCHOOLSBy student, food waste generation ranged from 12 lbs/student/year to 50 lbs/student/year (note that outlier of 165 lbs/student/year was not considered). These are in line with the estimates below.
The following conversion factors were derived from previous studies:
• 1.13 lbs/elementary student/week* (40.68 lbs/elementary student/yr)
• .73 lbs/middle school student/week* (26.28 lbs/middle school student/yr)
• .35 lbs/middle school student/week* (12.6 lbs/middle school student/yr)
• .72 lbs/student/week (25.92 lbs/student/yr)
• .5 lbs/student/week (18 lbs/student/yr)
• 1.4 lbs/student/week (50.4 lbs/student/yr)
Note: Assume 36 weeks in a school year
* Used in NRDC’s ICI Food Waste Estimates

Page 114 ESTIMATING QUANTITIES AND TYPES OF FOOD WASTE AT THE CITY LEVEL: TECHNICAL APPENDICES NRDC Page 115 ESTIMATING QUANTITIES AND TYPES OF FOOD WASTE AT THE CITY LEVEL: TECHNICAL APPENDICES NRDC
SAMPLE ID (CITY) FACILITY CHARACTERISTICSBY STUDENT (LBS/STUDENT/YR)
METHOD OF EXTRAPOLATION: BIN DIG OR SELF-REPORTED? NOTES
ICI-05 (Nashville) Public Elementary 14 lbs/student/yr Bin Dig
ICI-06 (Nashville) Public Elementary 50 lbs/student/yr Bin Dig
ICI-07 (Nashville) Public Elementary 50 lbs/student/yr Bin Dig
ICI-16 (Nashville) Private, All Grades 13 lbs/student/yr Bin Dig
ICI-17 (Nashville) Private, High School 16 to 34 lbs/student/yr Both
ICI-23 (Nashville) Private, Middle/High School 18 lbs/student/yr Bin Dig UNDERESTIMATE. Only took front-of-the-house waste.
T02/C02(NYC) Public, Middle/High School 12 lbs/student/yr Bin Dig
T26/C26 (NYC) Private, Elementary 165 lbs/student/year Bin Dig Seems like an outlier
T05/C05 (NYC) Private 41 lbs/students/year Bin Dig
T10 (Denver) Public, Elementary 19 lbs/student/year Bin Dig
T16 (Denver) Public, Middle School 17 lbs/student/year Bin Dig
T19 (Denver) Public, High School 12 lbs/student/year Bin Dig
“GROUND-TRUTHING” ICI FOOD WASTE ESTIMATES In order to “ground-truth” the conversion factors used by the ICI food waste estimates (see Appendix L), the conversion factors derived from the bin digs (see description above for method of developing conversion factors) were compared to those used in our analysis. To compare, both a range of values and average conversion factors derived from bin digs were compared to the conversion factors used in ICI food waste estimates (see table below). Additionally, for each sector, any notable and common characteristics of bin dig results are presented in the table below. Please note that the table below only compares conversion factors derived above with the one used for the city-level estimates. Other conversion factors were derived and can be found above by sector.
SECTOR
CONVERSION FACTOR USED IN ICI FOOD WASTE
ESTIMATESRANGE OF DERIVED
CONVERSION FACTORS AVERAGE OF DERIVED
CONVERSION FACTORS
RATIONALE FOR OR AGAINST USING NUMBER IN ICI FOOD
WASTE ESTIMATESNOTABLE CHARACTERISTICS OF
SECTOR BIN DIGS
Colleges & Universities
.35 lbs/meal .17 lbs/meal .17 lbs/meal Conversion factor seems reasonable given limited data.
Dining halls only
Only based on one facility
Highest proportion of wasted food by type was cooked/prepared foods/leftovers.
Correctional Facilities
1 lb/inmate/day .3 lbs/bed/yr .3 lbs/bed/yr Conversion factor seems reasonable given limited data.
Only based on one facility
Events & Recreation
.6 lbs/seat/day
.45 lbs/visitor
.01 -.13 lb/seat/yr
.07 lbs/visitor
.7lb/seat/yr
.07 lbs/visitor
Conversion factor seems reasonable given limited data and highly variable nature of events and recreation facilities.
Only based on one facility for seat/yr conversion factor
Food Manufacturers
.053 lbs/$ of revenue/yr None Derived Unable to get “representative” facility that provided facility-level information

Page 116 ESTIMATING QUANTITIES AND TYPES OF FOOD WASTE AT THE CITY LEVEL: TECHNICAL APPENDICES NRDC
SECTOR
CONVERSION FACTOR USED IN ICI FOOD WASTE ESTIMATES
RANGE OF DERIVED CONVERSION FACTORS
AVERAGE OF DERIVED CONVERSION FACTORS
RATIONALE FOR OR AGAINST USING NUMBER IN ICI FOOD WASTE ESTIMATES
NOTABLE CHARACTERISTICS OF SECTOR BIN DIGS
Food Service (Restaurants & Caterers)
3,000 lbs/employee/yr 82-5,200 lbs/employee/yr
1,620 lbs/employee/yr Conversion factor seems reasonable given large variability and it falls within range of derived conversion factors.
Restaurants only
Huge variability in derived conversion factors
Highest proportions of wasted food by type were cooked/prepared foods/leftovers and inedible parts.
Food Wholesalers & Distributors
.01 lbs/$ of revenue/yr None Derived Unable to get “representative” facility that provided facility-level information
Grocers & Markets
3,000 lbs/employee/yr 1,700 lbs/ employee/yr
1,700 lbs/employee/yr Only based on one small grocer
Hospitals 3.42 lbs/bed/day .14-1.4 lbs/bed/day .74 lbs/bed/day Conversion factor seems reasonable given that patient waste is not included.
Does not include patient waste for health and safety reasons.
Highest proportions of wasted food by type were cooked/prepared foods/leftovers and liquids.
Hospitality (Hotels)
1,984 lbs/employee/yr 600 lbs/ employee/yr
600 lbs/employee/yr Conversion factor seems reasonable given limited data.
Only based on one facility
K-12 Schools Elementary – 1.13 lbs/student/week
Middle – .73 lbs/student/week
High – .35 lbs/student/week
All – .74 lbs/student/week
Elementary/Middle – .93 lbs/student/week
Middle/High – .54 lbs/student/week
.3-4.6 lbs/student/week
1 lbs/student/week Conversion factor is within range and very close to average.
Highest proportion of wasted food by type is fruits & vegetables

Page 116 ESTIMATING QUANTITIES AND TYPES OF FOOD WASTE AT THE CITY LEVEL: TECHNICAL APPENDICES NRDC Page 117 ESTIMATING QUANTITIES AND TYPES OF FOOD WASTE AT THE CITY LEVEL: TECHNICAL APPENDICES NRDC
FACILITY-LEVEL INFORMATIONIn order to conduct ICI food waste generation estimates, information on the types of facilities in the geographic area was obtained using several databases, both public and proprietary. Information on location, sales, number of employees, number of students, square footage, and number of beds at each facility was obtained to estimate food waste generation, whenever possible. The information collected from the database was “cleaned” to remove duplicates, facilities outside of the sectors of interest, and facilities located outside of the city limits.
The following public databases were used (facility information for other sectors was found on proprietary databases):
• National Center for Education Statistics: Provided list of colleges/universities and K-12 schools (both public and private), including location, education levels, and number of students.
• American Hospital Directory: Provided list of hospitals, including location and number of beds.
• PrisonPro.com: Provided list of correctional facilities by location and number of beds.
CONVERTING FACILITY-LEVEL INFORMATION TO FOOD WASTE ESTIMATESFor each sector, conversion factors were used to convert facility-level information to food waste generation estimates (see Table 1 below for list of conversion factors). The conversion factors used for this analysis were identified by the U.S. Environmental Protection Agency in their report entitled “Technical Methodology for the U.S. EPA Wasted Food Opportunities Map (Version 1.0)1”. The sources were compared to other potential sources of information, including some of the limited number of food waste characterizations completed by local and state governments (see Table 1 for specific sources).
Below is the main piece of facility-level information used to estimate food waste generation for each sector:
• Colleges & Universities (# of students)
• Correctional Facilities (# of inmates/beds)
• Events & Recreation Facilities (# of seats)
• Food Manufacturing & Processing (revenue)
• Food Wholesalers & Distributors (revenue)
• Grocers & Markets (# of employees)
• Health Care (# of beds for hospitals; revenue for nursing homes)
• Hospitality (Hotels) (# of employees)
• K-12 Schools (# of students, grade levels)
• Restaurants & Caterers (# of employees)
Appendix L: ICI Estimates Conversion Factors

Page 118 ESTIMATING QUANTITIES AND TYPES OF FOOD WASTE AT THE CITY LEVEL: TECHNICAL APPENDICES NRDC
TABLE 1. CONVERSION FACTORS USED IN ANALYSIS
SECTOR CONVERSION FACTOR(S) USED DATABASE USED FOR LIST OF FACILITIES
Colleges & Universities
.35 lbs/meal
Residential – 405 meals/student/yr
Non-Residential – 108 meals/students/yr2
National Center for Education Statistics
Correctional Facilities 1 lb/inmate/day3 PrisonPro.com
Events & Recreation Facilities
100 days/yr
.6 lbs/seat/day
Attendance is 80% of capacity
OR (depending on available facility information):
.45 lbs/visitor4
Online Search
Food Manufacturing & Processing .053 lbs/$ of revenue/yr5 Proprietary Database
Food Service Sector (Restaurants & Caterers) 3,000 lbs/employee/yr6 Proprietary Database
Food Wholesalers & Distributors .01 lbs/$ of revenue/yr7 Proprietary Database
Grocers & Markets 3,000 lbs/employee/yr8 Proprietary Database
Health Care—Hospitals 3.42 lbs/bed/day9 American Hospital Directory
Health Care—Nursing Homes1.8 lbs/bed/day
23 beds/$ million of revenue10
Proprietary Database
Hospitality (Hotels) 1,984 lbs/employee/yr11 Proprietary Database
K-12 Schools
31 weeks/year
Elementary – 1.13 lbs/student/week
Middle – .73 lbs/student/week
High - .35 lbs/student/week
All – .74 lbs/student/week
Elementary/Middle - .93 lbs/student/week
Middle/High - .54 lbs/student/week12
National Center for Education Statistics
K-12 SchoolsFor K-12 schools, different wastage rates were used for elementary, middle, and high schools. However, some schools are combined middle/high schools or have all grades. It was assumed that there were 36 weeks of school per year. For combined schools, an average was used:
• Elementary/Middle School: .93 lbs per student per week
• Middle/High School: .54 lbs per student per week
• All Grades: .74 lbs per student per week
Nursing HomesFor nursing homes, it was estimated that 23 beds equate to $1 million in revenue. This estimate was generated using information from the American Health Care Association13 stating that there are 1.7 million beds in nursing homes in the U.S. representing $72 billion of revenue.

Page 118 ESTIMATING QUANTITIES AND TYPES OF FOOD WASTE AT THE CITY LEVEL: TECHNICAL APPENDICES NRDC Page 119 ESTIMATING QUANTITIES AND TYPES OF FOOD WASTE AT THE CITY LEVEL: TECHNICAL APPENDICES NRDC
Events & Recreation Facilities A comprehensive list of events and recreation facilities serving food was not available. A list of facilities was generated through online searches; however, information on number of seats, number of employees, number of visitors, and revenue could not be found for all facilities. Additionally, events and recreation facilities represent a wide range of facility types and uses (number of days per year the facility is in use, types of event, etc.), thus determining a conversion factor that works for all is difficult. EPA’s methodology did not include conversion factors for event facilities, so two conversion factors from Recycling Works Massachusetts14 were used due to the overall similarity between numbers used by Recycling Works and EPA.
If information on number of seats was available, the following assumptions and conversion factors were used:
• Each facility is in operation for 100 days per year (assumption by NRDC)
• 80% capacity (assumption by NRDC)
• .6 lbs/seat/day
If information on the number of visitors was available and number of seats was not, the following conversion factor was used:
• .45 lbs/visitor
COMPARISONS TO OTHER CONVERSION FACTORSThe conversion factors used for this analysis were identified by the U.S. Environmental Protection Agency in their report entitled “Technical Methodology for the U.S. EPA Wasted Food Opportunities Map (Version 1.0)”.15 Acknowledging that there are other potential sources of food waste generation information, we compared EPA’s conversion factors to other sources of information, including some of the limited number of waste characterizations completed by local and state governments. Additionally, potential concerns about specific conversion factors were identified as potential areas for further research (see Table 2 for comparison of conversion factors and Table 3 for list of concerns). Please note that the information in these tables is not comprehensive of all studies on food waste generated in the institutional, commercial, and industrial sectors. A sensitivity analysis was performed for some of the facility types (see Table 3 for list) to determine the potential impact of specific conversion factors on the entire food waste generation estimate. Although we believe that the most appropriate conversion factors were selected for this analysis, the alternate estimations derived from the scenarios used to conduct the sensitivity analysis can be used as a range to show certainty if desired. (See Tables 4-6 for detailed scenarios and conversion factors derived from the sensitivity analysis.)

Page 120 ESTIMATING QUANTITIES AND TYPES OF FOOD WASTE AT THE CITY LEVEL: TECHNICAL APPENDICES NRDC
TABLE 2: COMPARISON OF CONVERSION FACTORS
SECTOR NRDC ANALYSISEPA WASTED FOOD OPPORTUNITIES MAP16
RECYCLING WORKS MASSACHUSETTS FOOD WASTE ESTIMATION GUIDE17
METRO VANCOUVER 2014 ICI WASTE CHARACTERIZATION18
CALRECYCLE 2014 GENERATOR-BASED CHARACTERIZATION OF COMMERCIAL SECTOR DISPOSAL AND DIVERSION IN CA19
NOTES ON SOURCE No Direct Measurement. Uses previous studies and other state estimation factors.
No Direct Measurement. Uses previous studies and conversations with industry.
Direct Measurement. Used total waste generated (tons/employee/yr) in each sector and % of total waste that is food to determine factors below. Sampled from 100 generators in Metro Vancouver. Note: Numbers provided are for “compostable organics”
Direct Measurement. Used total waste generated (tons)/employee/yr in each sector and % of total waste that is food to determine factors below. Sampled from 837 generators in California.
CORRECTIONAL FACILITIES
1 lb/inmate/day 1 lb/inmate/day 1) 2 lbs/inmate/day 2) 30% of total waste generated by weight
EDUCATION 1) .17 tons/employee/yr 2) 3.67 tons/100 students/yr (1.4 lbs/student/week)
K-12 SCHOOLS .72 lbs/student/week 40 weeks/yr
1) .5 lbs/student/week 2) 45% of disposed waste by weight
K-12 SCHOOLS - PRIVATE
.35 lbs/meal 180 meals/student/yr
K-12 SCHOOLS - PUBLIC
.5 lbs/student/week 40 weeks/yr
K-12 SCHOOLS - ELEMENTARY
1.13 lbs/student/week 1.13 lbs/student/week
K-12 SCHOOLS - MIDDLE
.73 lbs/student/week .73 lbs/student/week
K-12 SCHOOLS - MIDDLE/HIGH
.54 lbs/student/week
K-12 SCHOOLS - HIGH SCHOOL
.35 lbs/student/week .35 lbs/student/week
COLLEGES AND UNIVERSITIES - RESIDENTIAL
.35 lbs/meal 405 meals/student/yr
.35 lbs/meal 405 meals/student/yr
.35 lbs/meal 405 meals/student/yr
COLLEGES AND UNIVERSITIES - NON-RESIDENTIAL
.35 lbs/meal 108 meals/student/yr
.35 lbs/meal 108 meals/student/yr
.35 lbs/meal 108 meals/student/yr
EVENTS & RECREATION
.6 lbs/seat/day 1) .6 lbs/seat/day 2) 1 lb/meal 3) .45 lbs/visitor 4) 25% of disposed waste by weight
1) 1 ton/employee/yr 2) .53 tons/1,000 visitors/yr

Page 120 ESTIMATING QUANTITIES AND TYPES OF FOOD WASTE AT THE CITY LEVEL: TECHNICAL APPENDICES NRDC Page 121 ESTIMATING QUANTITIES AND TYPES OF FOOD WASTE AT THE CITY LEVEL: TECHNICAL APPENDICES NRDC
TABLE 2: COMPARISON OF CONVERSION FACTORS (CONT.)
SECTOR NRDC ANALYSISEPA WASTED FOOD OPPORTUNITIES MAP16
RECYCLING WORKS MASSACHUSETTS FOOD WASTE ESTIMATION GUIDE17
METRO VANCOUVER 2014 ICI WASTE CHARACTERIZATION18
CALRECYCLE 2014 GENERATOR-BASED CHARACTERIZATION OF COMMERCIAL SECTOR DISPOSAL AND DIVERSION IN CA19
FOOD MANUFACTURERS
.053 lbs/$ of revenue/yr .053 lbs/$ of revenue/yr 2,398 lbs/employee/yr .7 tons/employee/yr
FOOD SERVICE (RESTAURANTS AND CATERERS)
3,000 lbs/employee/yr 3,000 lbs/employee/yr 1) .5 lbs/meal 2) 1,500 lbs/employee/yr 3) 66% of disposed waste by weight 4) 51% of disposed waste by weight
1) 666 lbs/employee/yr 2) .13 lbs/visitor/yr
1.5 tons/employee/yr (2,978 lbs/employee/yr)
FOOD WHOLESALERS AND DISTRIBUTORS
.01 lbs/$ of revenue/yr .01 lbs/$ of revenue/yr
GROCERY STORES AND MARKETS
3,000 lbs/employee/yr 3,000 lbs/employee/yr 1) 3,000 lbs/employee/yr 2) 63% of disposed waste by weight
2.8 tons/employee/yr (5,577 lbs/employee/yr)
HEALTH CARE 1) .16 tons/employee/yr 2) .57 tons/bed/yr (3.12 lbs/bed/day)
HEALTH CARE - HOSPITALS
3.42 lbs/bed/day 3.42 lbs/bed/day 1) .6 lbs/meal 2) 30% of food served by weight 3) 3.42 lbs/bed/day
HEALTH CARE - NURSING HOMES
1.8 lbs/bed/day (23 beds/$1 million - calculated by NRDC based on info from American Health Care Association20)
1.8 lbs/bed/day .269 beds/$ million revenue (was based on hospitals)
1) .6 lbs/meal 2) 20% of food served by weight 3) 1.8 lbs/bed/day
HOSPITALITY (HOTELS)
1,984 lbs/employee/yr 1,984 lbs/employee/yr (Alternate: 345.64 lbs/room/yr; 3.38 rooms/employee)
1) 1 lb/guest/day 2) 345 lbs/room/yr 3) 36% of disposed waste by weight
1) 994 lbs/employee/yr 2) .4 lb/visitor/yr
1) .68 tons/employee/yr (1369.6 lbs/employee/yr) 2) 1.31 tons/guest room/yr

Page 122 ESTIMATING QUANTITIES AND TYPES OF FOOD WASTE AT THE CITY LEVEL: TECHNICAL APPENDICES NRDC
ICI ESTIMATES—SENSITIVITY ANALYSISIn order to conduct ICI food waste generation estimates, information on the types of facilities in the geographic area was obtained using several databases, both public and proprietary. Information on location, sales, number of employees, number of students, square footage, and number of beds at each facility was obtained to estimate food waste generation, whenever possible. The conversion factors used are sector-based averages of food waste generation. The average represents an entire sector of diverse facilities with wide-ranging food waste generation rates. The data used were the best available; however, there were concerns about some of the conversion factors (see Table 3 below).
TABLE 3: CONCERNS ABOUT CONVERSION FACTORS
SECTOR CONCERNS ABOUT DATA SENSITIVITY ANALYSIS?
Colleges & Universities No
Correctional Facilities No
Events & Recreation Facilities Depends significantly on event types, number of events/year, and other factors that make this sector diverse
Seat capacity vs. visitors is important distinction (may only be able to find seat capacity)
No
Food Manufacturing & Processing No
Food Service Sector (Restaurants and Caterers)
May be significant differences based on type of restaurant: quick service vs. full service vs. limited service
Some industry estimates are lower (e.g. 1,500 lbs/employee/yr)
Yes (Scenarios 1 & 2)
Food Wholesalers & Distributors No
Grocers & Markets 3,000 lb number is from 1990s. There has been a reduction in employee size for grocers which may mean a higher food waste/employee number
Does not distinguish between hypermarkets, supermarkets, and smaller grocers
Does not include food that goes to reclaimer
Yes (Scenario 3)
Health Care - Hospitals No
Health Care – Nursing Homes No
Hospitality May significantly depend on what types of food services are provided (e.g. room service, restaurants, bars, etc.)
Yes (Scenario 4)
K-12 Schools May be significant differences by public vs. private school within school level No
In order to determine the impact of using other available conversion factors from trusted sources, the following four scenarios were run to determine sensitivity of the analysis to changes in conversion factors:
Scenario 1: Use 1,500 lbs/employee/year for restaurants & caterers instead of 3,000 lbs/employees/year. New figure is from Recycling Works Massachusetts.21
Scenario 2: Use 1,500 lbs/employee/year for limited service restaurants and 3,000 lbs/employee/year for all other restaurants and caterers instead of 3,000 lbs/employees/year. New figure is from Recycling Works Massachusetts.22
Scenario 3: Use 5,577 lbs/employee/year for grocers & markets instead of 3,000 lbs/employees/year. New figure is from CalRecycle’s 2014 Generator-Based Characterization of Commercial Sector Disposal and Diversion in California.23
Scenario 4: Use 1,369.6 lbs/employee/year for hospitality instead of 1,984 lbs/employees/year. New figure is from CalRecycle’s 2014 Generator-Based Characterization of Commercial Sector Disposal and Diversion in California.24

Page 122 ESTIMATING QUANTITIES AND TYPES OF FOOD WASTE AT THE CITY LEVEL: TECHNICAL APPENDICES NRDC Page 123 ESTIMATING QUANTITIES AND TYPES OF FOOD WASTE AT THE CITY LEVEL: TECHNICAL APPENDICES NRDC
Summary tables for each city are below.
TABLE 4: NASHVILLE SENSITIVITY ANALYSIS
BASELINE SCENARIO SCENARIO 1 SCENARIO 2 SCENARIO 3 SCENARIO 4
USED 1,500 LBS/EMPLOYEE/YR FOR
RESTAURANTS AND CATERERS
(INSTEAD OF 3,000 LBS/EMPLOYEE/YR)
USED 1,500 LBS/EMPLOYEE/YR FOR LIMITED SERVICE
RESTAURANTS AND 3,000 LBS/YEAR FOR ALL
OTHERS (INSTEAD OF 3,000 LBS/EMPLOYEE/
YEAR FOR ALL)
USED 5577 LBS/EMPLOYEE/YR FOR GROCERS
(INSTEAD OF 3000 LBS/EMPLOYEE/YR)
USED 1,369.6 LBS/EMPLOYEE/YEAR FOR HOSPITALITY
(INSTEAD OF 1,984 LBS/EMPLOYEE/YR)
FOOD WASTE GENERATION (TONS/YR)
% OF TOTAL
FOOD WASTE GENERATION (TONS/YR)
% OF TOTAL
FOOD WASTE GENERATION (TONS/YR)
% OF TOTAL
FOOD WASTE GENERATION (TONS/YR)
% OF TOTAL
FOOD WASTE GENERATION (TONS/YR)
% OF TOTAL
Colleges and Universities 3,223 3% 3,223 3% 3,223 3% 3,223 2% 3,223 3%
Hospitality 6,773 6% 6,773 7% 6,773 6% 6,773 5% 4,819.62 4%
Health Care 3,794 3% 3,794 4% 3,794 3% 3,794 3% 3,794 3%
Grocers and Markets 15,299 13% 15,299 15% 15,299 14% 28,439.91 21% 15,299 13%
Food Wholesalers and Distributors 14,271 12% 14,271 14% 14,271 13% 14,271 11% 14,271 12%
Restaurants and Caterers 59,993 50% 39,995.00 40% 52,518.75 47% 59,993 45% 59,993 51%
Food Manufacturing and Processing 11,586 10% 11,586 12% 11,586 10% 11,586 9% 11,586 10%
Events and Recreation Facilities 2,996 3% 2,996 3% 2,996 3% 2,996 2% 2,996 3%
K-12 Schools 876 1% 876 1% 876 1% 876 1% 876 1%
Correctional Facilities 469 <1% 469 <1% 469 0% 469 <1% 469 <1%
TOTAL 119,280 100% 99,282 100% 111,806 100% 132,421 100% 117,326 100%

Page 124 ESTIMATING QUANTITIES AND TYPES OF FOOD WASTE AT THE CITY LEVEL: TECHNICAL APPENDICES NRDC
TABLE 5: DENVER SENSITIVITY ANALYSIS
BASELINE SCENARIO SCENARIO 1 SCENARIO 2 SCENARIO 3 SCENARIO 4
USED 1,500 LBS/EMPLOYEE/YR FOR
RESTAURANTS AND CATERERS
(INSTEAD OF 3,000 LBS/EMPLOYEE/YR)
USED 1,500 LBS/EMPLOYEE/YR FOR LIMITED SERVICE
RESTAURANTS AND 3,000 LBS/YEAR FOR ALL
OTHERS (INSTEAD OF 3,000 LBS/EMPLOYEE/
YEAR FOR ALL)
USED 5577 LBS/EMPLOYEE/YR FOR GROCERS
(INSTEAD OF 3000 LBS/EMPLOYEE/YR)
USED 1,369.6 LBS/EMPLOYEE/YEAR FOR HOSPITALITY
(INSTEAD OF 1,984 LBS/EMPLOYEE/YR)
FOOD WASTE GENERATION (TONS/YR)
% OF TOTAL
FOOD WASTE GENERATION (TONS/YR)
% OF TOTAL
FOOD WASTE GENERATION (TONS/YR)
% OF TOTAL
FOOD WASTE GENERATION (TONS/YR)
% OF TOTAL
FOOD WASTE GENERATION (TONS/YR)
% OF TOTAL
Colleges and Universities 2,736 3% 2,736 3% 2,736 3% 2,736 2% 2,736 3%
Hospitality 7,675 7% 7,675 9% 7,675 7% 7,675 6% 5,298.30 5%
Health Care 2,683 2% 2,683 3% 2,683 3% 2,683 2% 2,683 3%
Grocers and Markets 11,480 11% 11,480 13% 11,480 11% 21,340.39 18% 11,480 11%
Food Wholesalers and Distributors 16,757 15% 16,757 19% 16,757 16% 16,757 14% 16,757 16%
Restaurants and Caterers 45,158 42% 22,578.75 26% 40,904.25 39% 45,158 38% 45,158 43%
Food Manufacturing and Processing 15,980 15% 15,980 19% 15,980 15% 15,980 13% 15,980 15%
Events and Recreation Facilities 4,197 4% 4,197 5% 4,197 4% 4,197 4% 4,197 4%
K-12 Schools 1,296 1% 1,296 2% 1,296 1% 1,296 1% 1,296 1%
Correctional Facilities 568 1% 568 1% 568 1% 568 0% 568 1%
TOTAL 108,530 100% 85,950 100% 104,275 100% 118,389 100% 106,152 100%
1 Environmental Protection Agency, “Technical Methodology for the U.S. EPA Wasted Food Opportunities Map (Version 1.0),” to be available at https://www.epa.gov/sustainable-management-food/technical-methodology-wasted-food-opportunities-map (not yet available at time of print).
2 South Carolina Department of Commerce (SCDOC), “South Carolina Food Waste Generation Report. Prepared by South Carolina Department of Commerce,” available at http://www.recyclinginsc.com/sites/default/files/all/scfoodwastegeneration_summary_updated_1.pdf (February 2015);
Vermont Agency of Natural Resources, Department of Environmental Conservation, Solid Waste Program (DECVT), “ANR Universal Recycling Materials Management Database & Map Methodology,” available at http://www.anr.state.vt.us/dec/wastediv/solid/ documents/Methodology_OrganicsMapDatabase.pdf (2014);
Food Scrap Generator Database Calculations available at http://www.anr.state.vt.us/dec/wastediv/solid/documents/FSGCalculations-Final.pdf (2014); Recycling Works Massachusetts available at http://www.recyclingworksma.com/food-waste-estimation-guide/#Jump04 (all accessed on October 17, 2017);
Recycling Works Massachusetts, “Food Waste Estimation Guide,” available at http://recyclingworksma.com/food-waste-estimation-guide (accessed on October 17, 2017).
3 SCDOC (2015); DECVT (2014a); DECVT (2014b); Recycling Works Massachusetts.
4 Recycling Works Massachusetts, “Food Waste Estimation Guide,” available at http://recyclingworksma.com/food-waste-estimation-guide (accessed on October 17, 2017).
5 Food Waste Reduction Alliance (FWRA), “Analysis of U.S. Food Waste Among Food Manufacturers, Retailers, and Wholesalers,” available at http://www.foodwastealliance.org/wp-content/uploads/2014/11/FWRA_BSR_Tier3_FINAL.pdf (2014) (accessed on October 17, 2017).
6 SCDOC (2015); DECVT (2014a); DECVT (2014b); and Recycling Works Massachusetts.
7 FWRA (2014).
8 SCDOC (2015); DECVT (2014a); DECVT (2014b); Recycling Works Massachusetts.
9 SCDOC (2015); Recycling Works Massachusetts.
10 SCDOC (2015); Recycling Works Massachusetts.
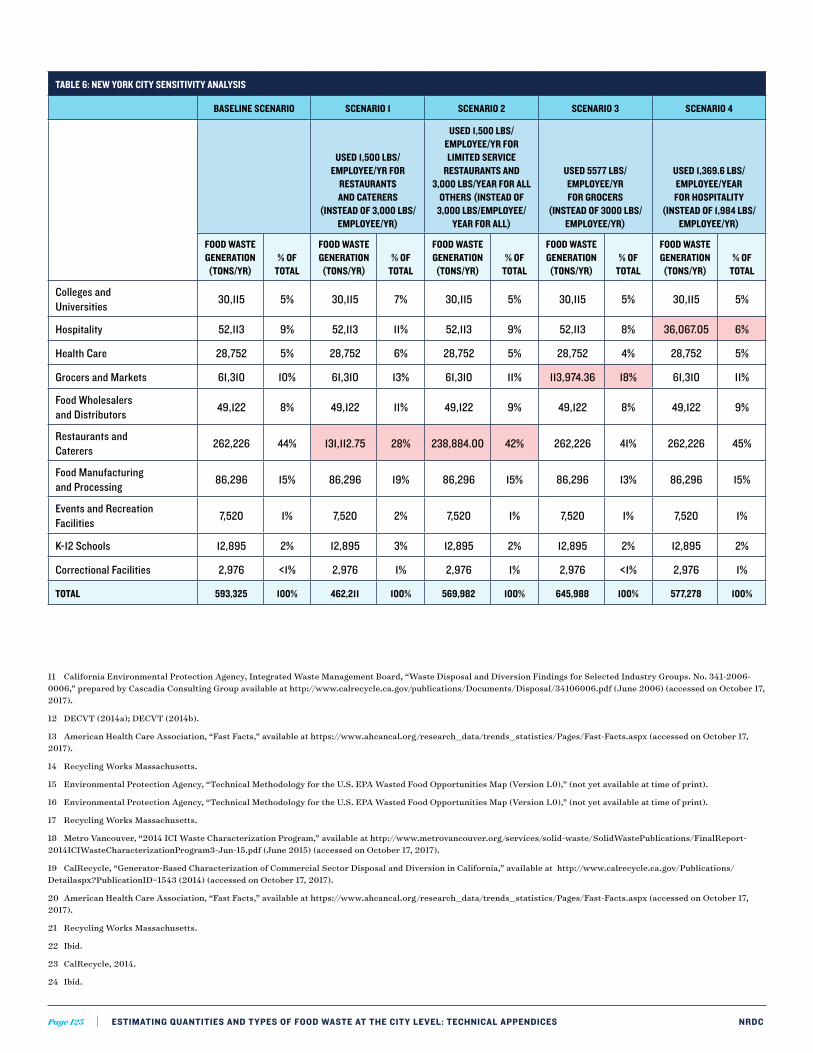
Page 124 ESTIMATING QUANTITIES AND TYPES OF FOOD WASTE AT THE CITY LEVEL: TECHNICAL APPENDICES NRDC Page 125 ESTIMATING QUANTITIES AND TYPES OF FOOD WASTE AT THE CITY LEVEL: TECHNICAL APPENDICES NRDC
TABLE 6: NEW YORK CITY SENSITIVITY ANALYSIS
BASELINE SCENARIO SCENARIO 1 SCENARIO 2 SCENARIO 3 SCENARIO 4
USED 1,500 LBS/EMPLOYEE/YR FOR
RESTAURANTS AND CATERERS
(INSTEAD OF 3,000 LBS/EMPLOYEE/YR)
USED 1,500 LBS/EMPLOYEE/YR FOR LIMITED SERVICE
RESTAURANTS AND 3,000 LBS/YEAR FOR ALL
OTHERS (INSTEAD OF 3,000 LBS/EMPLOYEE/
YEAR FOR ALL)
USED 5577 LBS/EMPLOYEE/YR FOR GROCERS
(INSTEAD OF 3000 LBS/EMPLOYEE/YR)
USED 1,369.6 LBS/EMPLOYEE/YEAR FOR HOSPITALITY
(INSTEAD OF 1,984 LBS/EMPLOYEE/YR)
FOOD WASTE GENERATION (TONS/YR)
% OF TOTAL
FOOD WASTE GENERATION (TONS/YR)
% OF TOTAL
FOOD WASTE GENERATION (TONS/YR)
% OF TOTAL
FOOD WASTE GENERATION (TONS/YR)
% OF TOTAL
FOOD WASTE GENERATION (TONS/YR)
% OF TOTAL
Colleges and Universities 30,115 5% 30,115 7% 30,115 5% 30,115 5% 30,115 5%
Hospitality 52,113 9% 52,113 11% 52,113 9% 52,113 8% 36,067.05 6%
Health Care 28,752 5% 28,752 6% 28,752 5% 28,752 4% 28,752 5%
Grocers and Markets 61,310 10% 61,310 13% 61,310 11% 113,974.36 18% 61,310 11%
Food Wholesalers and Distributors 49,122 8% 49,122 11% 49,122 9% 49,122 8% 49,122 9%
Restaurants and Caterers 262,226 44% 131,112.75 28% 238,884.00 42% 262,226 41% 262,226 45%
Food Manufacturing and Processing 86,296 15% 86,296 19% 86,296 15% 86,296 13% 86,296 15%
Events and Recreation Facilities 7,520 1% 7,520 2% 7,520 1% 7,520 1% 7,520 1%
K-12 Schools 12,895 2% 12,895 3% 12,895 2% 12,895 2% 12,895 2%
Correctional Facilities 2,976 <1% 2,976 1% 2,976 1% 2,976 <1% 2,976 1%
TOTAL 593,325 100% 462,211 100% 569,982 100% 645,988 100% 577,278 100%
11 California Environmental Protection Agency, Integrated Waste Management Board, “Waste Disposal and Diversion Findings for Selected Industry Groups. No. 341-2006-0006,” prepared by Cascadia Consulting Group available at http://www.calrecycle.ca.gov/publications/Documents/Disposal/34106006.pdf (June 2006) (accessed on October 17, 2017).
12 DECVT (2014a); DECVT (2014b).
13 American Health Care Association, “Fast Facts,” available at https://www.ahcancal.org/research_data/trends_statistics/Pages/Fast-Facts.aspx (accessed on October 17, 2017).
14 Recycling Works Massachusetts.
15 Environmental Protection Agency, “Technical Methodology for the U.S. EPA Wasted Food Opportunities Map (Version 1.0),” (not yet available at time of print).
16 Environmental Protection Agency, “Technical Methodology for the U.S. EPA Wasted Food Opportunities Map (Version 1.0),” (not yet available at time of print).
17 Recycling Works Massachusetts.
18 Metro Vancouver, “2014 ICI Waste Characterization Program,” available at http://www.metrovancouver.org/services/solid-waste/SolidWastePublications/FinalReport-2014ICIWasteCharacterizationProgram3-Jun-15.pdf (June 2015) (accessed on October 17, 2017).
19 CalRecycle, “Generator-Based Characterization of Commercial Sector Disposal and Diversion in California,” available at http://www.calrecycle.ca.gov/Publications/Detailaspx?PublicationID=1543 (2014) (accessed on October 17, 2017).
20 American Health Care Association, “Fast Facts,” available at https://www.ahcancal.org/research_data/trends_statistics/Pages/Fast-Facts.aspx (accessed on October 17, 2017).
21 Recycling Works Massachusetts.
22 Ibid.
23 CalRecycle, 2014.
24 Ibid.

Page 126 ESTIMATING QUANTITIES AND TYPES OF FOOD WASTE AT THE CITY LEVEL: TECHNICAL APPENDICES NRDC
Appendix M: Sample Individual Facility ICI Report
Note: this is a sample of the customized reports sent to ICI facilities in NYC that participated in bin digs. Similar reports customized with city-specific information were sent to participating facilities in Denver and Nashville.
NATURAL RESOURCES DEFENSE COUNCIL FOOD WASTE ASSESSMENT STUDY RESULTS
Sample Business - January 2017 The Natural Resources Defense Council (NRDC) recently collected, sorted, and categorized a sample of waste material from dozens of businesses and institutions in New York City. This information will be used to help set a baseline for how much and what types of food are wasted in NYC.
Below are general recommendations for reducing the amount of food in your waste stream as well as information on organizations and resources in NYC that might be useful to your facility. Page Two of this document provides details on what types of food and non-food materials were found in your waste stream during our audit. Page Three provides individualized recommendations based on the findings from your facility.
GENERAL RECOMMENDATIONSReducing the amount of food in your waste stream can help save money as well as reduce your ecological impact. Here are some easy steps you can take to minimize wasted food in your operations:
• Prevent food waste: Preventing food waste in the first place is the best way to save your business money while benefiting the environment. Measuring wasted food will empower your staff to better manage this issue. For more information, see the Environmental Protection Agency’s Tools for Assessing Wasted Food (www.epa.gov/sustainable-management-food) and Leanpath (www.leanpath.com) for software to track the amounts, causes and costs of wasted food in institutional foodservice and restaurant environments. Educating your customers and staff can also help reduce food waste.
• Donate food surpluses: Donating food can yield valuable tax benefits, is protected from liability by federal law, and is a way your business can help address food insecurity in NYC. Organizations that receive or help direct donated food in NYC include City Harvest (www.cityharvest.org), Rock and Wrap it Up (www.rockandwrapitup.org), and Rescuing Leftover Cuisine (www.rescuingleftovercuisine.org/). You can also check out the City of New York directory to find food pantries (www1.nyc.gov/apps/311utils/providerInformation.htm?serviceId=1083).
• Recycle food scraps: After maximizing waste prevention and food donation, you can help keep food waste out of the landfill by sending it to a composter or anaerobic digester. As of July 19, 2016, certain New York City businesses are required by law to separate their organic waste (see the DSNY website for more information: www1.nyc.gov/assets/dsny/zerowaste/businesses/food-scraps-and-yard-waste.shtml). Businesses covered by this law are given the option to arrange for collection by a private carter, transport organic waste themselves, or process the material on site (e.g. through composting or anaerobic digestion). Businesses both covered by and exempt from the organics separation requirement may find this resource sheet useful (www1.nyc.gov/assets/dsny/docs/commercial-organics-notice-english.pdf).
• For more information on the environmental impacts associated with food waste, please see NRDC’s food waste resources (www.nrdc.org/issues/food-waste). NRDC welcomes your participation in the national Save The Food public service campaign. See www.savethefood.com for more information.
Every citizen and business in NYC, as well as municipal government, can help reduce food waste. Please contact NRDC for more information or to learn more about reducing food waste in NYC.

Page 126 ESTIMATING QUANTITIES AND TYPES OF FOOD WASTE AT THE CITY LEVEL: TECHNICAL APPENDICES NRDC Page 127 ESTIMATING QUANTITIES AND TYPES OF FOOD WASTE AT THE CITY LEVEL: TECHNICAL APPENDICES NRDC
Natural Resources Defense Council Food Waste Assessment Study Results
Sample Business NameNew York CityJanuary 2017
Material Categories Examples
Inedible Food
Edible Food
Other Compostable Materials
Recyclable Materials
Other Materials
Food-soiled paper, pizza boxes, paper cups, paper towels/napkins, grass, leaves, branches, yard trimmings
Paper, cardboard, metal containers, glass containers, rigid plastic containers
All other materials such as non-container glass, plastic bags, plastic wrap, polystyrene foam, hygiene products, clothing, electronics
What is in your trash?
Edible Food: 19%; Inedible Food: 1%; Other Compostable Materials: 6%; Paper & Paperboard: 46%; Metals: 2%; Glass Containers: 4%; Rigid Plastic Containers: 8%; Other Materials: 14%
What types of food waste are in your trash?
Cooked or Prepared Food & Leftovers: 17%; Liquids, Oils, & Grease: 65%; Snacks & Condiments: 5%; Dry Foods: 0%; Baked Goods: 1%; Vegetables & Fruits: 1%; Dairy & Eggs: 1%; Meat & Fish: 5%; Inedible: 5%
Inedible peels (banana, citrus, melon, winter squash), apple cores, pits, shells, bones, husks, animal fat and tendons
Meat, fish, dairy, eggs, vegetables, fruits, baked goods, dry goods, grains, pastas, cereals, snacks, condiments, canned goods, candy, snacks, drinks, water, oil, fats, cooked meals
56%
6%
12%
10%
1%
3% 4% 8%
45%
2% 11%
3%
22%
0% 8% 9% Cooked or Prepared Food & Leftovers
Liquids, Oils, & Grease
Snacks & Condiments Dry Foods (Grains, Pasta, and Cereals)
Baked Goods Vegetables & Fruits
Dairy & Eggs Meat & Fish
Inedible
Other Materials
Other Compostable Materials
Edible Food
Inedible Food
Glass Containers
Metals
Rigid Plastic Containers
Paper & Cardboard
Edible Food: 56%; Inedible Food: 6%; Other Compostable Materials: 12%; Paper & Cardboard: 10%; Metals: 1%; Glass Containers: 3%; Rigid Plastic Containers: 4%; Other Materials: 8%
Cooked or Prepared Food & Leftovers: 45%; Liquids, Oils, & Grease: 2%; Snacks & Condiments: 11%; Dry Foods: 0%; Baked Goods: 3%; Vegetables & Fruits: 22%; Dairy & Eggs: 0%; Meat & Fish: 8%; Inedible: 9%

Page 128 ESTIMATING QUANTITIES AND TYPES OF FOOD WASTE AT THE CITY LEVEL: TECHNICAL APPENDICES NRDC
A sample of your trash (up to 220 lbs) was sorted and categorized into 9 food waste categories and 6 other materials categories. Results can be found on the previous page. Below are individualized suggestions for reducing your waste.
The individual results provided in this report will not be shared with anyone other than your organization. Any results reported by NRDC will be reported in aggregate and your facility participation will be kept confidential.
Individualized Recommendations
Notable Findings• 146 lbs of waste material were taken from the trash bin (not recycling) of your facility.
• 74% of the material in your trash is compostable, with a majority being edible food.
• Of the food found in your trash, 91% was considered edible.
• 45% of discarded food was cooked or prepared foods (see pictures below)
• 22% was fruits and vegetables
• 11% was snacks and condiments
Potential Strategies to Reduce Wasted Food• Since a majority of your wasted food was edible prior to disposal and seems to originate from the back-of-the-house, here
are some potential ways to reduce your edible wasted food:
• Donate surplus food to local food rescue organizations;
• Create secondary uses for food (e.g. make old bread into bread crumbs, French toast, or crispy bread garnish); or
• Perform a quick assessment to understand which types of food are most frequently wasted (and reduce purchase of those items).
• A fair amount of wasted food was from condiments in single-serving packets. Providing bulk condiments could reduce both food and packaging waste.
• Since a majority of your facility’s waste is compostable (including food and food-soiled paper), this facility could significantly reduce landfilled material through composting, either on-site (e.g. in-vessel composting system) or using a hauler.
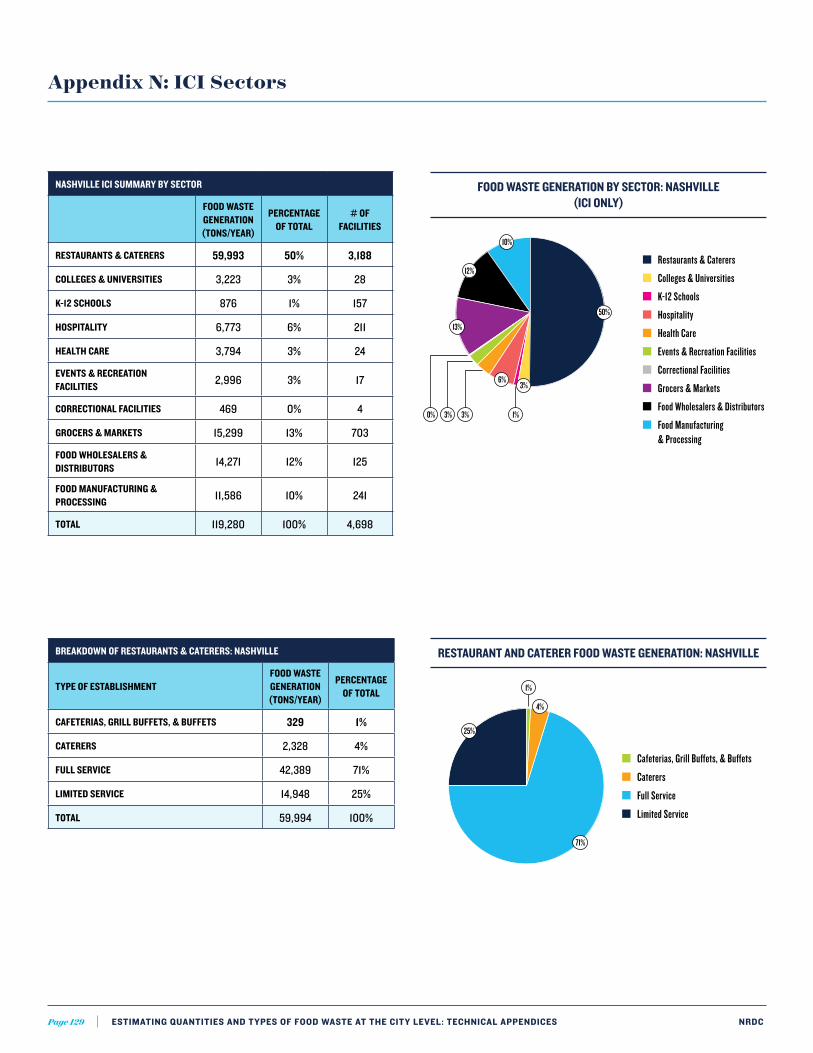
Page 128 ESTIMATING QUANTITIES AND TYPES OF FOOD WASTE AT THE CITY LEVEL: TECHNICAL APPENDICES NRDC Page 129 ESTIMATING QUANTITIES AND TYPES OF FOOD WASTE AT THE CITY LEVEL: TECHNICAL APPENDICES NRDC
Appendix N: ICI Sectors
NASHVILLE ICI SUMMARY BY SECTOR
FOOD WASTE GENERATION (TONS/YEAR)
PERCENTAGE OF TOTAL
# OF FACILITIES
RESTAURANTS & CATERERS 59,993 50% 3,188
COLLEGES & UNIVERSITIES 3,223 3% 28
K-12 SCHOOLS 876 1% 157
HOSPITALITY 6,773 6% 211
HEALTH CARE 3,794 3% 24
EVENTS & RECREATION FACILITIES 2,996 3% 17
CORRECTIONAL FACILITIES 469 0% 4
GROCERS & MARKETS 15,299 13% 703
FOOD WHOLESALERS & DISTRIBUTORS 14,271 12% 125
FOOD MANUFACTURING & PROCESSING 11,586 10% 241
TOTAL 119,280 100% 4,698
BREAKDOWN OF RESTAURANTS & CATERERS: NASHVILLE
TYPE OF ESTABLISHMENTFOOD WASTE GENERATION (TONS/YEAR)
PERCENTAGE OF TOTAL
CAFETERIAS, GRILL BUFFETS, & BUFFETS 329 1%
CATERERS 2,328 4%
FULL SERVICE 42,389 71%
LIMITED SERVICE 14,948 25%
TOTAL 59,994 100%
ESTIMATED FOOD WASTE GENERATED BY SECTOR (INCLUDING RESIDENTIAL SECTOR)
N A S H V I L L E D E N V E R N E W YO R K C I T Y■ Residential
■ Restaurants & Caterers
■ Colleges & Universities
■ K-12 Schools
■ Hospitality
■ Health Care
■ Events & Recreation Facilities
■ Correctional Facilities
■ Grocers & Markets
■ Food Wholesalers & Distributors
■ Food Manufacturing & Processing
54%41%
7%9%
33%
7%8%
9%
34%
9%
6%
25%
4%5%
4%
20%
0%1%
2%
1%
2%
0%
1%
4%
1%
1%
2%
4%
0%
2%
2%
0%
2%
FOOD WASTE GENERATION BY SECTOR: NASHVILLE (ICI ONLY)
ESTIMATED FOOD WASTE GENERATED BY SECTOR (INCLUDING RESIDENTIAL SECTOR)
N A S H V I L L E D E N V E R N E W YO R K C I T Y■ Restaurants & Caterers
■ Colleges & Universities
■ K-12 Schools
■ Hospitality
■ Health Care
■ Events & Recreation Facilities
■ Correctional Facilities
■ Grocers & Markets
■ Food Wholesalers & Distributors
■ Food Manufacturing & Processing
15%
44%
42%
50%
10%
12%
13%
6%3%
15%
15%
11%
4% 7%3%
8%
10%
5%
9% 5%2%
0% 3% 1% 1%3% 1% 2% 1%1%
■ Cafeterias, Grill Bu�ets, & Bu�ets
■ Caterers
■ Full Service
■ Limited Service
4%
71%
25%
1%
RESTAURANT AND CATERER FOOD WASTE GENERATION: NASHVILLE

Page 130 ESTIMATING QUANTITIES AND TYPES OF FOOD WASTE AT THE CITY LEVEL: TECHNICAL APPENDICES NRDC
DENVER ICI SUMMARY BY SECTOR
FOOD WASTE GENERATION (TONS/YEAR)
PERCENTAGE OF TOTAL
# OF FACILITIES
RESTAURANTS & CATERERS 45,158 42% 1,759
COLLEGES & UNIVERSITIES 2,736 3% 15
K-12 SCHOOLS 1,296 1% 240
HOSPITALITY 7,675 7% 144
HEALTH CARE 2,683 2% 61
EVENTS & RECREATION FACILITIES 4,197 4% 17
CORRECTIONAL FACILITIES 568 1% 4
GROCERS & MARKETS 11,480 11% 188
FOOD WHOLESALERS & DISTRIBUTORS 16,757 15% 105
FOOD MANUFACTURING & PROCESSING 15,980 15% 32
TOTAL 108,530 100% 2,565
BREAKDOWN OF RESTAURANTS & CATERERS: DENVER
TYPE OF ESTABLISHMENTFOOD WASTE GENERATION (TONS/YEAR)
PERCENTAGE OF TOTAL
CAFETERIAS, GRILL BUFFETS, & BUFFETS 57 0%
CATERERS 1,493 3%
FULL-SERVICE RESTAURANTS 35,102 78%
LIMITED-SERVICE RESTAURANTS 8,507 19%
TOTAL 45,159 100%
ESTIMATED FOOD WASTE GENERATED BY SECTOR (INCLUDING RESIDENTIAL SECTOR)
N A S H V I L L E D E N V E R N E W YO R K C I T Y■ Residential
■ Restaurants & Caterers
■ Colleges & Universities
■ K-12 Schools
■ Hospitality
■ Health Care
■ Events & Recreation Facilities
■ Correctional Facilities
■ Grocers & Markets
■ Food Wholesalers & Distributors
■ Food Manufacturing & Processing
54%41%
7%9%
33%
7%8%
9%
34%
9%
6%
25%
4%5%
4%
20%
0%1%
2%
1%
2%
0%
1%
4%
1%
1%
2%
4%
0%
2%
2%
0%
2%
FOOD WASTE GENERATION BY SECTOR: DENVER (ICI ONLY)
RESTAURANT AND CATERER FOOD WASTE GENERATION: DENVER
ESTIMATED FOOD WASTE GENERATED BY SECTOR (INCLUDING RESIDENTIAL SECTOR)
N A S H V I L L E D E N V E R N E W YO R K C I T Y■ Restaurants & Caterers
■ Colleges & Universities
■ K-12 Schools
■ Hospitality
■ Health Care
■ Events & Recreation Facilities
■ Correctional Facilities
■ Grocers & Markets
■ Food Wholesalers & Distributors
■ Food Manufacturing & Processing
15%
44%
42%
50%
10%
12%
13%
6%3%
15%
15%
11%
4% 7%3%
8%
10%
5%
9% 5%2%
0% 3% 1% 1%3% 1% 2% 1%1%
■ Cafeterias, Grill Bu�ets, & Bu�ets
■ Caterers
■ Full Service
■ Limited Service
3%
78%
19%

Page 130 ESTIMATING QUANTITIES AND TYPES OF FOOD WASTE AT THE CITY LEVEL: TECHNICAL APPENDICES NRDC Page 131 ESTIMATING QUANTITIES AND TYPES OF FOOD WASTE AT THE CITY LEVEL: TECHNICAL APPENDICES NRDC
NYC ICI SUMMARY BY SECTOR
FOOD WASTE GENERATION (TONS/YEAR)
PERCENTAGE OF TOTAL
# OF FACILITIES
RESTAURANTS & CATERERS 262,226 44% 18,300
COLLEGES & UNIVERSITIES 30,115 5% 138
K-12 SCHOOLS 12,895 2% 2,100
HOSPITALITY 52,113 9% 752
HEALTH CARE 28,752 5% 216
EVENTS & RECREATION FACILITIES 7,520 1% 19
CORRECTIONAL FACILITIES 2,976 1% 11
GROCERS & MARKETS 61,310 10% 4,451
FOOD WHOLESALERS & DISTRIBUTORS 49,122 8% 577
FOOD MANUFACTURING & PROCESSING 86,296 15% 213
TOTAL 593,325 100% 26,777
BREAKDOWN OF RESTAURANTS & CATERERS: NYC
TYPE OF ESTABLISHMENTFOOD WASTE GENERATION (TONS/YEAR)
PERCENTAGE OF TOTAL
CAFETERIAS, GRILL BUFFETS, & BUFFETS 2,785 1%
CATERERS 7,392 3%
FULL-SERVICE RESTAURANTS 205,372 78%
LIMITED-SERVICE RESTAURANTS 46,677 18%
TOTAL 262,226 100%
ESTIMATED FOOD WASTE GENERATED BY SECTOR (INCLUDING RESIDENTIAL SECTOR)
N A S H V I L L E D E N V E R N E W YO R K C I T Y■ Residential
■ Restaurants & Caterers
■ Colleges & Universities
■ K-12 Schools
■ Hospitality
■ Health Care
■ Events & Recreation Facilities
■ Correctional Facilities
■ Grocers & Markets
■ Food Wholesalers & Distributors
■ Food Manufacturing & Processing
54%41%
7%9%
33%
7%8%
9%
34%
9%
6%
25%
4%5%
4%
20%
0%1%
2%
1%
2%
0%
1%
4%
1%
1%
2%
4%
0%
2%
2%
0%
2%
RESTAURANT AND CATERER FOOD WASTE GENERATION: NYC
FOOD WASTE GENERATION BY SECTOR: NYC (ICI ONLY)
ESTIMATED FOOD WASTE GENERATED BY SECTOR (INCLUDING RESIDENTIAL SECTOR)
N A S H V I L L E D E N V E R N E W YO R K C I T Y■ Restaurants & Caterers
■ Colleges & Universities
■ K-12 Schools
■ Hospitality
■ Health Care
■ Events & Recreation Facilities
■ Correctional Facilities
■ Grocers & Markets
■ Food Wholesalers & Distributors
■ Food Manufacturing & Processing
15%
44%
42%
50%
10%
12%
13%
6%3%
15%
15%
11%
4% 7%3%
8%
10%
5%
9% 5%2%
0% 3% 1% 1%3% 1% 2% 1%1%
■ Cafeterias, Grill Bu�ets, & Bu�ets
■ Caterers
■ Full Service
■ Limited Service
3%
78%
18%
1%
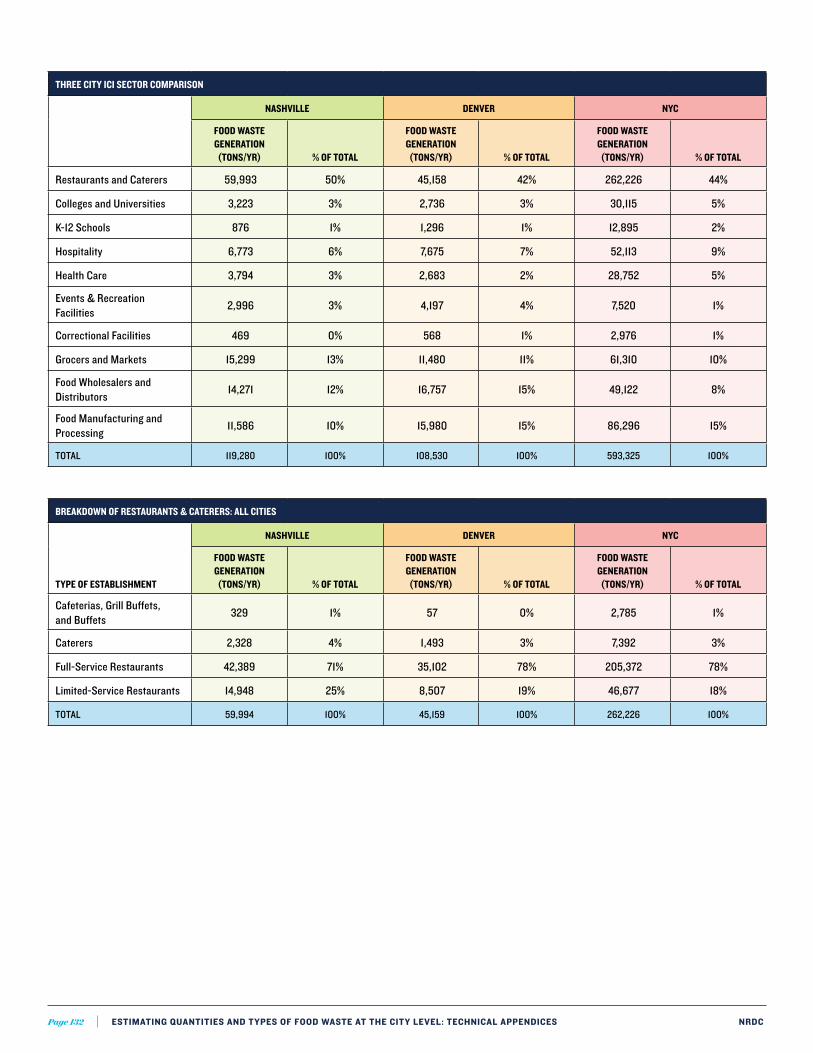
Page 132 ESTIMATING QUANTITIES AND TYPES OF FOOD WASTE AT THE CITY LEVEL: TECHNICAL APPENDICES NRDC
THREE CITY ICI SECTOR COMPARISON
NASHVILLE DENVER NYC
FOOD WASTE GENERATION (TONS/YR) % OF TOTAL
FOOD WASTE GENERATION (TONS/YR) % OF TOTAL
FOOD WASTE GENERATION (TONS/YR) % OF TOTAL
Restaurants and Caterers 59,993 50% 45,158 42% 262,226 44%
Colleges and Universities 3,223 3% 2,736 3% 30,115 5%
K-12 Schools 876 1% 1,296 1% 12,895 2%
Hospitality 6,773 6% 7,675 7% 52,113 9%
Health Care 3,794 3% 2,683 2% 28,752 5%
Events & Recreation Facilities 2,996 3% 4,197 4% 7,520 1%
Correctional Facilities 469 0% 568 1% 2,976 1%
Grocers and Markets 15,299 13% 11,480 11% 61,310 10%
Food Wholesalers and Distributors 14,271 12% 16,757 15% 49,122 8%
Food Manufacturing and Processing 11,586 10% 15,980 15% 86,296 15%
TOTAL 119,280 100% 108,530 100% 593,325 100%
BREAKDOWN OF RESTAURANTS & CATERERS: ALL CITIES
TYPE OF ESTABLISHMENT
NASHVILLE DENVER NYC
FOOD WASTE GENERATION (TONS/YR) % OF TOTAL
FOOD WASTE GENERATION (TONS/YR) % OF TOTAL
FOOD WASTE GENERATION (TONS/YR) % OF TOTAL
Cafeterias, Grill Buffets, and Buffets 329 1% 57 0% 2,785 1%
Caterers 2,328 4% 1,493 3% 7,392 3%
Full-Service Restaurants 42,389 71% 35,102 78% 205,372 78%
Limited-Service Restaurants 14,948 25% 8,507 19% 46,677 18%
TOTAL 59,994 100% 45,159 100% 262,226 100%

Page 132 ESTIMATING QUANTITIES AND TYPES OF FOOD WASTE AT THE CITY LEVEL: TECHNICAL APPENDICES NRDC Page 133 ESTIMATING QUANTITIES AND TYPES OF FOOD WASTE AT THE CITY LEVEL: TECHNICAL APPENDICES NRDC
Appendix O: ICI and Residential Combined
NASHVILLE ICI SECTOR FOOD WASTE GENERATION SUMMARY
FOOD WASTE GENERATION (TONS/YEAR)
PERCENTAGE OF TOTAL
# OF FACILITIES
COLLEGES & UNIVERSITIES 3,223 3% 28
HOSPITALITY 6,773 6% 211
HEALTH CARE 3,794 3% 24
GROCERS & MARKETS 15,299 13% 703
FOOD WHOLESALERS & DISTRIBUTORS 14,271 12% 125
RESTAURANTS & CATERERS 59,993 50% 3,188
FOOD MANUFACTURING & PROCESSING 11,586 10% 241
EVENTS & RECREATION FACILITIES 2,996 3% 17
K-12 SCHOOLS 876 1% 157
CORRECTIONAL FACILITIES 469 0% 4
TOTAL 119,280 100% 4,698
NASHVILLE RESIDENTIAL FOOD WASTE GENERATION SUMMARY
NASHVILLE POPULATION (2016) 660,388
CORRECTED FOOD WASTE GENERATION PER CAPITA (LBS/PERSON/WEEK)—FROM KITCHEN DIARIES 3.4
ESTIMATED RESIDENTIAL FOOD WASTE GENERATION (TONS/YEAR) 58,378
NASHVILLE ICI AND RESIDENTIAL FOOD WASTE GENERATION SUMMARY
FOOD WASTE GENERATION (TONS/YR)
%
RESIDENTIAL 58,378 33%
RESTAURANTS & CATERERS 59,993 34%
COLLEGES & UNIVERSITIES 3,223 2%
K-12 SCHOOLS 876 0%
HOSPITALITY 6,773 4%
HEALTH CARE 3,794 2%
EVENTS & RECREATION FACILITIES 2,996 2%
CORRECTIONAL FACILITIES 469 0%
GROCERS & MARKETS 15,299 9%
FOOD WHOLESALERS & DISTRIBUTORS 14,271 8%
FOOD MANUFACTURING & PROCESSING 11,586 7%
TOTAL 177,658 100%
ESTIMATED FOOD WASTE GENERATED BY SECTOR (INCLUDING RESIDENTIAL SECTOR)
N A S H V I L L E D E N V E R N E W YO R K C I T Y■ Residential
■ Restaurants & Caterers
■ Colleges & Universities
■ K-12 Schools
■ Hospitality
■ Health Care
■ Events & Recreation Facilities
■ Correctional Facilities
■ Grocers & Markets
■ Food Wholesalers & Distributors
■ Food Manufacturing & Processing
54%41%
7%9%
33%
7%8%
9%
34%
9%
6%
25%
4%5%
4%
20%
0%1%
2%
1%
2%
0%
1%
4%
1%
1%
2%
4%
0%
2%
2%
0%
2%
FOOD WASTE GENERATION BY SECTOR: NASHVILLE (ICI AND RESIDENTIAL)

Page 134 ESTIMATING QUANTITIES AND TYPES OF FOOD WASTE AT THE CITY LEVEL: TECHNICAL APPENDICES NRDC
DENVER ICI SECTOR FOOD WASTE GENERATION SUMMARY
FOOD WASTE GENERATION (TONS/YEAR)
PERCENTAGE OF TOTAL
# OF FACILITIES
COLLEGES & UNIVERSITIES 2,736 3% 15
HOSPITALITY 7,675 7% 144
HEALTH CARE 2,683 2% 61
GROCERS & MARKETS 11,480 11% 188
FOOD WHOLESALERS & DISTRIBUTORS 16,757 15% 105
RESTAURANTS & CATERERS 45,158 42% 1,759
FOOD MANUFACTURING & PROCESSING 15,980 15% 32
EVENTS & RECREATION FACILITIES 4,197 4% 17
K-12 SCHOOLS 1,296 1% 240
CORRECTIONAL FACILITIES 568 1% 4
TOTAL 108,530 100% 2,565
DENVER RESIDENTIAL FOOD WASTE GENERATION SUMMARY
DENVER POPULATION (2016) 693,060
CORRECTED FOOD WASTE GENERATION PER CAPITA (LBS/PERSON/WEEK)—FROM KITCHEN DIARIES 4.2
ESTIMATED RESIDENTIAL FOOD WASTE GENERATION (TONS/YEAR) 75,682
DENVER ICI AND RESIDENTIAL FOOD WASTE GENERATION SUMMARY
FOOD WASTE GENERATION (TONS/
YEAR)%
RESIDENTIAL 75,682 41%
RESTAURANTS & CATERERS 45,158 25%
COLLEGES & UNIVERSITIES 2,736 1%
K-12 SCHOOLS 1,296 1%
HOSPITALITY 7,675 4%
HEALTH CARE 2,683 1%
EVENTS & RECREATION FACILITIES 4,197 2%
CORRECTIONAL FACILITIES 568 0%
GROCERS & MARKETS 11,480 6%
FOOD WHOLESALERS & DISTRIBUTORS 16,757 9%
FOOD MANUFACTURING & PROCESSING 15,980 9%
TOTAL 184,212 100%
ESTIMATED FOOD WASTE GENERATED BY SECTOR (INCLUDING RESIDENTIAL SECTOR)
N A S H V I L L E D E N V E R N E W YO R K C I T Y■ Residential
■ Restaurants & Caterers
■ Colleges & Universities
■ K-12 Schools
■ Hospitality
■ Health Care
■ Events & Recreation Facilities
■ Correctional Facilities
■ Grocers & Markets
■ Food Wholesalers & Distributors
■ Food Manufacturing & Processing
54%41%
7%9%
33%
7%8%
9%
34%
9%
6%
25%
4%5%
4%
20%
0%1%
2%
1%
2%
0%
1%
4%
1%
1%
2%
4%
0%
2%
2%
0%
2%
FOOD WASTE GENERATION BY SECTOR: DENVER (ICI AND RESIDENTIAL)

Page 134 ESTIMATING QUANTITIES AND TYPES OF FOOD WASTE AT THE CITY LEVEL: TECHNICAL APPENDICES NRDC Page 135 ESTIMATING QUANTITIES AND TYPES OF FOOD WASTE AT THE CITY LEVEL: TECHNICAL APPENDICES NRDC
NYC ICI SECTOR FOOD WASTE GENERATION SUMMARY
FOOD WASTE GENERATION (TONS/YEAR)
PERCENTAGE OF TOTAL
# OF FACILITIES
COLLEGES & UNIVERSITIES 30,115 5% 138
HOSPITALITY 52,113 9% 752
HEALTH CARE 28,752 5% 216
GROCERS & MARKETS 61,310 10% 4,451
FOOD WHOLESALERS & DISTRIBUTORS 49,122 8% 577
RESTAURANTS & CATERERS 262,226 44% 18,300
FOOD MANUFACTURING & PROCESSING 86,296 15% 213
EVENTS & RECREATION FACILITIES 7,520 1% 19
K-12 SCHOOLS 12,895 2% 2,100
CORRECTIONAL FACILITIES 2,976 1% 11
TOTAL 593,325 100% 26,777
NYC RESIDENTIAL FOOD WASTE GENERATION SUMMARY
NYC POPULATION (2016) 8,537,673
CORRECTED FOOD WASTE GENERATION PER CAPITA (LBS/PERSON/WEEK)—FROM KITCHEN DIARIES 3.2
ESTIMATED RESIDENTIAL FOOD WASTE GENERATION (TONS/YEAR) 710,334
NYC ICI AND RESIDENTIAL FOOD WASTE GENERATION SUMMARY
FOOD WASTE GENERATION (TONS/
YEAR)%
RESIDENTIAL 710,334 54%
RESTAURANTS & CATERERS 262,226 20%
COLLEGES & UNIVERSITIES 30,115 2%
K-12 SCHOOLS 12,895 1%
HOSPITALITY 52,113 4%
HEALTH CARE 28,752 2%
EVENTS & RECREATION FACILITIES 7,520 1%
CORRECTIONAL FACILITIES 2,976 0%
GROCERS & MARKETS 61,310 5%
FOOD WHOLESALERS & DISTRIBUTORS 49,122 4%
FOOD MANUFACTURING & PROCESSING 86,296 7%
TOTAL 1,303,659 100%
54%
20%
2%1%
4%
1% 0% 5%4%
7%
NewYorkCityFoodWasteGenerationProfile
Residential Restaurants&Caterers
Colleges&Universities K-12Schools
Hospitality HealthCare
Events&RecreationFacilities CorrectionalFacilities
Grocers&Markets FoodWholesalers&Distributors
FoodManufacturing&Processing
ESTIMATED FOOD WASTE GENERATED BY SECTOR (INCLUDING RESIDENTIAL SECTOR)
N A S H V I L L E D E N V E R N E W YO R K C I T Y■ Residential
■ Restaurants & Caterers
■ Colleges & Universities
■ K-12 Schools
■ Hospitality
■ Health Care
■ Events & Recreation Facilities
■ Correctional Facilities
■ Grocers & Markets
■ Food Wholesalers & Distributors
■ Food Manufacturing & Processing
54%41%
7%9%
33%
7%8%
9%
34%
9%
6%
25%
4%5%
4%
20%
0%1%
2%
1%
2%
0%
1%
4%
1%
1%
2%
4%
0%
2%
2%
0%
2%
FOOD WASTE GENERATION BY SECTOR: NYC (ICI AND RESIDENTIAL)

Page 136 ESTIMATING QUANTITIES AND TYPES OF FOOD WASTE AT THE CITY LEVEL: TECHNICAL APPENDICES NRDC
THREE CITY SECTOR COMPARISON - COMBINED ICI AND RESIDENTIAL
NASHVILLE DENVER NYC
FOOD WASTE GENERATION (TONS/YR) % OF TOTAL # OF UNITS
FOOD WASTE GENERATION (TONS/YR) % OF TOTAL # OF UNITS
FOOD WASTE GENERATION (TONS/YR) % OF TOTAL # OF UNITS
Residential 58,378 33% 660,388 75,682 41% 693,060 710,334 54% 8,537,673
Restaurants and Caterers 59,993 34% 3,188 45,158 25% 1,759 262,226 20% 18,300
Colleges and Universities 3,223 2% 28 2,736 1% 15 30,115 2% 138
K-12 Schools 876 0% 157 1,296 1% 240 12,895 1% 2,100
Hospitality 6,773 4% 211 7,675 4% 144 52,113 4% 752
Health Care 3,794 2% 24 2,683 1% 61 28,752 2% 216
Events and Recreation Facilities 2,996 2% 17 4,197 2% 17 7,520 1% 19
Correctional Facilities 469 0% 4 568 0% 4 2,976 0% 11
Grocers and Markets 15,299 9% 703 11,480 6% 188 61,310 5% 4,451
Food Wholesalers and Distributors 14,271 8% 125 16,757 9% 105 49,122 4% 577
Food Manufacturing and Processing 11,586 7% 241 15,980 9% 32 86,296 7% 213
TOTAL 177,658 100% 4,698 (ICI) 184,212 100% 2,565 (ICI) 1,303,659 100% 26,777 (ICI)

Page 136 ESTIMATING QUANTITIES AND TYPES OF FOOD WASTE AT THE CITY LEVEL: TECHNICAL APPENDICES NRDC Page 137 ESTIMATING QUANTITIES AND TYPES OF FOOD WASTE AT THE CITY LEVEL: TECHNICAL APPENDICES NRDC
Appendix P: Templates for Residential Study 1. Guidebook and Kitchen Diary Templates
Participant ID: ____________________________
Natural Resources Defense Council Residential Food Waste Assessment
Kitchen Diary Instructions
Appendix P: Study Templates
1. Guidebook and Kitchen Diary Templates

Page 138 ESTIMATING QUANTITIES AND TYPES OF FOOD WASTE AT THE CITY LEVEL: TECHNICAL APPENDICES NRDC
2
Thank you for participating in this important research that will examine wasted food in [city]. This study is being conducted by researchers with the Natural Resources Defense Council. The purpose of this research study is to understand and measure how much and what types of food are wasted in [city] households. The following Quick Start Guide provides you with the basic information on how to participate in the study. For more detailed information, please consult the Guidebook. If you have any questions or concerns about the research or how to complete the surveys or kitchen diary, please contact participant support at [phone or text] or [email]. Over the next two weeks, please complete the following:
• Go to [link] to fill out the second, shorter survey by [date]. It should take no more than 5-15 minutes to answer the questions about your household’s waste and food related activities, as well as your experience participating in this study.
• At the beginning of the survey, you will be requested to put in your four-digit Participant ID, which can be found on the bottom of this page.
• Please contact participant support at [phone or text] or [email] if you would rather not complete the survey online to make alternate arrangements.
• IMPORTANT: In order to receive your $50 gift card, you must complete the survey (as well as the previous survey and the kitchen diary) and either mail or scan your completed kitchen diary. To mail your kitchen diary, use the provided postage-paid envelope (only include the kitchen diary, not other materials). To email your kitchen diary, scan the completed diary and email to [email]. After receipt of the kitchen diary, your gift card will be sent to you. If you cannot receive emails, contact participant support to coordinate.
Quick Start Guide
First Online Survey……………………………………..More info on page 3 of the Guidebook
• Go to [link] to fill out the first survey BEFORE you start the kitchen diary. It should take no more than10-15 minutes to answer the questions about your household’s waste and food related activities.
• At the beginning of the survey, you will be requested to put in your four-digit Participant ID, which can be found at the bottom of this page.
• Please contact participant support at [phone or text] or [email] if you cannot complete the survey online to make alternate arrangements.
Kitchen Diary…………………………………..…….More info on pages 3-7 of the Guidebook • Start your kitchen diary in the morning of [date] and finish it in the evening of [date] (please capture all food
discarded on the start and finish days as well as the days in between). • Provide information on ALL food and drink that is discarded (not eaten) by all people in your household for
one week using the provided kitchen diary sheets. This includes inedible food and drink, such as banana peels, eggshells, and coffee grounds.
• Each day, write down the basic information about what food was discarded outside of the household (e.g. at work or at a restaurant) in the Daily Comments section.
• Include information on food, inedible food parts (e.g. bones, peels), and beverages disposed of in any way (e.g. garbage, down the drain, composted, fed to animals).
Second Online Survey..………………..……………More info on page 8 of the Guidebook
Participant ID: ____________________________
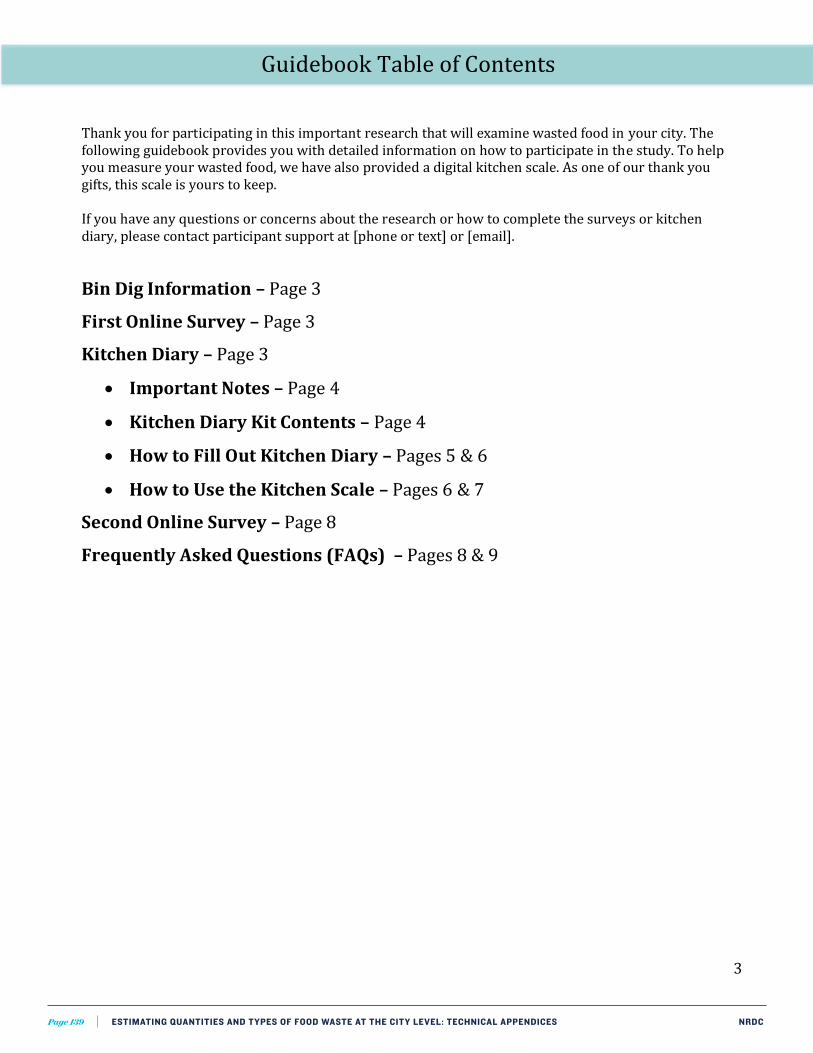
Page 138 ESTIMATING QUANTITIES AND TYPES OF FOOD WASTE AT THE CITY LEVEL: TECHNICAL APPENDICES NRDC Page 139 ESTIMATING QUANTITIES AND TYPES OF FOOD WASTE AT THE CITY LEVEL: TECHNICAL APPENDICES NRDC
3
Thank you for participating in this important research that will examine wasted food in your city. The following guidebook provides you with detailed information on how to participate in the study. To help you measure your wasted food, we have also provided a digital kitchen scale. As one of our thank you gifts, this scale is yours to keep. If you have any questions or concerns about the research or how to complete the surveys or kitchen diary, please contact participant support at [phone or text] or [email].
Bin Dig Information – Page 3
First Online Survey – Page 3
Kitchen Diary – Page 3 • Important Notes – Page 4 • Kitchen Diary Kit Contents – Page 4
• How to Fill Out Kitchen Diary – Pages 5 & 6
• How to Use the Kitchen Scale – Pages 6 & 7
Second Online Survey – Page 8 Frequently Asked Questions (FAQs) – Pages 8 & 9
Guidebook Table of Contents

Page 140 ESTIMATING QUANTITIES AND TYPES OF FOOD WASTE AT THE CITY LEVEL: TECHNICAL APPENDICES NRDC
4
Please fill out the first online survey prior to starting the kitchen diary. You can access the online survey at [link]. Please contact participant support at [phone or text] or [email] if you cannot complete the survey online to make alternate arrangements. The survey takes approximately 10-15 minutes and asks you to report your household’s waste and food related activities. You do not have to complete the survey in one sitting. If you feel uncomfortable answering any questions, please feel free to skip those questions. At the beginning of the survey, you will be asked for your four-digit participant ID, which can be found at the bottom of the Quick Start Guide. You must put in this ID to complete the survey.
Thank you for completing the first online survey. Now, it is time to start the kitchen diary. Please record all of the food (including inedible food parts, e.g. banana peels, eggshells, and coffee grounds) and beverages you discard in your household for one week using the kitchen diary templates provided. Additionally, we do not ask that you measure any food/drink discarded outside of your home, but we do ask that you describe it in the Daily Comments section at the bottom of each kitchen diary page. You can help us by filling out the kitchen diary as completely and accurately as possible. To help everyone in your household remember to write down all of the food and drink that gets thrown away during the week, you may want to select one person to take the lead in your household. It is very important that you write down ALL of the food and drink that is thrown away:
• By all the people in your household; • No matter what it is or why it is being discarded (even food that you would not normally eat
such as fruit pits, bones, or vegetable peels); • No matter where you discarded it (in your trash, curbside compost, put down the drain, fed to
pets or animals, or composted in your backyard); • No matter the amount being discarded (nothing is too small to measure); • Do not include food purchased for the main intention of feeding animals.
Your household may be randomly selected to have your trash (and compost, if you are part of the compost collection pilot) sorted and categorized once during the study. You should not change any of your normal disposal habits, whether of food or other materials. If you happen to be in the randomly selected group, we will collect your trash and compost during the week following your kitchen diary completion. Please put out your trash and compost the night before your trash collection day every week. If you happen to be in the randomly selected group, we will collect your trash and compost early in the morning and do the sorting and categorizing at another location. If you have a shared dumpster, please put all of your trash (and compost) in the provided bags during the study period. Your trash will be collected from your communal trash (and compost) bin. First Online Survey
Kitchen Diary
Bin Dig Information

Page 140 ESTIMATING QUANTITIES AND TYPES OF FOOD WASTE AT THE CITY LEVEL: TECHNICAL APPENDICES NRDC Page 141 ESTIMATING QUANTITIES AND TYPES OF FOOD WASTE AT THE CITY LEVEL: TECHNICAL APPENDICES NRDC
5
• Please consult your Quick Start Guide for dates to start and end your kitchen diary. • Don’t change how you usually prepare or discard food/drinks. If you would normally do a
refrigerator or cupboard clean out during the week, do that. • If anything unusual occurs in your weekly food-related activities (like you throw a party or eat
out more than usual), please note that in the daily comments section. • Describe any food/drink discarded in detail and fill out the required boxes in each row of the
kitchen diary. If there are many ingredients, please provide as much detail as possible (for example: one pan of homemade lasagna including two zucchini, ground beef, tomato sauce, and cheese).
• You do not need to include food/drink discarded outside of your household in the rows of the kitchen diary table. However, any food discarded in your household trash or compost should be recorded in the table even if it was not prepared at home (for example: you should record leftovers from restaurants that are later discarded at home).
• Make sure to provide a daily narrative in the Daily Comments section (located at the bottom of each diary page) of any food discarded outside of your household (at work or restaurants) by all household members, including estimates of how much and what was discarded (for example: for lunch I had one tuna sandwich and one large salad, threw away half the sandwich and about 1 cup of the salad).
• Do not leave any day’s pages completely blank. If you did not discard any food/drink at home that day, please check the box that best explains why not at the top of the first kitchen diary page for that day.
• If you run out of room to record information, there are extra pages at the back of your kitchen diary packet.
• It is best to record discarded food/drink as it happens; however, you or other household members may want to set discarded food aside until you can record it in the kitchen diary.
Before you begin, please ensure that you have all the necessary items in your kitchen diary kit: • Kitchen Scale (with batteries) • Kitchen Diary Template and Sheets • Pen
If you have any questions or concerns about the research or how to complete the surveys or kitchen diary, please contact participant support at [phone or text] or [email].
Kitchen Diary: Important Notes
Kitchen Diary Contents

Page 142 ESTIMATING QUANTITIES AND TYPES OF FOOD WASTE AT THE CITY LEVEL: TECHNICAL APPENDICES NRDC
6
It is very important that you fill out the kitchen diary as completely and accurately as possible. For each day of the study, you are provided with two kitchen diary sheets to provide information on the food you discard in the household. If you run out of room, there are extra pages at the end of your kitchen diary packet (make sure to indicate the date if you use those pages). Every time you discard food (including inedible parts) or drink, please provide all of the following information in the diary sheets. Most of the information can be provided by simply checking the appropriate box.
• Time (What time are you recording each item? Indicate AM or PM) • What Are You Discarding? (Please give a detailed description of any food/drink (including
inedible parts) that you discard – for example: Pizza with cheese, tomato sauce, and pepperoni)
• Which Meal Is This Food/Drink Associated With? (Check the box in the column that best describes the meal associated with the discarded food/drink. If food waste is not associated with any meal, please check “Other”.)
o Breakfast o Lunch o Dinner o Snacks
• How Much Does it Weigh? (Using the provided kitchen scale and weighing bins, approximate the weight of the material to the nearest tenth of an ounce [.1 ounces])
o Instructions on using the kitchen scale can be found on page 6 o Remember to tare (set the kitchen scale to zero) before each use
• Was The Food/Drink Weighed in Packaging? o If it is not easy to remove the discarded food/drink from its packaging before weighing
it, then you do not need to remove the food/drink from the packaging. o If the discarded food was in glass, metal, or hard plastic when weighed, estimate the
size of the packaging (dimensions or volume). o If it is easier to place the discarded food/drink in a separate container to weigh it, you
may use a container during weighing. If you use a container, tare it prior to weighing food material. You do not need to indicate that you used a container for weighing in the kitchen diary.
o Do not record lightweight packaging such as plastic wrap or paper packaging in the door diary, as these materials are much lighter than the weight of the food/drink.
• Where Are You Discarding The Food/Drink? Check the box that best describes where you discarded the food/drink; if none of them apply please write in where you discarded the food/drink into the “Other” box.
o Trash o Down the Drain o Fed Pets/Animals o Backyard Compost o Curbside Compost Collection o Compost Drop-Off (e.g. Greenmarket or community garden) o Other (write in)
How to Fill Out the Kitchen Diary

Page 142 ESTIMATING QUANTITIES AND TYPES OF FOOD WASTE AT THE CITY LEVEL: TECHNICAL APPENDICES NRDC Page 143 ESTIMATING QUANTITIES AND TYPES OF FOOD WASTE AT THE CITY LEVEL: TECHNICAL APPENDICES NRDC
7
• What Was The State Of The Food/Drink At The Time Of Discarding? Check the box that best describes the state of the food/drink when discarded. If none of them apply, please write the state of the food/drink in the “Other” box.
o Whole (meaning it was not cut up or cooked – for example: whole onion or carrot) o Prepared, But Not Cooked (meaning the food was chopped or prepared to be cooked, but
was not yet in its final state – for example: raw chopped onions) o Cooked or Leftovers (meaning food was cooked or in the final state before eating – for
example: salads, lasagna, sandwiches) o Inedible Parts (meaning the parts of food that are not edible – for example: bones or
eggshells) • Why Did You Discard The Food? Check the box that best describes why you discarded the
food/drink. If none of them apply, please write the reason in the “Other” box. Only choose one option.
o Past Date on Label o Moldy or Spoiled o Didn’t Taste Good o Left Out Too Long o Improperly Cooked o Too Little to Save o Don’t Want As Leftovers o Inedible Parts
How to Fill Out the Kitchen Diary…continued
How to Use the Kitchen Scale Learning how to use the kitchen scale may seem a little confusing at first, but is simple once you know how to use it. Follow the instructions below when weighing wasted food/drink. • Step 1 (initial setup only): Install the provided batteries into the kitchen scale. • Step 2: Press the Power/Tare button.
• Step 3 (initial setup only): Ensure the unit of measurement is ounces by pressing the “Unit” button until “lb:oz” appears on the screen right above the “amazon basics” logo. The weight in ounces is on the right-hand side of the screen. Only use that number when recording the weight, not the number on the left-hand side.

Page 144 ESTIMATING QUANTITIES AND TYPES OF FOOD WASTE AT THE CITY LEVEL: TECHNICAL APPENDICES NRDC
8
How to Use the Kitchen Scale…continued • Step 4: Press the “Tare” button right before each time you add food/drink to be weighed to ensure
that the scale reads “0.0” prior to weighing food/drink.
o If you are weighing the food/drink in an empty container, you must weigh that container beforehand so the weight can be subtracted from the weight of the food. To make this easy, put the empty container on scale and press “Tare.” Ensure that the scale reads “0.0” prior to weighing food.
• Step 5: Add food/drink to be thrown away. There will be two numbers on the screen, one on the left and one on the right (for example – 1 : 11.3). Please record both numbers. The first number is in lbs and the second is in oz. If you see “1 : 11.3,” please record 1 lb. 11.3 oz.
• Step 6: Turn off scale by holding Power/Tare button.

Page 144 ESTIMATING QUANTITIES AND TYPES OF FOOD WASTE AT THE CITY LEVEL: TECHNICAL APPENDICES NRDC Page 145 ESTIMATING QUANTITIES AND TYPES OF FOOD WASTE AT THE CITY LEVEL: TECHNICAL APPENDICES NRDC
9
In order to receive your $50 gift card, you must complete the second survey (as well as the previous survey and the kitchen diary) and either mail (via post) or scan and email your completed kitchen diary. To mail your kitchen diary, use the provided postage-paid envelope (only include the kitchen diary, not other materials). To email your kitchen diary, scan the completed diary and email to [email]. After receipt of the kitchen diary, your gift card will be sent to you. If you cannot receive emails, contact participant support to coordinate. You can access the online survey at [link]. Please contact participant support [phone or text] or [email] if you cannot complete the survey online to make alternate arrangements. The survey takes approximately 5-10 minutes and asks questions about your household’s waste and food related activities as well as your experience participating in this study. You do not have to complete the survey in one sitting. If you feel uncomfortable answering any question, you can skip it. At the beginning of the survey, you will be asked for your four-digit participant ID, which can be found at the bottom of the Quick Start Guide. You must put in this ID to complete the survey.
Second Online Survey & Receiving Gift Card
Frequently Asked Questions (FAQs) Kitchen Diary Q: What if we forgot to complete the diary for one of the days? A: Don’t worry. Try to remember what food was discarded that day and fill out the kitchen diary table for the day you omitted with estimates of what was wasted in your household on that day. Don’t worry about the weight. Instead, provide estimates by volume or number of items. For example: two medium sized carrots. You should still fill out all columns in the kitchen diary for each item. For food discarded outside the household, provide a brief description in the Daily Comments as usual. If you are recording discarded food a day or more after it was discarded, please provide a brief note in the Daily Comments section to let us know what date you recorded the information. Q: Am I supposed to record food/drink discarded outside of the house? A: Do not record food /drink wasted outside of the house in the kitchen diary tables, but please do provide a narrative of food consumed and discarded outside the home in the Daily Comments section at the bottom of each diary page. Q: We didn’t discard anything in our house for a day. What do we record? A: If you didn’t discard anything in your household, leave the kitchen diary table blank, but choose the checkbox at the top of that day’s kitchen diary that indicates why no food/drink waste was recorded. Q: We ran out of pages for one day of the kitchen diary. What do we do? A: There are extra overflow pages at the end of the kitchen diary if you need more room. Just make sure to put the date on that page so we know what day the food/drink was discarded. Q: Should we record food/drink discarded outside of the household for every family member? A: Yes, the kitchen diary should be used to record information from all members of the household. Q: How should we note if the amount of food/drink discarded is different than usual because of a special event (e.g. party, barbeque, cleaned out refrigerator)? A: Write a note in the Daily Comments section that indicates there was a special event.

Page 146 ESTIMATING QUANTITIES AND TYPES OF FOOD WASTE AT THE CITY LEVEL: TECHNICAL APPENDICES NRDC
10
Kitchen Scale Q: What if I can’t get my scale to work? A: First, ensure that your batteries are properly installed and that you have read the section on how to use the kitchen scale (pages 6-7). If the scale still doesn’t work, please contact participant support at [phone or text] or [email]. Surveys Q: The first question in the survey is asking me for a participant ID. Where do I find that? A: Your participant ID is a four-digit number that can be found in several locations, including the front of your guidebook, the front of your kitchen diary, and the Quick Start Guide. Q: What if we forgot to complete the online survey before starting the diary? A: Don’t worry. Just complete the online survey as soon as possible. Q: I had an error when submitting my survey. How do I know you received it? A: Please contact participant support at [phone or text] or [email]. Bin Digs Q: What if I forgot to place my trash and/or compost out on the curb? A: It’s okay. But, please ensure that you place your trash and compost out for the rest of the study period.
Frequently Asked Questions (FAQs)…continued
Thank You!! The information collected as part of this research is important, as it will help us understand how much and what types of food are wasted in your city. Please ensure that you completed both surveys and returned the completed kitchen diary to us via mail or email, as this is required to receive your $50 gift card. Additionally, as a thank you gift, the kitchen scale provided is yours to keep.

Page 146 ESTIMATING QUANTITIES AND TYPES OF FOOD WASTE AT THE CITY LEVEL: TECHNICAL APPENDICES NRDC Page 147 ESTIMATING QUANTITIES AND TYPES OF FOOD WASTE AT THE CITY LEVEL: TECHNICAL APPENDICES NRDC
Need help? Contact participant support at [phone or text] or [email]. If you need m
ore space to record discarded food and beverage, please use overflow pages.
Participant ID: D
ay 1
Please use a separate row for each type of food/drink discarded, even if it’s for the same meal. See page 3 of guidebook for more info.
If nothing is recorded in the table below for the day, please indicate why (remember to fill out the Daily Comments Section): □ Nothing discarded
□ Nothing eaten at home □ Other:
Time?
Time you record each item. Note AM or PM.
What?
Please give a detailed description of any food/drink, including inedible parts that you discarded.
Which Meal?
Check the box in the column that best describes the meal associated with the discarded food/drink.
How much?
Weight
(ounces) Remember to tare* kitchen scale. *Instructions on using kitchen scale on page 6 of Guidebook.
Packaging? If wasted food was in glass, metal, or hard plastic when weighed, estimate the size (dimensions or volume). Do not include container used for weighing.
Where?
Check the box that best describes where you discarded the food/drink.
State of Food? Check the box that best describes the state of food/drink when discarded.
Why?
Check the box that best describes why you discarded the food or drink.
Trash
Down the Drain
Fed Pets/Animals
Home Compost
Curbside Compost
Compost Drop-Off
Other (write in)
Whole
Prepared, Not Cooked
Cooked/Leftovers
Inedible Parts
Other (write in)
Past Date on Label
Moldy or Spoiled
Didn't Taste Good
Left Out Too Long
Improperly Cooked
Too Little to Save
Don't Want as Leftovers
Inedible Parts
Other (write in)
Breakfast
Lunch
Dinner
Snacks
Other
Glass
Metal
Hard Plastic
7:50 am
A
pple core (exam
ple)
x
0.5
x
x
x
Daily Comm
ents Section: For each day, if any food or drink was consumed outside of the house, please provide a short description and estimated quantities of any food that was discarded outside of the home. _______________________________________________________________________________________________________________________________________________________________________________
_______________________________________________________________________________________________________________________________________________________________________________
_______________________________________________________________________________________________________________________________________________________________________________
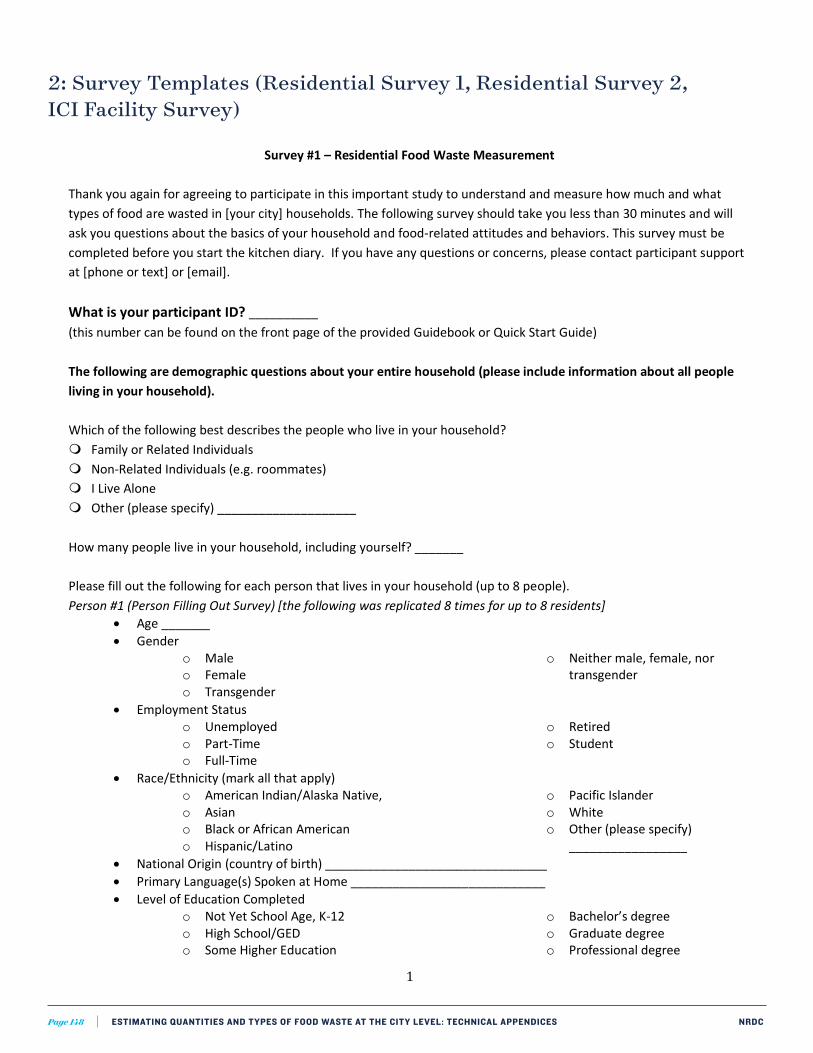
Page 148 ESTIMATING QUANTITIES AND TYPES OF FOOD WASTE AT THE CITY LEVEL: TECHNICAL APPENDICES NRDC
2: Survey Templates (Residential Survey 1, Residential Survey 2, ICI Facility Survey)
1
Appendix P: Templates for Residential Study 2: Survey Templates (Residential Survey 1, Residential Survey 2, ICI Facility Survey)
Survey #1 – Residential Food Waste Measurement Thank you again for agreeing to participate in this important study to understand and measure how much and what types of food are wasted in [your city] households. The following survey should take you less than 30 minutes and will ask you questions about the basics of your household and food-related attitudes and behaviors. This survey must be completed before you start the kitchen diary. If you have any questions or concerns, please contact participant support at [phone or text] or [email]. What is your participant ID? __________ (this number can be found on the front page of the provided Guidebook or Quick Start Guide) The following are demographic questions about your entire household (please include information about all people living in your household). Which of the following best describes the people who live in your household? Family or Related Individuals Non-Related Individuals (e.g. roommates) I Live Alone Other (please specify) ____________________ How many people live in your household, including yourself? _______ Please fill out the following for each person that lives in your household (up to 8 people). Person #1 (Person Filling Out Survey) [the following was replicated 8 times for up to 8 residents]
• Age _______ • Gender
o Male o Female o Transgender
o Neither male, female, nor transgender
• Employment Status o Unemployed o Part-Time o Full-Time
o Retired o Student
• Race/Ethnicity (mark all that apply) o American Indian/Alaska Native, o Asian o Black or African American o Hispanic/Latino
o Pacific Islander o White o Other (please specify)
_________________ • National Origin (country of birth) ________________________________ • Primary Language(s) Spoken at Home ____________________________ • Level of Education Completed
o Not Yet School Age, K-12 o High School/GED o Some Higher Education
o Bachelor’s degree o Graduate degree o Professional degree

Page 148 ESTIMATING QUANTITIES AND TYPES OF FOOD WASTE AT THE CITY LEVEL: TECHNICAL APPENDICES NRDC Page 149 ESTIMATING QUANTITIES AND TYPES OF FOOD WASTE AT THE CITY LEVEL: TECHNICAL APPENDICES NRDC
2
What is your approximate annual household income? Less than $25,000 $25,001-$35,000 $35,001-$45,000 $45,001-$55,000 $55,001-$65,000 $65,001-$75,000 $75,001-$85,000 $85,000-$95,000 $95,001 and over How many people does this income support? ________ The following set of questions will ask you about food-related topics. Approximately how much money does your household spend on food and beverages eaten at home each week (do not include food eaten away from home)? $50 or less $51-$100 $101-$150 $151-$200 $201-$250 $251-$300 More than $301 Approximately how much money does your household spend on food and beverages eaten away from home each week (do not include food eaten at home)? $50 or less $51-$100 $101-$150 $151-$200 $201-$250 $251-$300 More than $301 Are you familiar with the issues related to wasted food? Yes No

Page 150 ESTIMATING QUANTITIES AND TYPES OF FOOD WASTE AT THE CITY LEVEL: TECHNICAL APPENDICES NRDC
3
If you have seen or heard about the issue of wasted food, how did you learn about it? (select all that apply) Social Media (e.g. YouTube, Facebook, Pinterest) Online Ad Billboard Radio Word of Mouth Direct Email Documentary Television Book Class/Schooling Other ____________________ On average, how frequently does your household prepare or cook (not necessarily eat) the following meals at home during an average week?
Every Day At Least 5 Days Between 2 and 4 Days
Between 1 and 2 days Less than Once
Breakfast Lunch Dinner Snacks
On average, how frequently does your household eat (not necessarily prepare or cook) the following meals at home during an average week?
Every Day At Least 5 Days Between 2 and 4 Days
Between 1 and 2 days Less than Once
Breakfast Lunch Dinner Snacks
Is your primary refrigerator generally... Fairly empty Half full Mostly full Don't have one Is your secondary refrigerator or freezer generally... Fairly empty Half full Mostly full Don't have one

Page 150 ESTIMATING QUANTITIES AND TYPES OF FOOD WASTE AT THE CITY LEVEL: TECHNICAL APPENDICES NRDC Page 151 ESTIMATING QUANTITIES AND TYPES OF FOOD WASTE AT THE CITY LEVEL: TECHNICAL APPENDICES NRDC
4
Which of the following best describes your thoughts about your refrigerator? It makes me uncomfortable or nervous if my refrigerator is too empty It makes me uncomfortable or nervous if my refrigerator is too full I don't care or don't think about how full my refrigerator is When planning a visit to the grocery store or when shopping for food, how often does your household do the following...
Never Rarely Sometimes Often Always Not Applicable
Make a shopping list Check to see what is in your
refrigerator/freezer and cupboards before you go
shopping
Plan your meals before shopping
Estimate how much of each item you need to buy before
going shopping
Buy only items on your shopping list in the store
Buy food in larger quantities than desired, due to the way
food is packaged
Purchase more of a product than you need because it is on
sale
Purchase more of a product than you need because it is
cheaper to buy in larger packages or quantities
Purchase something unplanned because it looks good at the
time

Page 152 ESTIMATING QUANTITIES AND TYPES OF FOOD WASTE AT THE CITY LEVEL: TECHNICAL APPENDICES NRDC
5
The column on the left lists possible places where your household purchases food (not including food purchased and eaten away from home). For each possible place, use the drop-down list to indicate how frequently household members use various modes of transportation to visit that place. If your household members do not use one of the transportation options, leave that box empty.
Car Owned by Household Member Borrowed Car Biking Walking Public Transportation Delivery
More than
3 times per
week
1-2 times per
week
Less than once per
week
More than
3 times per
week
1-2 times per
week
Less than once per
week
More than
3 times per
week
1-2 times per
week
Less than once per
week
More than
3 times per
week
1-2 times per
week
Less than once per
week
More than
3 times per
week
1-2 times per
week
Less than once per
week
More than
3 times per
week
1-2 times per
week
Less than once per
week
Superstore (e.g. Costco)
Grocery Store
Corner Store/Bodega
Farmers' Market
Food Pantry
Backyard Garden
Local Garden (not at your household)
Community-Supported Agriculture
Online Delivery Service
Other (please specify)
Other (please specify)

Page 152 ESTIMATING QUANTITIES AND TYPES OF FOOD WASTE AT THE CITY LEVEL: TECHNICAL APPENDICES NRDC Page 153 ESTIMATING QUANTITIES AND TYPES OF FOOD WASTE AT THE CITY LEVEL: TECHNICAL APPENDICES NRDC
6
For this question, consider the person in your household who most frequently prepares meals (if there isn’t one particular person that applies to, then consider yourself for this question). How strongly do you agree or disagree with the following statements?
Agree Somewhat Agree
Neither Agree Nor Disagree
Somewhat Disagree Disagree
This person usually follows recipes when
cooking
This person improvises
meals based on what food
is available
This person frequently makes too much food
Many foods you purchase are marked with a “use by,” “sell by,” or “best by” date. By food type, what do you generally do with foods after the date provided on the packaging has passed?
Don't Pay
Attention to Date Labels
Throw It Away Smell or Look at it
to Determine if it is Still Good
Everything is Eaten or Frozen Before the Date on the Package
I don't consume this type of food
Meat & Fish Milk
Cheeses Yogurt & Sour
Cream
Bread Eggs
Fruits & Vegetables

Page 154 ESTIMATING QUANTITIES AND TYPES OF FOOD WASTE AT THE CITY LEVEL: TECHNICAL APPENDICES NRDC
7
How strongly do you agree or disagree with the following statements?
Agree Somewhat Agree
Neither Agree Nor Disagree
Somewhat Disagree Disagree
We are very cautious about avoiding food poisoning
Date labels are the main source of information we use when deciding
whether to throw away food
We frequently use sight, taste, or smell to determine if food is safe to
eat
We frequently put foods that need to be used soon in a certain part of
the refrigerator
I would like to have more time to spend on preparing and cooking
food
We frequently prepare meals a day or more in advance
We frequently eat prepared or frozen meals to save time
I feel less guilty about wasting food that has been in the refrigerator for
a long time
I feel less guilty about wasting food if it is composted
I prefer fruits and vegetables with no blemishes
At least one person in the household is a skilled cook
Having regular family or household meals is important
Generally, preparing food for friends and/or family makes me
feel good
When household members eat out it is usually spur of the moment, or
planned with less than 48 hours notice
We clean out our refrigerator regularly (at least every other
week)
It is important that we finish all food that is put on our plates for a
meal

Page 154 ESTIMATING QUANTITIES AND TYPES OF FOOD WASTE AT THE CITY LEVEL: TECHNICAL APPENDICES NRDC Page 155 ESTIMATING QUANTITIES AND TYPES OF FOOD WASTE AT THE CITY LEVEL: TECHNICAL APPENDICES NRDC
8
Considering the food thrown away in your household in the average week, how much of that food disposal do you think could be avoided (e.g. through planning meals ahead of time, changing food shopping habits)? None A Little A Fair Amount A Lot Do you think the amount of edible food you throw out is more than, the same as, or less than the average American? A Lot More A Little Bit More The Same A Little Bit Less A Lot Less Does your household currently compost food? No Yes, we compost at our home Yes, we participate in [city’s] organic waste collection program Yes, we contribute to community or other type of composting If your household does not currently compost, then why not? (select all that apply) We don't know how to compost We are worried about insects and other animals attracted to compost We are worried it will smell It will be too expensive to compost at home We don't have time to compost There is no room to compost at our house We don't waste enough food to compost Don't know what composting is

Page 156 ESTIMATING QUANTITIES AND TYPES OF FOOD WASTE AT THE CITY LEVEL: TECHNICAL APPENDICES NRDC
9
How often do you and other household members take the following actions during the average week?
Never Rarely Sometimes Most of the Time Always
Remove and discard only the bruised parts of fruits and vegetables instead of throwing away the entire
food
Try to use all parts of food items (e.g. broccoli stalks, bones for soups,
etc.)
Prioritize eating leftovers Freeze food if you think you will not be able to
eat it in time
In general, what happens to leftovers in your household? (select all that apply) Leftovers are eaten as another meal without alteration Leftovers are used as part of another meal (other food is added) Leftovers are composted Leftovers are thrown in the garbage Leftovers get fed to animals We don't have leftovers How strongly do you agree or disagree with the following statements as they relate to your household?
Agree Somewhat Agree
Neither Agree Nor Disagree
Somewhat Disagree Disagree
We are more likely to eat leftovers from a
restaurant compared to leftovers from
meals made at home
We sometimes save leftovers even if we think that we might
not eat them
Saving leftovers makes me feel less
guilty than throwing the food away
Generally, we do not like leftovers

Page 156 ESTIMATING QUANTITIES AND TYPES OF FOOD WASTE AT THE CITY LEVEL: TECHNICAL APPENDICES NRDC Page 157 ESTIMATING QUANTITIES AND TYPES OF FOOD WASTE AT THE CITY LEVEL: TECHNICAL APPENDICES NRDC
10
How strongly do you agree or disagree with the following statements as they relate to your household?
Agree Somewhat Agree
Neither Agree Nor Disagree
Somewhat Disagree Disagree
In the past year, my household has made an effort to reduce the
amount of food we throw away
My household has complete control over reducing the amount of food
we throw away
People around me believe my household should reduce the
amount of food we throw away
My household believes that reducing the amount of food we
throw away would be good
My household intends to reduce the amount of food we throw away
Given the amount of food that is thrown away in this country, the actions of my household won’t
make a meaningful difference in the amount of food being wasted

Page 158 ESTIMATING QUANTITIES AND TYPES OF FOOD WASTE AT THE CITY LEVEL: TECHNICAL APPENDICES NRDC
11
How strongly do you agree or disagree with the following statements as they relate to your household?
Agree Somewhat Agree
Neither Agree Nor Disagree
Somewhat Disagree Disagree
Reducing my household’s food waste would save
energy
Reducing my household’s food waste would save
water
Reducing my household’s food waste would feed
hungry people
Reducing my household’s food waste would improve
the health of my household
Reducing my household’s food waste would save my
household money
Reducing my household’s food waste would
decrease landfill use
Reducing my household’s food waste would
decrease carbon emissions

Page 158 ESTIMATING QUANTITIES AND TYPES OF FOOD WASTE AT THE CITY LEVEL: TECHNICAL APPENDICES NRDC Page 159 ESTIMATING QUANTITIES AND TYPES OF FOOD WASTE AT THE CITY LEVEL: TECHNICAL APPENDICES NRDC
12
Survey #2 – Residential Food Waste Measurement Thank you again for participating in this important study to understand and measure how much and what types of food are wasted in [your city] households. The following survey should take you approximately 5 to 10 minutes and will ask you questions about the basics of your household and food-related attitudes and behaviors as well as your experience completing the kitchen diary. Please complete this survey as soon as possible to receive your $50 gift card. Please remember that in order to receive the $50 gift card, participants must either mail the kitchen diary (in provided postage-paid envelope) or scan the diary and email it to [email]. NRDC will not be responsible for kitchen diaries lost in the mail (if you are worried about loss of the kitchen diary, please take photos or scan the diary).
What is your participant ID? ________________ (this number can be found on the front page of the provided Guidebook or Quick Start Guide) The following set of questions will ask you about food-related topics. Considering the food thrown away in your household in the average week, how much of that food disposal do you think could be avoided (e.g. through planning meals ahead of time, changing food shopping habits)? None A Little A Fair Amount A Lot Do you think the amount of edible food you throw out is more than, the same as, or less than the average American? A Lot More A Little Bit More The Same A Little Bit Less A Lot Less Does your household currently compost food? No Yes, we compost at our home Yes, we participate in [city’s] organic waste collection program Yes, we contribute to community or other type of composting

Page 160 ESTIMATING QUANTITIES AND TYPES OF FOOD WASTE AT THE CITY LEVEL: TECHNICAL APPENDICES NRDC
13
If your household does not currently compost, then why not? (select all that apply) We don't know how to compost We are worried about insects and other animals attracted to compost We are worried it will smell It will be too expensive to compost at home We don't have time to compost There is no room to compost at our house We don't waste enough food to compost Don't know what composting is In general, what happens to leftovers in your household? (select all that apply) Leftovers are eaten as another meal without alteration Leftovers are used as part of another meal (other food is added) Leftovers are composted Leftovers are thrown in the garbage Leftovers get fed to animals We don't have leftovers How strongly do you agree or disagree with the following statements as they relate to your household?
Agree Somewhat Agree
Neither Agree Nor Disagree
Somewhat Disagree Disagree
In the past year, I have made an effort to reduce the amount
of food thrown away in my household
I have complete control over reducing the amount of food
thrown away by my household
People around me believe I should reduce the amount of
food thrown away by my household
I believe reducing the amount of food thrown away by my household would be good
I intend to reduce the amount of food thrown away by my
household

Page 160 ESTIMATING QUANTITIES AND TYPES OF FOOD WASTE AT THE CITY LEVEL: TECHNICAL APPENDICES NRDC Page 161 ESTIMATING QUANTITIES AND TYPES OF FOOD WASTE AT THE CITY LEVEL: TECHNICAL APPENDICES NRDC
14
How strongly do you agree or disagree with the following statements as they relate to your household?
Agree Somewhat Agree
Neither Agree Nor Disagree
Somewhat Disagree Disagree
Given the amount of food that is thrown away in this country,
my individual actions won't make a difference
Measuring the food that was discarded in our household
changed how much food we throw away
After measuring the food that was discarded in our
household, I now believe that our household wastes more
food than I previously thought
How strongly do you agree or disagree with the following statements as they relate to your household?
Agree Somewhat Agree
Neither Agree Nor Disagree
Somewhat Disagree Disagree
Reducing my household’s food waste would save energy
Reducing my household’s food waste would save water
Reducing my household’s food waste would feed hungry
people
Reducing my household’s food waste would improve the health of my household
Reducing my household’s food waste would save my
household money
Reducing my household’s food waste would decrease landfill
use
Reducing my household’s food waste would decrease climate
pollution

Page 162 ESTIMATING QUANTITIES AND TYPES OF FOOD WASTE AT THE CITY LEVEL: TECHNICAL APPENDICES NRDC
15
The following set of questions will ask you about your experience completing the kitchen diary. During the week that you completed the kitchen diary, how many times did you put your trash out for collection? None Once Twice Three Times Do you feel like the amount of food discarded in your household during the week you participated in the study is typical of how much your household discards each week, on average? Yes No
If No, please state the reasons why the amount of food discarded in your household during that week was not typical (e.g. you ate out more than normal or had a big dinner party).
What (if anything) would have made it easier to complete the kitchen diary? What (if anything) would have made it easier to be a participant in the study? What did you learn (if anything) from participating in this study?

Page 162 ESTIMATING QUANTITIES AND TYPES OF FOOD WASTE AT THE CITY LEVEL: TECHNICAL APPENDICES NRDC Page 163 ESTIMATING QUANTITIES AND TYPES OF FOOD WASTE AT THE CITY LEVEL: TECHNICAL APPENDICES NRDC
16
How frequently did you talk to a member of your household about food waste because of participating in the study? Never One Time A Couple of Times Many Times How frequently did you talk to someone outside of your household about food waste because of participating in the study? Never One Time A Couple of Times Many Times What do you think your city can do to help residents waste less food? What suggestions do you have for the study team to improve the experience for participants in the study? In order to receive your $50 gift card, you must return the completed kitchen diary to us via mail or email. Have you sent in the kitchen diary yet? Yes, I mailed it in using the provided postage-paid envelope. Yes, I emailed a scanned copy of the completed kitchen diary to [email]. No, but I plan on mailing in the kitchen diary soon. No, but I plan on emailing in the kitchen diary soon. Thank you for completing this survey and completing your participation in the study! Your input is very valuable. Please contact participant support at [phone or text] or [email] with any questions.

Page 164 ESTIMATING QUANTITIES AND TYPES OF FOOD WASTE AT THE CITY LEVEL: TECHNICAL APPENDICES NRDC
17
ICI Facility Food Waste Survey Thank you for agreeing to participate in the Food Waste Assessment Study (a project of the Natural Resources Defense Council) to estimate how much and what types of food are wasted in [your city]. As part of your participation, please fill out the following survey as completely as possible. Please note that we will not share any of this information except in aggregate and anonymized form. The information you provide will be used to help us approximate how much food of different types is discarded in selected industrial, commercial, and institutional sectors. We will also use the information collected in this survey and in the bin digs to provide specific, confidential recommendations for how your facility can reduce the amount of food going to waste. If you are not comfortable providing any of the requested information, you may decline to answer that question. Please provide the following information for the person filling out this survey.
Name Job Title Organization
Preferred Method of Contact (select all that apply) Phone Email Please provide as much information below about your facility as applies and is available.
Facility Name Brief Description of Main Business Activities at Facility # of Employees (full-time equivalent) at Facility # of Visitors Per Week (If applicable) # of Meals Served Per Week (If applicable) # of Rooms (for accommodations) #of Seats (for venues) # of Beds (if applicable) # of Days in Operation Per Year Projected Annual Revenue
How is your facility currently operated? Individually Operated Small Chain (10 or fewer facilities) Large Chain (more than 10 facilities) Other (please specify) ____________________ The following information will be used to help us estimate how much food is wasted at your facility as well as help us provide your facility with relevant recommendations. Please fill out as completely as possible.

Page 164 ESTIMATING QUANTITIES AND TYPES OF FOOD WASTE AT THE CITY LEVEL: TECHNICAL APPENDICES NRDC Page 165 ESTIMATING QUANTITIES AND TYPES OF FOOD WASTE AT THE CITY LEVEL: TECHNICAL APPENDICES NRDC
18
How does your facility currently dispose of wasted food? Please include the approximate amount of waste per week being managed by each method, if known. (Check all that apply)
Do you currently use the following method to dispose of wasted food at your facility?
What is the approximate amount of total waste per week (in pounds, tons, or cubic
yards) that is being managed by this method? (Put number under appropriate
unit -- choose pounds, tons, or cubic yards) Yes No Don't Know Pounds Tons Cubic Yards
Trash Collection
Compostable Materials Collection
Drain Disposal
Animal Feed On-Site
Composting
Other (please specify)
Other (please specify)
Please provide information on every waste receptacle that is collected for pickup by a hauler (for trash, recycling, and composting) at your facility. Provide information by bin type (e.g. toter or compactor). For example, if your facility uses five 4 cubic yard dumpsters for recycling, you only need to fill out one row for those dumpsters. However, please indicate in column 4 that there are 5 dumpsters. Please also fill out a separate row for each type of receptacle that is used for more than one disposal destination (e.g. one row for 4 cubic yard dumpsters used for recycling; another row for 4 cubic yard dumpsters used for trash). If your business sets out trash bags at the curb, please indicate how many bags you set out on pick-up day. Note: Only include the large dumpsters, not individual trash cans inside facility.

Page 166 ESTIMATING QUANTITIES AND TYPES OF FOOD WASTE AT THE CITY LEVEL: TECHNICAL APPENDICES NRDC
19
Disposal Destination? (trash, recycling, or composting)
Type/Size of
Bin/Bags?
Quantity of
Bin/Bag by Type?
Typically, how full is your bin
type when it gets
picked up by hauler?
Pick Up Days & Times
Bin/Bag Location
Trash Recycling Composting
(examples: 32 gallon toter, 10
cubic yard compactor,
4 cubic yard
dumpster, 20 cubic
yard rolloff, 40-gallon bag)
Number Percentage (example:
daily at 7am)
(example: parking lot or
loading dock, curb)
Waste Receptacle
#1
Waste Receptacle
#2
Waste Receptacle
#3
Waste Receptacle
#4
Waste Receptacle
#5
Waste Receptacle
#6
Waste Receptacle
#7
Waste Receptacle
#8

Page 166 ESTIMATING QUANTITIES AND TYPES OF FOOD WASTE AT THE CITY LEVEL: TECHNICAL APPENDICES NRDC Page 167 ESTIMATING QUANTITIES AND TYPES OF FOOD WASTE AT THE CITY LEVEL: TECHNICAL APPENDICES NRDC
20
The following information will be used to help us provide your facility with relevant recommendations. Please fill out as completely as possible. What would you consider the biggest barriers to decreasing the amount of food that your facility discards? (select all that apply) Don't know how to reduce food waste Not enough staff time Food waste reduction is too expensive We're focused on other organizational priorities Our food waste is too limited to worry about Trash services are currently inexpensive Haven't considered it Other (please specify) ____________________ What would you consider the biggest barriers to increasing the amount of food you divert from landfill by using alternative methods (e.g. composting or animal feed)? (select all that apply) Lack of access to collection services for composting or animal feed Not enough staff time to identify alternatives to landfilling Alternatives to landfill are too expensive Trash services are currently inexpensive Not enough physical space in waste collection area for alternative disposal Haven't considered it Other (please specify) ____________________ What types of food, if any, does your facility generally throw away? (select all that apply) Prep scraps (e.g. trim waste) Inedible food parts (e.g. egg shells) Expired or past-date food items Spoiled food items Leftover prepared foods Foods that have not been cooked or prepared (e.g. whole bananas or whole loaves of bread) Plate waste (post-consumer waste) Little to no food is wasted Other (please specify) ____________________

Page 168 ESTIMATING QUANTITIES AND TYPES OF FOOD WASTE AT THE CITY LEVEL: TECHNICAL APPENDICES NRDC
21
Of the foods that you waste, which represents the highest amount wasted by weight? (select one) Prep scraps (e.g. trim waste) Inedible food parts (e.g. egg shells) Expired or past-date food items Spoiled food items Leftover prepared foods Foods that have not been cooked or prepared (e.g. whole bananas or whole loaves of bread) Plate waste (post-consumer waste) Little to no food is wasted Other (please specify) ____________________ Does your organization/facility currently donate food? Yes No If your facility donates food, please provide the following information:
Frequency of Food Donation Per Month General Types of Food Donated (example: prepared foods, produce, bakery items) Approximate Quantity (Lbs.) Donated Per Month Organization(s) That Your Organization Donates To
Does your organization have a written policy about donating food? Yes No Not Sure What would you consider the biggest barriers to donating surplus food? (select all that apply) We don't know of an organization that could receive our excess food It takes too much time for staff to prepare food for donation Lack of cold storage for holding food to be donated Fear of liability Fear of harming our brand image No surplus foods to donate We haven't considered donating surplus food Other (please specify) ____________________ Does your organization specifically track the amount and types of food wasted at your facility? Yes No

Page 168 ESTIMATING QUANTITIES AND TYPES OF FOOD WASTE AT THE CITY LEVEL: TECHNICAL APPENDICES NRDC Page 169 ESTIMATING QUANTITIES AND TYPES OF FOOD WASTE AT THE CITY LEVEL: TECHNICAL APPENDICES NRDC
22
If you answered yes to the previous question (indicating that your organization tracks the amount and types of food wasted at your facility), is your method of tracking food waste... Electronic Paper-based If your organization's method of tracking food waste is electronic, what system do you currently use? LeanPath Proprietary Software Other (please specify) ____________________ Does your organization currently repurpose excess or leftover food internally? (e.g. using leftovers in the next day’s meals)? Yes No Is your organization interested in learning more about ways to reduce the amount of food wasted at your facility? Yes No Is your organization interested in learning more about ways to donate additional food? Yes No Please describe any other ways that your organization manages surplus food that were not captured in this survey. Thank you for participating in the NRDC Food Waste Assessment Study. If you have any questions about this survey, please contact us at [email].