estimating tensile strength in pinus radiata structural … … · 70 new zealand journal of...
TRANSCRIPT

70 New Zealand Journal of Forestry Science 32(1)
New Zealand Journal of Forestry Science 32(1): 70–85 (2002)
ESTIMATING TENSILE STRENGTH IN PINUS RADIATASTRUCTURAL TIMBER
PING XU
New Zealand Forest Research Institute,Private Bag 3020, Rotorua, New Zealand
ANDREW H. BUCHANAN
Civil Engineering, University of Canterbury,Private Bag 4800, Christchurch, New Zealand
BRYAN G. WALFORD
New Zealand Forest Research Institute,Private Bag 3020, Rotorua, New Zealand
and JOHN C. F. WALKER
New Zealand School of Forestry, University of Canterbury,Private Bag 4800, Christchurch, New Zealand
(Received for publication 19 November 2001; revisions 23 April 2002, 10 June 2002)
ABSTRACTAltogether, 1862 Pinus radiata D.Don structural boards were tested in tension to
examine five selected parameters of tensile strength, and to verify the code-assignedcharacteristic tensile strength values. Knot area ratio (KAR) alone does not predict tensilestrength at the weakest point of the board; local bending stiffness at the failure point EP, failshows a stronger correlation with tensile strength, and this presents a possibility for non-destructive estimation of tensile strength in P. radiata structural timber. The mean, 5thpercentile, and characteristic strength in tension were studied for the test boards and theresults indicated that the code values for current visual stress-grading systems ofP.radiata need to be revised because the characteristic tensile strengths obtained fromthe tests were significantly lower than the values assigned in the standards.
Keywords: tensile strength; characteristic tensile strength; stiffness; knots; knot arearatio; visual stress-grading; machine stress-grading; code value; timber;Pinus radiata.
INTRODUCTION
Estimating strength, i.e., failure stress, in structural timber includes estimating thestrength of a single board, and estimating the characteristic strength (the basic materialstrength defined in statistical terms) of a timber population. Designers and customers rely onsuch work to avoid structural failures. However, timber strength cannot be measured withoutdestructive testing although proof loading can be used to cull out weaker boards. Consequently,

Xu et al.—Estimating tensile strength in Pinus radiata 71
non-destructive measurements involving stiffness and knots have been used to estimate thestrength of structural timber, and they form an important part of machine stress-grading andvisual stress-grading. This study aimed to:(1) Evaluate stiffness and KAR (knot area ratio) as parameters of tensile strength in single
boards of Pinus radiata:
(2) Verify the code-assigned characteristic tensile strength values in stress-grading systemsfor P. radiata populations.
The effect on tensile strength of other wood qualities and knot features, such as density,microfibril angle, slope of grain, knot location, knot types, was beyond the scope of thisstudy.
The strength of a single board varies with the manner of loading. When a board is testedin axial tension, the entire length of the board is subjected to the same tensile force, thus thefailure occurs at the weakest point regardless of where it is located. When tested in bending,however, the bending moment varies along the length of board, and so failure usually occursin the region of maximum bending moment regardless of whether that is the weakest pointin the whole length. In other words, bending failure does not necessarily occur at the weakestpoint along the full length of the board (Madsen 1992; Bodig & Jayne 1982). Therefore,tensile testing was chosen for this study because it has the advantage of identifying thestrength at the weakest point in the full length of a member.
A number of practical approaches were used, including estimating strength according tothe lowest local F-grade mark on the board (i.e., machine stress-grading), the maximum knotarea ratio at any point along the board (i.e., visual stress-grading), or some combination ofthe two. Most previous studies have focused on strength behaviour in bending, and littleinformation is available on estimating tensile strength in P. radiata structural timber (Gauntet al. 1999; Addis Tsehaye et al. 1995, 1998; Cramer et al. 1988; Kunesh & Johnson 1972).
Estimating the strength in a single board from the lowest local F-grade mark is based onthe relationship between local bending stiffness and local strength (New Zealand Ministryof Forestry 1995; AS/NZS 4063: 1992). If it is assumed that the lowest local F-grade markon a board indicates the weakest zone of the board, the local strength at this zone providesan estimate for the tensile strength of the whole board. However, each F-grade markcorresponds to a range of local bending stiffness values as assigned by the ForestryCommission of New South Wales (1974) rather than to a single value. In practice, anindividual board may have several “lowest local F-grade marks” along its length, if thebending stiffnesses at these locations all fall in the same grade range. When this happens, thelocal F-grade mark does not indicate the weakest zone, as there are a number of possibilities.In addition, a board may break unexpectedly at a higher local F-grade mark. Therefore, thisstudy used the actual stiffness values rather than the F-grade colour mark to explore the likelyestimator of tensile strength for each board. Local bending stiffness at the actual failure pointof board was termed “local failure stiffness” (EP, fail) in this study. The correlations betweentensile strength, average stiffness in tension (ET), the lowest local bending stiffness (EP,min),and local failure stiffness (EP, fail) are presented in this paper.
Knottiness is recognised as having a negative effect on the mechanical properties oftimber (Xu 2000, in press; Pellicane & Franco 1994; Walker 1993; Samson 1993; Barrett &Kellogg 1991; Cramer et al. 1988; Buchanan 1986; Cramer & Goodman 1983). Knottiness

72 New Zealand Journal of Forestry Science 32(1)
is generally described by the local Knot Area Ratio (KAR) — namely, the ratio of the sumof projected cross-sectional areas of the knots to the cross-sectional area of the piece (BS4978: 1988; AS 2858: 1986). The maximum KAR in the board is a major parameter used tojudge the grade of the board in visual stress-grading systems (NZS 3603: 1993; BS 4978:1988; AS 2858: 1986). In order to evaluate the accuracy of the prediction of tensile strengthby KAR in a single board, both maximum KAR and KAR at the actual failure point wereinvestigated before and after testing in tension. The correlations between tensile strength,maximum KAR, and KAR at the actual failure point are presented in this paper.
In order to sort timber into populations to which characteristic strengths could be assigned,two basic systems, i.e., machine stress-grading and visual stress-grading, were used.
The common procedure in machine stress-grading systems is to sort a source populationof timber into sub-populations according to selected stiffness cut-off values that are appliedto the lowest local bending stiffness within each piece. In practice, the cut-off values areadjusted so that the properties of the sub-populations satisfy the characteristic valuesassigned to established grades, and the sub-populations are then branded accordingly. Theproperties of the source population of timber may change. If that happens, for whateverreason, operators of the machine stress-grading system are expected to adjust the cut-offvalues in order to produce timber grades with consistent properties, as monitored by a qualitycontrol system. This study considered the lowest local bending stiffness (EP,min) as theparameter for sorting timber. Other parameters (for example, average EP or Ej) were beyondthe scope of this study.
The two visual stress-grading systems that were evaluated were the Australian structural-grades (AS 2858: 1986) and New Zealand framing-grades (Engineering grade, No.1Framing, and No.2 Framing). Australian structural-grades (AS 2858: 1986) define thegrades according to visual defects and then derive the code values for the characteristicstrengths from an assumed relationship between the visual stress-grades and the correspondingF-grades (Appendix, Table A2).
Regarding the MGP (machine-graded pine) system, the Australian Standard (AS 1720.1:1997) gives only three grades (MGP 15, 12, and 10) that have high characteristic tensilestrengths. However, compared to most other softwood species, New Zealand P. radiatastructural timber can show low stiffness and strength, especially when the boards are cut fromcorewood (Xu & Walker in press; Sorensson et al. 1997; Shelbourne 1997). In order toresolve this problem, lower MGP grades have been proposed, namely MGP 8 and MGP 6(Walford 2001; Gaunt et al. 1999). In this study, the characteristic tensile strengths RK
calculated from the measured data were compared with the assigned code values forcharacteristic tensile strength in F-grades, Australian structural-grades, MGP-grades, andNew Zealand No.1 Framing and No.2 Framing. It was thought that a comparison betweenthe derived and assigned characteristic tensile strengths could provide useful information forimproving the existing design codes.
MATERIALS AND METHODSSelection of Materials
Sixty-two 27-year-old, thinned, unpruned, P. radiata trees were randomly selected froma single stand on the Mamaku Plateau in the central North Island of New Zealand. All stems
Xu et al.—Estimating tensile strength in Pinus radiata 73
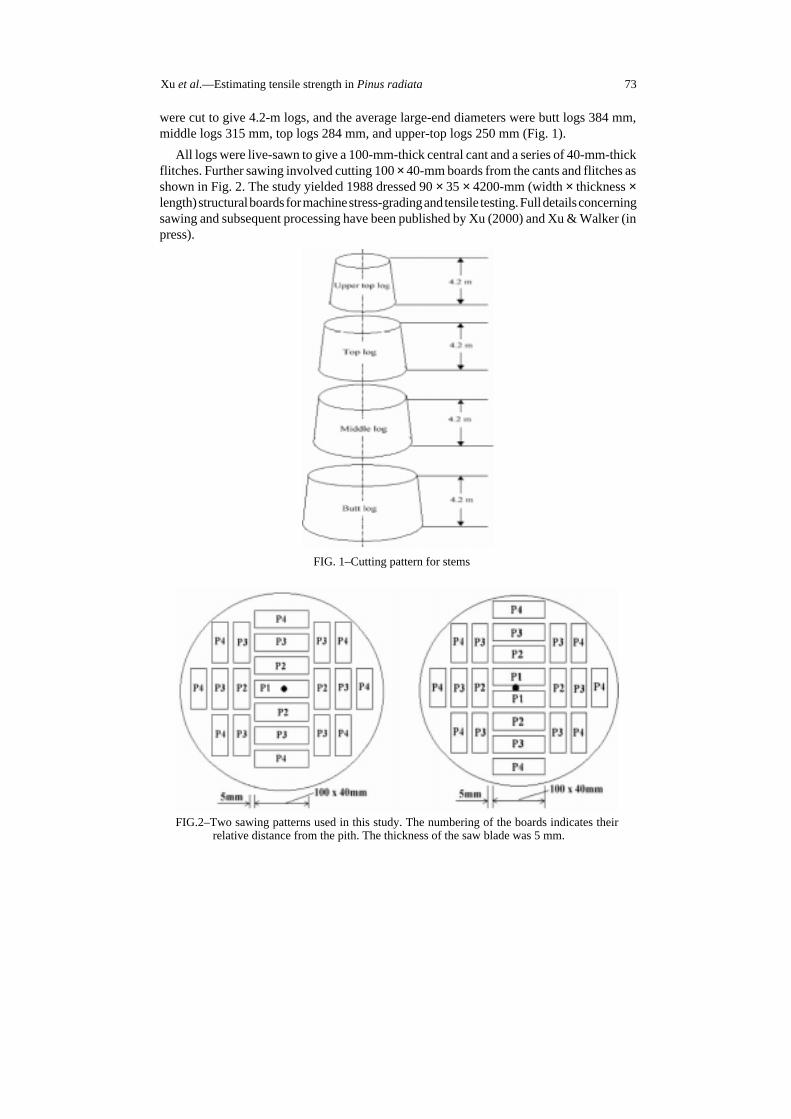
were cut to give 4.2-m logs, and the average large-end diameters were butt logs 384 mm,middle logs 315 mm, top logs 284 mm, and upper-top logs 250 mm (Fig. 1).
All logs were live-sawn to give a 100-mm-thick central cant and a series of 40-mm-thickflitches. Further sawing involved cutting 100 × 40-mm boards from the cants and flitches asshown in Fig. 2. The study yielded 1988 dressed 90 × 35 × 4200-mm (width × thickness ×length) structural boards for machine stress-grading and tensile testing. Full details concerningsawing and subsequent processing have been published by Xu (2000) and Xu & Walker (inpress).
FIG.2–Two sawing patterns used in this study. The numbering of the boards indicates theirrelative distance from the pith. The thickness of the saw blade was 5 mm.
FIG. 1–Cutting pattern for stems

74 New Zealand Journal of Forestry Science 32(1)
Of the 1988 boards tested, 1862 were used for the analysis of tensile strength. The failurestress of the other 126 boards could not be identified accurately as tensile strength becauseof either damage during machine stress-grading (69 boards) or failure occurring in the gripsof the tensile testing machine (57 boards). Therefore, these 126 boards were excluded fromall analyses.
Only 1589 of 1862 boards could be used for the analysis of local failure stiffness becausesome boards failed in their ungraded ends, i.e., “end failure”. During machine stress-grading,local bending stiffness in the first 0.65 m and the last 0.65 m of the board could not bemeasured because of the distance between the supporting rollers in the grader. Excluding the0.45-m grip length of the tensile testing machine, this meant that local failure stiffness couldnot be obtained where failure occurred in the 0.2m before the first local bending stiffnessreading and the 0.2 m after the last local bending stiffness reading. In order to obtaincomparisons between the parameters, all other analyses for estimating tensile strength in asingle board were based on data from the same 1589 boards.
“End failure” did not affect the analysis of characteristic tensile strength because:
(1) The lowest local bending stiffness that allowed for the 0.65-m ungraded ends wasselected as the parameter for sorting timber in the F-grades and MGP-grades;
(2) The maximum KAR in the board (excluding the length of the grips) was the parameterfor sorting timber in the Australian structural-grades and New Zealand Framing grades,which did not need to consider the local bending stiffness values.
Machine Stress-gradingWhen an average 12% moisture content was reached, the boards were machine stress-
graded using a MPC Computermatic stress grader (MK5 system) to obtain the local stiffnessvalue from bending as a plank (EP). No allowance was made for shear deformation. In thefirst section, a transducer on the infeed outrigger arm measures the natural bow in theunloaded board. Then, the board immediately enters the testing section where it is flexedbetween two rollers 0.914 m apart by applying a small constant force (900N) at mid-span andmeasuring the deflection. The true deflection is determined from the measured deflectionunder load and the natural bow in the unloaded board, and is used to calculate the modulusof elasticity.
The boards were fed through the machine immediately after the stress grader had been re-calibrated. Local bending stiffness (or local bending modulus of elasticity) was determinedat 152-mm intervals along the length of the board as the board passed through the grader, andthese values were recorded on computer. At the same time, the local bending stiffness gradeswere automatically colour-marked along the board. The lowest local bending stiffness valuealong the length of a board determined the F-grade of the board.
Tensile TestThe average stiffness in tension and the ultimate tensile strength (UTS) of each board were
measured using a tensile testing machine. The net span of the tensile test machine betweenthe two, 0.45-m-long, hydraulically operated grips was set at 3.3 m. A 200-kN-capacityhydraulic ram provided the axial tensile force to the board. A load cell, which was connected
Xu et al.—Estimating tensile strength in Pinus radiata 75
in line with the tensile machine and the ram, measured the tensile load continuously andtransferred the data to a computer during the tensile test (Xu 2000). Once the board broke,the dimensions of the cross-section at the failure zone were measured immediately and thetensile strength for each board was calculated.
Maximum KAR, KAR at Failure Point, andLocal Failure Stiffness
Before destructive testing, the KARs for the different knot types in each board weremeasured to obtain the maximum KAR in the board. Then the estimated weakest point waspredicted using the Australian Standard (AS 2858: 1986) and this point was marked on thesurface of the board.
After destructive testing, the local bending stiffness value at the failure point wasconfirmed by matching the local F-grade colour mark at the failure point to the original datathat had been recorded during machine stress-grading of that board. The KAR at the actualfailure point was re-measured to study the features at the failure point in the board. Any “gripfailure” tests were excluded from this study.
Characteristic Tensile Strength for the Population Being StudiedBoards were sorted into several populations according to the cut-off limits of EP, min for
the machine stress-grading systems as well as according to the maximum KAR of the boardfor visual stress-grading systems. Then the characteristic tensile strength for the populationbeing studied was calculated using the formula (AS/NZS 4063: 1992):
2.7VR RK = 1 – ––––– R0.05 (1)
√n where
VR = coefficient of variation of the measured data;n = sample size;R0.05 = the 5th percentile of the measured data. 2.7VR 1 –––––– provides a 75% confidence for the derived percentile values √n (AS/NZS 4063:1992).
The calculation of 5% percentile value in this study followed the method presented in theStandard (Appendix C in AS/NZS 4063:1992).
Finally, the results (RK) were compared with the code values of characteristic tensilestrength in different grading systems.
RESULTS AND DISCUSSION
Estimating Tensile Strength in a Single Board
Five parameters that might be expected to relate to tensile strength in a single board werestudied. They were maximum KAR, the KAR at actual failure point, average stiffness intension, the lowest local bending stiffness, and local failure stiffness, i.e., local bending

76 New Zealand Journal of Forestry Science 32(1)
stiffness at the actual failure point in the board. All analyses were based on data from the same1589 boards.
The experimental results showed that nearly 99% of the tested boards failed at a knot,which confirmed that knots are an important factor affecting the tensile strength in P. radiatastructural timber. However, the poor correlations between tensile strength and maximumKAR (R2 = 0.21), and between tensile strength and KAR at the actual failure point (R2 = 0.19)suggest that KAR alone is not a good predictor of tensile strength in structural timber (Fig.3and Fig. 4).
y = -0.1825x + 19.191
R2 = 0.21
0
5
10
15
20
25
30
35
40
45
50
0 10 20 30 40 50 60 70 80 90 1
Maximum KAR of board (%)
Ten
sil
e s
tren
gth
of
bo
ard
(M
Pa
)
FIG. 3–The correlation between tensile strength and maximum KAR (data from 1589 boards).
y = -0.1576x + 17.341
R2 = 0.19
0
5
10
15
20
25
30
35
40
45
50
0 10 20 30 40 50 60 70 80 90 100
KAR at the actual failure point (%)
Ten
sil
e s
tren
gth
of
board
(M
Pa)
FIG.4–The correlation between tensile strength and KAR at the actual failure point (data from1589 boards).

Xu et al.—Estimating tensile strength in Pinus radiata 77
Board stiffness gives a better indication of tensile strength than KAR, as can be seen fromthe stronger coefficient of determination (Fig. 5, 6, and 7). Local failure stiffness gave thebest estimation of tensile strength (R2 = 0.54) (Fig. 7). The lowest local bending stiffness(R2= 0.47) was less relevant to tensile strength at the weakest point than local failurestiffness (Fig. 6 and 7), because the lowest local bending stiffness did not always coincidewith the failure zone. However, the lowest local bending stiffness gave a somewhat bettercoefficient of determination than the average stiffness of the board in tension (Fig. 5 and 6).
y = 1.9416x - 2.4744
R2 = 0.45
0
5
10
15
20
25
30
35
40
45
50
0 2 4 6 8 10 12 14 16 18
Average stiffness in tension (GPa)
Ten
sil
e s
tren
gth
of
board
(M
Pa)
y = 2.7297x - 3.4683
R2 = 0.47
0
5
10
15
20
25
30
35
40
45
50
0 2 4 6 8 10 12
The lowest local bending stiffness of board (GPa)
Ten
sil
e s
tren
gth
of
bo
ard
(M
Pa
)
FIG. 5–The correlation between tensile strength and average stiffness in tension (ET) (data from1589 boards).
FIG. 6–The correlation between tensile strength and lowest local bending stiffness (EP,min) (datafrom 1589 boards).

78 New Zealand Journal of Forestry Science 32(1)
Comparison of the Characteristic Tensile Strength,Calculated from Test Data, with the Currently Assigned Values
in Machine Stress-grading SystemsF-grades
Firstly, the cut-off limits for EP, min were calculated using the yellow program card(Forestry Commission of New South Wales 1974). Then 1862 machine stress-graded boardswere sorted into several F-grade groups according to the calculated cut-off limits (Appendix,Table A1). This step determined the tested sample size in each F-grade. The characteristictensile strength for each group was calculated according to Equation (1) using the coefficientof variation, sample size, and 5% percentile value from the measured data in the group. Thenthe results were compared with the code values of characteristic tensile strength presentedin the Standard (AS 1720.1: 1997) for these F-grade groups. The results showed that thecharacteristic tensile strength calculated from the test data was slightly lower than thecurrently assigned characteristic tensile strength in F-grades (Table 1).
MGP-grades
MGP-grade groups in this study were sorted by EP, min in the same way as for F-grades.MGP 15 is considered equivalent to F11, MGP 12 equivalent to F8, and MGP 10 equivalentto F5 (Walford 2001). Then the characteristic tensile strengths calculated from the test datawere compared with the code values of characteristic tensile strengths presented in theStandard (AS 1720.1: 1997) for these three MGP-grades (Table 2).
There are two notable features in Table 2. Firstly, only 44% of the tested boards satisfiedthe requirements for MGP-grades. This means that the currently assigned MGP-grades in theStandard (AS 1720.1: 1997) do not cover the full range of strength properties found in NewZealand P. radiata, which agrees with a statement by Gaunt et al. (1999): “New Zealandradiata pine resource falls below MGP 12 with majority being around MGP 8”. Secondly,
y = 2.2683x - 2.5962
R2 = 0.54
0
5
10
15
20
25
30
35
40
45
50
0 2 4 6 8 10 12 14 16
Local failure stiffness (GPa)
Ten
sil
e s
tren
gth
of
board
(M
Pa
FIG. 7–The correlation between tensile strength and local failure stiffness (EP,fail) (data from1589 boards).

Xu et al.—Estimating tensile strength in Pinus radiata 79
TABLE 1–Comparison of the characteristic tensile strength (RK) calculated from the test data (1862boards) with the currently assigned characteristic tensile strength for F-grades (AS 1720.1:1997).
––––––––––––––––––––––––––––––––––––––––––––––––––––––––––––––––––––––––––––––––Stress grade
------------------------------------------------------------------F11 F8 F5 F4 Rejected
––––––––––––––––––––––––––––––––––––––––––––––––––––––––––––––––––––––––––––––––Sample size (n) 1 67 744 724 326Mean of measured tensile strength (MPa) 24.25 14.36 9.61 7.46Coefficient of variation of the measured data (VR) 0.338 0.419 0.349 0.4495th percentile of the measured tensile strength (MPa) 12.90 7.02 4.64 3.01Characteristic tensile strength calculated from test data (MPa) 11.47 6.73 4.48 2.81Code value: Characteristic tensile strength (MPa) 17.0 13.0 8.20 6.50 n/aDiscrepancy (%) –12 –18 –31––––––––––––––––––––––––––––––––––––––––––––––––––––––––––––––––––––––––––––––––
TABLE 2–Comparison of the characteristic tensile strength (RK) calculated from the test data (1862boards) with the currently assigned characteristic tensile strength for MGP-grades (AS1720.1: 1997).
––––––––––––––––––––––––––––––––––––––––––––––––––––––––––––––––––––––––––––––––MGP grades
---------------------------------------------------------------------MGP 15 MGP 12 MGP 10 n/a n/a
––––––––––––––––––––––––––––––––––––––––––––––––––––––––––––––––––––––––––––––––Equivalent F-grades F11 F8 F5 n/a n/aSample size (n) 1 67 744 724 326Mean of measured tensile strength (MPa) 24.25 14.36 9.61 7.46Coefficient of variation of the measured data (VR) 0.338 0.419 0.349 0.4495th percentile of the measured tensile strength (MPa) 12.90 7.02 4.64 3.01Characteristic tensile strength calculated from test data (MPa) 11.47 6.73 4.48 2.81Code value: Characteristic tensile strength (MPa) 23.0 15.0 8.9 n/a n/aDiscrepancy (%) –24 –24––––––––––––––––––––––––––––––––––––––––––––––––––––––––––––––––––––––––––––––––
the code values for characteristic tensile strength in MGP-grades are higher than the codevalues for the characteristic tensile strengths in the equivalent F-grades (Table 1). Morecritically, the characteristic tensile strengths calculated from the test data lie below both codevalues, which cannot ensure safe design. Therefore, it is necessary to explore ways forimproving the MGP-grade system. In the first instance, Forest Research (Walford 2001;Gaunt et al. 1999) has proposed two lower MGP-grades (MGP 8 and MGP 6) as an equivalentto No.1 Framing and as a replacement for No.2 Framing, and this is discussed in the nextsection.

80 New Zealand Journal of Forestry Science 32(1)
Comparison of Characteristic Tensile Strength, Calculated fromTest Data, with the Currently Assigned Values in the
Visual Stress-grading System
The two visual stress-grading standards, Australian Standard (AS 2858: 1986) and NewZealand Standard (NZS 3603: 1993), were the main interest of this study. The AustralianStandard (AS 2858: 1986) considers the influence of three different knot types on the grades,whereas the New Zealand Standard considers only KAR for No.1 and No.2 Framing grades.Engineering grade was not included, because it is practically unobtainable.
Australian structural-grades
Based on the permissible maximum KAR for face, edge, and other knots, the AustralianStandard (AS 2858:1986) denotes five structural-grades for softwood. These grades applyto both Australian and New Zealand P. radiata (Appendix C in AS 2858: 1986).
AS 2858: 1986 suggests that the characteristic tensile strength in each structural-gradecan fit the code value of an equivalent F-grade presented in AS 1720.1: 1997. Therelationships between the permissible maximum KAR, structural-grades, and thecorresponding F-grades are listed in the Appendix (Table A2). For example, if the KARs forface knots, edge knots, and other knots are 25%, 50%, and 15% respectively, then thestructural-grade and the equivalent F-grade of this board would match No.3 and F8respectively, according to AS2858 (Appendix, Table A2).
The 1862 machine stress-graded boards were sorted into several structural-grade groupsaccording to the permissible maximum KAR in the board, and then the characteristic tensilestrengths were calculated for these groups and compared with the code values of characteristictensile strength presented in the standard (AS 1720.1: 1997). The experimental results(Table3) indicated that the characteristic tensile strength from the test data in each structuralgrade group was significantly lower than the code value of characteristic tensile strength of
TABLE 3–Comparison of the characteristic tensile strength (RK) calculated from the test data (1862boards) with the currently assigned characteristic tensile strength for Australian structural-grades (AS 2858: 1986).
––––––––––––––––––––––––––––––––––––––––––––––––––––––––––––––––––––––––––––––––Australian structural-grades
--------------------------------------------------------------------No.1 No.2 No.3 No.4 No.5
––––––––––––––––––––––––––––––––––––––––––––––––––––––––––––––––––––––––––––––––Equivalent F-grades F14 F11 F8 F7 F5Sample size (n) 117 183 361 394 807Mean of measured tensile strength (MPa) 17.64 15.57 14.09 11.36 8.96c.o.v 0.557 0.480 0.414 0.401 0.4165th percentile of the measured tensile strength (MPa) 7.13 6.85 6.27 5.54 3.77Characteristic tensile strength calculated from test data (MPa) 6.14 6.19 5.90 5.28 3.62Code value: Characteristic tensile strength (MPa) 21.0 17.0 13.0 10.0 8.2Discrepancy (%) –71 –64 –55 –47 –56––––––––––––––––––––––––––––––––––––––––––––––––––––––––––––––––––––––––––––––––

Xu et al.—Estimating tensile strength in Pinus radiata 81
F-grade that is suggested by AS 2858: 1986 to fit the structural-grade group. This clearlydemonstrates that the assumed relationship between the structural-grades and thecorresponding F-grades in AS 2858: 1986 does not match the wood resource used in thisstudy well.
New Zealand Framing gradesNew Zealand Standard (NZS 3603: 1993) segregates No.1 Framing and No.2 Framing
grades according to the maximum KAR in the board — the maximum KAR is less than 33%in No.1 Framing, and more than 33% but less than 50% in No.2 Framing. NZS 3603: 1993only gives the code value for the characteristic tensile strength of No.1 Framing; a code valuefor No.2 Framing is not available. Therefore, this study considered the suggested code valueof characteristic tensile strength for No.2 Framing as proposed by Walford (2001).
Characteristic tensile strengths calculated from test data, and the code values for No.1 andNo.2 Framing, are shown in Table 4a. Compared with the Australian structural-grades, thecalculated RK values from the test better approach the code values for No.1 and No.2Framing. However, the calculated characteristic tensile strengths are still lower than the codevalues for both No.1 and No.2 Framing (Table 4a). One reason for this is that Framing gradesassign tensile strength on the basis of a single parameter, i.e., the maximum KAR in theboard, and there is only a poor correlation between tensile strength and maximum KAR(Fig.3). In practice, the influence of knots on tensile strength should take into account theeffect of KAR together with other parameters such as knot types, knot positions, growthangle of knot (Xu 2000, in press).
Walford (2001) suggested a correspondence between MGP-grades and New Zealandvisual structural-grades:• MGP 8 as equivalent to the current No.1 Framing, and MGP 6 as a replacement for No.2
Framing;
• Code values for tensile strength of 6.3 MPa in MGP 8, and 4.0 MPa in MGP 6.
The study reported here study examined this proposal — 1862 boards were sorted intoNo.1 Framing and No.2 Framing groups according to the rules for New Zealand visualstress-grading. Then the characteristic tensile strengths were calculated for these groups andcompared with the code values for the characteristic tensile strength of MGP 8 and MGP6,as suggested by Walford (2001). This approach achieved the desired outcomes: thecharacteristic tensile strengths obtained from test data were higher than the suggested codevalues in both No.1 and No.2 Framing groups, which ensures safe design (Table 4b).
CONCLUSIONSNearly 99% of the tensile tested boards broke at a knot zone and tensile strength reduced
with an increase of knot area ratio. This re-emphasised that knots are an important factoraffecting tensile strength of timber. However, a single parameter, i.e., KAR alone, does notreliably indicate tensile strength, since there was no strong correlation between tensilestrength and the maximum KAR (R2 = 0.21), or tensile strength and the KAR at the actualfailure point of the board (R2 = 0.19).
Of the five examined parameters, local bending stiffness at the failure point best indicatedthe tensile strength of the board (R2 = 0.54). However, one knows the local failure stiffness

82 New Zealand Journal of Forestry Science 32(1)
TABLE 4a–Comparison of the characteristic tensile strength (RK) calculated from the test data (1862boards) with the currently assigned characteristic tensile strength for New ZealandFraming grades (NZS 3603: 1993).
––––––––––––––––––––––––––––––––––––––––––––––––––––––––––––––––––––––––––––––––Framing grades
---------------------------------------------------No.1 Framing No.2 Framing Below
grade*––––––––––––––––––––––––––––––––––––––––––––––––––––––––––––––––––––––––––––––––Sample size (n) 608 817 437Mean of measured tensile strength (MPa) 15.29 10.83 8.19c.o.v 0.483 0.408 0.4245th percentile of the measured tensile strength (MPa) 7.03 5.26 3.38Characteristic strength calculated from test data (MPa) 6.66 5.06 3.19Code value: characteristic tensile strength (MPa) 8.8 7.7† n/aDiscrepancy (%) –24 –34––––––––––––––––––––––––––––––––––––––––––––––––––––––––––––––––––––––––––––––––Characteristic tensile strength has been recalculated in NZS 3603: 1993 (see Amendment No.1, April1996). The new code value for No.1 Framing is 8.8 MPa.* Indicates that KAR > 50%;† Value proposed for No.2 Framing by Walford (2001), but not available in the current standard.
TABLE 4b–Comparison of the characteristic tensile strength (RK) calculated from the test data (1862boards) with the proposed code values of characteristic tensile strength in MGP 8 andMGP 6 (Walford 2001).
––––––––––––––––––––––––––––––––––––––––––––––––––––––––––––––––––––––––––––––––Framing grades
---------------------------------------------------No.1 Framing No.2 Framing Below
grade*––––––––––––––––––––––––––––––––––––––––––––––––––––––––––––––––––––––––––––––––Sample size (n) 608 817 437Mean of measured tensile strength (MPa) 15.29 10.83 8.19c.o.v 0.483 0.408 0.4245th percentile of the measured tensile strength (MPa) 7.03 5.26 3.38Characteristic strength calculated from test data (MPa) 6.66 5.06 3.19Code value: characteristic tensile strength for MGP 8 and MGP 6 (MPa) 6.3 4.0 n/aDiscrepancy (%) +5.7 +27––––––––––––––––––––––––––––––––––––––––––––––––––––––––––––––––––––––––––––––––* Indicates that KAR > 50%.
only after destructive testing, so this can only be used in combination with an accurateprediction of the location of the weakest point in the board. Therefore, it is necessary toexplore other failure features of knots, such as the frequency of different knot types, failurepatterns, and the failure angles, which will give a clearer insight for estimating the weakestpoint in P. radiata structural timber.
For visually graded timber, the characteristic tensile strengths calculated from test datain this study were significantly lower than the published code values in Australian structural-grades and New Zealand Framing grades, but especially the Australian structural-grades. Incontrast, when this wood was machine stress-graded according to F-grades and MGP-grades

Xu et al.—Estimating tensile strength in Pinus radiata 83
the characteristic tensile strength for each population corresponded more closely to the codevalues. However, the code values for F-grades and MGP-grades were still higher than thecalculated values from test data, which would compromise safe design. In addition, there isan absence of lower MGP-grades in AS 1720.1: 1997, which limits the use of MGP-gradesin the New Zealand P. radiata market.
Using the equivalence between the lower MGP-grades and the New Zealand framinggrades as suggested by Walford (2001), then the experimental results showed a veryacceptable match with the characteristic tensile strengths, while also being somewhat abovethese limits — so ensuring safe and satisfactory design.
ACKNOWLEDGMENTSWe thank Carter Holt Harvey Forestry for the supply of timber used in this study.
REFERENCESADDIS TSEHAYE; BUCHANAN, A.H.; CHA, J. 1998: Effects of length and grade on in-grade
tensile strength and stiffness properties of radiata pine timber. Journal of Korean Wood Scienceand Technology 26(1): 16–23
ADDIS TSEHAYE; BUCHANAN, A.H.; WALKER, J.C.F. 1995: Stiffness and tensile strengthvariation within and between radiata pine trees. Journal of the Institute of Wood Science 13(5):513–518.
AS 1720.1: 1997: “Timber Structures Part 1: Design Methods”. Standards Association of Australia,Australia.
AS 2858: 1986: “Australian Standard for Timber-Softwood - Visually Stress-graded for StructuralPurposes”. Standards Association of Australia, Australia.
AS/NZS 4063: 1992: “Timber stress-graded-in-grade Strength and Stiffness Evaluation”. Australian/New Zealand Standard. New Zealand.
BARRETT, J.D.; KELLOGG, R.M. 1991: Bending strength and stiffness of second-growth Douglas-fir dimension lumber. Forest Products Journal 41(10): 35–43
BODIG, J.; JAYNE, B.A. 1982: “Mechanics of Wood and Wood Composites”. Van NostrandReinhold, New York.
BS 4978: 1988: “British Standard Specification for Softwood Grades for Structural Use”. BritishStandards Institution, UK.
BUCHANAN, A.H. 1986: Radiata pine timber: Grading and testing for structural use. New ZealandJournal of Timber Construction 2(2): 16–24.
CRAMER, S.M.; GOODMAN, J.R. 1983: Model for stress analysis and strength prediction of lumber.Wood and Fibre Science 15(3): 338–349.
CRAMER, S.M.; FOHRELL, W.B.; McDONALD, K.A.; STAHL, D.C. 1988: Exploring the relationshipbetween local slope of grain angle and initial fracture in lumber subject to tensile load.International Conference on Timber Engineering, Seattle 2: 566–575.
FORESTRY COMMISSION OF NEW SOUTH WALES 1974: “Softwood Grading Program —Yellow Program Card”. New South Wales.
GAUNT, D.; ROPER, J.; DAVY, B. 1999: Performance grading of New Zealand pine and thedevelopment of the ‘E-GraderTM’. FIEA 3rd Wood Quality Symposium, Rotorua, 30 November1999 & Melbourne, 2 December 1999.
KUNESH, R.H.; JOHNSON, J.W. 1972: Effect of single knots on tensile strength of 2- by 8-inchDouglas-fir dimension lumber. Forest Products Journal 22(1): 32–36
MADSEN, B. 1992: “Structural Behaviour of Timber”. Timber Engineering Ltd, North Vancouver,British Columbia, Canada.
84 New Zealand Journal of Forestry Science 32(1)
NEW ZEALAND MINISTRY OF FORESTRY 1995: “A Guide to the New Zealand and AustraliaTimber Grading Rules”. Ministry of Forestry, Wellington, New Zealand
NZS 3603: 1993: “New Zealand Timber Structures Standard”. Standards Association of New Zealand,Wellington, New Zealand.
PELLICANE, P.J.; FRANCO, N. 1994: Modelling wood pole failure, Part 2: material and geometricconsiderations. Wood Science and Technology 28(4): 261–274.
SAMSON, M. 1993: Modelling of knots in logs. Wood Science and Technology 27(4): 429–437.SHELBOURNE, C.J.A. 1997: Genetics of adding value to the end-products of radiata pine. Pp. 129–
141 in Burdon, R.D.; Moore, J.M. (Ed.) “IUFRO ’97 Genetics of Radiata Pine”. Proceedingsof NZ FRI - IUFRO Conference 1–4 December and Workshop 5 December, Rotorua, NewZealand. FRI Bulletin No.203.
SORENSSON, C.T.; COWN, D.J.; RIDOUTT, B.G.; TIAN, X. 1997: The significance of woodquality in tree breeding: A case study of radiata pine in New Zealand. Timber managementtoward wood quality and end-product value. IV-35. CTIA/IUFRO International Wood QualityWorkshop.
WALFORD, G.B. 2001: What grade, what size, what stresses? New Zealand Timber Design Journal3(10): 13–15.
WALKER, J.C.F. 1993: “Primary Wood Processing: Principles and Practice.” Chapman & Hall,London.
XU, P. 2000: The mechanical properties and stability of radiata pine structural timber. Ph.D thesis,University of Canterbury, New Zealand.
–––––: Estimating the influence of knots on the local longitudinal stiffness in radiata pine structuraltimber. Wood Science and Technology (in press).
XU, P.; WALKER, J.C.F.: Stiffness gradients in radiata pine trees. Wood Science and Technology (inpress).

Xu et al.—Estimating tensile strength in Pinus radiata 85
APPENDIX
TABLE A1–Cut-off limits for the lowest local bending stiffness EP,min according tothe yellow program card (Forestry Commission of New South Wales1974)
––––––––––––––––––––––––––––––––––––––––––––––––––––––––––––––––––––––––––––––––Grade EP range Mid EP Cut-off limits for EP,min
(GPa) (GPa) (GPa)––––––––––––––––––––––––––––––––––––––––––––––––––––––––––––––––––––––––––––––––
F11 Max. ~11.58 11.89 11.89 ≤ EP,minF8 12.19 ~ 8.27 8.43 8.43 ≤ EP,min < 11.89F5 8.58 ~ 5.52 5.59 5.59 ≤ EP,min < 8.43F4 5.65 ~ 4.14 4.18 4.18 ≤ EP,min < 5.59Rejected 4.21 ~ Min EP,min < 4.18
––––––––––––––––––––––––––––––––––––––––––––––––––––––––––––––––––––––––––––––––
TABLE A2–The relationship between the permissible maximum KAR, Australianstructural-grades, and the corresponding F-grades (after AS 2858:1986)
––––––––––––––––––––––––––––––––––––––––––––––––––––––––––––––––––––––––––––––––Structural Equivalent Face Edge Other
grade F-grades knots knots knots*––––––––––––––––––––––––––––––––––––––––––––––––––––––––––––––––––––––––––––––––
No.1 F14 KAR ≤ 25% KAR ≤ 25% KAR ≤ 15%No.2 F11 KAR ≤ 33% KAR ≤ 40% KAR ≤ 25%No.3 F8 KAR ≤ 40% KAR ≤ 50% KAR ≤ 30%No.4 F7 KAR ≤ 50% KAR ≤ 60% KAR ≤ 40%No.5 F5 KAR ≤ 60% KAR ≤ 66% KAR ≤ 45%
––––––––––––––––––––––––––––––––––––––––––––––––––––––––––––––––––––––––––––––––* Includes all knots that do not fit the definitions of face and edge knots (AS 2858: 1986)