estimating the cost of a just transition in south africa’s
TRANSCRIPT
Estimating the cost of a just transition in South Africa’s coal sector: protecting workers, stimulating regional development
and accelerating a low-carbon transition
Michelle Cruywagen, Megan Davies and Mark Swilling
Centre for Complex Systems in Transition, Stellenbosch University, Stellenbosch, South Africa

Introduction
• SA’s IRP (2019) commits to a decarbonisation pathway
• Hinges on decommissioning of coal & rapid uptake of RE
• What will the cost of the just transition from coal be?
• How can transformation of SA political economy be accelerated?
• Propose a methodology to estimate the cost of a just transition

Methodology
• First empirical, quantitative study
• Adapted a model by Pollin & Callaci (2019) to calculate
1. Compensation
2. Retraining
3. Relocation
4. Rehabilitation & Regional Development

Data
• Age breakdown
• Skills levels
• Education
• Salary
• Labour sending areas
• Pension DataoContributions receivedo Investment IncomeoBenefits Paido Surpluses
Sources
1. National labour data 2. Survey sent to coal companies3. Companies’ Social & Labour Plans4. MPF Annual Report

Applied a 20-year cost framework that identifies attrition rates (i.e. natural retirement) and coal sector contraction rates that protect coal workers’ livelihoods under various scenarios.

Attrition by retirement and job losses: SA coal workers (over 20 years)
High Attrition
Scenario one
IRP
Decommissioning
Scenario two
a Contraction rate 43% 75%
b Current employed total 82 248 82 248
c Job losses over 20-year transition 35 367 61 686
d Average job loss p.a. 1 769 3 085
e Workers between 45 and 65 (35%) 28 787 28 787
f Workers per year reaching 65 1 439 1 439
g Workers u/45 p.a. req. re-employment 330 1 646
h Total u/45 req. re-employment/20 yrs. 6 600 32 920
i Attrition as a % of job losses 82% 46%
(Source: Employment data: Minerals Council; Age profile: Mining Qualifications Authority & TIPS)

Using the data from Table 1, it is possible to calculate the cost of a just transition for coal workers in South Africa. The CST research estimates the annualised, and total cost, of a just transition in South Africa over a 20-year period.

Cost (R) of a Just Transition in SA’s coal sector (over 20 years)
Costs High attrition
Scenario (Total)
High attrition pa Decommission
Scenario (Total)
Decommission
Scenario pa
Compensation 1 200 000 000 60 000 000 6 000 000 000 300 000 000
Retraining 621 000 000 31 050 000 3 200 000 000 160 000 000
Relocation 100 000 000 5 000 000 500 000 000 25 000 000
LED/Rehabilitation 4 000 000 000 200 000 000 6 000 000 000 300 000 000
5 921 000 000/6bn 296 050 000/300m 15 700 000 000/16bn 785 000 000
(Source: Application by authors)

Compensation
Coal workers’ salary minus green economy salary i.e.
R23 000 - R20 000 = R3 000 X 12 months
= R36 000 X 330 workers X 5 years = R1.2bn

Retraining Costs
Total
workers
Workers
pa
% Type of Course Cost Total Cost
1 056 53 16 Already have degrees.
Retraining/Top-up: e.g.
Hydraulics, Geography
R40 000 R43m
3 564 178 54 Degree R140 000 499m
1 320 66 20 Vocational R50 000 66m
660 33 10 Solar/Wind Turbine
Technician
R20 000 13m
6 600 330 100 R621m/31m pa
(Source: Application by authors)

Coal workers education profile
(Source: Anglo SLP, Kuyasa Scoping Survey)
6584 304 84
1221 59 16
75%
80%
85%
90%
95%
100%
Anglo Kuyasa Percentage
Matric Undergrad & Postgrad

Relocation
Relocation costs were based on one month’s rent, travel costs and sundries like legal costs for a lease averaged at R15 000 X 6 600. Not all workers will need to relocate which will accommodate variances in the average cost.

Labour sending areas
83%
5%
4%
3%2% 1%
Mpumalanga
Gauteng
Limpopo
Eastern Cape
Northwest
KZN
Foreign Nationals
Free State
Northern Cape
Western Cape
(Source: Social and Labour Plans: Kuyasa 2016, BHP 2012 & Xtrata 2009-2013. n=4326)

Regional development and rehabilitation
• Further research is required to calculate this cost more accurately (lack of transparency)
• Distinguish between rehabilitation, land reclamation and regional development and to further define these concepts in more detail.
• Estimate based on investment in Special Economic Zones (SEZs) in SA. Estimates for rehabilitation and regional development costs in other countries were also used.
• Government/industry will need to stimulate local economic development through pvt-public partnerships.
• While supportive attrition-based just transition approaches would likely increase income protection for coal workers, complementary sequenced sectoral and regional development strategies have proven to be effective ways to stimulate job creation.

Discussion
• It is imperative costs are planned for in SA’s just transition plans
• Research sheds light on the extent of the costs involved helps shape the strategies
• This model has the potential to be deepened and extended across the energy sector at large
• Globally a just transition administered innovative institutional and financial arrangements facilitated by national government
• High-level buy-in and leadership is essential to unlock resources and enforce punitive measures to advance the energy transition

Conclusion
• Correlating decommissioning with attrition indispensable part of unlocking a just transition.
• A just transition in South Africa is going to have associated costs
• ‘No jobs on a dead planet’
• Lowest cost energy future relies finalisation just transition plan
• Costing critical juncture in SA’s future
References
• Anglo Coal. 2019. Mining & Social Labour Plans. Accessed March 2019.
• BHP Social & Labour Plan. 2019. [Online] Available: http://www.jaws.co.za/uploads/PPDocs/E812_Wolvekrans%20%20DEIR/13_SLP.pdf
• CER. 2019. Full Disclosure: The truth about mining rehabilitation in South Africa. [Online] Available: https://fulldisclosure.cer.org.za/
• CER. 2019. Integrated Resource Plan 2019. [Online] Available: https://cer.org.za/wp-content/uploads/2019/10/IRP-2019_corrected-as-gazetted.pdf
• Kuyasa Coal. 2019. Just Transition Scoping Survey Questionnaire.
• Minerals Council. 2019. Coal: Key Facts and Figures. [Online] Available: https://www.mineralscouncil.org.za/sa-mining/coal
• MQA. 2019. Annual Report 20017-2018. [Online] Available: https://www.mqa.org.za/annual-reports
• Pollin, R., & Callaci, B. 2019. The Economics of Just Transition: A Framework for Supporting Fossil Fuel–Dependent Workers and Communities in the United States. Labor Studies Journal 44(2):93-138 [Online] Available: https://journals.sagepub.com/doi/abs/10.1177/0160449X18787051
• TIPS. 2019. Industrial Policies for a Just Transition in SA’s energy sector. Personal Interview.

Additional Slides

A just transition must be aligned with our culture. A system to
which our people can easily adapt.
Patrick Mathebane, trade unionist, NUM. 2019
Source: globalcitizen.org. Amina Shamata, a teacher at Barefoot College, Zanzibar, installs a solar light in a home in Kanyasini Bondini village)

“We are in a catch 22 situation because when the mine is operating, we could die and when the mine is not working people die”.
“My son was forced to come home from school early and the biggest problem was that I couldn’t even afford to get him proper medicine”.
“Give us better jobs that are clean that we are free from pollution that we are free from sicknesses that we are free from any kind of disease”.
Hungry air is clean air
Pic Source: Al Jazeera

Pro Fossil Fuel
“We’ve got a lot of coal, we’re a coal-producing country
we could be the Kings of the coal in the world!”
CEO Mining Company. 2019
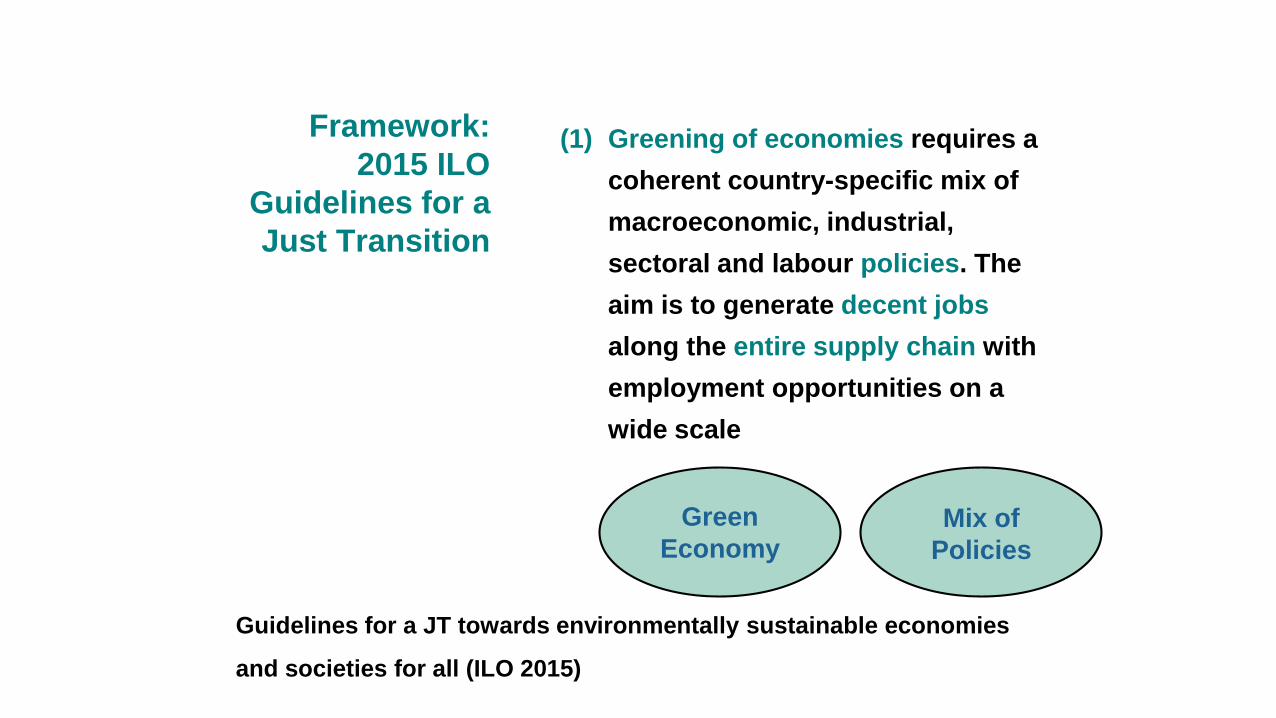
Framework:
2015 ILO
Guidelines for a
Just Transition
(1) Greening of economies requires a
coherent country-specific mix of
macroeconomic, industrial,
sectoral and labour policies. The
aim is to generate decent jobs
along the entire supply chain with
employment opportunities on a
wide scale
Guidelines for a JT towards environmentally sustainable economies
and societies for all (ILO 2015)
Mix of
Policies
Green
Economy

Framework:
2015 ILO
Guidelines on a
Just Transition
(2) As the challenge cuts across
several domains, sustainable
development needs to be addressed
across all policy fields in a coherent
manner. For such a policy framework,
institutional arrangements are needed
to ensure the participation of all the
relevant stakeholders at all levels
PolicyInstitutions
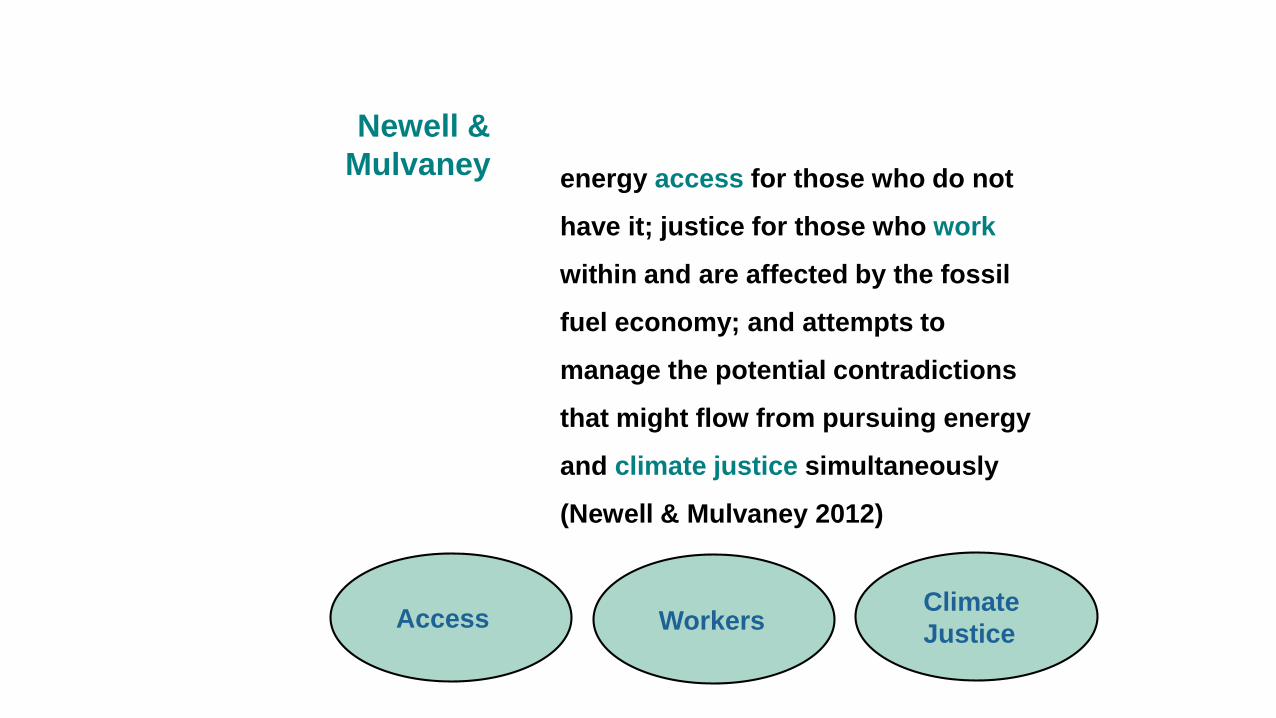
Newell &
Mulvaney energy access for those who do not
have it; justice for those who work
within and are affected by the fossil
fuel economy; and attempts to
manage the potential contradictions
that might flow from pursuing energy
and climate justice simultaneously
(Newell & Mulvaney 2012)
WorkersAccessClimate
Justice

Tony Mazzocci
Labour Union
Leader“Those who work with toxic materials
on a daily basis in order to provide
the world with the energy and the
materials it needs deserve a helping
hand to make a new start in life”
(Pollin & Callaci 2019:94).
Workers

Decent Workopportunities for work that are
productive and deliver a fair income,
security in the workplace and social
protection for families, better
prospects for personal development
and social integration, freedom for
people to express their concerns,
organise and participate in decisions
that affect their lives and equality of
opportunity and treatment for all
women and men (ILO 2019).

Conceptual dimensions of a Just Transition
Restorative
Procedural
Geography
Non-westernCosmopolitan
Distributive
Law
Community
Human
Rights
Society
Restorative
Health, safety, jobs,
ownership, rehabilitation
Institutional capacity
Community action
and legal
representation in
Emalahleni,
Middleburg, Steve
Tshwete
Heffron & McCauley 2018
SDG’s

Analysis of just transitions by country
Country Main ‘protection’ measures Differentiator Analysis
Germany Early retirement (5 years), reskilling Knowledge-based Successful
Australia Job creation, regional dev, reskilling Local governance Partial success
Canada Sector conversion, diversification High level buy-in Partial success
Netherlands Bridge to retirement, re-employment Regional conversion Partial success
Spain Early retirement, infrastructure investment Managed phase out Partial success
UK Redundancy, early access to pension Carbon tax Unsuccessful
Poland High/lower once off conditional payment Nuanced packages Unsuccessful
Ukraine Redundancy payments, retraining, SEZs Support each mine Unsuccessful
India Green jobs training, decentralised RE RE leader Contradictory
China Budgeted for transition, investing in coal Plural, scale Contradictory
US Trump derailed workers’ support plan Unjust Unmanaged

Just Transition Job Protection Spectrum
Support Measure Impact SA
(Global
South)
Impact
Global
North
Attrition/natural retirement
Bridge to retirement
Early retirement 5 years
Early retirement > 5 years
Low once off payment
High once off payment
Redundancy