estimating the direct radiative effect of absorbing ... · pdf fileestimating the direct...
TRANSCRIPT

Estimating the direct radiative effect of absorbing aerosolsoverlying marine boundary layer clouds in the southeastAtlantic using MODIS and CALIOP
Kerry Meyer,1,2 Steven Platnick,2 Lazaros Oreopoulos,2 and Dongmin Lee1,2
Received 26 October 2012; revised 17 April 2013; accepted 24 April 2013; published 29 May 2013.
[1] Absorbing aerosols such as smoke strongly absorb solar radiation, particularly atultraviolet and visible/near-infrared (VIS/NIR) wavelengths, and their presence aboveclouds can have considerable implications. It has been previously shown that they have apositive (i.e., warming) direct aerosol radiative effect (DARE) when overlying brightclouds. Additionally, they can cause biased passive instrument satellite retrievals intechniques that rely on VIS/NIR wavelengths for inferring the cloud optical thickness(COT) and effective radius (re) of underlying clouds, which can in turn yield biasedabove-cloud DARE estimates. Here we investigate Moderate Resolution ImagingSpectroradiometer (MODIS) cloud optical property retrieval biases due to overlyingabsorbing aerosols observed by Cloud-Aerosol Lidar with Orthogonal Polarization(CALIOP) and examine the impact of these biases on above-cloud DARE estimates. Theinvestigation focuses on a region in the southeast Atlantic Ocean during August andSeptember (2006–2011), where smoke from biomass burning in southern Africa overliespersistent marine boundary layer stratocumulus clouds. Adjusting for above-cloud aerosolattenuation yields increases in the regional mean liquid COT (averaged over all ocean-onlyliquid clouds) by roughly 6%; mean re increases by roughly 2.6%, almost exclusively dueto the COT adjustment in the non-orthogonal retrieval space. It is found that these twobiases lead to an underestimate of DARE. For liquid cloud Aqua MODIS pixels withCALIOP-observed above-cloud smoke, the regional mean above-cloud radiative forcingefficiency (DARE per unit aerosol optical depth (AOD)) at time of observation (near localnoon for Aqua overpass) increases from 50.9Wm�2AOD�1 to 65.1Wm�2AOD�1 whenusing bias-adjusted instead of nonadjusted MODIS cloud retrievals.
Citation: Meyer, K., S. Platnick, L. Oreopoulos, and D. Lee (2013), Estimating the direct radiative effect of absorbingaerosols overlying marine boundary layer clouds in the southeast Atlantic using MODIS and CALIOP, J. Geophys. Res.Atmos., 118, 4801–4815, doi:10.1002/jgrd.50449.
1. Introduction
[2] Significant efforts have been undertaken in recentyears to characterize aerosol optical and microphysical prop-erties and to quantify their direct and indirect radiativeeffects, as they remain a poorly constrained component ofthe Earth’s atmosphere [Forster et al., 2007]. One regionthat has received substantial attention is the southeastAtlantic Ocean, off the southwestern coast of Africa. Eachyear during austral winter, extensive biomass burning occursthroughout southern Africa, injecting large amounts ofsmoke into the troposphere: For the years 1997–2009, theportion of Africa south of the equator was estimated to
contribute roughly 28% of global biomass burning carbonemissions, with emission rates during the burning sea-son peaking annually between 100 and 150 Tg month�1
[van der Werf et al., 2010]. Prevailing easterly windsfrequently transport this smoke westward off the continent,creating a near-persistent smoke layer over the southeasternAtlantic Ocean. The concurrent meteorological conditionsover this region of the Atlantic are such that widespread,near-persistent marine boundary layer (MBL) stratocumulusclouds are also present. A unique situation is thus createdas the smoke layer, originating inland at higher altitudes,overlies the low-altitude MBL clouds [Devasthale andThomas, 2011] with considerable implications. First, themicrophysical and macrophysical properties of the MBLclouds can be altered if cloud top entrainment couples anoverlying aerosol layer, affecting cloud albedo (first indirecteffect) [Twomey, 1974, 1977a] and potentially also cloudlifetime (second indirect effect) [Albrecht, 1989], or viachanges in the above-cloud thermodynamic conditionsbecause of aerosol absorption (semi-indirect effect) [Ackermanet al., 2004].
1Goddard Earth Sciences Technology and Research (GESTAR),Universities Space Research Association, Columbia, MD, USA.
2NASA Goddard Space Flight Center, Greenbelt, Maryland, USA.
Corresponding author: K. Meyer, NASA Goddard Space Flight Center,Code 613.0, Greenbelt, MD 20771, USA. ([email protected])
©2013. American Geophysical Union. All Rights Reserved.2169-897X/13/10.1002/jgrd.50449
4801
JOURNAL OF GEOPHYSICAL RESEARCH: ATMOSPHERES, VOL. 118, 4801–4815, doi:10.1002/jgrd.50449, 2013
https://ntrs.nasa.gov/search.jsp?R=20140011287 2018-05-16T19:27:19+00:00Z

[3] Second, smoke aerosols, composed primarily of carbo-naceous particles, strongly absorb solar radiation, particu-larly at ultraviolet (UV) and visible (VIS) wavelengths[Bond and Bergstrom, 2006]. Several recent studies haveprovided estimates of this direct aerosol radiative effect(DARE) above clouds over the southeastern Atlantic Ocean.For instance, Chand et al. [2009] estimated above-clouddiurnal DARE by initializing forward radiative transfer(RT) calculations with monthly mean aerosol optical proper-ties derived from the color ratio technique [Chand et al.,2008] developed for CALIOP (Cloud-Aerosol Lidar withOrthogonal Polarization), on board CALIPSO (Cloud-AerosolLidar and Infrared Pathfinder Satellite Observation) [Winkeret al., 2009], and monthly mean cloud properties from theModerate Resolution Imaging Spectroradiometer (MODIS)on board NASA’s Terra satellite. They found that smokeaerosols have a net warming effect when the underlying cloudfraction was 0.4 or greater, and that the warming effectincreases approximately linearly with cloud fraction (meandiurnal direct radiative effect during July–October 2006/2007approaches roughly 12 to 14Wm�2 off the coast of Namibia).[4] Wilcox [2011], using a more indirect approach, esti-
mated above-cloud aerosol radiative effect by investigatingthe relationship between cloud albedo and cloud liquid waterpath as a function of above-cloud aerosol loading. Cloudalbedo was obtained from CERES (Clouds and Earth’sRadiant Energy System) and liquid water path from AMSR-E(AdvancedMicrowave Scanning Radiometer for EOS); aerosolloading was estimated using the OMI (Ozone MonitoringInstrument) UV aerosol index (UVAI). Over the southeastAtlantic Ocean (10�W to 15�E longitude, 20�S to 0�S latitude)during austral winter (July to September of 2005 and 2006),the direct and semidirect (due to cloud layer thickening)aerosol radiative effect for overcast scenes with overlyingabsorbing aerosols was estimated to be 9.2� 6.6Wm�2
and �5.9� 3.5Wm�2, respectively; accounting for thefrequency of occurrence of absorbing aerosols overlyingovercast scenes, the all-sky direct and semidirect effectwas estimated to be 1.0� 0.7Wm�2 and �0.7� 0.4Wm�2,respectively. These radiative effect values, based on diurnalmean solar insolation, were presented as semi-empiricaldiurnal estimates, since by using cloud properties only atthe time of satellite observation, they do not account forthe variability of cloud albedo as a function of solar zenithangle during daytime.[5] Most recently, de Graaf et al. [2012] inferred the
above-cloud time-of-observation DARE of overcast sceneswith overlying absorbing aerosols by comparing simulatedaerosol-free cloud reflectance spectra (calculated fromthe UV to the shortwave infrared (SWIR)) with measuredhyperspectral cloud reflectance from the Scanning ImagingAbsorption Spectrometer for Atmospheric Chartography(SCIAMACHY). Averaging over August 2006, their esti-mated DARE over the southern Atlantic Ocean, off the coastof Africa, was 23� 8Wm�2. This technique is advantageousbecause it does not require a priori aerosol assumptions orretrievals, though the large footprint of SCIAMACHY(roughly 60� 30 km2) limits spatial sampling.[6] The smoke aerosol spectral absorption can also be
problematic for remote sensing retrievals of the underlyingcloud optical properties, particularly for passive remotesensors such as MODIS, which rely primarily on reflectance
measurements in visible (VIS) and near-infrared (NIR) spec-tral channels for retrieving cloud optical thickness. Absorp-tion and scattering by overlying aerosols can introducebiases in the measured VIS/NIR cloud reflectance, whichmay then propagate into cloud optical property retrievalsand, ultimately, into estimates of cloud and above-cloudaerosol radiative effect. Haywood et al. [2004] investigatedpotential smoke layer impacts on both MODIS and AdvancedVery High Resolution Radiometer (AVHRR) retrievals ofcloud optical thickness and effective particle radius withaircraft measurements of smoke properties obtained duringthe Southern African Regional Science Initiative (SAFARI2000). Using the in situ measured smoke properties tosimulate bi-spectral cloud retrieval look-up tables (LUTs)[Nakajima and King, 1990] both with and without an overly-ing smoke layer, they found that retrieved cloud optical thick-ness is expected to be low biased compared to the actual cloudoptical thickness for both AVHRR and MODIS; retrievedeffective particle radius is expected to be high biased forAVHRR retrievals using the 0.63 and 3.7mm channel combi-nation, but low biased forMODIS retrievals using the 0.86 and1.63mm channel combination. The bias in effective radius wasdue to the coupling of the VIS/NIR bias into the size retrievalfor clouds with an optical thickness less than the asymptoticSWIR/MWIR (mid-wave infrared) reflectance value, and notdue to the direct impact of absorbing aerosols in the SWIR/MWIR channels. A case study analysis of MODIS data con-current with SAFARI 2000 confirmed the 0.86/1.63mm lowbiases exhibited by the LUT simulations.[7] Wilcox et al. [2009] also estimated potential biases in
MODIS cloud optical thickness and effective particle radiusretrievals. Specifically, MODIS retrievals of liquid waterpath (LWP), which depend on retrievals of both cloud opti-cal thickness and effective particle radius, were comparedwith AMSR-E LWP retrievals, using the OMI UVAI todetermine the presence of overlying smoke. Unlike theMODIS LWP retrievals, the AMSR-E LWPs are derivedfrom microwave measurements, which are unaffected byaerosols. Wilcox et al. found minimal bias in effective radiusretrievals and a low bias in optical thickness retrievals whenthe coincident OMI UVAI exceeded 2, suggesting that theunderestimation was indeed caused by the overlyingsmoke layer.[8] Active sensors have clear advantages over passive
sensors in multilayer situations such as aerosols overlyingclouds. CALIOP [Winker et al., 2009] can detect and iden-tify multiple cloud and aerosol features within a singleprofile [Liu et al., 2004; 2009; Hu et al., 2009; Omaret al., 2009], including very optically thin layers, and canretrieve feature altitudes [Vaughan et al., 2009] and opticalproperties [Young and Vaughan, 2009]. The operationallevel-2 5 km aerosol and cloud layer products provideretrievals of aerosol and cloud optical thickness, as well aslayer top and base altitudes. In addition to the standardCALIOP products, alternate optical property retrievals havebeen developed using CALIOP observations. For instance,using the depolarization ratio at 532 nm, the optical thick-ness of a thin layer (e.g., aerosols) can be retrieved whenoverlying an opaque cloud [Hu et al., 2007]. In a relatedtechnique, the ratio of measured backscatter at 532 and1064 nm, the so-called color ratio, can be used to infer theoptical thickness of absorbing aerosols overlying liquid
MEYER ET AL.: ABOVE-CLOUD DARE FROM MODIS AND CALIOP
4802

clouds, provided the spectral dependence of the aerosol layeris well constrained [Chand et al., 2008].[9] In the present study, Aqua MODIS optical property
retrievals of the MBL clouds over the southeast AtlanticOcean (off the coast of Namibia and Angola) are adjustedfor biases resulting from attenuation by overlying absorbingsmoke aerosols. The CALIOP 5 km aerosol layer product,collocated with the MODIS 1 km cloud products, is usedfor above-cloud absorbing aerosol detection and aerosoloptical depth (AOD). Bias-adjusted cloud optical propertyretrievals are provided by a research-level version of theMODIS cloud optical property retrieval algorithm (MOD06)[King et al., 1998; Platnick et al., 2003] using liquid cloudforward LUTs modified to include above-cloud absorbingaerosol layers. Finally, the above-cloud time-of-observationdirect aerosol radiative effect for overcast scenes is estimatedusing the CALIOP AOD and bias-adjusted MODIS cloudoptical properties, and its sensitivity to the underlying cloudoptical property biases is investigated. While this studyaddresses similar issues as in previous studies, it improveson the methodology by applying a fully coupled aerosol-cloud radiative transfer code at the pixel-level.
2. Data
2.1. CALIOP Layer Products
[10] We take advantage of the capability of CALIOPto detect optically thin and/or multiple layers to determinekey properties of the absorbing aerosol layer over thesoutheast Atlantic Ocean. Specifically, the Version 3.01
CALIOP level-2 5 km aerosol layer product is used to definethe aerosol layer top and bottom altitudes [Vaughan et al.,2009], as well as to provide estimates of the aerosol opticaldepth (AOD) derived from the 532 nm attenuated backscat-ter [Young and Vaughan, 2009]. Various data quality metricsand flags are used, following the best practice advice of theCALIPSO science team, to screen for reliable retrievals. Theseinclude the extinction Quality Control (QC), Cloud-AerosolDetermination (CAD) score, optical thickness uncertainty, andthe horizontal averaging scale required for feature detection.[11] The optically thin layer detection capability of CALIOP
for a daytime orbit is illustrated in Figure 1, which showsalong-orbit profiles of 532 nm total attenuated backscatter(Figure 1a) and feature classification type (and subtype forselect aerosols) (Figure 1b), obtained from the Vertical FeatureMask, for a scene off the west coast of Africa on 26 August2010 (13:11:09Z orbit). The backscatter plot (Figure 1a)shows a probable multilayer situation, with a broad region ofmodestly enhanced backscatter, located roughly between6�N and 15�S latitude and 2 to 4.5 km altitude, overlying avery bright, geometrically thin layer at around 1 km altitude.CALIOP identifies the low-altitude, bright layer as clouds(light blue or red for type classification results with low/noconfidence), while the broad overlying region is identified asaerosols, primarily of the smoke subtype (dark gray).[12] It is interesting to note, however, that portions of the
smoke layer in Figure 1b are identified as polluted dust(maroon) or other aerosol subtypes (orange or dark brown forlow/no confidence). This apparent type misclassification canadversely affect smoke aerosol sampling. Other sampling issues
Figure 1. (a) CALIOP 532 nm total attenuated backscatter and (b) vertical feature mask featureclassification obtained at 13:11:09Z (daytime orbit) on 26 August 2010.
MEYER ET AL.: ABOVE-CLOUD DARE FROM MODIS AND CALIOP
4803
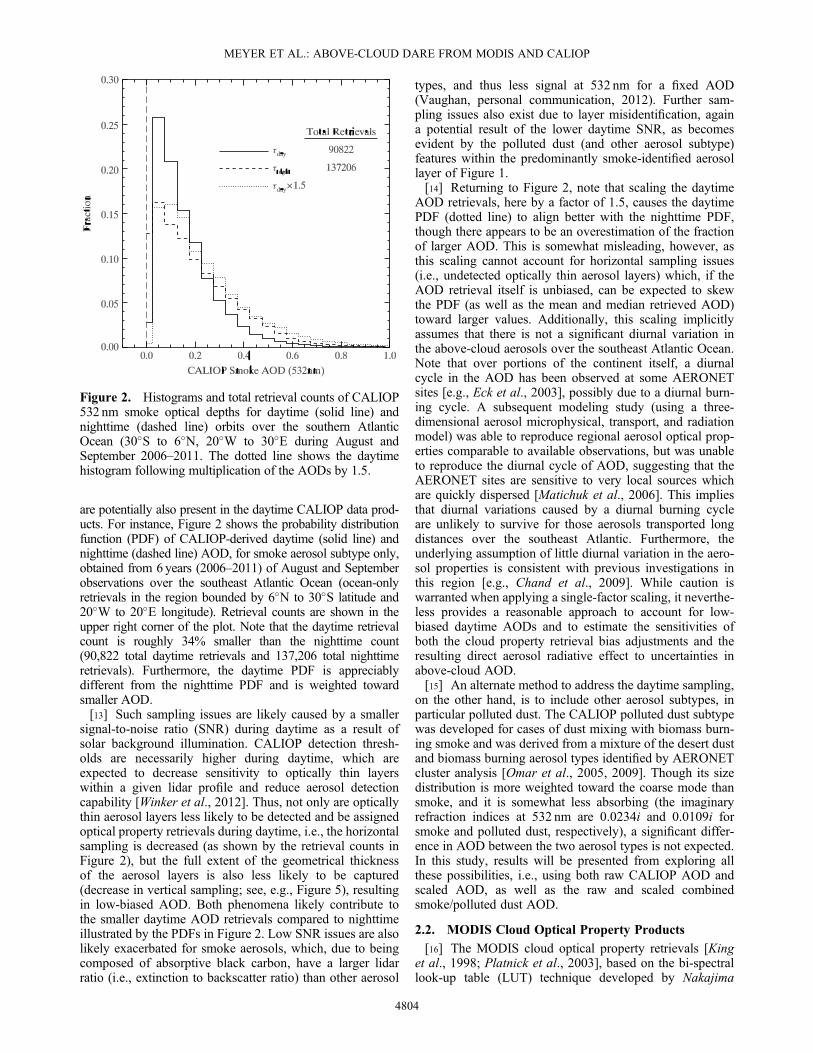
are potentially also present in the daytime CALIOP data prod-ucts. For instance, Figure 2 shows the probability distributionfunction (PDF) of CALIOP-derived daytime (solid line) andnighttime (dashed line) AOD, for smoke aerosol subtype only,obtained from 6years (2006–2011) of August and Septemberobservations over the southeast Atlantic Ocean (ocean-onlyretrievals in the region bounded by 6�N to 30�S latitude and20�W to 20�E longitude). Retrieval counts are shown in theupper right corner of the plot. Note that the daytime retrievalcount is roughly 34% smaller than the nighttime count(90,822 total daytime retrievals and 137,206 total nighttimeretrievals). Furthermore, the daytime PDF is appreciablydifferent from the nighttime PDF and is weighted towardsmaller AOD.[13] Such sampling issues are likely caused by a smaller
signal-to-noise ratio (SNR) during daytime as a result ofsolar background illumination. CALIOP detection thresh-olds are necessarily higher during daytime, which areexpected to decrease sensitivity to optically thin layerswithin a given lidar profile and reduce aerosol detectioncapability [Winker et al., 2012]. Thus, not only are opticallythin aerosol layers less likely to be detected and be assignedoptical property retrievals during daytime, i.e., the horizontalsampling is decreased (as shown by the retrieval counts inFigure 2), but the full extent of the geometrical thicknessof the aerosol layers is also less likely to be captured(decrease in vertical sampling; see, e.g., Figure 5), resultingin low-biased AOD. Both phenomena likely contribute tothe smaller daytime AOD retrievals compared to nighttimeillustrated by the PDFs in Figure 2. Low SNR issues are alsolikely exacerbated for smoke aerosols, which, due to beingcomposed of absorptive black carbon, have a larger lidarratio (i.e., extinction to backscatter ratio) than other aerosol
types, and thus less signal at 532 nm for a fixed AOD(Vaughan, personal communication, 2012). Further sam-pling issues also exist due to layer misidentification, againa potential result of the lower daytime SNR, as becomesevident by the polluted dust (and other aerosol subtype)features within the predominantly smoke-identified aerosollayer of Figure 1.[14] Returning to Figure 2, note that scaling the daytime
AOD retrievals, here by a factor of 1.5, causes the daytimePDF (dotted line) to align better with the nighttime PDF,though there appears to be an overestimation of the fractionof larger AOD. This is somewhat misleading, however, asthis scaling cannot account for horizontal sampling issues(i.e., undetected optically thin aerosol layers) which, if theAOD retrieval itself is unbiased, can be expected to skewthe PDF (as well as the mean and median retrieved AOD)toward larger values. Additionally, this scaling implicitlyassumes that there is not a significant diurnal variation inthe above-cloud aerosols over the southeast Atlantic Ocean.Note that over portions of the continent itself, a diurnalcycle in the AOD has been observed at some AERONETsites [e.g., Eck et al., 2003], possibly due to a diurnal burn-ing cycle. A subsequent modeling study (using a three-dimensional aerosol microphysical, transport, and radiationmodel) was able to reproduce regional aerosol optical prop-erties comparable to available observations, but was unableto reproduce the diurnal cycle of AOD, suggesting that theAERONET sites are sensitive to very local sources whichare quickly dispersed [Matichuk et al., 2006]. This impliesthat diurnal variations caused by a diurnal burning cycleare unlikely to survive for those aerosols transported longdistances over the southeast Atlantic. Furthermore, theunderlying assumption of little diurnal variation in the aero-sol properties is consistent with previous investigations inthis region [e.g., Chand et al., 2009]. While caution iswarranted when applying a single-factor scaling, it neverthe-less provides a reasonable approach to account for low-biased daytime AODs and to estimate the sensitivities ofboth the cloud property retrieval bias adjustments and theresulting direct aerosol radiative effect to uncertainties inabove-cloud AOD.[15] An alternate method to address the daytime sampling,
on the other hand, is to include other aerosol subtypes, inparticular polluted dust. The CALIOP polluted dust subtypewas developed for cases of dust mixing with biomass burn-ing smoke and was derived from a mixture of the desert dustand biomass burning aerosol types identified by AERONETcluster analysis [Omar et al., 2005, 2009]. Though its sizedistribution is more weighted toward the coarse mode thansmoke, and it is somewhat less absorbing (the imaginaryrefraction indices at 532 nm are 0.0234i and 0.0109i forsmoke and polluted dust, respectively), a significant differ-ence in AOD between the two aerosol types is not expected.In this study, results will be presented from exploring allthese possibilities, i.e., using both raw CALIOP AOD andscaled AOD, as well as the raw and scaled combinedsmoke/polluted dust AOD.
2.2. MODIS Cloud Optical Property Products
[16] The MODIS cloud optical property retrievals [Kinget al., 1998; Platnick et al., 2003], based on the bi-spectrallook-up table (LUT) technique developed by Nakajima
Figure 2. Histograms and total retrieval counts of CALIOP532 nm smoke optical depths for daytime (solid line) andnighttime (dashed line) orbits over the southern AtlanticOcean (30�S to 6�N, 20�W to 30�E during August andSeptember 2006–2011. The dotted line shows the daytimehistogram following multiplication of the AODs by 1.5.
MEYER ET AL.: ABOVE-CLOUD DARE FROM MODIS AND CALIOP
4804

and King [1990] and Platnick and Twomey, [1994], provideestimates of both cloud optical thickness (COT) and effec-tive particle radius (re) for the liquid and ice cloud phases.While the archived data product name for these retrievals isMOD06 and MYD06 for Terra and Aqua, respectively, wewill generically refer to the retrieval algorithm as MOD06because the same algorithm is used for both sensors. The stan-dard MOD06 retrieval mainly pairs one of three nonabsorbing(or relatively nonabsorbing) VIS/NIR channels (0.66, 0.86,and 1.24mm), sensitive mainly to COT, with an absorbingSWIR or MWIR channel that is sensitive to re. The specificVIS/NIR channel selection depends on the underlying surfacetype (i.e., 0.66mm over land, 0.86mm over water, and 1.24mmover snow/ice). For the standard MOD06 retrieval used in thisstudy, 2.1mm is the SWIR channel of choice for effectiveparticle radius retrievals (re2.1); because the focus is on thesoutheast Atlantic Ocean, all COT retrievals used here arederived from the 0.86mm NIR channel only.[17] In the present investigation, all MODIS cloud retrievals
are performed using a research-level version of MOD06 thatincorporates most of the significant changes and advance-ments that constitute the upcoming (at the time of writing)Collection 6 reprocessing effort. These include using fullLUTs across the full range of COT rather than asymptotictheory at large COTs, enhancements in the DISORT [Stamneset al., 1988] forward radiative transfer (RT) code used for LUTgeneration, and various modifications to ancillary data use.Perhaps the most significant change, however, and the onemost pertinent to the present investigation, is the handlingof ocean surface reflectance. In the current Collection 5MOD06, the ocean surface is assumed to be a Lambertianreflector with a diffuse illumination (below cloud) albedo of5%, typically suitable underneath clouds with optical thick-ness greater than about 3. For Collection 6, a Cox-MunkBRDF [Cox and Munk, 1954a, 1954b] is introduced to more
accurately account for the angular and wind speed dependenceof ocean surface reflectance, which manifests itself mostnotably at Sun glint geometries. This new ocean surface modelis expected to especially impact retrievals of optically thinclouds (COT roughly 3 or less), when the ocean surfacereceives more direct illumination. It should be pointed out that,even though this investigation uses the Collection 6 MOD06algorithms, the current publically available Collection 5retrievals (the operational version at the time of writing) willsuffer the same effects from above-cloud absorbing aerosolsas those shown here.[18] Similar to CALIOP, the MODIS products are also
susceptible to sampling issues. Because MOD06 relies onthe assumption of homogeneous plane-parallel clouds, theretrievals may not be useful at cloud edges or for other partlycloudy scenes where cloud inhomogeneity and 3-D effectscan be significant. Such pixels can be identified by subpixeltests (using the 250m 0.66 and 0.86 mm VIS channels) orcloud edge detection tests (defined by the MODIS cloudmask, MOD35) [Zhang and Platnick, 2011; Pincus et al.,2012], and in Collection 5 are not processed. Retrievals areattempted on this partly cloudy pixel population in theCollection 6 code, though in many cases the retrieval fails(observations are outside the solution space) and the solutionnearest to the LUT space is provided. Both partly cloudyand failed retrieval pixels are excluded from the presentstudy; together they account for roughly 27% of thepixels identified by MOD35 as being not clear over thisregion and season.[19] The collocation of MODIS and CALIOP is accom-
plished using the method detailed in Holz et al. [2008].Spatial sampling is confined to the CALIPSO ground trackand is further constrained by the aforementioned samplinglimitations of both CALIOP and MODIS. Moreover, thecollocation itself can introduce further uncertainties: Collo-cation at ground level can result in a large parallax effect,particularly for large viewing zenith angles (VZA) or cloudsat high altitudes (or, worse, when both occur simultaneously).The parallax effect is not expected to be significant here, how-ever, as the MODIS VZA for collocated pixels is relativelysmall (the CALIPSO ground track is only roughly 200 kmoff MODIS nadir) and the MBL cloud top altitudes aretypically less than 2 km (see Figure 5 below).[20] Figure 3 shows a 2� aggregation of the MYD06 Col-
lection 6 liquid phase cloud optical property retrieval frac-tion for pixels collocated with the CALIPSO ground trackduring August and September 2006–2011. Here cloudretrieval fraction is defined as the number of collocatedMODIS pixels with successful liquid cloud COT and reretrievals divided by the total number of collocated MODISpixels within each grid box. Over the southeast Atlantic, thecloud retrieval fraction can be quite large, approachingroughly 0.8 off the coast of Namibia. It is important to notethat the cloud retrieval fraction is smaller than the cloudfraction derived from the cloud mask product (MYD35),since not all pixels identified by MYD35 as cloudy havesuccessful COT and re retrievals (largely a result of thecloud edge issues discussed above). Nevertheless, the spatialpattern shown in Figure 3 is in good agreement with theAqua MODIS level-3 (MYD08_M3) global griddedmonthly mean cloud fractions for August and September(not shown).
Figure 3. MYD06 Collection 6 liquid cloud retrievalfraction (i.e., fraction of pixels with successful COT and reretrievals) for pixels collocated with the CALIPSO groundtrack during August and September 2006–2011 aggregatedto a 2� grid.
MEYER ET AL.: ABOVE-CLOUD DARE FROM MODIS AND CALIOP
4805

[21] The 2� aggregation of MYD06 mean retrieved COTand re without accounting for overlying aerosols are shownin Figures 4a and 4b, respectively. The time period andgeographical region are the same as for Figure 3 and subse-quent figures. COT is relatively uniform off the coast,whereas re generally increases toward the southwest.
3. CALIOP Aerosol Layer Statistics
[22] Six years of the CALIOP Version 3.01 5 km Cloudand Aerosol Layer Products (2006–2011) for August andSeptember have been used to generate statistics of thespatial distribution of the properties of absorbing aerosoland underlying clouds over the southeast Atlantic Ocean.Here CALIOP observations are restricted to the geographicregion bounded by 6�N to 30�S and 20�W to 20�E. Theaerosol statistics consist of mean layer top and bottom alti-tudes, as well as 532 nm layer AOD; cloud statistics includeonly cloud top altitude (CALIOP MBL cloud base altitudescan be significantly biased high as the signal is quite oftentotally attenuated within the cloud, as is evident in Figure 1).Only daytime CALIPSO orbits are considered here due tothe daytime-only constraint on the MYD06 cloud opticalproperty retrievals. The CALIOP Feature ClassificationFlags, included in both the Aerosol and Cloud Layer Prod-ucts, are used to filter for aerosol and cloud type; here only
the smoke type is considered for the absorbing aerosol layer,while for clouds four subtypes are considered, namely, trans-parent and opaque low overcast, transition stratocumulus,and low broken cumulus. Additionally, the aerosol layer prod-ucts are further screened for data quality using the 532 nmlayer optical depth uncertainty (must be less than 99.9), the532 nm extinction QC flag (must be less than 2), and theCAD score (must be less than �30); because only cloud topaltitude is considered, only the CAD score is used (greater than30), with no additional optical property quality screening.[23] Figure 5 shows the daytime (Figure 5a) and nighttime
(Figure 5b) meridional mean smoke and cloud layer top(solid and dashed lines, respectively) and smoke bottom (dot-ted line) altitudes, as well as low/stratus cloud fraction(gray lines), averaged every 2� longitude for the latitude zonebetween 6�N and 30�S. Here the coast of Africa is locatedroughly around 10�E–15�E longitudes. The two mean layerseither fully converge (nighttime) or nearly converge (daytime)to the east of this boundary over the continent, though thecorresponding cloud fractions are quite low. Moving west ofthis boundary, however, over the southern Atlantic Ocean,despite the increase of mean cloud top altitude (by roughly0.5 km) with increasing boundary layer height, the twolayers are consistently separated by roughly 2 km duringdaytime and 1.5 km during nighttime. Statistically, thissuggests that off the coast there is little entrainment of the
Figure 4. MYD06 Collection 6 liquid cloud mean retrieved (a) COT and (b) re for pixels collocated withthe CALIPSO ground track during August and September 2006–2011 aggregated to a 2� grid. Retrievaldifferences after adjusting for above-cloud aerosol absorption, averaged over all collocated ocean-onlycloudy pixels, are shown for (c) COT and (d) re. Because the retrieval adjustment is only performed overthe ocean, grid boxes in which the surface is predominantly land are shaded gray in Figures 4c and 4d.
MEYER ET AL.: ABOVE-CLOUD DARE FROM MODIS AND CALIOP
4806

smoke layer into the underlying MBL cloud deck. Thisdoes not necessarily mean that entrainment never occurs,however, since the sensitivity of CALIOP to the opticallyvery thin aerosol layer base may be affecting detection.Note also that the potential daytime vertical sampling issuesdiscussed earlier in section 2.1 are evident here, as thedetected smoke base altitude is over 0.5 km higher duringthe daytime than during the nighttime.[24] Gridded layer statistics, calculated on a 2� grid, are
shown in Figure 6. Here grid boxes with layer detectionfrequencies smaller than 20% of the mean count of detectedaerosol layers for the entire region are excluded. This addi-tional screening removes statistically insignificant grid boxes,particularly in the southwest portion of the region, whereCALIOP infrequently observes, or is unable to detect,smoke-type aerosols. Shown here are the CALIOP meansmoke base altitude (Figure 6a), mean cloud top altitude(Figure 6b), mean layer separation (i.e., smoke base altitudeminus cloud top altitude) (Figure 6c), and mean smoke layerAOD at 532 nm (Figure 6d). Gray regions denote missingdata, primarily due to grid boxes with insufficient aerosol layercounts. Cloud top altitude exhibits minima (less than 1 km)over the ocean near the coast, and increases moving westward,to between 1.5 and 2 km near 20�W longitude (consistent withFigure 5, where the minimum is located near 11�E). Smokebase altitude generally increases moving toward the south-west, from roughly 3 km to 4 km or higher. A trend in meanlayer separation (Figure 6c) is discernible, with separationdistance decreasing from south to north (from, respectively,approximately 3 km to 2 km or smaller). Note also the negativelayer separation (i.e., layer overlap) over the continent, due tothe location of biomass burning. There is little evidence ofentrainment during the daytime over the Atlantic, however,
as the fraction of profiles in this region with smoke base alti-tude less than cloud top altitude (not shown here) is near zero,though again the reduced sensitivity of CALIOP to opticallythin scattering layers during daytime may be a contributingfactor. Interestingly, an analysis of nighttime orbits (also notshown) does in fact indicate potential aerosol entrainment intothe cloud over the Atlantic, particularly in the northwestsection of the region where the detected smoke base is belowthe cloud top in up to 10% of the profiles in some grid boxes.[25] As expected, the mean smoke layer AOD in Figure 6b
is greatest over the continent (near 0.5) close to the biomassburning source. Moving westward over the southeasternAtlantic, in the general direction of atmospheric transport,the mean smoke layer AOD gradually decreases to less than0.25. Analysis of the less noisy nighttime orbits (again notshown here) reveals a much more extensive smoke layer,as well as larger mean AOD, suggesting again that thedaytime AOD is indeed systematically underestimated (aspreviously mentioned in Figure 2 discussion).
4. Correcting MOD06 for AbsorbingAerosol Extinction
[26] To account for the effects of overlying absorbingaerosols on MOD06 cloud optical property retrievals,combined cloud-aerosol optical property LUTs have beencreated. This is accomplished by inserting an absorbingaerosol layer of varying optical thickness over the liquidphase cloud layer in the forward RT calculations. Similarto the standard MOD06 LUTs, particularly for the upcomingCollection 6, the new tables are created under the assump-tion of an otherwise transparent atmosphere (gaseousabsorption is added during the retrieval process along with aRayleigh correction for the VIS channel), with Cox-Munkocean surface reflectance averaged over all wind directions atthree wind speeds (3, 7, and 15m s�1). The LUTs are other-wise identical to their MOD06 counterparts with respect toCOT, re, and angle space, with the exception of the VZA,which is constrained to the angle space typical of the collo-cated pixels along the CALIPSO track.[27] The above-cloud aerosol bulk optical and microphys-
ical properties are estimated based on the absorbing aerosolmodels developed for the MODIS Collection 5 AerosolProduct (MOD04). The MOD04 aerosol models define aero-sol size distributions and refractive indices dependent solelyon prescribed AOD at 0.55 mm (MODIS band 4; note thatthe absorbing aerosol model used here assumes a singleindex of refraction, 1.51–0.02i, at all wavelengths). Band-averaged scattering properties (scattering phase function,single-scatter albedo, asymmetry parameter, etc.) for therelevant MODIS spectral channels (0.86, 2.1 mm) arecomputed using the MIEV Mie code [Wiscombe, 1980] fordistinct wavelengths and subsequent integration over thedetector mean spectral response functions. The resultingbulk optical properties are generally in good agreement withthose of Levy et al. [2009] even though the operationalMOD04 bulk properties are calculated at the band-centerwavelength, and not averaged over the MODIS spectralresponse functions. The bulk asymmetry parameter (g),single scatter albedo (oo), and extinction efficiency (Qe)calculated for an aerosol layer with AOD 0.5 at wavelength0.55 mm are shown in Figure 7.
Figure 5. Meridionally averaged smoke aerosol subtypetop and bottom heights (solid and dotted lines, respectively),and low/stratus cloud top height (dashed line) and cloudfraction (gray line), calculated from 6 years of August andSeptember CALIOP (a) daytime and (b) nighttime observa-tions (2006–2011). Data are located between 6�N and 30�S.
MEYER ET AL.: ABOVE-CLOUD DARE FROM MODIS AND CALIOP
4807

[28] Using the aerosol bulk properties, five modified liquidphase cloud LUTs are created, one each for five differentabove-cloud AODs (0.05, 0.1, 0.2, 0.4, and 0.8 at0.55 mm). For LUT selection, the five AODs are scaled tothe CALIOP wavelength of 0.532 mm using the MOD04wavelength-dependent bulk extinction efficiencies (Qe).Figure 8 shows an example of a standard MOD06 watercloud LUT (black lines) and the corresponding coupledaerosol-cloud LUT (red lines). Here the above-cloud AODis 0.4 at wavelength 0.55 mm (a somewhat extreme valuegiven the AOD distribution in Figure 2), and the surfacewind speed is 3m s�1. Similar to the findings of Haywoodet al. [2004], accounting for above-cloud aerosol absorptionshifts the LUT toward smaller VIS reflectances, yieldinglarger COT retrievals for a constant value of VIS reflectance.[29] A given cloudy MODIS pixel is deemed to have
above-cloud absorbing aerosols if the collocated CALIOPAerosol Layer Product provides an AOD retrieval ofsufficient quality within the pixel’s field of view. Specifi-cally, the 532 nm feature optical depth uncertainty must beless than 99, the extinction QC flag less than 2, the CADscore less than �30, and layer top pressure smaller thanthe MYD06 cloud top pressure; an additional constraint isprovided by the CALIOP feature subtype (e.g., smoke,
Figure 6. August/September (2006–2011) mean daytime CALIOP (a) smoke layer base altitude,(b) cloud layer top altitude, (c) smoke/cloud layer separation (i.e., smoke layer base altitude minus cloudlayer top altitude), and (d) smoke layer AOD at 532 nm.
Figure 7. Aerosol bulk scattering properties derived fromthe MODIS Collection 5 Aerosol Product (MOD04) absorb-ing aerosol model. Shown here are the asymmetry parameter(g), single-scatter albedo (oo), and extinction efficiency (Qe)as a function of wavelength, assuming an AOD of 0.5 atwavelength 0.55 mm. Triangles denote the spectral locationsof the MODIS cloud property retrieval channels, as well asthe 0.55 mm MODIS aerosol channel and the 0.532 mmCALIOP wavelength.
MEYER ET AL.: ABOVE-CLOUD DARE FROM MODIS AND CALIOP
4808

polluted dust). Aerosol-contaminated cloudy pixels thenfollow an alternate retrieval path within the experimentalMOD06, in which the CALIOP 532nm AOD is used toidentify an appropriate aerosol/cloud LUT (i.e., a linearly inter-polated LUT from the nearest two of the five defined above-cloud AODs). From here the MOD06 retrieval proceeds asusual, providing a bias-adjusted cloud optical property retrievalaccounting for above-cloud absorbing aerosol attenuation.[30] The gridded mean relative increases in MYD06 COT
and re retrievals after adjusting for the attenuation by above-cloud absorbing aerosols are shown in Figures 4c and 4d,respectively. Here retrieval differences are averaged over allcloudy liquid water phase MODIS pixels (excluding partialretrievals and cloud edge pixels which are expected to be
partly cloudy to some extent [Pincus et al., 2012]) during theentire 6 year period (August/September 2006–2011). Bias-adjusted MOD06 retrievals are performed for ocean-onlypixels in which CALIOP detects above-cloud smoke typeaerosols. Grid boxes over predominantly land surfaces areshaded gray, though some grid boxes containing the coastare nevertheless retained as the ocean-only retrieval count ineach is sufficiently large. As expected, the COT retrievaldifferences are greatest near the coast, where the above-cloud AOD is generally larger (see Figure 6d), and graduallydecrease westward. Averaged over the entire region, theretrieved COT increases by roughly 6%. Note that whilegenerally smaller than the COT differences, re also exhibitsnoticeable differences, with a regional mean increase of roughly2.6%. An analysis of the retrievals (not shown here) reveals thatthese re differences are a strong function of COT and are muchless dependent on the overlying AOD (one can see in Figure 7that the aerosol extinction and single scattering albedo are sig-nificantly weaker at 2.1mm than at 0.86mm). The re differencesin fact increase rather dramatically with decreasing COT. Theycan therefore be attributed to LUT non-orthogonality (i.e., theCOT and re retrievals are not completely independent), particu-larly at small COT.[31] Figure 9 shows the histograms of MYD06 liquid
cloud optical thickness for the entire 6 year period for pixelswith and without an overlying absorbing aerosol layer(dashed and solid black lines, respectively), as determinedusing the CALIOP smoke-only subtype (Figure 9a) andsmoke and polluted dust subtypes (Figure 9b). Also shownare the histograms of the bias-adjusted MYD06 COT usingthe unscaled and scaled CALIOP above-cloud AOD (blueand red lines, respectively). Note that the polluted cloudypixels retrieved without the aerosol correction generallyexhibit smaller COT than do the clean cloudy pixels, asexpected due to the above-cloud attenuation of the VISchannel. In addition, the increased horizontal samplingdue to inclusion of the polluted dust aerosol subtype isevident when comparing the polluted cloudy pixel countsin Figures 9a and 9b. Adjusting COT for the effects ofabove-cloud absorbing aerosols shifts the histogram toward
Figure 8. Visual representation of bi-spectral cloud opticalproperty retrieval look-up tables (LUT). The standardMOD06 liquid water cloud LUT is shown in black; thenew coupled cloud-aerosol LUT is shown in red. Attenua-tion at 0.86 mm by the above-cloud absorbing aerosols shiftsthe LUT toward smaller 0.86 mm reflectances, yieldinglarger COT retrievals for the same reflectance.
Figure 9. Histograms of MYD06 unadjusted cloud optical thickness for cloudy pixels with and withoutCALIOP above-cloud absorbing aerosols (dashed and solid black lines, respectively), as well as bias-adjusted cloud optical thickness using the CALIOP un-scaled and scaled (x1.5) above-cloud AOD(blue and red lines, respectively). (a) Retrievals using CALIOP smoke-only subtype AOD. (b) Retrievalsusing CALIOP smoke and polluted dust subtype AOD.
MEYER ET AL.: ABOVE-CLOUD DARE FROM MODIS AND CALIOP
4809

larger values, as expected. Moreover, scaling the above-cloud AOD to account for the observed differences in thedaytime/nighttime CALIOP data further shifts the retrievedCOT toward larger values.[32] Table 1 provides the mean, median, and standard
deviation of MYD06 ocean-only COT and re for both thesmoke-only and smoke/polluted dust aerosol subtypes. Theclean cloudy pixel retrievals have larger mean and medianCOT and re than the retrievals under polluted conditions,but with aerosol ignored (note that adding the polluted dustsubtype modifies the pixel sampling, and thus results indifferent clean cloudy pixel statistics). When the above-cloud aerosol attenuation is accounted for, larger mean andmedian adjusted COT and re are obtained for the pollutedcloudy pixels. Note that the rows labeled “Corrected WithAOD Scaling” refer to scaling CALIOP above-cloud AODretrievals by the factor 1.5 as discussed in section 2.1 andFigure 2. Interestingly, despite the sampling differencesbetween the different pixel populations, there is little statis-tical difference between the clean and bias-adjusted pollutedcloudy pixels using the scaled AODs (both smoke-only andsmoke/polluted dust). The good agreement in the statisticsshown here may be partly fortuitous, however, as daytimeCALIOP sampling issues cannot be entirely resolved, andthermodynamic or meteorological factors may also affectdaytime/nighttime AOD differences.
5. Aerosol and Cloud Radiative Effect Analysis
[33] Estimating the above-cloud direct aerosol radiativeeffect (DARE) of the absorbing aerosols is accomplishedthrough solar broadband radiative transfer (RT) calculationsusing the RRTMG-SW RT code [Clough et al., 2005; Iaconoet al., 2008]. In RRTMG-SW, gaseous absorption is treatedusing the correlated k approach; the delta-Eddington [Josephet al., 1976] two-stream approximation [Meador and Weaver,1980; Oreopoulos and Barker, 1999] is used for scattering.Broadband solar fluxes are calculated from 14 widebandfluxes of variable width between 0.2 and 12.0mm. Here thetop of atmosphere (TOA) DARE associated with a cloudypixel is defined as
DAREcloudy ¼ F"cloud � F"
cloudþaerosol (1)
where F"cloud and F"
cloudþaerosol are the upwelling broadbandTOA SW fluxes for the cloud only and the cloud with over-lying aerosol, respectively. Another measure of aerosol radi-ative effect, the TOA DARE per unit AOD, or radiativeforcing efficiency (RFE), can be obtained by normalizingDAREcloudy by the above-cloud AOD, such that
RFE ¼ DAREcloudy=AOD (2)
Table 1. Scalar Statistics of MYD06 Cloud Optical Properties
CALIOP Aerosol Type
Cloud Optical Thickness Cloud Effective Radius
Mean Median s Mean Median s
Smoke only Clean 8.9 7.0 7.1 12.9 11.8 5.3Polluted, uncorrected 6.5 5.2 4.7 10.9 9.9 4.3Polluted, corrected 7.7 6.0 8.8 12.1 10.9 4.9Polluted, corrected with AOD scale 8.9 6.4 14.1 12.8 11.4 5.4
Smoke and polluted dust Clean 9.1 7.1 7.2 13.0 11.9 5.3Polluted, uncorrected 7.1 5.7 5.1 11.0 10.0 4.3Polluted, corrected 7.9 6.3 6.5 11.9 10.8 4.8Polluted, corrected with AOD scale 8.7 6.7 9.9 12.5 11.2 5.2
Figure 10. Gridded mean instantaneous (i.e., time of observation) above-cloud direct aerosol radiativeeffect (DARE) at (a) TOA and (b) aerosol radiative forcing efficiency (RFE), averaged over the 6 yearCALIOP/MODIS collocated data record (August/September 2006–2011), for cloudy MODIS pixels forwhich CALIOP produces a reliable above-cloud smoke subtype aerosol retrieval.
MEYER ET AL.: ABOVE-CLOUD DARE FROM MODIS AND CALIOP
4810

[34] RFE is useful because it removes in effect the DAREdependence on above-cloud AOD and isolates the impactsof the change in the underlying cloud properties.[35] The broadband RT calculations depend on both COT
and re, in addition to AOD in the case of cloud with overly-ing aerosol. It is evident from equation (1) that for absorbingaerosols overlying bright clouds DAREcloudy (hereafterreferred to simply as DARE) is positive (i.e., warming) sinceF"cloudþaerosol is smaller than F"
cloud due to the aerosol attenua-tion. Note that the calculations presented here pertain to thetime of observation only (near local noon for Aqua over-pass), i.e., they are instantaneous values. Because the biasesin re are caused by biases in COT (as discussed in section 4),the differences in DARE discussed below are framed interms of COT.[36] All above-cloud absorbing aerosol properties are
provided by CALIOP, including AOD and layer top andbase altitudes. The MOD04 absorbing aerosol model is usedto scale the spectrally dependent AOD to the 14 solar bandsof RRTMG-SW, as well as to provide band-averaged scat-tering and absorption properties (i.e., single-scattering albedoand asymmetry parameter). Cloud properties are provided byAqua MODIS, and include re, LWP (a function of both COTand re), and cloud top pressure (CTP). Atmospheric profileinformation is obtained from the ancillary data sets used inMOD06, namely, the National Centers for EnvironmentalPrediction (NCEP) Global Data Assimilation System (GDAS)reanalysis product [Derber et al., 1991]. Additionally, theinstantaneous TOA downwelling solar flux (adjusted forEarth/Sun distance) is calculated from the total solar irradi-ance, pixel-level solar zenith angle (obtained from theMODISLevel 1 Geolocation product (MOD03)), and day of year.
[37] The gridded mean instantaneous TOA DARE(Wm�2) and RFE (Wm�2AOD�1) for cloudy MODIS pixelsin which CALIOP provides a reliable above-cloud smokesubtype aerosol retrieval are shown in Figures 10a and10b, respectively. Data are averaged over the entire 6 yearcollocated CALIOP/MODIS dataset (August/September2006–2011). Gray regions denote grid boxes with insuffi-cient smoke subtype layer counts (i.e., less than 20% ofthe mean detected layer count for the entire region). Notethat the DARE and RFE estimates shown here are calculatedusing the bias-adjusted cloud optical properties. It is evidentthat DARE is strongest near the coast, in roughly the same
Figure 11. Mean instantaneous (i.e., at time of observa-tion) above-cloud DARE at TOA (equation (1)), for cloudyMODIS pixels for which CALIOP produces reliableabove-cloud smoke subtype aerosol retrievals, as a functionof both COT and above-cloud AOD.
Figure 12. Meridional mean instantaneous above-cloudDARE at TOA, averaged over the 6 year CALIOP/MODIScollocated data record (August/September 2006–2011), forcloudy MODIS pixels for which CALIOP produces (a) reli-able above-cloud smoke subtype and (b) smoke or polluteddust subtype aerosol retrievals (i.e., only the polluted cloudypixels). The solid and dashed lines denote TOA DAREusing the bias-adjusted and non-adjusted MYD06 COT,respectively; the black and gray lines denote the use ofCALIOP-derived above-cloud AOD and scaled AOD(x1.5), respectively. Also shown is the (c) meridional meanRFE for smoke subtype aerosols (Sm) and combinedsmoke/polluted dust (Sm/PD). Mean values for each case,averaged over the entire domain (30�S to 6�N, 20�W to30�E), are shown at the right of each plot.
MEYER ET AL.: ABOVE-CLOUD DARE FROM MODIS AND CALIOP
4811

region where the mean above-cloud AOD peaks, with meaninstantaneous values near 20Wm�2.[38] Note also in Figure 10 that mean DARE is near zero
or negative in some grid boxes. It was pointed out byTwomey [1977b] that an aerosol layer can result in a netwarming (TOA DARE> 0) or cooling (TOA DARE< 0),depending on the aerosol properties and the lower boundarycondition (i.e., underlying cloud reflectance for the presentapplication). This principle is evident in Figure 11, whichshows mean above-cloud DARE, calculated from thepixel-level smoke subtype only broadband RT calculationsused in Figure 10 (again, using the bias-adjusted cloud opti-cal properties), as a function of both above-cloud AOD andunderlying COT. Here as expected, the magnitude of DAREdecreases as AOD decreases. However, DARE also decreasesas the underlying clouds darken (i.e., as COT decreases),ultimately turning negative when COT is sufficiently small(for the smoke subtype analysis, this COT threshold is roughlybetween 2 and 4, depending on the overlying AOD). Thisbehavior was also observed in the analyses of Keil andHaywood [2003] and Chand et al. [2009], who found thatDARE became negative when the underlying cloud fractionfell below 56% and 40%, respectively.[39] Figure 12 shows meridional averages of the instanta-
neous TOA DARE for cloudy MODIS pixels with reliableCALIOP above-cloud smoke (Figure 12a) or smoke andpolluted dust (Figure 12b) subtype aerosol retrievals (i.e., onlypolluted cloudy pixels). Here the solid and dashed lines denoteDARE calculated using the aerosol-adjusted and non-adjustedMODIS cloud optical property retrievals, respectively; blackand gray lines denote the use of the standard CALIOP-derived above-cloud AOD and the scaled AOD (to adjustfor daytime CALIOP AOD biases, see section 2.1), respec-tively. It is clear that adjusting the MODIS cloud retrievalsto account for the above-cloud NIR attenuation can signifi-cantly affect radiative effect calculations. Indeed, using thenonadjusted cloud retrievals yields mean instantaneous TOADARE for the entire region of 6.6Wm�2 and 6.7Wm�2 forthe smoke and smoke/dust unscaled AOD, respectively, whileusing the bias-adjusted cloud retrievals yields 9.2Wm�2 and8.6Wm�2, respectively, a roughly 50% increase for each case.Scaling the CALIOP-derived AOD to empirically rectify thelow-biased daytime retrievals (gray lines) intuitively increasesTOADARE relative to that calculated from the unscaled AOD(means of 14.9Wm�2 and 13.7Wm�2 for the smoke andsmoke/dust cases, respectively); this is partly due not only tothe increased AOD, but also to even larger COT resulting froma larger bias adjustment.
[40] The meridional averages of the instantaneous TOARFE for polluted cloudy MODIS pixels are shown inFigure 12c. Again, the solid and dashed lines denote calcula-tions using the aerosol adjusted and nonadjusted MODIScloud optical property retrievals, respectively. Black andgray lines, however, denote the use of the CALIOP smokeAOD and the combined smoke/polluted dust AOD, respec-tively; because RFE is normalized by AOD, scaling theAOD by 1.5 yields only minimal differences. Similar tothe DARE calculations, using the bias-adjusted cloud opticalproperty retrievals increases the TOA RFE for both thesmoke case (50.9Wm�2AOD�1 to 65.1Wm�2AOD�1) andcombined smoke/polluted dust case (59.5Wm�2AOD�1 to71.2Wm�2AOD�1). Note also that the combined smoke/polluted dust cases have larger RFE than their respectivesmoke-only cases, underscoring the importance of AODspatial sampling.[41] A summary of the regional scalar statistics (mean and
standard deviation, s) of the DARE calculations shown inFigure 12, as well as DARE averaged over all ocean-onlywater clouds (both clean and polluted), is provided in Table 2.Similar to the polluted cloudy DARE calculations, the meanDARE averaged over all clouds increases when using bias-adjusted cloud retrievals; the effects of changes in horizontalsampling due to the inclusion of the polluted dust subtype,however, is much more evident. In fact, the additionalsampling (there is roughly a 150% increase in polluted cloudypixels when including the polluted dust subtype) increases themean all-cloud DARE by roughly 120 to 160% compared tothe smoke subtype only calculations, or about 1Wm�2 forthe case using bias adjustments to both the cloud retrievalsand AOD.[42] Also shown in Table 2 is the difference between the
TOA DARE with and without the underlying clouds,<ΔDARE>, defined as
< ΔDARE >¼ DAREcloudy � DAREclear (3)
where DAREcloudy is defined by equation (1). DAREclear, theTOA DARE without the underlying clouds, is defined as
DAREclear ¼ F"clear � F"
aerosol (4)
whereF"clear andF
"aerosol are the upwelling TOA SW fluxes for
pristine sky and cloudless sky with absorbing aerosols,respectively. The quantity <ΔDARE> defined in equation(3) can be considered as the impact of clouds on the radiativeeffect of the overlying aerosols. This impact is larger whenusing the bias-adjusted MODIS cloud retrievals (means of
Table 2. Scalar Statistics of Estimated TOA Direct Aerosol Radiative Effect
CALIOP Aerosol Type
MYD06Bias
Adjustment
DARE (Wm�2) All Cloud DARE (W m�2) <ΔDARE>(W m�2)
Mean s Mean s Mean s
Smoke only No 6.6 9.8 0.3 2.6 16.8 12.6Yes 9.2 11.0 0.5 3.2 19.5 14.9
Smoke only, with AOD scale No 9.7 13.9 0.5 3.7 24.7 18.0Yes 14.9 17.0 0.7 4.9 29.9 22.9
Smoke and polluted dust No 6.7 9.2 0.8 3.9 15.3 12.0Yes 8.6 10.1 1.1 4.6 17.2 13.7
Smoke and polluted dust, with AOD scale No 9.8 13.1 1.2 5.6 22.6 17.1Yes 13.7 15.7 1.7 7.1 26.5 21.1
MEYER ET AL.: ABOVE-CLOUD DARE FROM MODIS AND CALIOP
4812

19.5Wm�2 and 17.2Wm�2 for the smoke and smoke/dustAOD, respectively) rather than the unadjusted cloud retrievals(means of 16.8Wm�2 and 15.3Wm�2 for the smoke andsmoke/dust AOD, respectively), although the relative differ-ences in <ΔDARE> are much smaller than the pollutedcloudy DARE differences (the absolute differences are roughlythe same). Larger impacts are also evident using the scaledAOD (means of 29.9Wm�2 and 26.5Wm�2 for the smokeand smoke/dust cases, respectively); here the relative differ-ences in <ΔDARE> due to AOD scaling are similar to thepolluted cloudy DARE differences.[43] Similar to previous investigations [e.g., Keil and
Haywood, 2003; Chand et al., 2009], the present analysisshows that the TOA DARE of absorbing aerosols overlyingMBL stratocumulus clouds is strongly dependent on theunderlying cloud properties. This result is not insignificant,particularly given that remote sensing retrievals of the underly-ing cloud optical properties themselves can be significantlybiased by the above-cloud aerosol absorption. Indeed, adjustingthe cloud retrievals to account for this bias can change theinstantaneous TOA DARE of a cloudy scene with overlyingabsorbing aerosols by at least 2Wm�2, as shown in Figure 12and Table 2. Similarly, increasing the AOD by 50% (i.e., scaledby 1.5 to account for the daytime CALIOP retrieval biases)yields DARE that is roughly up to 5Wm�2 larger. Moreover,Table 2 shows that for this region and season, the presence ofunderlying MBL stratocumulus clouds results in a change inDARE relative to clear skies (i.e.,<ΔDARE>) roughly a factorof two larger than the polluted cloudy DARE, a finding consis-tent with the case study analysis of Keil and Haywood [2003].Horizontal sampling of the aerosol layer is also a significantissue, particularly when averaging DARE over all (pollutedand unpolluted) liquid phase cloudy pixels. These resultsall have important implications, as they underscore the needfor accurate, unbiased representations of the spatial and tempo-ral morphologies and optical properties of both the aerosol andunderlying cloud layers.[44] Finally, it is worth emphasizing once more that the
results shown here are for instantaneous (at time of observa-tion) calculations. Because the Aqua overpass is near localnoon, these instantaneous values are likely substantiallylarger than daytime-averaged values of DARE. Performingsuch diurnal calculations would have been ill advised how-ever, primarily because properly accounting for the solarzenith angle dependence of coupled cloud-aerosol radiativetransfer requires information about the diurnal change ofcloud and aerosol properties, or a priori assumptions regard-ing their diurnal variations (note that previous studies suchas Chand et al. [2009] and Wilcox [2011] assume that cloudproperties remain constant). As such, they are beyond thescope of this investigation, although they do merit furtherexploration in future efforts.
6. Discussion and Conclusions
[45] Absorbing aerosols, such as biomass burning smoke,strongly absorb radiation at visible/near-infrared (VIS/NIR)wavelengths, and their presence above low-altitude cloudscan introduce biases in passive cloud optical propertyretrievals that use VIS/NIR channels (e.g., 0.86 mm overocean surfaces) to infer cloud optical thickness (COT). Herewe provide estimates of the biases in MODIS liquid cloud
optical property retrievals (MOD06) resulting from above-cloud absorbing aerosol extinction, and determine theimpacts of these biases on estimates of the above-clouddirect aerosol radiative effect (DARE). We focus particularlyon the southeast Atlantic Ocean during austral winter(August/September 2006–2011), when an extensive biomassburning smoke layer advected from southern Africa overlieswidespread marine boundary layer (MBL) clouds. Modify-ing MOD06 reflectance look-up tables (LUTs) to accountfor above-cloud absorbing aerosol attenuation increases theretrieved regional mean COT, averaged over this regionand season for polluted MBL clouds only (Table 1) and allMBL clouds (Figure 4), by roughly 18% and 6%, respec-tively (the regional mean retrieved cloud effective radius,re, increases by roughly 11% and 2.6%, respectively, dueto COT changes in the non-orthogonal LUTs used for theretrievals). Consequently, the magnitude of above-cloudinstantaneous (near local noon for Aqua overpass) DAREalso increases. For above-cloud aerosols identified byCALIOP as smoke, mean DARE in the study regionincreases from 6.6Wm�2 using the original MOD06 cloudretrievals to 9.2Wm�2 using the new cloud retrievals. Themean radiative impact of the underlying clouds on the radi-ative effect of the overlying absorbing aerosols relative toclear sky, <ΔDARE>, also increases from 16.8Wm�2 usingthe original cloud retrievals to 19.5Wm�2 using the newcloud retrievals.[46] It is important to place these estimated cloud optical
property and DARE differences in context with aggregatedretrieval uncertainties. Beginning with Collection 5, baselinepixel-level uncertainty estimates for both COT and re areprovided in MOD06. These uncertainties account for threeerror sources, namely, surface spectral albedo, combinedinstrument calibration and 1-D forward model errors, andabove-cloud water vapor absorption [Platnick et al., 2004].Uncertainty estimates for instantaneous AOD retrievals,accounting for SNR within a layer, instrument calibration,and accuracy of the lidar ratio, are likewise provided in theVersion 3 CALIOP Aerosol Layer Product [Young, 2010].Note that all error components of the COT, re, and AODuncertainty estimates are considered to be random anduncorrelated, and therefore yield no biases after a sufficientspatial and temporal aggregation of pixels. For the regionand season of interest, mean daily relative COT and rerandom uncertainties, averaged over all MODIS individualliquid phase cloud retrievals collocated with the CALIPSOground track, are approximately 11% and 14%, respectively;mean daily relative above-cloud AOD random uncertaintyis approximately 40%. Not accounting for above-cloudabsorbing aerosol extinction causes systematic biases in theretrieved cloud properties. Again, from Table 1, accountingfor these aerosols increases the mean liquid COT and re ofpolluted cloudy scenes by approximately 18% and 11%,respectively; using the CALIOP AOD adjusted for the day/night bias (i.e., daytime AOD increased by 50% to addressCALIOP sampling issues due to reduced daytime signal-to-noise ratio, SNR), the mean COT and re increase byapproximately 37% and 17%, respectively. While theseretrieval biases are roughly on par with the daily mean randomuncertainties, spatial and temporal aggregation decreasesthe random component roughly by the inverse of the squareroot of the number of days used in the analysis (assuming
MEYER ET AL.: ABOVE-CLOUD DARE FROM MODIS AND CALIOP
4813

individual error sources are uncorrelated from day to day, andthe number of pixels and mean values for each day are approx-imately equivalent). The bias will therefore dominate theaggregated root mean square (RMS) uncertainty (combinationof bias and random uncertainty). The COT biases, particularlywhen using CALIOP AOD adjusted for the day/night bias, aresubstantially larger than the respective mean daily randomuncertainty and so will dominate even more.[47] Furthermore, note that as discussed in section 5,
DARE is essentially a function of AOD, COT, and re. Sincethe aggregated COT and re RMS uncertainties are domi-nated by the biases due to above-cloud aerosol extinction,they are both effectively a function of the aggregated RMSuncertainty of the CALIOP AOD, which itself will be domi-nated by the bias component. Thus, the dominant componentto the temporally and spatially aggregated RMS uncertaintyof COT, re, or DARE is expected to be the CALIOPAOD biaswhich, assuming it is on the order of the day/night biasdiscussed in section 2.1, has been detailed in Tables 1 and 2and elsewhere. If however the CALIOP AOD bias is evenlarger than assumed here, as other results suggest (H. Jethva,personal communication), our DARE and <ΔDARE> esti-mates after AOD adjustment (14.9Wm�2 and 29.9Wm�2,respectively, for smoke subtype aerosols) should be consideredlower bounds.[48] Yet an additional caveat remains in our analysis. Spa-
tial sampling, limited here to the CALIPSO ground track,may also be limited by the MOD06 algorithm (e.g., partialretrievals or cloud edge pixels) and by the aforementionedlow daytime CALIOP SNR, which can decrease CALIOP’ssensitivity to optically thin aerosol layers (as well as to thefull extent of the geometrical thickness of the aerosol layer)and potentially result in undetected aerosol layers or aerosoltype misclassification. To expand the horizontal sampling,we included the polluted dust aerosol subtype as a smokeaerosol in the analysis, and found slight decreases in theCOT and re adjustments, DARE, and <ΔDARE> comparedto those using only the smoke aerosol subtype. Regardless ofthese caveats, it is clear that CALIOP provides a valuableresource for investigating above-cloud aerosols given its abil-ity to detect and retrieve optically thin atmospheric features.[49] A logical next step would be to expand the instanta-
neous, time of observation DARE calculations shown hereto provide estimates of daily averaged DARE, an exercise,however, that would introduce considerable uncertainty inthe DARE calculations due to the unknown diurnal variationin cloud and aerosol properties. In addition, exploiting thefull sampling potential of MODIS by expanding the analysisto full swath is of great interest; note that recent work hasshown promise toward obtaining full swath above-cloudabsorbing aerosol retrievals using OMI [Torres et al.,2012] and MODIS [Jethva et al., 2013]. But ultimately,this is another example of why A-Train intersensorsynergy has been, and will continue to be, important forexpanding the current knowledge of aerosols and theirradiative effects.
[50] Acknowledgments. The authors would like to thank NandanaAmarasinghe for his efforts to construct the cloud retrieval look-up tablesand Gala Wind for her extensive work on the development of the MOD06Collection 6 algorithm. In addition, the authors wish to thank Zhibo Zhangfor his generous intellectual support during the course of this work and RobLevy for his assistance with the aerosol component. The MODIS data used
in this study were acquired as part of the NASA’s Earth-Sun SystemDivision and archived and distributed by the MODIS Adaptive ProcessingSystem (MODAPS); CALIOP data were obtained from the NASA LangleyResearch Center Atmospheric Science Data Center. This research wassupported by the NASA Radiation Sciences Program.
ReferencesAckerman, A. S., M. P. Kirkpatrick, D. E. Stevens, and O. B. Toon (2004),The impact of humidity above stratiform clouds on indirect aerosolclimate forcing, Nature, 432, 1014–1017.
Albrecht, B. A. (1989), Aerosols, cloud microphysics, and fractional cloud-iness, Science, 245, 1227–1230.
Bond, T. C., and R. W. Bergstrom (2006), Light absorption by carbo-naceous particles: An investigative review, Aerosol Sci. Technol.,40, 27–67.
Chand, D., T. L. Anderson, R. Wood, R. J. Charlson, Y. Hu, Z. Liu, andM. Vaughan (2008), Quantifying above-cloud aerosol using spacebornelidar for improved understanding of cloudy-sky direct climate forcing,J. Geophys. Res., 113, D13206, doi:10.1029/2007JD009433.
Chand, D., R. Wood, T. L. Anderson, S. K. Satheesh, and R. J. Charlson(2009), Satellite-derived direct radiative effect of aerosols dependent oncloud cover, Nat. Geosci., 2, 181–184.
Clough, S. A., M. W. Shephard, E. J. Mlawer, J. S. Delamere, M. J. Iacono,K. Cady-Pereira, S. Boukabara, and P. D. Brown (2005), Atmosphericradiative transfer modeling: A summary of the AER codes, J. Quant.Spectrosc. Radiat. Transfer, 91, 233–244.
Cox, C., andW.Munk (1954a), Measurements of the roughness of the sea surfacefrom photographs of the Sun’s glitter, J. Opt. Soc. Am., 44, 838–850.
Cox, C., and W. Munk (1954b), Statistics of the sea surface derived fromSun glitter, J. Mar. Res., 13, 198–227.
Derber, J. C., D. F. Parrish, and S. J. Lord (1991), The new global opera-tional analysis system at the National Meteorological Center, Weath.Forec., 6, 538–547.
Devasthale, A., and M. A. Thomas (2011), A global survey of aerosol-liquidwater cloud overlap based on four years of CALIPSO-CALIOP data,Atmos. Chem. Phys., 11, 1143–1154, doi:10.5194/acp-11-1143-2011.
de Graaf, M., L. G. Tilstra, P. Wang, and P. Stammes (2012), Retrieval ofthe aerosol direct radiative effect over clouds from spaceborne spectrom-etry, J. Geophys. Res., 117, D07207, doi:10.1029/2011JD017160.
Eck, T. F., et al. (2003), Variability of biomass burning aerosol opticalcharacteristics in southern Africa during the SAFARI 2000 dry seasoncampaign and a comparison of single scattering albedo estimates fromradiometric measurements, J. Geophys. Res., 108(D13), 8477, doi:10.1029/2002JD002321.
Forster, P., et al. (2007), Changes in atmospheric constituents and in radia-tive forcing, in Climate Change 2007: The Physical Science Basis.Contribution of Working Group I to the Fourth Assessment Report ofthe Intergovernmental Panel on Climate Change edited by S. Solomon,D. Qin, M. Manning, Z. Chen, M. Marquis, K. B. Averyt, M. Tignorand H. L. Miller, Cambridge University Press, Cambridge.
Haywood, J. M., S. R. Osborne, and S. J. Abel (2004), The effect of over-lying absorbing aerosol layers on remote sensing retrievals of cloud effec-tive radius and cloud optical depth, Q. J. R. Meteorol. Soc., 130, 779–800.
Holz, R. E., S. A. Ackerman, F. W. Nagle, R. Frey, S. Dutcher, R. E. Kuehn,M. A. Vaughan, and B. Baum (2008), Global Moderate Resolution ImagingSpectroradiometer (MODIS) cloud detection and height evaluation usingCALIOP, J. Geophys. Res., 113, D00A19, doi:10.1029/2008JD009837.
Hu, Y., M. Vaughan, Z. Liu, K. Powell, and S. Rodier (2007), Retrievingoptical depths and lidar ratios for transparent layers above opaque waterclouds from CALIPSO lidar measurements. IEEE Geosci. Remote Sens.Lett., 4, 523-526.
Hu,Y., et al. (2009), CALIPSO/CALIOP cloud phase discrimination algorithm, J.Atmos. Oceanic Technol., 26, 2293–2309, doi:10.1175/2009JTECHA1280.1.
Iacono, M. J., J. S. Delamere, E. J. Mlawer, M. W. Shephard, S. A. Clough,and W. D. Collins (2008), Radiative forcing by long-lived greenhousegases: Calculations with the AER radiative transfer models, J. Geophys.Res., 113, D13103, doi:10.1029/2008JD009944.
Joseph, J. H., W. J. Wiscombe, and J. A. Weinman (1976), The delta-Eddington approximation for radiative flux transfer, J. Atmos. Sci., 33,2452–2459.
Jethva, H., O. Torres, L. A. Remer, and P. K. Bhartia (2013), A color ratiomethod for simultaneous retrieval of aerosol and cloud optical thicknessof above-cloud absorbing aerosols from passive sensors: Application toMODIS measurements. IEEE Trans. Geosci. Remote Sens.,doi:10.1109/TGRS.2012.2230008.
Keil, A., and J. M. Haywood (2003), Solar radiative forcing by biomassburning aerosol particles during SAFARI 2000: A case study based onmeasured aerosol and cloud properties, J. Geophys. Res., 108(D13),8467, doi:10.1029/2002JD002315.
MEYER ET AL.: ABOVE-CLOUD DARE FROM MODIS AND CALIOP
4814

King, M. D., S.-C. Tsay, S. E. Platnick, M. Wang, and K.-N. Liou (1998),Cloud retrieval algorithms for MODIS: Optical thickness, effectiveparticle radius, and thermodynamic phase. Products: 06_L2 (OD). ATBDReference Number: ATBD-MOD-05.
Levy, R. C., L. A. Remer, D. Tanre, S. Mattoo, and Y. J. Kaufman (2009),Algorithm for remote sensing of tropospheric aerosol over dark targetsfrom MODIS. ATBD Reference Number: ATBD-MOD-04.
Liu, Z., M. A. Vaughan, D. M. Winker, C. A. Hostetler, L. R. Poole,D. L. Hlavka, W. D. Hart, and M. J. McGill (2004), Use of probabilitydistribution functions for discriminating between cloud and aerosol inlidar backscatter data, J. Geophys. Res., 109, D15202, doi:10.1029/2004JD004732.
Liu, Z., M. A. Vaughan, D. M. Winker, C. Kittaka, R. E. Kuehn,B. J. Getzewich, C. R. Trepte, and C. A. Hostetler (2009), The CALIPSOlidar cloud and aerosol discrimination: Version 2 algorithm and initialassessment of performance, J. Atmos. Oceanic Technol., 26, 1198–1213,doi:10.1175/2009JTECHA1229.1.
Matichuk, R. I., P. R. Colarco, J. A. Smith, and O. B. Toon (2006), Model-ing the transport and optical properties of smoke aerosols from Africansavanna fires during the Southern African Regional Science Initiativecampaign (SAFARI 2000), J. Geophys. Res., 112, D08203, doi:10.1029/2006JD007528.
Meador, W. E., and W. R. Weaver (1980), Two-stream approximations toradiative transfer in planetary atmospheres: A unified description ofexisting methods and a new improvement, J. Atmos. Sci., 37, 630–643.
Nakajima, T., and M. D. King (1990), Determination of the optical thick-ness and effective particle radius of clouds from reflected solar radiationmeasurements part I: Theory, J. Atmos. Sci., 47, 1878–1893.
Omar, A. H., J.-G. Won, D. M. Winker, S.-C. Yoon, O. Dubovik, andM. P. McCormick (2005), Development of global aerosol models usingcluster analysis of Aerosol Robotic Network (AERONET) measurements,J. Geophys. Res., 110, D10S14, doi:10.1029/2004JD004874.
Omar, A., et al. (2009), The CALIPSO automated aerosol classification andlidar ratio selection algorithm, J. Atmos. Oceanic Technol., 26, 1994–2014,doi:10.1175/2009JTECHA1231.1.
Oreopoulos, L., and H. W. Barker (1999), Accounting for subgrid-scalecloud variability in a multi-layer 1-D solar radiative transfer algorithm,Q. J. R. Meteorolog. Soc., 125, 301–330.
Pincus, R., S. Platnick, S. A. Ackerman, R. S. Hemler, and R. J. P. Hofmann(2012), Reconciling simulated and observed views of clouds:MODIS, ISCCP,and the limits of instrument simulators, J. Climate, 25, 4699–4720.
Platnick, S., and S. Twomey (1994), Determining the susceptibility of cloudalbedo to changes in droplet concentration with the Advanced Very HighResolution Radiometer, J. Appl. Meteorol., 33, 334–347.
Platnick, S., M. D. King, S. A. Ackerman, W. P. Menzel, B. A. Baum,J. C. Riedi, and R. A. Frey (2003), The MODIS cloud products:Algorithms and examples from Terra, IEEE Trans. Geosci. RemoteSens., 41, 459–473.
Platnick, S., R. Pincus, B. Wind, M. D. King, M. Gray, and P. Hubanks(2004), An initial analysis of the pixel-level uncertainties in globalMODIS cloud optical thickness and effective particle size retrievals,Passive Opt. Remote Sens. Atmos. Clouds IV, Proc. of SPIE, 5652,doi:10.1117/12.578353.
Stamnes, K., S.-C. Tsay, W. Wiscombe, and K. Jayaweera (1988), Anumerically stable algorithm for discrete-ordinate-method radiativetransfer in multiple scattering and emitting layered media, Appl. Opt.,27, 2502–2509.
Torres, O., H. Jethva, and P. K. Bhartia (2012), Retrieval of aerosol opticaldepth above clouds from OMI observations: Sensitivity analysis and casestudies, J. Atmos. Sci., 69, 1037–1053.
Twomey, S. (1974), Pollution and the planetary albedo, Atmos. Environ.,8, 1251–1256.
Twomey, S. (1977a), The influence of pollution on the shortwave albedo ofclouds, J. Atmos. Sci., 34, 1149–1152.
Twomey, S. (1977b), Atmospheric Aerosols, Section 12.3, pp. 278-290,Elsevier Scientific Publishing Co., United Kingdom.
van der Werf, G. R., J. T. Randerson, L. Giglio, G. J. Collatz, M. Mu,P. S. Kasibhatla, D. C. Morton, R. S. DeFries, Y. Jin, andT. T. van Leeuwen (2010), Global fire emissions and the contribution ofdeforestation, savanna, forest, agriculture, and peat fires (1997–2009),Atmos. Chem. Phys., 10, 11707–11735, doi:10.5194/acp-10-11707-2010.
Vaughan, M. A., K. A. Powell, D. M. Winker, C. A. Hostetler, R. E. Kuehn,W. H. Hunt, B. J. Getzewich, S. A. Young, Z. Liu, and M. J. McGill(2009), Fully automated detection of cloud and aerosol layers in the CALIPSOlidar measurements, J. Atmos. Oceanic Technol., 26, 2034–2050, doi:10.1175/2009JTECHA1228.1.
Wilcox, E. M., Harshvardhan, and S. Platnick (2009), Estimate of theimpact of absorbing aerosol over cloud on the MODIS retrievals of cloudoptical thickness and effective radius using two independent retrievals ofliquid water path, J. Geophys. Res., 114, D20215, doi:10.1029/2008JD010589.
Wilcox, E. M. (2011), Direct and semi-direct radiative forcing of smokeaerosols over clouds, Atmos. Chem. Phys. Discuss., 11, doi:10.5194/acpd-11-20947-2011.
Winker, D. M., M. A. Vaughan, A. H. Omar, Y. Hu, K. A. Powell, Z. Liu,W. H. Hunt, and S. A. Young (2009), Overview of the CALIPSO missionand CALIOP data processing algorithms, J. Atmos. Oceanic Technol.,26, 2310–2323, doi:10.1175/2009JTECHA1281.1.
Winker, D. M., J. L. Tackett, B. J. Getzewich, Z. Liu, M. A. Vaughan, andR. R. Rogers (2012), The global 3-D distribution of troposphericaerosols as characterized by CALIOP, Atmos. Chem. Phys. Discuss.,12, 24847–24893.
Wiscombe, W. (1980), Improved Mie scattering algorithms, Appl. Opt.,19, 1505–1509.
Young, S. A., and M. A. Vaughan (2009), The retrieval of profiles of partic-ulate extinction from Cloud Aerosol Lidar and Pathfinder Satellite Obser-vations (CALIPSO) data: Algorithm description, J. Atmos. OceanicTechnol., 26, 1105–1119, doi:10.1175/2008JTECHA1221.1.
Young, S. (2010), Uncertainty analysis for particulate backscatter, extinc-tion and optical depth retrievals reported in the CALIPSO Level 2,Version 3 data release. CALIPSO Version 3 Extinction UncertaintyDocument.
Zhang, Z., and S. Platnick (2011), An assessment of differences betweencloud effective particle radius retrievals for marine water cloudsfrom three MODIS spectral bands, J. Geophys. Res., 116, D20215,doi:10.1029/2011JD016216.
MEYER ET AL.: ABOVE-CLOUD DARE FROM MODIS AND CALIOP
4815