estimating the potential of roadside vegetation for...
TRANSCRIPT
lable at ScienceDirect
Journal of Cleaner Production xxx (2015) 1e13
Contents lists avai
Journal of Cleaner Production
journal homepage: www.elsevier .com/locate/ jc lepro
Estimating the potential of roadside vegetation for bioenergyproduction
Alexey Voinov a, *, Oludunsin Arodudu b, Iris van Duren a, Javier Morales a, Ling Qin a
a ITC, University of Twente, Hengelosestraat 99, Enschede, Netherlandsb Leibniz Centre for Agricultural Landscape Research (ZALF), Eberswalder Straße 84, 15374 Müncheberg, Germany
a r t i c l e i n f o
Article history:Received 26 December 2014Received in revised form27 March 2015Accepted 12 April 2015Available online xxx
Keywords:LCAWillowGrassRotation croppingEfficiencyEROEI
* Corresponding author. Tel.: þ31 063 365 7124.E-mail addresses: [email protected], aavoin
[email protected], [email protected] (I. van Duren), [email protected] (L. Qin).
http://dx.doi.org/10.1016/j.jclepro.2015.04.0340959-6526/© 2015 Elsevier Ltd. All rights reserved.
Please cite this article in press as: Voinov, A.Production (2015), http://dx.doi.org/10.1016
a b s t r a c t
The Netherlands, like other European Union countries, is under intense pressure to increase its nationalshare of energy from renewable sources in accordance with 2020 Kyoto Protocol obligations. Bioenergyin this context is especially interesting because it can replace liquid fuels so much in demand fortransportation. In Europe, due to high population density, and intensive use of limited land resources,sources of biomass are quite limited. This study examines the potential of road verge for biomass pro-duction. In this case there is no conflict with agricultural production e “food for fuel” conflict e and verylittle problems with natural conservation, since we are focusing on already disturbed and heavily usedand polluted areas. The road verge is also easily accessible and in most cases already has to be main-tained and cultivated. We use GIS (Geographical information system) to identify the total area of landalong the roads in the Netherlands that can potentially be used for bioenergy purposes. We then considerthe opportunities and constraints of cultivating various types of biomass, mainly focusing on grasses andwillow, short rotation coppice, as biomass sources on the road verge. Based on that, we distinguishbetween areas that are unavailable due to safety requirements, areas that are conditionally availableprovided that current regulations are revised and areas that are already unconditionally available. Weassess the entire production chain in terms of Energy Return on Energy Invested (EROEI), and considervarious combinations of grass and willow operations for bioenergy production. Looking at several roadsin Eastern Overijssel, we have estimated that there is approximately 4.24e4.68 ha/km of road vergeconditionally available along highways, A-roads, and some 0.80e2.67 ha/km available along local roads,N-roads. However, only 1.02e1.62 ha/km and 0.37e0.80 ha/km of A and N roads respectively areavailable unconditionally. The EROEI for some scenarios of both grass-based and willow-based pro-duction were quite high, 15e42, making such use of road verge quite promising.
© 2015 Elsevier Ltd. All rights reserved.
1. Introduction
At present, coal and gas account for more than 50% of EU'selectricity supply and will remain an important part of the energymix (European Commission, 2007). However, the acceleratingprocess of global warming, growing demand for energy, depletionof cheap fossil fuel supplies and environmental concerns are raisingthe significance of renewable energy (Luque et al., 2008). Over sixty
[email protected] (A. Voinov),@zalf.de (O. Arodudu),@utwente.nl (J. Morales),
, et al., Estimating the potenti/j.jclepro.2015.04.034
percent of renewable energy in the Netherlands comes frombiomass (Central Bureau of Statistics, 2009), which makes it themost popular renewable energy source in this country. Besidesreducing greenhouse gases (GHG) emissions, biomass derived fuelsare especially attractive because they can be easily stored and usedas non-variable energy; same cannot be said of solar and windpower e the other most popular renewable energy sources(McKendry, 2002a; Demirbas, 2005; €Olz et al., 2007).
The European Council in March 2007 endorsed a mandatorytarget of 20% share of energy from renewable sources in overallCommunity's energy consumption by 2020 (European Parliamentand European Council, 2009). For the Netherlands, for example,the percentage of renewable energy in final energy consumptionhas to be increased from 3.4% in 2008 to targeted 14% in 2020(a deficit of 10.6%) (Europe's Energy Portal, 2010). Under this
al of roadside vegetation for bioenergy production, Journal of Cleaner

A. Voinov et al. / Journal of Cleaner Production xxx (2015) 1e132
pressure, the Netherlands is expected to fully embrace everyopportunity to develop its bioenergy potential. This may includewood and wood wastes from forests and industries, sewage sludgefromwastewater treatment plants, organic waste from households,oils and fats from food industry, manure from dairy farms and cropsspecifically grown for bio-energy such as rapeseed (Brassica napus),willow (Salix), Miscanthus (Basu, 2010), etc.
Until recently, most energy crop cultivation was done on arableland. However, low energy efficiency of energy crops (Firrisa et al.,2013; van Duren et al., 2015) and lack of free arable land are majorlimitations for the cultivation of these crops in Europe, especially inthe more densely populated and developed countries like theNetherlands. In general, for reasons of food security, it is preferableto leave agricultural land available for food production and findother sources of biomass for bioenergy production (Londo, 2002;Faaij et al., 1998). Arodudu et al. (2013, 2014) argue that bio-energy production should be mainly focused on the waste flows(urban waste, agricultural crop residue, manure, etc. as well asbiomass produced on waste land such as construction lots, erodedlands, etc.) and that only then it can be conducted with sufficientlyhigh efficiency. In this regards, the land along the roads appears as akind of wasteland and is a promising area where biomass can beharvested for bioenergy needs with little or no conflict with otherpotential uses. In fact, we argue that producing biomass along theroads can be promising and beneficial from a variety of perspec-tives, including economy, traffic safety, esthetics, etc. Moreover,these areas are easily accessible and are directly linked to majortransportation routes, which makes its cultivation and delivery ofproducts more efficient.
The Netherlands ranks among the top 10 high road densitycountries in the world (Encyclopedia of the Nations, 2007). With atotal of more than 137,000 km of roads, it has an average roaddensity of 5 km per km2 of surface area (Visser, 2010). This indicatesthat there might be large areas of available road verge in thiscountry. Easy access to this land is another advantage cutting thecost of harvesting and transportation of biomass. Haines-Younget al. (2000), Truscott et al. (2005) proved that vehicular activitiescan elevate the nitrogen concentration of road verges. This canreduce the fertilizer requirements for crop growth on the roadverge. Huang's study (1987), furthermore confirmed that plantingof shrubs in themedian and road verge could stop errant vehicles incase of accident and absorb the impact, without doing muchdamage to the car. Also, the shrub barrier could reduce traffic noiseand headlight glare (van der Heijden and Martens, 1982), contrib-uting to sound environment and road safety. As with other biomassfor bioenergy production, utilizing roadside biomass will providefor carbon sequestration, will encourage technological develop-ment and innovation, and offer opportunities for employment andregional development (Vollebergh, 1997; Volk et al., 2004). In thisstudy, we have beenmostly focusing on the Easternmost part of theOverijssel province in Netherlands, however our analysis andmethods are quite general, and could be easily applied elsewhereand scaled up to the whole of Netherlands and beyond.
Road verges are maintained as transition zones betweendifferent land uses and in most cases appear as strips on both sidesof the road. Road verges are mown to ensure visibility along roadsin case of an accident, to enhance visibility of road signs and con-structions (e.g. electricity boxes), to get rid of excessive nutrients insoils and for esthetic and maintenance purposes. For example, inOverijssel, the mowing policy recommends that road verges bemown twice a year. A maximum of 20 cm height of grass is allowedat the end of the 26th and 45th weeks (mowing weeks). Themowing exercise is preferably carried out in the evening to reducepossible negative effects on transportation (Rijkswaterstaat, 2008).In the Netherlands, municipal authorities are responsible for more
Please cite this article in press as: Voinov, A., et al., Estimating the potentiProduction (2015), http://dx.doi.org/10.1016/j.jclepro.2015.04.034
than 90% of the Dutch roads while the national government is onlyresponsible for 4% (Central Bureau of Statistics (2011)). The 4%managed by the national government include all the motorways(A-roads) and a few national highways (N-roads); these are mownmore regularly than other roads. Vegetation along these roads iscurrently managed by Rijkswaterstaat (Public Works Department),the executive body of the Ministry of Transport and Water(A. Reuver, personal communication, 7 October 2010). Accordingto the “Overview of the vegetation along National Road”(Rijkswaterstaat, 2008), management of verge grasses involveschoosing between different species types and different manual orautomated methods for pruning, mowing, chipping and cutting. Inreality, grass is the main target vegetation and a combined cuttingand suction method is used to mow verge grasses. The Dutchenvironmental management act (2004) states that the removedgrass must be delivered to and processed by a waste processorwhich has a valid license. Usually, the grass is either deposited towaste landfill or composted (J. W. Slijkhuis, personal communica-tion, 5 November 2010; H. Nieuwenhuis, personal communication,19 January 2011). However in all cases these operations are treatedas an expense that should be preferablyminimized (Van Strien et al,2005). This attitude should be changed if the harvested biomassbecomes treated as a valuable resource for bio-energy production.
Maximization of biomass cultivation in road verges requireschoosing the most suitable crop species for the purpose, whichwould imply such characteristics as (Ponton, 2009):
� Ability to grow and reproduce at a very fast rate� Ability to produce high yield� Perennial nature� Having little or no need for annual ploughing once planted� Adaptability to marginal land� Having minimal fertilizer requirement.
Some of these requirements are exactly opposite to the currentpractices of maintenance of the road verges. Since large trees alongthe road is a safety concern, feasible energy crops for road vergesare restricted to small trees, shrubs and grasses (Faaij et al., 1998).Based on these reasons, energy crops suitable for road vergeinclude:
▪ Short rotationwoody crops, e.g. willow and poplar (Fischer et al.,2010; Zuwala, 2012; Gonz�alez-García et al., 2014)
▪ Perennial grasses, e.g. Miscanthus, switchgrass (Panicum virga-tum), reed canary grass (Phalaris arundinacea) (Huisman, 2003).
Since perennial grasses have been largely treated before (e.g.Arodudu et al., 2013) in this study, where possible, we will focusmore on willow short rotation coppice (SRC) as the biomass feed-stock. Local clones of willow SRC have been well developed andobserved in Europe. However, in the Dutch context, few trials havebeen carried out to study the biomass production of local clones(Kuiper, 2003; Bussel, 2006). Their studies suggest that for theNetherlands, productive local clones of willow SRC include Zw.Driebast (Salix triandra), Het Goor (Salix alba), Belders (Salix alba),Tora (Salix viminalis x Salix schwerinnii), Bjorn (Salix viminalis x S.schwerinnii), Black Spaniard (S. triandra), Loden (S. triandra) and Jorr(Salix viminalis). Despite the fact that certain clones produce morebiomass than the others, it is recommended to mix different willowspecies and varieties for pest and disease prevention (Ramstedt,1999; Londo et al., 2004).
Willow is well adjusted to the Dutch climate conditions (Gigler,1999; Londo, 2002) and has a long history of cultivation in theNetherlands (Schepers et al., 1992). The biomass produced withwillow SRC is potentially high. In Dutch conditions the productivity
al of roadside vegetation for bioenergy production, Journal of Cleaner
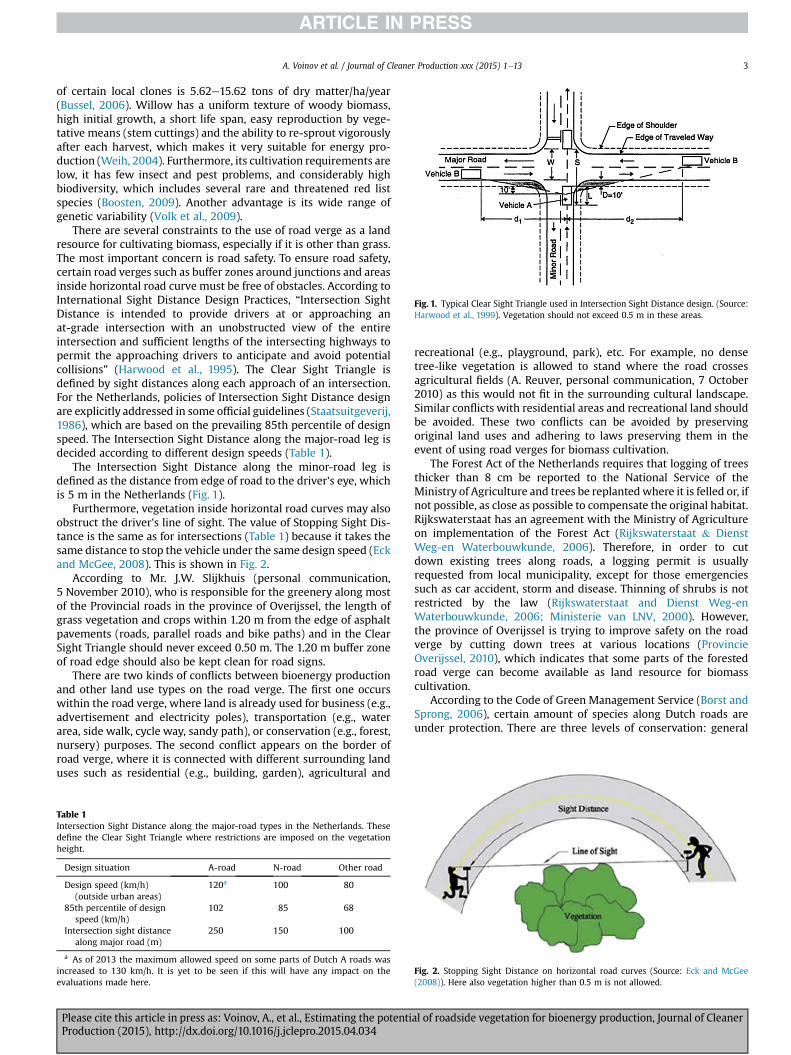
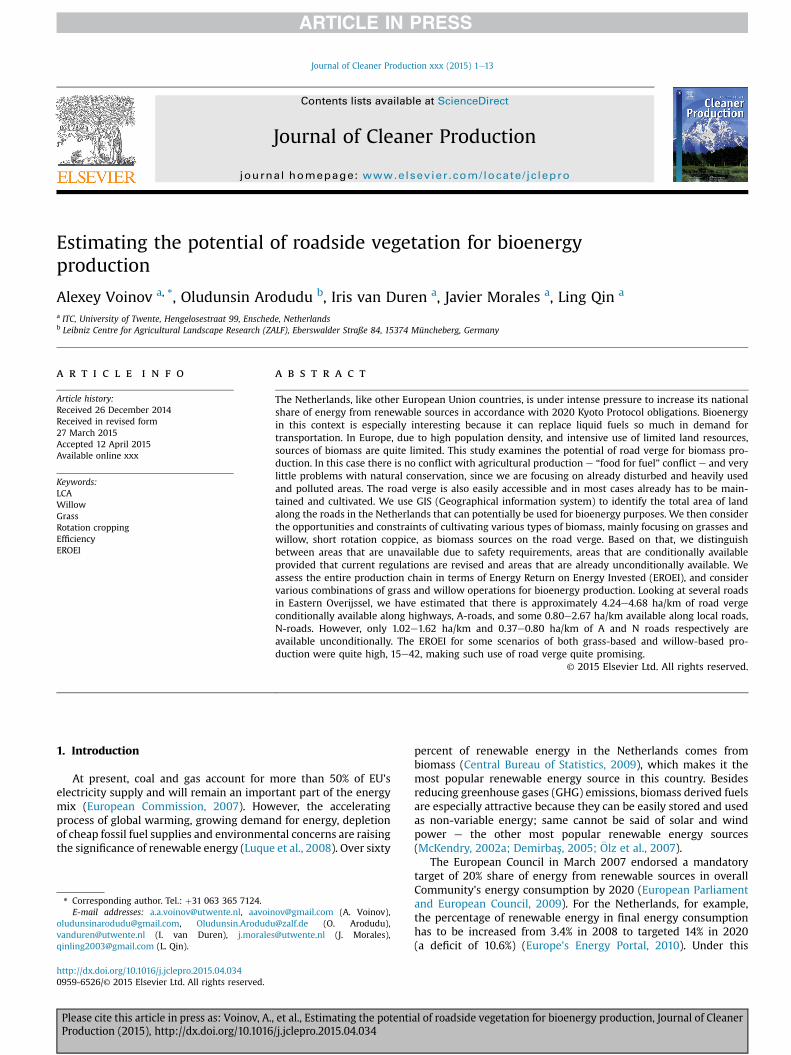
Fig. 1. Typical Clear Sight Triangle used in Intersection Sight Distance design. (Source:Harwood et al., 1999). Vegetation should not exceed 0.5 m in these areas.
A. Voinov et al. / Journal of Cleaner Production xxx (2015) 1e13 3
of certain local clones is 5.62e15.62 tons of dry matter/ha/year(Bussel, 2006). Willow has a uniform texture of woody biomass,high initial growth, a short life span, easy reproduction by vege-tative means (stem cuttings) and the ability to re-sprout vigorouslyafter each harvest, which makes it very suitable for energy pro-duction (Weih, 2004). Furthermore, its cultivation requirements arelow, it has few insect and pest problems, and considerably highbiodiversity, which includes several rare and threatened red listspecies (Boosten, 2009). Another advantage is its wide range ofgenetic variability (Volk et al., 2009).
There are several constraints to the use of road verge as a landresource for cultivating biomass, especially if it is other than grass.The most important concern is road safety. To ensure road safety,certain road verges such as buffer zones around junctions and areasinside horizontal road curve must be free of obstacles. According toInternational Sight Distance Design Practices, “Intersection SightDistance is intended to provide drivers at or approaching anat-grade intersection with an unobstructed view of the entireintersection and sufficient lengths of the intersecting highways topermit the approaching drivers to anticipate and avoid potentialcollisions” (Harwood et al., 1995). The Clear Sight Triangle isdefined by sight distances along each approach of an intersection.For the Netherlands, policies of Intersection Sight Distance designare explicitly addressed in some official guidelines (Staatsuitgeverij,1986), which are based on the prevailing 85th percentile of designspeed. The Intersection Sight Distance along the major-road leg isdecided according to different design speeds (Table 1).
The Intersection Sight Distance along the minor-road leg isdefined as the distance from edge of road to the driver's eye, whichis 5 m in the Netherlands (Fig. 1).
Furthermore, vegetation inside horizontal road curves may alsoobstruct the driver's line of sight. The value of Stopping Sight Dis-tance is the same as for intersections (Table 1) because it takes thesame distance to stop the vehicle under the same design speed (Eckand McGee, 2008). This is shown in Fig. 2.
According to Mr. J.W. Slijkhuis (personal communication,5 November 2010), who is responsible for the greenery along mostof the Provincial roads in the province of Overijssel, the length ofgrass vegetation and crops within 1.20 m from the edge of asphaltpavements (roads, parallel roads and bike paths) and in the ClearSight Triangle should never exceed 0.50 m. The 1.20 m buffer zoneof road edge should also be kept clean for road signs.
There are two kinds of conflicts between bioenergy productionand other land use types on the road verge. The first one occurswithin the road verge, where land is already used for business (e.g.,advertisement and electricity poles), transportation (e.g., waterarea, side walk, cycle way, sandy path), or conservation (e.g., forest,nursery) purposes. The second conflict appears on the border ofroad verge, where it is connected with different surrounding landuses such as residential (e.g., building, garden), agricultural and
Table 1Intersection Sight Distance along the major-road types in the Netherlands. Thesedefine the Clear Sight Triangle where restrictions are imposed on the vegetationheight.
Design situation A-road N-road Other road
Design speed (km/h)(outside urban areas)
120a 100 80
85th percentile of designspeed (km/h)
102 85 68
Intersection sight distancealong major road (m)
250 150 100
a As of 2013 the maximum allowed speed on some parts of Dutch A roads wasincreased to 130 km/h. It is yet to be seen if this will have any impact on theevaluations made here.
Please cite this article in press as: Voinov, A., et al., Estimating the potentiProduction (2015), http://dx.doi.org/10.1016/j.jclepro.2015.04.034
recreational (e.g., playground, park), etc. For example, no densetree-like vegetation is allowed to stand where the road crossesagricultural fields (A. Reuver, personal communication, 7 October2010) as this would not fit in the surrounding cultural landscape.Similar conflicts with residential areas and recreational land shouldbe avoided. These two conflicts can be avoided by preservingoriginal land uses and adhering to laws preserving them in theevent of using road verges for biomass cultivation.
The Forest Act of the Netherlands requires that logging of treesthicker than 8 cm be reported to the National Service of theMinistry of Agriculture and trees be replantedwhere it is felled or, ifnot possible, as close as possible to compensate the original habitat.Rijkswaterstaat has an agreement with the Ministry of Agricultureon implementation of the Forest Act (Rijkswaterstaat & DienstWeg-en Waterbouwkunde, 2006). Therefore, in order to cutdown existing trees along roads, a logging permit is usuallyrequested from local municipality, except for those emergenciessuch as car accident, storm and disease. Thinning of shrubs is notrestricted by the law (Rijkswaterstaat and Dienst Weg-enWaterbouwkunde, 2006; Ministerie van LNV, 2000). However,the province of Overijssel is trying to improve safety on the roadverge by cutting down trees at various locations (ProvincieOverijssel, 2010), which indicates that some parts of the forestedroad verge can become available as land resource for biomasscultivation.
According to the Code of Green Management Service (Borst andSprong, 2006), certain amount of species along Dutch roads areunder protection. There are three levels of conservation: general
Fig. 2. Stopping Sight Distance on horizontal road curves (Source: Eck and McGee(2008)). Here also vegetation higher than 0.5 m is not allowed.
al of roadside vegetation for bioenergy production, Journal of Cleaner

A. Voinov et al. / Journal of Cleaner Production xxx (2015) 1e134
protection, special protection and bird protection. It is forbidden topick, collect, cut, stab, destroy, damage, uproot or remove thoseprotected species from their habitat. Therefore, selective mowingstrategy has to be applied. An alternative way for ensuring thisspecies conservation is sparing other marginal land for naturalconservation. There are at least two arguments against the idea ofsaving road verge for ecological protection. The soils of road vergeare usually polluted by vehicle exhaust, containing heavy metalssuch as Cd, Cu, Pb and Zn (Warren and Birch, 1987), and the road-side environments are highly disturbed by traffic (Cuperus et al.,1996). Gommers et al. (2005) even suggests that it is particularlysuitable to establish willow SRC on heavy-metal-contaminatedland because of its soil-to-wood transfer of pollutant. This ofcourse may require further treatment of exhaust for heavy metalswhen the biofuels are incinerated.
This study evaluated different energy crops to determine a po-tential vegetation mix for producing bioenergy on the road vergewithout compromising road safety, land use conflicts and ecolog-ical concerns. It also conducted a Life Cycle Assessment (LCA) todetermine the overall energy efficiency of cultivating the mostsuitable biomass types on the road verge. This included an in-ventory of all the processes involved from site preparation of theroad verges to the direct combustion of the biomass for electricityand/or combined heat and electricity generation at the biomasspower plant, or gasification of grass biomass for electricity and/orcombined heat and electricity production.
2. Methods
As required by ISO 14040 standard for performing LCA thedefinition of boundaries for this study includes a description ofthe study area, the road networks examined within the study areaand the energy performance index used in evaluating the bio-energy potential of the study area. As a proof of concept, we havechosen a relatively small area consisting of six municipalities inthe East of Netherlands (Dinkelland (Denekamp), Enschede,Haaksbergen, Hengelo, Losser and Oldenzaal) with a total area of608.44 km2 (Fig. 3). The road network in this area represents allthe main types of roads in the country (as well as in Europe ingeneral). There are two A-roads and eighteen N-roads in this area,which represent motorways and national highways, respectively,according to the Dutch road numbering system (Table 2). For theA-roads the road verges are managed by the Rijkswaterstaat EastNetherlands. Most of the one-lane N-roads except N18 and N35are maintained by the provincial greenery office of Overijssel(J.W. Slijkhuis, personal communication, 5 November 2010). Forthis study we have further narrowed our scope and have focusedonly on the roads that are under the Rijkswaterstaat authority,that is A1, A35, N18 and N35. The functional unit for our analysiswill be a hectare of road verge per which we will be making ourestimates.
The energy efficiency was measured as return on energyinvested (EROEI). It is calculated as the ratio of the energy output(expected return) obtained from a particular energy productionactivity to the energy input (investment required) required to getthat energy (Cleveland et al., 1984; Hall et al., 2009):
EROEI ¼ Expected Energy Output=Required Energy Investment
(1)
To calculate the EROEI we have developed a Life Cycle Inventory(LCI) taking into account all the direct and indirect energy costs andoutputs incurred along the energy production chain.
This started with the identification of all the areas along thedifferent roads in the study area that are potentially available for
Please cite this article in press as: Voinov, A., et al., Estimating the potentiProduction (2015), http://dx.doi.org/10.1016/j.jclepro.2015.04.034
biomass production. Information about relevant road verge man-agement regimes, practices, regulations and constraints wasderived from literature and Rijkswaterstaat, the managementauthority of Dutch road verges. Datasets on the road networks andverges were taken from cadastral data available at http://www.kadaster.nl/ and the Rijkswaterstaat East Netherlands. Area ofroad verges available for cultivation of willow were estimated byfirst putting into consideration all the necessary constraints asdefined by Rijkswaterstaat East Netherlands. These included:
� Road safety issues� Clear Sight Triangle of intersections on both A & N road (theIntersection Sight Distance along major-road leg is 250 m forA-road, 150 m for N road and the Intersection Sight Distancealong minor-road is 5 m for all the roads);
� Clear sight area of horizontal curves of A-road (with thedesign speed of 120 km/h on A-roads, the stopping sightdistance is 250 m);
� 1.2 m buffer zone of road edge of both A and N road is to bekept clean for road signs;
� Intermediate zone of a two-way road (is usually narrow andshould be kept free of obstacles so that drivers are able toobserve vehicle condition on the opposite side. However,these areas can still be considered available for grass as long asthe height of grass does not exceed 0.50 m).
� Land use conflicts (that may prevent planting willow, but insome cases may be resolved with owners)� Within road verge (Transportation e water area, side walk,cycle way, sandy path; and Business e advertisement orelectricity pole)
� On border of road verge (Residence e building, garden;Agriculture; Recreation e playground, park.
� Ecological restrictions (that forbid to pick, collect, cut, stab,destroy, damage, uproot or remove protected species, which areon the list recognized by Rijkswaterstaat (Borst and Sprong,2006)) that specifies� Locations of protected species;� Locations of recorded trees.
While the road safety constraints are quite strict, the other twotypes, land use and ecological restrictions, are often negotiable. Forexample, in some cases it may be shown to adjacent landowners orto conservationists that planting willow can be even more benefi-cial for them than having mowed grass strips along roads. There-fore we have defined two types of land availability:
� Unconditional e land available, none of the above restrictionsapply;
� Conditional e land may be available if land use or ecologicalconstraints are negotiated.
In other words, unconditionally available land includes the landalong the road verge except the areas that are restricted by safetyissues and by land use and ecological concerns. This land that maybe restricted by land use and ecological concerns is considered to beconditionally available.
To identify and quantify the land available for energy pro-duction inside the verge areas of the selected N and A roads (SeeTable 2), first, we developed a set of spatial query functions thatcapture the conditions placed by road safety, land use, andecological concerns. These constraint functions were constructedusing sequences of standard SQL spatial operators, where eachsequence relied on a set of conditional statements to comply withthe specifications prescribed by law (see above). Then, theresulting functions were applied to the road and verge datasets to
al of roadside vegetation for bioenergy production, Journal of Cleaner

Fig. 3. Location of the study area (http://www.crwflags.com/fotw/flags/nl(ov.html#map)) and the road network considered. The highways are the A-roads; regular one-lane roadsare the N-roads.
A. Voinov et al. / Journal of Cleaner Production xxx (2015) 1e13 5
filter out off-limit areas. Next, a series of summary queries wereexecuted to classify suitable areas as conditionally and uncondi-tionally available, discriminated by exiting vegetation types. Andfinally, we derived the values corresponding to area per kilometerof road that can be used for energy production, so that estima-tions of available area along every road could be made. Anexample of the result of using these spatial operations can be seenbelow in Fig. 6.
Please cite this article in press as: Voinov, A., et al., Estimating the potentiProduction (2015), http://dx.doi.org/10.1016/j.jclepro.2015.04.034
Knowing the total available area, we can turn to the analysis ofenergy invested and produced under various scenarios of biomassproduction. We will consider the following scenarios:
1. Harvesting verge grass on all the area available;2. Growing willow on unconditionally available land;3. Growing willow on unconditionally and conditionally available
land.
al of roadside vegetation for bioenergy production, Journal of Cleaner

Table 2Length of A and N roads in the study area.
No. Road number Length (km)
1 A1 27.122 A35 19.51Total A-roads 46.633 N18 18.44 N315 1.05 N342 34.76 N343 9.27 N346 0.48 N347 8.09 N349 12.510 N35 5.611 N731 5.112 N732 6.213 N733 8.814 N734 11.815 N735 5.816 N736 10.117 N737 10.218 N738 8.219 N739 14.620 N743 1.5Total N-roads 172.1Total N18 þ 35 23.93
A. Voinov et al. / Journal of Cleaner Production xxx (2015) 1e136
To estimate the yields and energy requirements for verge grass,we used the methodology and numbers developed by Aroduduet al., 2013 (8 ton dry matter (DM) ha�1yr�1 of grass, when har-vested twice annually) and Grisso et al., 2010 (energy for mowingand collection of grasses with tractor mounted forage harvester e0.80e1.06 GJ/ha� yr�1) for the cases when natural grasslands arefor bioenergy production.
Here we will focus more on the processes associated withcultivation, harvest and processing of biomass from willow. Theproduction chain of willow SRC includes the following stages(Fig. 4), which are all associated with certain energy investments(Caslin et al., 2010; DEFRA, 2004):
➢ Site preparation e mowing and removing existing vegetation;➢ Establishment e planting (twin rows 0.75 m apart, with 1.5 m
between each set of twin rows) and cutback (cutting to 10 cm of
Fig. 4. Major activities in the production chain of a willow short rotation plantation(Source: DEFRA (2004); Caslin et al. (2010)). All these require energy investments,which are accounted for in Table 3.
Please cite this article in press as: Voinov, A., et al., Estimating the potentiProduction (2015), http://dx.doi.org/10.1016/j.jclepro.2015.04.034
ground level to promote the development of multi-stemmedcoppice).
➢ General management e fertilization (150e400 kg N ha�1 perthree year rotation or less due to elevated levels of N onroad verge), weed control (2.25 kg/ha year of herbicideMatthews, 2001)
➢ Harvesting e a sustainable annual biomass yield of 12e14 ovendry ton per ha can be expected (Ceulemans et al., 1996; Caslinet al., 2010; Boosten, 2009; DEFRA, 2004). Willow is normallyharvested every 2 or 3 years and can remain viable for 25e30years. The shoots of willow can reach up to 6e8m at the end of athree year harvesting cycle (DEFRA, 2004; Caslin et al., 2010).The maximal diameter that a harvest machine can handle is60e70mm (Nordh and Dimitriou, 2003), which is unlikely to beexceeded in the Netherlands. Generally, willow at harvest have amoisture content of 45e60%, which needs to be reduced below15% for higher conversion efficiency (Faaij et al., 1997; Tubbyand Armstrong, 2002). The two most common harvestingmethods are:� Stick harvesting: whole stems of willow are cut and chippedusing cut and chip harvesting technology and then trans-ported to conversion plant.
� Cut and chip harvesting: willow is cut and chipped fresh in asingle pass, therefore, the quality of chips are much betterthan chipping dried bundles, and the power requirement forchipping operation is minimized. However, the harvestedchips will self-heat quickly due to natural degradation andmust be dried artificially immediately to eliminate the energyinput for drying (Caslin et al., 2010).
➢ Transportation e delivery of willow biomass from field to con-version plant. Here again we can use GIS operations to estimatethe distance required to deliver the biomass to the processingunits.
➢ Termination e assumed by this study to occur 25 years afterplanting. The stools are either allowed to shoot or are ploughedprior to winter to allow early re-seeding in the following spring(DEFRA, 2004)
The energy investments required for willow cultivation andbiomass production are presented in Table 3. Willow biomass canbe converted into energy via two different forms of technologies:the thermo-chemical and the bio-chemical/biological technolo-gies (McKendry, 2002b; Ni et al., 2006). Implementations ofthermo-chemical technologies include combustion, pyrolysis andgasification processes; while examples of bio-chemical conver-sion include digestion (mono-digestion and co-digestion) andfermentation (McKendry, 2002b). The advantages of thermo-chemical technologies lies in their shorter reaction time(Bridgewater, 2001), and their better ability in destroying mostorganic materials, thereby ensuring a higher efficiency (Jenkinset al., 1998). The main processes, intermediate and end productsof thermo-chemical conversion are illustrated in Fig. 5. The energystored in biomass can be released as heat by direct combustion/co-firing, or transformed into solid (e.g., charcoal) or gaseous(e.g., synthetic gas) fuels via pyrolysis or gasification underdifferent utilization purposes.
Various ways of producing ethanol, hydrogen or biogas fromspecific energy crops have been identified in recent years(Demirbas, 2007; Kim and Dale, 2005; Gray et al., 2006; Peterssonet al., 2007; B€orjesson and Mattiasson, 2008; Berglund andB€orjesson, 2006; B€orjesson and Tufvesson, 2011; Nguyen et al.,2013; Kumar et al., 2015), however, none of these conversion pro-cesses are of particularly high efficiency. This is because convertingcrops from its original solid form to liquid or gas greatly increasesthe energy processing demand (Ponton, 2009).
al of roadside vegetation for bioenergy production, Journal of Cleaner

Table 3Energy investment in the production chain of willow SRC. When using nitrogenfertilizer the overall energy efficiency of the process can dramatically decrease.
Activity Primary energyinvestment(GJ ha�1)
Notes
Site preparationMowing and collectiona 0.80e1.06 Reference systemSoil preparationb 2.05 Energy requirement for
ploughing and harrowingEstablishmentCuttingb 4.99 Energy requirement for
production and transportof planting material
Plantingb 1.11Cut-back (stick harvesting)c 0.22e0.40 Energy for cut and chip
harvestingManagementHerbicidesb 1.20 Production and transport
of herbicidesHerbicidesb 0.26 Application of herbicidesN fertilizerb 67.55 Production and transport
of fertilizerN fertilizerb 0.84 Application of fertilizerHarvestingHarvestingc 0.43e0.80 Energy requirement for
combined cut and chipharvesting,
Natural drying andstorage (approximatelythe same for first30 tonnes)e
0.32e0.40 Energy requirement foremptying, front-loadingand dumping chips in thestorage barns
Transportation (15 km)b,d 1.08Terminationb 6.65
a (Grisso et al., 2010).b (Bussel, 2006).c (Lechasseur and Savoie, 2005).d (Van Strien et al., 2005).e (Meyer et al., 2014).
A. Voinov et al. / Journal of Cleaner Production xxx (2015) 1e13 7
Furthermore, current costs of these energy products (e.g.,ethanol) are not competitive enough when compared to those offossil fuel products (McKendry, 2002b). On the other hand, lowcost, high reliability, well understood process and commercialavailability of combustion makes it the most widely used thermo-chemical conversion technology. It contributes over 97% of bio-energy production all over the world (Ni et al., 2006).
Most energy return or output from thermo-chemical technolo-gies are usually based on oven dry material at 0% moisture content.Varying figures are reported by different authors, mostly within therange of 16e20 GJ per oven dry ton (B€orjesson, 1996; Heller et al.,2003; Kuiper, 2003; Lettens et al., 2003). However, since we dealwith wet biomass, the process of natural drying can only reduce themoisture content to 25%, while further drying still requires some
Fig. 5. Main processes, intermediate and end products of thermo-chemical conversionof willow (Source: Bridgewater and Peacocke (2000)). Electricity, charcoal, chemicalsand heat are the main potential products. Energy efficiency for various productswill vary.
Please cite this article in press as: Voinov, A., et al., Estimating the potentiProduction (2015), http://dx.doi.org/10.1016/j.jclepro.2015.04.034
more energy inputs (AEA Energy and Environment, 2008). The NetHeating Value which takes into account moisture content andhydrogen content can be calculated by Milne equation (Faaij et al.,1997; Energy Research Centre of The Netherlands (1998)):
LHV ¼ HHVdry � ð1�WÞ � EW� ½MH2O �H� ð1�WÞ þW�(2)
where LHV: Lower Heating Value (Net Heating Value) of materialreceived at the conversion plant, HHVdry: Higher Heating Value ofdrymaterial, W:moisture content, H: hydrogen content (wt% of dryfuel), Ew: energy required for evaporation of water (2.442 MJ/kg),MH2O: weight of water created per unit of hydrogen (8.936 kg/kg).
The Total Energy Return is then calculated as:
TE ¼ Pe� LHV (3)
where Pe is plant efficiency. Table 4 presents the parameters usedin our study to calculate the energy return from willow and vergegrass. The lower plant efficiency value corresponds to production ofelectricity only, while the higher efficiency is attained when heatand electricity production are combined through the gasificationprocess.
To conclude, in Table 5we present themain assumptions used inthis study for willow cultivation, while in Table 6 we describe theparameters of the three options for willow production that we willcompare. Willow cultivation option 1 assumes no fertilizer orherbicide input, and short rotation length. Option 2 adds herbicideapplication alone (no fertilizer application), and finally in option 3both fertilizer and herbicide are used, together with a long rotationlength.
Overall, five options are considered in this study: the currentsystem, i.e. mowing, transporting and dumping verge grassbiomass at the composting plant at Twence twice a year (which isthe existing practice for road verge maintenance - mown vergegrass in the study area does not have any energy output based onthis practice - therefore EROEI ¼ 0); the potential reference system,that uses the verge grass mown twice annually to produce elec-tricity and/or combined heat and electricity through the gasifica-tion process; and the three willow cultivation options describedabove (1-without fertilizer and herbicide, 2-with herbicide andwithout fertilizer, 3-with both fertilizer and herbicide).
3. Results and discussions
In what follows, we are applying the methodology describedabove to the case study in Overijssel.
3.1. Energy Return on Energy Invested
The energy inputs of different activities in the four cultivationoptions are estimated in Table 7 (energy for mowing, transport,natural drying & storage, and cut and chip harvesting per unitreceived biomass per hectare cultivated over a 25 year period). TheEROEI of the three willow cultivation options and grass was thenestimated from the energy inputs and energy return. From theresult of the relative total energy input obtained (comparing thetotal energy input of the reference system potential i.e. gasificationof verge grass for electricity and/or combined heat and electricitygeneration, to that of the three willow cultivation options e
Table 6), only the combustion of willow harvested for production ofelectricity or combined heat and electricity, on a two-year shortrotation cycle without the application of fertilizers and herbicidesduring cultivation has a lower energy input than that of gasificationof mown verge grass for production of electricity and combined
al of roadside vegetation for bioenergy production, Journal of Cleaner

Table 4Parameters on energy return for willow and verge grass. Cogeneration of heat andelectricity can almost triple the energy output and should be certainly recom-mended as the most efficient process.
Parameters Willow Verge grass
HHVdry (MJ/kg) 19.6b 18.0a,b
Moisture content at harvest (%) 50c 60a,c
Moisture content as receivedat the conversion plant (%)
25c 25d
Hydrogen content (% of dry fuel) 5.7b 5.6b
LHVar (MJ/kg) 13.2a,b 12.0a,b
Plant efficiency (%) 27e75c,d 35e75c,d
Gross energy obtainable per biomassas received (GJ/t)
3.6e9.9c,d 4.2e9.0c,d
a (Faaij et al., 1997).b (Energy Research Centre of the Netherlands, 1998).c (AEA Energy and Environment, 2008).d (Twence, 2009).
Table 6Four scenarios for road verge cultivation. The current scenario assumes collectingand composting the grass with no energy generation. The reference scenario as-sumes that grass is collected and used to produce electricity and heat, and the threeother scenarios assume that willow is cultivated under different combinations offertilizer and herbicide applications.
Cultivation option Reference 1 2 3
N Fertilizer input (kg ha�1yr�1) 0 0 0 60Herbicide input (kg ha�1yr�1) 0 0 2.25 2.25Rotation length (yr) 0.5 2 2 3Harvesting cycle 24 12 12 8Yield (moisture content ¼ 50%)
(t ha�1yr�1)8 16 20 24
A. Voinov et al. / Journal of Cleaner Production xxx (2015) 1e138
heat and electricity, over the 25 year period; other willow optionshave higher inputs due to the application of fertilizers and/or her-bicides, and the relative large amount of energy for mowing andcollection of verge grass twice annually respectively. The dumpingof verge grass mown twice annually at composting sites, as pres-ently practiced (reference system) is a total waste in terms ofenergy, and should probably be discontinued if we are seriousabout reaching the CO2 reduction targets.
Also from the results obtained (Table 7), the willow cultivationoption 1 (combustion of willow harvested for production of elec-tricity or combined heat and electricity, on a two-year short rotationcycle without the application of fertilizers and herbicides) has thehighest and most sustainable EROEI values (17.5e41.8), followed bywillow cultivation option 2 (combustion of willow harvested on atwo-year short rotation cycle without using fertilizer, but with her-bicides during cultivation) (14.6e36.4). However, willow cultivationoption 2 has a higher NEG (net energy gain) value than willowoption 1 (willow cultivation option 1 ¼ 624.6e1778.0 GJ/ha, vs.willow cultivation option 2 ¼ 771.2e2214.4 GJ/ha). This is becausewillow option 2 compensated enough and returned some moreenergy on the energy it invests into herbicide production, trans-portation and application.
Willow cultivation option 3 (combustion of willow harvested forproduction of electricity or combined heat and electricity, on a three-year short rotation cycle with application of fertilizer and herbicidesduring cultivation) had the lowest and most unsustainable EROEIand NEG values (EROEI: 1.0e2.7, NEG: �11.11e1119.8 GJ/ha). This is
Table 5Common settings of four willow cultivation options.
Options Assumptions
Mixture of willow varieties Zw. driebast, Het Goor, Belders, Tora,Bjorn, Black Spaniard, Loden and Jorr
Planting density 18,000 ha�1
Final established density 15,000 ha�1
Biomass yields Remains the same from the 2nd harvestcycle to the last one, but the yields of the1st cycle (harvested sticks)were assumedto be 50% of the usual yield
Lifetime of cultivation 25 yrHarvesting Stick harvestingDrying Natural drying in the fieldChipping location at fieldMoisture content by weight at harvest ¼ 50%; after drying ¼ 25%Conversion process Biomass power plant at Twence:
combustion of biomass to generateelectricity, or combined heat and electricityproduction.
Please cite this article in press as: Voinov, A., et al., Estimating the potentiProduction (2015), http://dx.doi.org/10.1016/j.jclepro.2015.04.034
because the huge energy investments in fertilizers and herbicides arenot returned or justified by the yield gains harvested every threeyears. The application of fertilizer and herbicides for increase in yieldand harvest under the 3-year rotation cycle is therefore needless andshould be jettisoned in the study area, because it might even becounter-productive (having EROEI of less than 1 and a negative NEGmeans that more energy is invested than obtained). To put theseEROEI values in context we have collected some other results onefficiency of energy production in Table 8.
Although, reference system potential i.e. the gasification ofverge grass for production of electricity and combined heat andelectricity is less energy gainful and efficient in terms of NEG andEROEI (NEG: 776.5e1745 GJ/ha, EROEI: 16.5e32.6) compared tothat of willow cultivation options 1 (NEG: 624.62e1779.84 GJ/ha,EROEI: 17.5e41.8) and willow cultivation options 2 (NEG:771.24e2214.4 GJ/ha, EROEI: 14.59e36.37); it is still much moreenergy gainful and efficient thanwillow cultivation options 3 (NEG:-11.1-1119.8 GJ/ha, EROEI: 1.0e2.7). Besides it is more likely thatgrass can be grown on conditionally available lands. In the event ofpolicy constraints that do not favor the planting of willow onroadside soils as envisaged based on results from this study, itshould be accorded utmost priority to prevent wasting valuablebiomass and bioenergy resources as it is presently done under theexisting practices (dumping on compositing sites), with EROEIvalue of zero and negative NEG. Although, the willow cultivationoption 1 and willow cultivation option 2 looks quite desirable andattractive, in reality, the EROEI can only be maintained over the25-year cycle, if and only if the harvest yield is maintained and/orsustained. Although a handful of researches endorse the view thatpollutants from traffic on the road supplies diversity of nutrientsthat is good enough for supporting willow cultivation (Warren andBirch, 1987; Cuperus et al., 1996; Gommers et al., 2005), doubts stillexists, if the harvest yield can be maintained over a 25 year period,under intensive 2-year rotational harvest cycles without need forfertilizers periodically. Since fertilizer is the largest single energyinvestment in the life cycle of willow cultivation (constituting91.68e92.24%), its application for harvest yield maintenancesomewhere over the two-year rotation cycles for a 25-year periodwill have huge implications for the future sustainability of presentEROEI and NEG values for willow cultivation on roadside soils.
3.2. Areas available for production
The total area of road verges unconditionally available (withoutany constraints) along the four roads examined under this study is70.63 ha; while the total area of road verges available conditionally(based on negotiation of biodiversity or ecological constraints) is168.58 ha (Table 9). A sample map showing unconditionally andconditionally available road verges in the study area as obtainedfrom the GIS analysis can be found in Fig. 6. Wemay also derive that
al of roadside vegetation for bioenergy production, Journal of Cleaner

Table 7Energy input and output of the four cultivation options in 25 years. The number of rotations defines the amounts of energy used for cultivation and maintenance underdifferent scenarios.
Cultivation option Reference (grass) 1 (willow e natural) 2 (willow withherbicides)
3 (willow withherbicides and fertilizerson 3 yr rotation)
Activity No. of times in 25 years(rotation)
Energy input Energy input Energy input Energy input
0.5yr 2yr 3yr GJ/ha GJ/ha GJ/ha GJ/ha
Mowing and collection 25 1 1 20e26.5 0.80e1.06 0.80e1.06 0.80e1.06Soil preparation 1 1 2.05 2.05 2.05Cutting production 1 1 4.99 4.99 4.99Planting 1 1 1.11 1.11 1.11Cut-back 1 1 0.22e0.40 0.22e0.40 0.22e0.40Herbicidesa 0 9 0.0 18.98 13.14N fertilizerProduction
0 9 0.0 0.0 607.95
N fertilizerApplication
0 9 0.0 0.0 7.56b
Harvesting (cut andchip harvesting)
12 8 5.16e9.60 5.16e9.60 3.44e6.40
Natural drying & storage(approximately the samefor first 30 tonnes)
12 8 3.84e4.80 3.84e4.80 2.56e3.20
Transport (15 km) 25 12 8 27 12.96 12.96 8.64Termination 1 1 6.65 6.65 6.65Total energy input 47e53.5 37.78e43.62 56.76e62.60 659.11e663.15Total energy returnc 776.5e1745 662.4e1821.6 828e2278 648e1783EROEI 16.5e32.6 17.5e41.8 14.6e36.4 1.0e2.7Net Energy Gain NEG 729.5e1691.5 624.6e1778.0 771.2e2215.4 �11.1 to 1119.8
a Use of chemicals for crop protection currently is not allowed by Rijkswaterstaat. We present these values to estimate how potentially herbicides can influence the energyefficiency of the whole system.
b Harvesting cycle is 2 or 3 years and only one herbicide and fertilizer application takes place during a harvesting cycle.c The lower value corresponds to electricity only option, the higher is for combined heat and electricity generation.
A. Voinov et al. / Journal of Cleaner Production xxx (2015) 1e13 9
for A roads there is approximately 1.02e1.62 ha/km that arecurrently unconditionally available for willow biomass production,while another 2.61e3.66 ha/km or a total of 4.24e4.68 ha/km maybe available if some changes are made to the current regulations.For N roads the values are much lower, but the range is muchlarger: 0.37e0.80 ha/km and 0.43e1.88, respectively, or a total of
Table 8EROEI estimates for various energy sources. Note that the results largely dependupon the boundaries of the study and the assumptions that go into the calculations.The relatively high EROEI values registered in this study are largely explained by thefact that we are relying on existing energy producing and distribution infrastructure(Twence plant).
Energy source EROEI Reference
Natural gas 20e67 Hall et al., 2014Oil (1930) >100 Cleveland, 2005Oil and gas
(1970e2005)12e30 Cleveland et al., 1984;
Hall et al., 2014Coal 27e80 Hall et al., 2014Nuclear 5e15 Hall et al., 2014Hydropower >100 Hall et al., 2014Wind 15e18 Hall et al., 2014;
Murphy and Hall, 2010Road verge grass
for biogas2e3 Meyer et al., 2014
Leaf fall and organicwaste
6e15 Arodudu et al., 2014
Switchgrass or miscantuson urban lots
3e14 Arodudu et al., 2014
Rapeseed for biodiesel 2 Firrisa et al., 2013Biogas from crop residue 5e17 Arodudu et al., 2013Road verge willow for
electric and heatcogeneration
18e42 This study
Road verge grass for electricand heat cogeneration
17e33 This study
Please cite this article in press as: Voinov, A., et al., Estimating the potentiProduction (2015), http://dx.doi.org/10.1016/j.jclepro.2015.04.034
0.80e2.67 ha/km. One possible explanation for a much widervariability we saw for N roads is because N35 was at some pointdesigned as an extension of A35 and therefore has larger vergeareas than one would expect to see on regular N roads. The N18seems to be a more typical N-road and the amount of verge itproduces is probably a more useful estimate if we want to use thisto expand our analysis beyond the study area for other roads. Inwhat follows we have assumed that biomass is produced at thatproductivity uniformly along the span of each corresponding roadsegment.
The feasibility of generating energy (electricity) from roadsidebiomass (verge grass and willow SRC) can be discussed in thecontext of resource and environmental constraints. We are delib-erately ignoring the issues of economic, monetary accounting andprofitability because there is too much uncertainty and volatility inthe renewable energymarket so largely influenced by subsidies andfossil fuel prices.
The large difference between road verge area conditionally(168.58 ha) and unconditionally available (70.63 ha) along roads A1,A35, N18 and N35 indicates that there is great opportunity in uti-lizing conditionally available road verge for bioenergy production.As amatter of fact, from the land use map of the study area, the areaunder forest in eastern Overijssel is 102.47 km2, but only about 1.6%of it is roadside forest. Although roadside trees thicker than 8 cmare under protection by the Dutch Forest Act (Rijkswaterstaat,2008), it is suggested that other larger areas of forest fartheraway from the roads are actually better positioned for the protec-tion of valuable or vulnerable species than those close to theroadside due to the frequency and intensity of disturbance.Conditionally available land is larger than unconditionally availableland and more efforts are required to remove the current vegeta-tion (usually trees), therefore, the use of conditionally availableland needs more careful management. On the other hand, the soils
al of roadside vegetation for bioenergy production, Journal of Cleaner

Table 9Area and length calculations for the roads considered in this study. The uncondi-tionally available land is substantially less thanwhat may become available if certainenvironmental and land use constraints are lifted.
Roadname
Roadlength(km)
Cond_Avail.Area(ha)
Cond_Avail.Area(ha/km)
Total_Uncond_Avail._Area(ha)
Uncond_Avail.Area(ha/km)
A1 27.12 99.22 3.66 27.69 1.02A35 19.51 51.01 2.61 31.69 1.62N18 18.36 7.90 0.43 6.82 0.37N35 5.57 10.45 1.88 4.43 0.80Total A 46.63Total N 23.93Total 168.58 70.63
A. Voinov et al. / Journal of Cleaner Production xxx (2015) 1e1310
of conditionally available land are loamy because of the previouspresence of trees, rich in organic matter and nitrogen, and it isbetter for willow development (Mortensen et al., 1998). In this vein,exploring conditionally available road verge can be said to be quitefeasible. Also, 10 ha is considered the minimum operational scalefor the establishment of willow SRC (Abrahamson et al., 2002).Consequently, it can be concluded that the production of willowbiomass on available road verges in the study area is feasible interms of land availability.
In the Netherlands, the total biomass production in naturalfields is around 3 � 106 odt/yr,1 1.7 � 106 odt/yr of which iscontributed by forests and approximately 1 � 106 odt/yr fromgrassland. Due to conservation of biodiversity, only about1.9e2.3 � 106 odt/yr of the total amount of biomass can be har-vested annually (Spijker et al., 2007). The estimated biomass pro-duction on available road verge in the study area is relatively smallcompared to provincial and national demands (Table 10), and iswithin the capacity of the biomass processing power plant Twence,which can convert about 140 � 103 odt/yr. The slight increase ofbiomass input for the Twence biomass power plant will not becomea burden; it will only increase the green electricity production forthe Province.
Road verges can be mostly considered as wasteland. They arequite heavily polluted by depositions from fuel combustion, as wellas potential garbage and hazardous substances coming fromtransportation. They are also under intense disturbance due tonoise, light and motion of traffic. As such their natural conservationvalue is quite low. There is increasing interest in producing bio-energy from waste, crop residue and by-products (Arodudu et al.,2013). There are also programs in place that focus on usingcontaminated and disturbed lands to produce bioenergy (http://biomassmagazine.com/articles/5955/epa-doe-to-study-contaminated-lands-for-bioenergy-potential). As such road vergecan be very well considered in the same category.
The fact that these areas are already under heavy maintenancecertainly is important to consider when doing the overall estimates.Unlike the biomass production on natural grasslands and aban-doned pasturelands considered by Arodudu et al. (2013) the pro-duction on road verge will be much cheaper and energy efficientbecause it can be largely handled within the operations alreadystipulated by the existing road maintenance regulations. Theproximity to the road network and ease of access are the otherfactors that need to be taken into consideration.
1 odt e oven dry ton. 1 ton DM is not very different from odt; odt is also known asUS tons. odt ¼ 1000.5 kg; while ton DM ¼ 1000 kg. Since there is no significantdifference we will be using both units interchangeably.
Please cite this article in press as: Voinov, A., et al., Estimating the potentiProduction (2015), http://dx.doi.org/10.1016/j.jclepro.2015.04.034
4. Conclusions and recommendations
In eastern Overijssel, the amount of land available for willowSRC cultivation along A1, A35, N18 and N35 roads is about239.21 ha. However only 70.63 ha can be used without anyecological or land use concerns. If we can prove that stripes ofwillow are actually better serving the purposes of land use, con-servation, and, in some cases, road safety than grasslands, then wecan considerably increase the size of area available for itsproduction.
Four alternative management options for bioenergy productionon estimated available road verge were considered, in addition tothe reference option, which is currently used and which requiresgrass to be mowed and then composted. Other options consideredassume gasification of verge grass, and four willow cultivationoptions that are studied for different available area sizes, fertilizerand herbicide inputs, and rotation lengths. The comparison ofEROEI shows that willow cultivation on road verge, without anyapplication of fertilizer or herbicide has the best energy perfor-mance.While this study recommends this management option, it isstill not as efficient as common commercial cultivation of willow.However, if the energy input of the reference system (mowing andtransporting verge grass twice a year) is considered as a baseline, itwould actually become an energy and cost saving venture forRijkswaterstaat and municipal authorities, which currently are incharge of verge management in the Netherlands, but for whom itremains a cost rather than a revenue source.
With this paper we are continuing our quest for alternativesources of bio-energy that are in no conflict with agriculture ornature. We have previously considered urban, built-up areas(Arodudu et al., 2014); here we focus on areas that are availablealong the roads. Although the available road verge, biomass pro-duction, and energy generation even from the best willow culti-vation option are not significant comparing to the national or evenprovincial level in the Netherlands, the idea of making use of theDutch roads is definitely feasible from the perspectives of resourceconservation. It is also very likely to be beneficial from the financialand environmental viewpoints. The presently unused road vergecan be easily turned into a feedstock for biomass, producing addi-tional energy and financial gains. This kind of bioenergy productionshould therefore be accorded attention, its marginal contributionnotwithstanding. In the event of an acute shortage and furtherdepletion of the Earth's fossil fuel resources and supplies, and aneventual need for stronger commitments to the implementation ofclimate change mitigation options, road verges might end up beinga valuable contributor to ensuring energy sustainability by com-plementing other renewable energy sources in the energy mix.Certainly a comprehensive Life Cycle Impact Assessment, takinginto account other main damage categories (climate change, re-sources, ecosystem quality, human health) will be required beforefinal decisions are made, however here we already see that fromthe energy efficiency (EROEI) point of view the scenarios of lowinput willow and grass production can be feasible and beneficial forthe energy system of Overijssel province.
Switching to alternative energy sources and developing policiesthat would promote them is not going to be easy. Even if we knowthe stakes and benefits involved in such transitions, translatingthem into action is not straightforward and may require additionalresearch of the decision making processes, perhaps applying suchtechniques as co-evolutionary games (Perc& Szolnoki, 2010), agentbased modeling (Filatova et al., 2013) and participatory modeling(Voinov & Bousquet, 2010).
For now what we find is that with 137,000 km of roads,Netherlands is poised to be able to produce quite significantamounts of biomass for energy if road verge is harvested. Assuming
al of roadside vegetation for bioenergy production, Journal of Cleaner

Table 10Biomass production from verge grass and cultivation options for willow SRC for theanalyzed roads.
Cultivation option Reference 1 2 3
Yield (t/ha/year)(Table 6)
8 16 20 24
Annual yield(odt/yr/ha)
0.32 0.64 0.8 0.96
Annual yield onunconditionalareas (odt/yr)
565.06 1130.13 1412.66 1695.19
Annual yield on total(unconditional andconditional) areas(odt/yr)
1913.72 3827.44 4784.29 5741.15
NEG max (total) (GJ/yr) 129482 272207 423965 257158NEG min (total) (GJ/yr) 55842 95625 147586 �2549
Fig. 6. Visualization of sample conditionally and unconditionally available areas for willow development. Maps are produced by using sequences of spatial operators relied tovarious conditional statements and applied to the cadastral data.
A. Voinov et al. / Journal of Cleaner Production xxx (2015) 1e13 11
the very conservative estimate of verge area per ha in Table 9 wecan calculate that if the entire unconditionally available road vergeis used for bioenergy production we can expect that some50e177 PJ can be produced annually, depending upon the cultiva-tion and processing technology chosen. This number can go up to149e527 PJ if the conditionally available road verge is brought intothe production. This can already be a substantial part of the2.1 EJ estimated as minimum target of renewable energy produc-tion by the year 2020; and perhaps even provide all of the 54.5%that is expected to be from biomass sources (0.30 EJ) (Atanasiu,2010). It is also very promising that all this energy can be pro-ducedwith relatively high efficiencies (Table 8) and at no additionalsocial and environmental costs for the society.
Acknowledgments
A. Voinov was partially supported by the BE2.O (Bioenergy forOverijssel) project and by the EU-FP7-308601 COMPLEX project.Funding from the Erasmus Mundus program was instrumental insupporting Ling Qin and Oludunsin Arodudu. Our thanks are alsodue to Arjan Reuver (Assistant Maintenance Manager, RWS EastNetherlands), Hans Nieuwenhuis (Project manager of De Jong enZoon Beesd BV), Guido Debeus (Manager of Division Innovation &Implementation, Dienst Verkeer en Scheepvaart), J. W. Slijkhuis(Roads and Waterways Management, Province Overijssel and to
Please cite this article in press as: Voinov, A., et al., Estimating the potentiProduction (2015), http://dx.doi.org/10.1016/j.jclepro.2015.04.034
personnel from Rijkswaterstaat East Netherlands for providingimportant insight about the current road verge managementpractices.
References
Abrahamson, L.P., Volk, T.A., Kopp, R.F., White, E.H., Ballard, J.L., 2002. WillowBiomass Producer's Handbook. State University of New York, College of Envi-ronmental Science and Forestry, Syracuse, NY.
AEA Energy and Environment, 2008. Biomass Environmental Assessment ToolVersion 2 User Guide. DEFRA, Biomass Energy Centre, Environment Agency, UK.
Arodudu, O.T., Voinov, A., van Duren, I., 2013. Assessing bioenergy potentials in ruralareas. Biomass Bioenergy 58 (38), 350e364. http://dx.doi.org/10.1016/j.biombioe.2013.07.020.
Arodudu, O.T., Ibrahim, E.S., Voinov, A., van Duren, I., 2014. Exploring bioenergypotentials of built-up areas based on NEG-EROEI indicators. Ecol. Indic. http://dx.doi.org/10.1016/j.ecolind.2014.04.042.
Atanasiu, B., 2010 Nov.. The Role of Bioenergy in the National Renewable EnergyAction Plans: a First Identification of Issues and Uncertainties. Institute forEuropean Environmental Policy (IEEP), Bonn (Germany), p. 23.
Basu, P., 2010. Definition of Biomass. Biomass Gasification Design Handbook.Academic Press, Boston.
Berglund, M., B€orjesson, P., 2006. Assessment of energy performance in the life-cycle of biogas production. Biomass Bioenergy 30, 254e266.
Boosten, M., 2009. Poster: ‘Short Rotation Coppice (SRC) in the Netherlands’.International Energy Farming Congress, Papenburg, Germany.
B€orjesson, P.I.I., 1996. Energy analysis of biomass production and transportation.Biomass Bioenergy 11, 305e318.
B€orjesson, P., Mattiasson, B., 2008. Biogas as a resource-efficient vehicle fuel. TrendsBiotechnol. 26, 7e13.
B€orjesson, P., Tufvesson, L.M., 2011. Agricultural crop-based biofuels e resource effi-ciency and environmental performance including direct land use changes.J. Clean. Prod. 19 (2e3), 108e120. http://dx.doi.org/10.1016/j.jclepro.2010.01.001.
Borst, R.H.J., Sprong, R., 2006. GEDRAGSCODE: Bestendig beheer groenvoorzienin-gen (Code of Green Management Service). Vereniging Stadswerk Nederland,Vakgroep Groen, Natuur en Landschap Vereniging van Hoveniers en Groen-voorzieners (VHG), The Netherlands.
Bridgewater, A.V., 2001. Thermal conversion of Biomass and Waste: the Status. Bio-Energy Research Group. Aston University, Birmingham (UK).
Bridgewater, A.V., Peacocke, G.V.C., 2000. Fast pyrolysis processes for biomass.Renew. Sustain Energy Rev. 4, 1e73.
Bussel, L.V., 2006. The Potential Contribution of a Shortrotation Willow Plantationto Mitigate Climate Change. Msc thesis. Wageningen University, TheNetherlands.
Caslin, B., Finnan, J., McCracken, A. (Eds.), 2010. Short Rotation Coppice Willow BestPractice Guidelines: Teagasc. Crops Research Centre, Oak Park, Carlow; AFBI,Agri-Food and Bioscience Institute, Newforge Lane, Belfast.
Central Bureau of Statistics, 2009. Renewable Energy in the Netherlands 2008. TheHague.
Central Bureau of Statistics, 2011. Traffic and Transport [Online]. Available: http://www.cbs.nl/en-GB/menu/themas/verkeer-vervoer/nieuws/default.htm [accessed01.01.11].
al of roadside vegetation for bioenergy production, Journal of Cleaner

A. Voinov et al. / Journal of Cleaner Production xxx (2015) 1e1312
Ceulemans, R., McDonald, A.J.S., Pereira, J.S., 1996. A comparison among eucalypt,poplar and willow characteristics with particular reference to a coppice,growth-modelling approach. Biomass Bioenergy 11, 215e231.
Cleveland, C.J., 2005. Net energy from oil and gas extraction in the United States,1954e1997. Energy 30, 769e782.
Cleveland, C.J., Costanza, R., Hall, C.A.S., Kaufmann, R., 1984. Energy and the U.S.Economy: a biophysical perspective. Science 225, 890e897.
Cuperus, R., Canters, K.J., Piepers, A.A.G., 1996. Ecological compensation of theimpacts of a road. Preliminary method for the A50 road link (Eindhoven-Oss,The Netherlands). Ecol. Eng. 7, 327e349.
DEFRA, 2004. Growing Short Rotation Coppice. Best Practice Guidelines for Appli-cants to DEFRA's Energy Crops Scheme. Department for Environment, Food andRural Affairs, UK.
Demirbas, A., 2005. Potential applications of renewable energy sources, biomasscombustion problems in boiler power systems and combustion related envi-ronmental issues. Prog. Energy Combust. Sci. 31, 171e192.
Demirbas, A., 2007. Progress and recent trends in biofuels. Prog. Energy Combust.Sci. 33, 1e18.
Eck, R.W., McGee, H.W., 2008. Vegetation Control for Safety, a Guide for LocalHighway and Street Maintenance Personnel. Vanasse Hangen Brustlin Inc,Vienna, VA.
Encyclopedia of the Nations, 2007. Road density (km of road per sq. km of land area)e Transportation e Infrastructure e World Development Indicators. Encyclo-pedia of the Nations. Advameg, Inc.
Energy Research Centre of the Netherlands, 1998. Phyllis Database on the Compo-sition of Biomass and Waste. Energy research Centre of the Netherlands.
Europe's Energy Portal, 2010. Statistics of Renewables: 2006-2010 [Online]. Avail-able: http://www.energy.eu/#renewable [accessed 12.08.10].
European Commission, 2007. MEMO/07/8: Aiming towards a Low CO2 Fossil FuelFuture. European Communities, Brussels.
European Parliament & European Council, 2009. Directive 2009/28/EC on thePromotion of the Use of Energy from Renewable Sources and Amending andSubsequently Repealing Directives 2001/77/EC and 2003/30/EC. EuropeanCommission, Brussels.
Faaij, A., van Doorn, J., Curvers, T., Waldheim, L., Olsson, E., Van Wijk, A.,Daey-Ouwens, C., 1997. Characteristics and availability of biomass waste andresidues in The Netherlands for gasification. Biomass Bioenerg. 12, 225e240.
Faaij, A., Meuleman, B., Turkenburg, W., van Wijk, A., Ausilio, B., Rosillo-Calle, F.,Hall, D., 1998. Externalities of biomass based electricity production comparedwith power generation from coal in the Netherlands. Biomass Bioenerg. 14,125e147.
Filatova, T., Verburg, P.H., Parker, D., Stannard, C.A., July 2013. Spatial agent-basedmodels for socio-ecological systems: challenges and prospects. Environ.Model. Softw. 45, 1e7. http://dx.doi.org/10.1016/j.envsoft.2013.03.017.
Firrisa, M.T., van Duren, I., Voinov, A., 2013. Energy efficiency for rapeseed biodieselproduction in different farming systems. Energy Effic. http://dx.doi.org/10.1007/s12053-013-9201-2 (April 12).
Fischer, G., Prieler, S., van Velthuizen, H., Lensink, S.M., Londo, M., de Wit, M., 2010.Biofuel production potentials in Europe: sustainable use of cultivated land andpastures. Part I: land productivity potentials. Biomass Bioenergy 34, 159e172.
Gigler, J.K., Meeusen-van Onna, M.J.G., Annevelink, E. (Eds.), 1999. Kansen voorenergie uit biomassa! Resultaten van een 4-jarig DLO-onderzoekprogramma.Dienst Landbouwkundig Onderzoek, Wageningen.
Gommers, A., G€afvert, T., Smolders, E., Merckx, R., Vandenhove, H., 2005. Radio-caesium soil-to-wood transfer in commercial willow short rotation coppice oncontaminated farm land. J. Environ. Radioact. 78, 267e287.
Gonz�alez-García, S., Moreira, M.T., Dias, A.C., Mola-Yudego, B., 2014. Cradle-to-gatelife cycle assessment of forest operations in Europe: environmental andenergy profiles. J. Clean. Prod. 66, 188e198. http://dx.doi.org/10.1016/j.jclepro.2013.11.067.
Gray, K.A., Zhao, L., Emptage, M., 2006. Bioethanol. Curr. Opin. Chem. Biol. 10,141e146.
Grisso, R., Perumpral, J.V., Vaughan, D., Roberson, G.T., Pitman, R., 2010. PredictingTractor Diesel Fuel Consumption. Virginia Cooperative Extension, Virginia Tech,Virginia State University, 442e073.
Haines-Young, R.H., Barr, C.J., Black, H.I.J., Briggs, D.J., Bunce, R.G.H., Clarke, R.T.,Cooper, A., Dawson, F.H., Firbank, L.G., Fuller, R.M., Furse, M.T., Gillespie, M.K.,Hill, R., Hornung, M., Howard, D.C., McCann, T., Morecroft, M.D., Petit, S.,Sier, A.R.J., Smart, S.M., Smith, G.M., Stott, A.P., Stuart, R.C., Watkins, J.W., 2000.Accounting for Nature: Assessing Habitats in the UK Countryside. Departmentof the Environment, Transport and the Regions, London.
Hall, C.A.S., Lambert, J.G., Balogh, S.B., 2014. EROI of different fuels and the impli-cations for society. Energy Policy 64, 141e152. Available at: http://dx.doi.org/10.1016/j.enpol.2013.05.049.
Hall, C.A.S., Balogh, S., Murphy, D.J.R., 2009. What is the minimum EROI that asustainable society must have? Energies 2 (1), 25e47.
Harwood, D., Mason, J., Brydia, R., Joubert, H., Lamm, R., Psarianos, B., 1995. Inter-national sight distance design practices. In: Proceedings of the InternationalSymposium on Highway Geometric Design Practices. Boston, MA, USA.
Harwood, D.W., Mason, J.M., Brydia, R.E., April 1999. Design policies for sight dis-tance at stop-controlled intersections based on gap acceptance. Transp. Res.Part A: Policy Pract. 33 (3e4), 199e216. http://dx.doi.org/10.1016/S0965-8564(98)00040-8.
Heller, M.C., Keoleian, G.A., Volk, T.A., 2003. Life cycle assessment of a willow bio-energy cropping system. Biomass Bioenergy 25, 147e165.
Please cite this article in press as: Voinov, A., et al., Estimating the potentiProduction (2015), http://dx.doi.org/10.1016/j.jclepro.2015.04.034
Huang, B.K., 1987. Dynamic simulation of a vehicle interaction with biological andphysical systems. In: American Control Conference, 1987. Minneapolis,MN, USA.
Huisman, W., 2003. Optimising harvesting and storage systems for energy crops inThe Netherlands. In: International Conference on Crop Harvesting and Pro-cessing. Louisville, Kentucky, USA.
Jenkins, B.M., Baxter, I.L., Miles, T.R., 1998. Combustion properties of biomass. FuelProcess. Technol. 54, 17e46.
Kim, S., Dale, B.E., 2005. Life cycle assessment of various cropping systems utilized forproducing biofuels: bioethanol and biodiesel. Biomass Bioenerg. 29, 426e439.
Kuiper, L., 2003. Samenvatting van de resultaten van zes jaar onderzoek naarenergieteelt Centrum voor Biomassa Innovatie. Wageningen.
Kumar, G., Bakonyi, P., Periyasamy, S., Kim, S.H., Nemest�othy, N., B�elafi-Bak�o, K.,2015. Lignocellulose biohydrogen: practical challenges and recent progress.Renew. Sustain. Energy Rev. 44, 728e737. http://dx.doi.org/10.1016/j.rser.2015.01.042.
Lechasseur, G., Savoie, P., 2005. In: . Cutting, Bundling and Chipping Short-rotationwillow. CSAE/SCGR 2005 Meeting. Winnipeg, Manitoba, Canada.
Lettens, S., Muys, B., Ceulemans, R., Moons, E., Garcia, J., Coppin, P., 2003. Energybudget and greenhouse gas balance evaluation of sustainable coppice systemsfor energy production. Biomass Bioenerg. 24, 179e197.
Londo, H.M., 2002. Energy Farming in Multiple Land Use: an Opportunity for EnergyCrop Introduction in the Netherlands. Ph.D. thesis. Utrecht University.
Londo, M., Roose, M., Dekker, J., de Graaf, H., 2004. Willow short-rotation coppice inmultiple land-use systems: evaluation of four combination options in the Dutchcontext. Biomass Bioenergy 27, 205e221.
Luque, R., Herrero-Davila, L., Campelo, J.M., Clark, J.H., Hidalgo, J.M., Luna, D.,Marinas, J.M., Romero, A.A., 2008. Biofuels: a technological perspective. Energy& Environ. Sci. 1, 542e564.
Matthews, R., 2001. Modelling of energy and carbon budgets of wood fuel coppicesystems. Biomass Bioenergy 21, 1e19.
McKendry, P., 2002a. Energy production from biomass (part 1): overview ofbiomass. Bioresour. Technol. 83, 37e64.
McKendry, P., 2002b. Energy production from biomass (part 2): conversion tech-nologies. Bioresour. Technol. 83, 47e54.
Meyer, A.K.P., Ehimen, E.A., Holm-Nielsen, J.B., 2014. Bioenergy production fromroadside grass: a case study of the feasibility of using roadside grass for biogasproduction in Denmark. Resour. Conserv. Recycl. 93, 124e133. http://dx.doi.org/10.1016/j.resconrec.2014.10.003.
Ministerie van, L.N.V., 2000. Uitvoering Boswet Rijkswaterstaat. Ministerie van LNV,Den Haag.
Mortensen, J., Hauge Nielsen, K., Jørgensen, U., 1998. Nitrate leaching duringestablishment of willow (Salix viminalis) on two soil types and at two fertil-ization levels. Biomass Bioenerg. 15, 457e466.
Murphy, D.J., Hall, C.A.S., 2010. Year in revieweEROI or energy return on (energy)invested. Ann. York Acad. Sci. 1185, 102e118. Available at: http://www.ncbi.nlm.nih.gov/pubmed/20146764.
Nguyen, T.L.T., Hermansen, J.E., Nielsen, R.G., 2013. Environmental assessment ofgasification technology for biomass conversion to energy in comparison withother alternatives: the case of wheat straw. J. Clean. Prod. 53, 138e148. http://dx.doi.org/10.1016/j.jclepro.2013.04.004.
Ni, M., Leung, D.Y.C., Leung, M.K.H., Sumathy, K., 2006. An overview of hydrogenproduction from biomass. Fuel Process. Technol. 87, 461e472.
Nordh, N.E., Dimitriou, I., 2003. Harvest Techniques in Europe. Short Rotation Cropsfor Bioenergy. New Zealand.
€Olz, S., Sims, R., Kirchner, N., 2007. Contribution of Renewables to Energy Security.Renewable Energy Working Party. International Energy Agency.
Provincie Overijssel, 2010. Vlotte en veilige kruispunten (Safe intersections)[Online]. Available: http://www.overijssel.nl/thema's/bereikbaar/overijssel-doet/vlotte-veilige/ [accessed 06.12.10].
Perc, M., Szolnoki, A., 2010. Coevolutionary games e a mini review. BioSystems 99,109e125. http://dx.doi.org/10.1016/j.biosystems.2009.10.003.
Petersson, A., Thomsen, M.H., Hauggaard-Nielsen, H., Thomsen, A.B., 2007. Potentialbioethanol and biogas production using lignocellulosic biomass from winterrye, oilseed rape and faba bean. Biomass Bioenergy 31, 812e819.
Ponton, J.W., 2009. Biofuels: thermodynamic sense and nonsense. J. Clean. Prod. 17,896e899.
Ramstedt, M., 1999. Rust disease on willows e virulence variation and resistancebreeding strategies. For. Ecol. Manag. 121, 101e111.
Rijkswaterstaat & Dienst Weg- en Waterbouwkunde, 2006. Leidraad beheergroenvoorzieningen (Green management guidance). Ministerie van Verkeer enWaterstaat, Amsterdam.
Rijkswaterstaat, 2008. Overzicht van de vegetatie langs Rijkswegen (Overview ofthe vegetation along National Road). Ministerie van Verkeer en Waterstaat,Amsterdam.
Schepers, J.A.M., Haperen, A.A.M., van der Jagt, J.L.E., 1992. Grienden: hakken oflaten groeien: inventarisatie van het hakgriendenareaal en mogelijkheden voorontwikkeling (Traditional willow coppice: coppicing or letting grow; an in-ventory of the arsenal of traditional willow coppice and potentials for devel-opment). Utrecht, IKC-NBLF.
Spijker, J.H., Elbersen, H.W., Jong, J.J.D., Berg, C.A.V.D., Niemeijer, C.M., 2007. Bio-massa voor energie uit de Nederlandse natuur : een inventarisatie van hoe-veelheden, potenties en knelpunten (Biomass energy from the Dutch nature: aninventory of amounts, and potential bottlenecks). Biobased Products, CentrumLandschap, Wageningen.
al of roadside vegetation for bioenergy production, Journal of Cleaner

A. Voinov et al. / Journal of Cleaner Production xxx (2015) 1e13 13
Staatsuitgeverij, 1986. Richtlijnen Voor Het Ontwerpen Van Niet-AutoschnellwegenBuiten de Bebouwde Kom. In: KRESIPUNTEN. Staatsuitgeverij, Hague.
Truscott, A.M., Palmer, S.C.F., McGowan, G.M., Cape, J.N., Smart, S., 2005. Vegetationcomposition of roadside verges in Scotland: the effects of nitrogen deposition,disturbance and management. Environ. Pollut. 136, 109e118.
Tubby, L., Armstrong, A., 2002. Establishment and management of short rotationcoppice. In: Forest Commission. Edinburgh, UK.
Twence, 2009. Sustainability Report. Hengelo.van der Heijden, L.A.M., Martens, M.J.M., 1982. Traffic noise reduction by means of
surface wave exclusion above parallel grooves in the roadside. Appl. Acoust. 15,329e339.
van Duren, I., Voinov, A., Arodudu, O.T., Firissa, M.T., 2015. Where toProduce Rapeseed Biodiesel and Why? Mapping European RME Energy Effi-ciency in Different Agro-ecological Conditions. http://dx.doi.org/10.1016/j.renene.2014.07.016.
Van Strien, W., Tabak, A., van den Hengel, B., Cuperus, R., Viering, J., 2005.Beheerskosten en natuurwaarden van groenvoorzieningen langs wegen. DWW-rapport nr DWW-2005-078. Dienst Weg- en Waterbouwkunde, Delft, ISBN 90-369-5603-X.
Visser, H., 2010. Total Length Dutch Roads Stretches Halfway to the Moon [Online].Statisitcs Netherlands. Available: http://www.cbs.nl/en-GB/menu/themas/
Please cite this article in press as: Voinov, A., et al., Estimating the potentiProduction (2015), http://dx.doi.org/10.1016/j.jclepro.2015.04.034
dossiers/nederland-regionaal/publicaties/artikelen/archief/2010/2010-3247-wm.htm?RefererType¼RSSItem&RSSFeedTitle¼Bevolking [accessed 24.11.10].
Voinov, A., Bousquet, F., 2010. Modelling with stakeholders. Environ. Model. Softw.25 (May), 1268e1281. http://dx.doi.org/10.1016/j.envsoft.2010.03.007.
Volk, T.A., Verwijst, T., Tharakan, P.J., Abrahamson, L.P., White, E.H., 2004. Growingfuel: a sustainability assessment of willow biomass crops. Front. Ecol. Environ. 2,411e418.
Volk, T.A., Buchholz, T., Castellano, P., Abrahamson, L., Smart, L., 2009. Year. Woodybiomass from forests and Fields. In: Heating the Northeast. Nashua, NH. SUNY-ESF, Syracuse, NY. April 29e30 2009.
Vollebergh, H., 1997. Environmental externalities and social optimality in biomassmarkets: waste-to-energy in The Netherlands and biofuels in France. EnergyPolicy 25, 605e621.
Warren, R.S., Birch, P., 1987. Heavy metal levels in atmospheric particulates, road-side dust and soil along a major urban highway. Sci. Total Environ. 59, 253e256.
Weih, M., 2004. Intensive short rotation forestry in boreal climates: present andfuture perspectives. Can. J. For. Res. 34, 1369e1378.
Zuwala, J., 2012. Life cycle approach for energy and environmental analysis ofbiomass and coal co-firing in CHP plant with backpressure turbine. J. Clean.Prod. 35, 164e175. http://dx.doi.org/10.1016/j.jclepro.2012.06.001.
al of roadside vegetation for bioenergy production, Journal of Cleaner