estimating the size of external effects of energy ... · pdf fileestimating the size of...
TRANSCRIPT
Policy Research Working Paper 7227
Estimating the Size of External Effects of Energy Subsidies in Transport and Agriculture
Simon CommanderZlatko Nikoloski
Maria Vagliasindi
Energy and Extractives Global Practice GroupApril 2015
WPS7227P
ublic
Dis
clos
ure
Aut
horiz
edP
ublic
Dis
clos
ure
Aut
horiz
edP
ublic
Dis
clos
ure
Aut
horiz
edP
ublic
Dis
clos
ure
Aut
horiz
ed

Produced by the Research Support Team
Abstract
The Policy Research Working Paper Series disseminates the findings of work in progress to encourage the exchange of ideas about development issues. An objective of the series is to get the findings out quickly, even if the presentations are less than fully polished. The papers carry the names of the authors and should be cited accordingly. The findings, interpretations, and conclusions expressed in this paper are entirely those of the authors. They do not necessarily represent the views of the International Bank for Reconstruction and Development/World Bank and its affiliated organizations, or those of the Executive Directors of the World Bank or the governments they represent.
Policy Research Working Paper 7227
This paper is a product of the Energy and Extractives Global Practice Group. It is part of a larger effort by the World Bank to provide open access to its research and make a contribution to development policy discussions around the world. Policy Research Working Papers are also posted on the Web at http://econ.worldbank.org. The authors may be contacted at [email protected].
It is widely accepted that the costs of underpricing energy are large, whether in advanced or developing countries. This paper explores how large these costs can be by focussing on the size of the external effects that energy subsidies in particular generate in two important sectors—transport and agriculture—in two countries in the Middle East and North Africa, the Arab Republic of Egypt (transport) and the Republic of Yemen (agriculture). The focus is mainly on the costs associated with congestion and pollution, as well as the impact of underpriced energy for depletion of scarce water resources, including through crop selection. Quanti-fying the size of external effects in developing countries has
received relatively little analytical attention, although there is a significant body of literature for developed countries. By building on earlier research, as well as employing the United Nations ForFITS model, the paper provides indicative esti-mates of the external costs of energy subsidies, as manifested in congestion and pollution. The estimates using simula-tions indicate that these costs could be materially reduced by elimination or reduction of energy subsidies. The paper also describes the impact of energy subsidies on water consumption in a region where water resources are particu-larly limited. The findings provide further evidence of the adverse and significant consequences of subsidizing energy.

Estimating the Size of External Effects of Energy
Subsidies in Transport and Agriculture
Simon Commander, Zlatko Nikoloski and Maria Vagliasindi1
Keywords: energy subsidies, pollution, congestion, health effects of energy subsidies
JEL classification codes: O13, R41, Q41, Q53, I15
1 Author affiliations: Simon Commander, Altura Partners and IE Business School, [email protected]; Zlatko Nikoloski, London School of Economics, [email protected] and Maria Vagliasindi, World Bank, [email protected]. Our special thanks go to Shanta Devarajan and Junaid Ahmad for their excellent advice and support throughout the preparation of this paper and to Hanane Ahmed, Pierpaolo Cazzola, Ziad Nakat, Maurice Saade, Andreas Schliessler, Steven Schonberger, Caroline van den Berg, and Patricia Veevers-Carter for their helpful suggestions.
2
1. Introduction
The underpricing of energy – notably fuel products – has a predictable, and sometimes
significant, impact on demand. Energy subsidies – if persistent – can also affect the dynamic
factor mix, creating a bias for energy-intensive production and usage. Indeed, existing evidence
from MENA indicates that pervasive energy subsidies have created large distortions in markets
and investment choices.
One consequence of the underpricing of energy that is relatively understudied and quantified
concerns the external costs that arise through the pollution and congestion that result from
excess use of fossil-fuel-powered vehicles, as well as the associated transport modal choices. For
example, evidence from the Arab Republic of Egypt, notably Cairo, indicates massive – and
growing - congestion with high levels of associated pollution, part of which can be attributed to
the excess demand for private vehicles and fuel consumption that results from the large subsidies
that fuels attract. While transport – particularly road transport – may offer a particularly stark
illustration of the external costs, significant costs may also arise in other sectors. In agriculture,
fuel subsidies – depending on the institutional and pricing arrangements for water supply – can
lead to over-rapid depletion of water reserves and to crop selection that may principally reflect
the underpricing of water rather than the comparative advantage of the country or region.
Similarly in manufacturing, the sectoral mix of output and employment may be directly affected
by the price of energy that may also influence the choice of technology. When energy prices are
low, production will tend to be energy intensive and wasteful and this is often associated with
relatively high rates of pollution and other external effects.
The magnitude of external effects associated with the underpricing of energy has not been
consistently measured. However, the IMF (2013) has attempted to estimate the difference
between pre- and post-tax subsidies where the latter include a tax aimed at charging for external
effects linked to pollution, CO2 emissions, congestion and so on, as well as an additional tax on
energy consistent with the standard indirect tax rates applying in the country. Although their
calculation is clearly very approximate, it provides an initial reference point. For Egypt the gap
between pre-and post-tax subsidies expressed as a share of government revenues was over 8
percentage points (30.6 versus 39.1) in 2011. This discrepancy is far from trivial and for reasons
that will become clear later, is likely to be an underestimate.
This paper is exploratory – not least because of serious data limitations - and as a consequence
we restrict our attention to understanding the size of external effects of energy subsidies in two
sectors – transport and agriculture – focusing, in the first instance, on the congestion and
pollution costs and, in the second instance, focusing on resource (water) depletion and crop
selection. At this point, two locations are selected – Cairo in Egypt for the transport dimension
and the Republic of Yemen for the agriculture dimension.
The paper is organized as follows. Section 2 identifies the external effects that we are interested
in and the main channels or processes through which energy pricing affects the main variables of
interest. It then outlines how they affect the performance of economic actors and the economy
as a whole. In discussing the main methodological and empirical issues it also reviews the results
of earlier, relevant studies. Section 3 then provides evidence for transport from the MENA

3
region concerning both context and selected outcomes. Section 4 then looks in more detail at
Egypt starting with an overview of fuel pricing before turning to estimates of the costs of
congestion and pollution. Section 5 is concerned with the water-energy nexus and the ways in
which mispricing of energy affects water use and depletion with a specific emphasis on the
Republic of Yemen. Section 6 provides a first, tentative estimate of the costs of pollution and
congestion drawing on data contained in a recent World Bank study of Cairo. These measures
are linked to a wider health/productivity indicator initially assembled by the World Health
Organization, termed DALY. We provide a simple simulation of the impact of energy price
increases (viz., reduction in subsidy) on these variables. Section 7 lays out a more extended
modeling framework (relying on the UN ForFITS model) that we apply to measure the impact
of energy pricing on pollution, congestion and CO2 emissions, as well as capturing the
interactive effects relating to modes of transport and substitutions across modes. More
specifically, this section represents a simulation exercise that links various scenarios (changes in
international oil prices and reduction in domestic subsidies, both in medium and short term) to
the overall CO2 emissions. The results from this exercise are then used to quantify the
cumulative health effect of energy subsidies reduction.
2. Transport: External effects and the main channels
Vehicular transport reliant on fossil fuels generates a range of effects that have economic costs.
These can be grouped under a number of rubrics. The first relates to the direct effect of
emissions. There is a substantial body of evidence that vehicle emissions can affect not only
individuals’ health but also have a wider effect on climate change variables, the consequences of
which may be both local and global, although these may not be easily quantifiable. Regarding the
first channel, the usual way of thinking about this is to try to estimate what the emissions
associated with vehicle usage do to a set of health indicators and, by implication, to productivity.
A negative shock to health – whether through a fall in life expectancy or an increase in morbidity
– will have a direct impact on productivity and potentially on growth. For simplicity, this can be
termed the productivity channel where the link is from use of a particular set of transport
technologies to emissions to health outcomes. In these instances, there may be a complex lag
structure and some important non-linearities. For example, emissions may reach certain
thresholds beyond which health outcomes deteriorate at an accelerated pace. But fossil-fuel
transport use will also tend to affect productivity through further related channels. Notably,
congestion – resulting from an excess of vehicles for a given stock of transport infrastructure –
will affect the amount of time that people require for, inter alia, getting to and from work and
hence act as an effective subtraction from working time. There may in addition be a host of
other more intangible effects of a psychological nature that can have an impact on individuals’
behavior and productivity. Anecdotal data from a wide range of locations – not just in MENA –
suggests that these effects can be large and highly deleterious.
To this point, the broad problem has been framed in terms of an impact of a broad technology
on outcomes at the level of individuals with that impact then aggregating to impose some
economy-wide impact. However, our problem in this paper is narrower. Specifically, we are
interested in the marginal impact of an energy price subsidy – defined as the deviation from a

4
market price – on demand and ultimately through consumption on the external indicators,
congestion and pollution in the case of transport, and through these the wider economic and
social costs that are imposed. As such, we are interested in measuring the incremental impact on
pollution and congestion that result from the underpricing of energy.
Our aim at this stage is to arrive at some initial benchmark estimates of the scale of these costs
using a variety of measures. An important caveat is in order at this point. Such calculations tend
to require highly disaggregated information, whether on types of vehicle use and occupancy, as
well as on outcome variables, whether it be congestion and/or pollution themselves or
associated indicators, such as accidents. There is also the link to be made between the variables
of interest – congestion and pollution – and individuals’ productivity. Each of these steps is
relatively data-intensive. Yet, the reality is that for most developing countries, including in
MENA, such data are not available or are limited in coverage and quality. This necessarily makes
precision in calculation difficult, if not impossible. To surmount these major limitations, we
have, in the initial part of the paper, recourse to values or parameter estimates that may be drawn
from more data-rich contexts, either from advanced economies or other MENA countries.
2.1 Agriculture
Our main focus in this paper is on how energy subsidies might have an impact upon: (i) water
usage (primarily through affecting the cost of pumping) and, (ii) crop selection. Much of the
available literature has focused on India where two main channels through which energy
subsidies impact upon the economy have been identified. First, they have encouraged farmers to
withdraw groundwater at high, probably unsustainable, rates. The rapid rates of groundwater
extraction lowers groundwater tables, which in turn requires more energy to pump water to the
surface: this process creates a trap in which eliminating or lowering the subsidy leads to
groundwater extraction costs that would make agricultural production unprofitable for many
farmers. Second, the excessive use of electricity in water extraction makes electricity more
expensive for the non-farm economy, inhibiting thus the non-farm economy’s ability to absorb
labor from the farm economy, and hence, serves as a drag on the county’s economic growth
potential (IFPRI (2011)).
Based upon this, Nelson et al. (2013) use a computable general equilibrium model to evaluate the
economic impact of groundwater depletion on the agricultural and non-agricultural sectors of
Punjab and the rest of India. Their findings suggest that eliminating electricity subsidies for
irrigation could lead to less groundwater consumption and lower agricultural production levels
and agricultural income, while increasing the productivity and income of the non-farm sectors
(via decreased energy prices). When cutting the electricity subsidy, the results suggest that
farmers could decrease water use by 30%, while minimally hurting agricultural value-added
economy (a decrease of approximately 5% of income in 2007 dollars). Perhaps more surprising is
the finding that this could be associated with a very large increase in manufacturing output.
Additional methodologies for assessing the link between energy and agriculture include input-
output models. In the Malaysian context, Bekhet (2010) uses an input-output model to estimate
the link between three energy sectors and agriculture for the period 1991-2000. The analysis
shows that the agriculture sector is heavily based upon inputs from petrol and coal industries,

5
most notably because of subsidized energy products. Given the weak linkages between
agriculture and the electricity and gas sectors, the paper advocates switching to these energy
products whenever possible.
Using co-integration analysis, Jha et al. (2012) analyze the relationship between agriculture and
energy use. Their conclusion is that agriculture in India has become very energy intensive, thus
requiring further technological change involving more energy-efficient farm machinery and
irrigation systems. However, concentrating solely on technically improving the efficiency of
pumps might further aggravate the speed at which water tables are depleted. There is thus a need
to first optimize water demand in agriculture through a broader approach to the water-energy
nexus. This would include massive state investments to improve surface irrigation, groundwater
table management, irrigation technologies, agricultural practices (including organic agriculture
and crop diversification) as well as food procurement policies.
The available literature suggests that the problem of water depletion is both technical (for
example, imposing metered tariffing for water), and political. IFPRI sums up the policy
recommendations for addressing groundwater depletion due to excessive energy use as, (1)
options linked to electricity supply: (a) meter use and increase in agricultural tariff; (b) restrictions
on timing of electricity supply; (c) possible restrictions on choice of crops by withdrawing free
electricity or subsidy; and (2) options not directly linked to electricity supply, including, (a)
increased regulation; (b) community-based groundwater management; (c) state ownership and
management of bore wells; (d) promotion of less water-intensive crops and cultivation practices,
and (e) groundwater-recharge measures (IFPRI (2011)).
2.2 Measuring productivity-affecting outcomes
Pollution
While the measures that are widely used to quantify pollution (either pollution in general or air
pollution due to traffic) are largely uncontroversial, what we are primarily interested in is the
impact of those pollution outcomes on persons. Here, a widely used measure is the WHO metric
of DALY or Disability-Adjusted Life Year. The basic idea is that a combination of increased
mortality/morbidity (i.e. increase of deaths and increase of years lived in sub-optimal health) will
result from higher levels of emissions, as measured, for example, by particles (PM10, PM2.5, Pb).
The calculations are based on epidemiological functions, whose coefficients capture the
increased level of mortality and morbidity beyond the particles’ threshold point (20 mg per cubic
meter for PM10, 10 mg per cubic meter for PM2.5, etc.). DALYs for a disease or health
condition are calculated as the sum of the Years of Life Lost (YLL) due to premature mortality
in the population and the Years Lost due to Disability (YLD) for people living with the health
condition or its consequences. For our purposes, DALY would be a sum of deaths due to
vehicle-specific air pollution (multiplied by the average life expectancy in the city/country) and
YLD of the (vehicle specific) air pollution. Calculating YLD is a bit more complex but in essence
it is a product of the number of incident cases of disease caused by air pollution (respiratory,
cardio-vascular), disability weight and average duration of the case until remission to death. The
disability weight (also called the dose function) depicts the relationship between the pollutants
6
(lead (Pb), CO, CO2 and particulates such as PM10, PM2.5) and specific health variables
(incidence of bronchitis, hospital admissions, emergency room visits etc.). The specific
parameters of the dose function for air pollution have been reasonably well studied (for example,
Mayeres et al (1996), WHO (1999), Ostro et al (2004), Pope et al (1995, 2002 and 2009), as well
as the EU project ExternE). The final estimate of the social cost of pollution would be a product
of the DALY and average GDP per capita (for a given period).2
Congestion
There is also a large literature on congestion. Recent studies include Roobuste et al (2001),
Mizutani et al (2011) with their common focus on estimating the social costs of traffic
congestion. Measuring these costs is often done in in three steps. The first is to estimate the daily
time lost due to traffic congestion. Time loss is specified as a function of traffic volume and road
length and speed. The second is to calculate the annual time loss – or opportunity cost - due to
traffic congestion. Finally, the monetary value of traffic congestion is calculated. Time loss
caused by congestion relies on a measure of the value of time. For example, detailed studies have
calculated the value of time for each vehicle type, as vehicle types serve as proxies for different
groups of people and hence different opportunity costs (see INFRAS/IWW 2004). Additional
costs of vehicular use can include accidents and noise. Again, for simplicity, studies tend to rely
on unit costs for specific modes of transport. In short, measurement of congestion costs boils
down to: (a) loss of time and its value; and (b) excess energy use due to recurrent and non-
recurrent delays.
Intermodal choice
Fuel subsidies can affect not only aggregate demand but can also have implications for the modal
mix, often with complex feedbacks. For example, Forkenbrock (1999, 2001) has estimated the
external costs of intercity truck freight and railway transportation looking at pollution, traffic
accidents and noise, as well as climate change.3 Another recent study done for Barcelona, finds
that the external costs of cars and motorcycles are 9 euro cents per km trip; almost seven times
larger than the external costs of public transport, estimated at 1.3 euro cents per km trip.
Although that study does not estimate the indirect cost of freight (railway vs. road), the same
logic could be applied in calculating those numbers as well (Robuste et al., 2001).
A significant proportion of the literature is devoted to studying the determinants of modal
choice (mainly for passenger transport). Among the main factors are socio-demographic
commonly measured by age, gender, occupation, education, income, household composition and
car availability (De Witt et al., 2013). The most robust relationship is between income and car
ownership. More rudimentary models only consider income as the only determinant of car
ownership (Schaefer, 2000, for instance etc.). Similarly, a paper on Jordan (Al-Ghandor et al.,
2 This seems to be the dominant method. See, for instance, Doumani (2011) in the case of Cairo, Mizutani et al.
(2011) in the case of Japan. Monzon and Guerrero (2004) for the case of Madrid use a simpler method of valuing
the cost of pollution as the sum of deaths due to pollution (times GDP per capita) and total excess hospital costs
due to increased hospital admissions as a result of increased pollution.
3 The unit costs for air pollution, climate change and noise are all taken from INFRAS/IWW study (1994) and its subsequent updates.
7
2013) using historical data and multinomial regression analysis finds that an increase in income
leads to increased vehicle ownership, which, in turn, increases gasoline consumption. The
literature also looks at spatial indicators, such as density, diversity, proximity to infrastructure and
services, frequency of public transport and parking. Most of the literature here focuses on the
urbanization/public transport nexus and finds a positive link between urbanization and reliance
on public transport (Camagni et al., 2002; Limtanakool et al., 2006), although with the caveat that
this research is based on findings from advanced economies. A further strand concentrates on
journey characteristics including travel motives, distance and time, travel costs and so on. A
paper on Spain (Rojo et al., 2012) focusing on inter-city travel, uses discrete choice analysis to
suggest that passengers tend to value time the most. Travel cost is also well documented as an
important determinant of modal choice (De Witt et al., 2013), with consumers being sensitive to
price changes, but the extent to which depending on several factors, including the purpose of the
trip etc. (Annema, 2002; Litman, 2004). In addition, socio-psychological factors have also been
considered. Some of these (attitudes, lifestyle, experience) are largely a function of income, so the
literature suggest a somewhat similar relationship between them and decisions on a modal choice
(De Witt et al., 2013). Needless to say, most of this research has been conducted in advanced
economies.
A separate strand of the literature has focused on simulating/studying the impact of various
policy actions on the modal choice (and in addition on car ownership/gasoline consumption and
CO2 emissions). For Jordan, Al-Ghandor et al., (2013) do some projections of gasoline
consumption with the current level of subsidies and with an alternative policy scenario of
removing fuel/energy subsidies. The findings suggest that with current pricing policies gasoline
consumption is expected to rise by 1.8% a year (in line with the increase in per capita income/car
ownership). Reduction of energy subsidies could reduce the increase of gasoline consumption to
0.5% a year. A similar study on China (He et al., 2013) also simulates fuel consumption/CO2
emissions in China under various scenarios. A paper on Australia (Stanley et al., 2013) considers
various policies that have a direct impact on the modal choice and therefore on greenhouse gas
emissions (GHG): (i) reduce urban car kilometers traveled; (ii) increase the share of urban trips
performed by walking and cycling; (iii) increase public transport’s mode share of urban
motorized trips; (iv) increase urban car occupancy rates; (v) reduce forecast fuel use for road
freight; (vi) improve vehicle efficiency. Of all of the factors, the paper suggests that increasing
fuel efficiency (along with behavioral changes in buying more fuel efficient cars) could
significantly reduce (GHG). The paper also suggests comprehensive congestion charging as a
possible way forward. Other studies of advanced economies report mixed findings on the likely
efficacy of policy. For example, Small (2012) simulates the impact of various energy policies for
passenger motor vehicles in the USA. He finds that the impact of various policies
suggested/debated would be modest. His conclusion is that higher fuel taxes seem to be the best
policy option as their effects set in quickly and are not counteracted by the ‘‘rebound effect’’.
Furthermore, a high fuel tax can be combined effectively with a policy mandating new-vehicle
fuel efficiency, providing greater effectiveness at a unit cost comparable to that of the fuel tax
alone. The paper (even though it does not include any external costs of driving in the model
(accidents, congestion etc.) suggests that a fuel tax discourages vehicle travel. A paper by
Rentziou et al. (2012) offers similar findings. The wider literature looking at fuel price elasticities
unambiguously finds that fuel price increases lead fuel consumption to decline, in the short-term
8
by reducing total vehicle travel and driving speeds, and shifting travel to more fuel-efficient
vehicles, and in the long-term by increasing vehicle fuel economy and land use accessibility. An
overview of recent papers puts these elasticities in the range of -0.1 to -0.25 in the short run and
-0.2 to -0.3 in the long run.
3. Evidence for the transport sector in the MENA region
This section reviews the rather fragmentary evidence from the region on the costs associated
with transport.
3.1 Road accidents
While deaths from road transport tend to be inversely related to the income level of the country
and health losses due to pollution tend to be higher in rich countries or regions, MENA stands
out as an exception, ranking high on both accounts.
Motorized road transport imposes a large toll on health in the MENA region, which is only
surpassed by South Asia and Sub-Saharan Africa in terms of rates of deaths due to road crashes.
Further, the death toll appears to have been growing significantly, amounting to more than
73,500 lives in 2010. The rate of road injury deaths has decreased from 1990 to 2010 by less
than 10% compared with the much more substantial decline - close to 50% recorded in the
European Union and close to 30% in Europe and Central Asia.
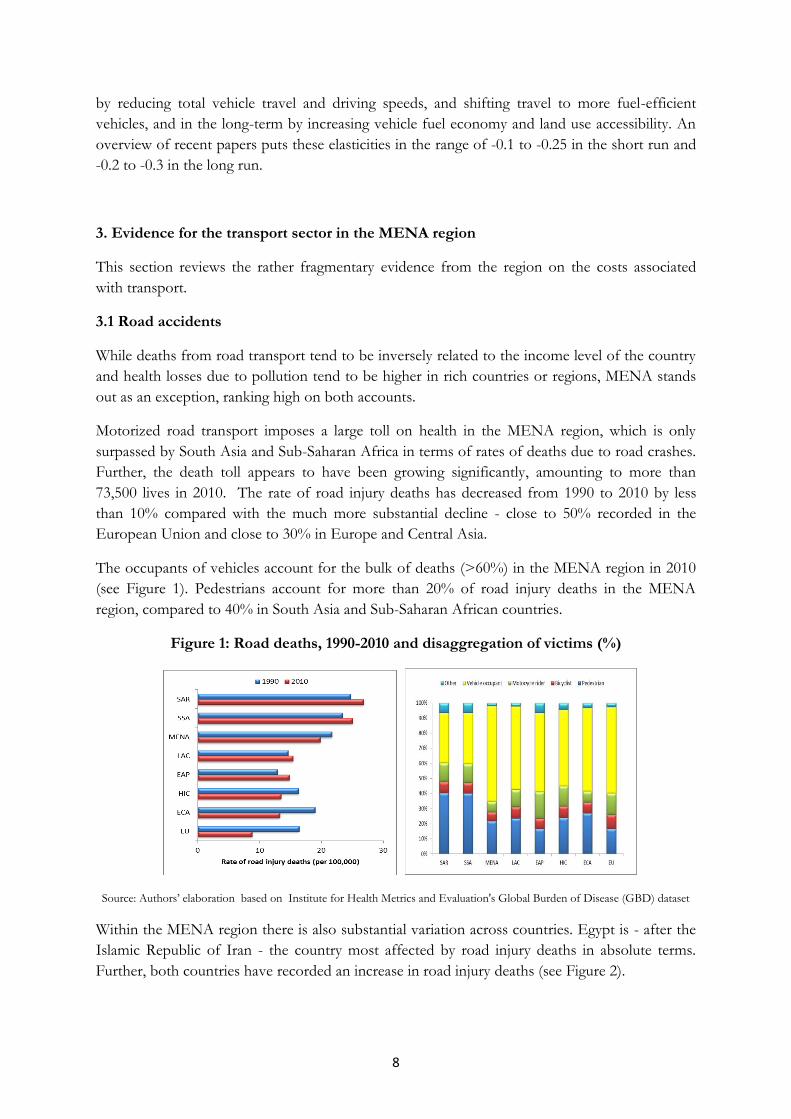
The occupants of vehicles account for the bulk of deaths (>60%) in the MENA region in 2010
(see Figure 1). Pedestrians account for more than 20% of road injury deaths in the MENA
region, compared to 40% in South Asia and Sub-Saharan African countries.
Figure 1: Road deaths, 1990-2010 and disaggregation of victims (%)
Source: Authors’ elaboration based on Institute for Health Metrics and Evaluation's Global Burden of Disease (GBD) dataset
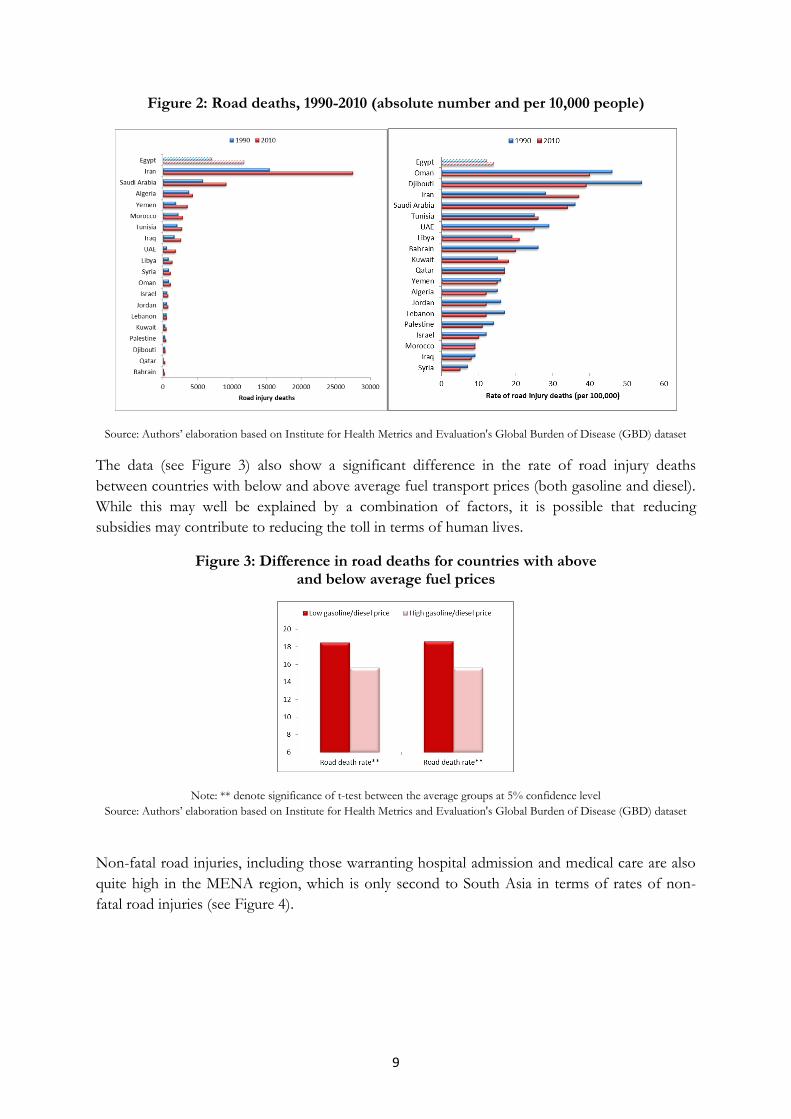
Within the MENA region there is also substantial variation across countries. Egypt is - after the
Islamic Republic of Iran - the country most affected by road injury deaths in absolute terms.
Further, both countries have recorded an increase in road injury deaths (see Figure 2).
9
Figure 2: Road deaths, 1990-2010 (absolute number and per 10,000 people)
Source: Authors’ elaboration based on Institute for Health Metrics and Evaluation's Global Burden of Disease (GBD) dataset
The data (see Figure 3) also show a significant difference in the rate of road injury deaths
between countries with below and above average fuel transport prices (both gasoline and diesel).
While this may well be explained by a combination of factors, it is possible that reducing
subsidies may contribute to reducing the toll in terms of human lives.
Figure 3: Difference in road deaths for countries with above and below average fuel prices
Note: ** denote significance of t-test between the average groups at 5% confidence level
Source: Authors’ elaboration based on Institute for Health Metrics and Evaluation's Global Burden of Disease (GBD) dataset
Non-fatal road injuries, including those warranting hospital admission and medical care are also
quite high in the MENA region, which is only second to South Asia in terms of rates of non-
fatal road injuries (see Figure 4).

10
Figure 4: Road injuries, 2010 ( per 100,000 people)
Source: Authors’ elaboration based on Institute for Health Metrics and Evaluation's Global Burden of Disease (GBD) dataset
The data (see Figure 5) also show some difference in the rate of non-fatal road injury deaths
between countries with below and above average fuel transport prices (both gasoline and diesel).
With similar caveats as above, this might suggest that reducing subsidies - coupled with an
effective road safety program - may contribute to reducing non-fatal injuries due to road
accidents .
Figure 5: Difference in average non-fatal injuries rates for countries with above and
below average gasoline/diesel prices
Note: *** denote significance of t-test between the average groups at 1% confidence level
Source: Authors’ elaboration based on Institute for Health Metrics and Evaluation's Global Burden of Disease (GBD) dataset
3.2 Pollution
The data on overall air pollution levels highlight strong differences in the initial conditions in
1990 as well as in the evolution over the last two decades. The most polluted regions were
Western and Eastern Europe, together with many emerging economies including many in
MENA, as well as East and South Asia. Declines in air pollution occurred mainly in Western and

11
Eastern Europe and to a lesser extent in North America, Saudi Arabia and a few countries in
Sub-Saharan Africa.4
Although it is hard to link the currently available epidemiological information with the pollution
coming from vehicles, it is interesting to compare trends in the evolution of motor vehicle
ownership. Vehicle ownership changes over the past few decades also point to significant
increases in many emerging economies in East and South Asia as well as in Sub-Saharan Africa
and a few countries in the Middle East, including Egypt and Morocco.
The data also suggest that countries with lower transport fuel prices are characterized by a much
higher consumption of fuels for road transportation in lower-middle income countries(see
Figure 6). The link does not extend to higher-middle and high-income countries, probably due to
the advanced level of vehicle ownership per capita.
Figure 6: Difference in road fuel (diesel/gasoline) consumption for countries with above
and below average fuel prices
Source: Authors’ elaboration based on WDI dataset
Note: *** denote significance of t-test between the average groups at 1% confidence level
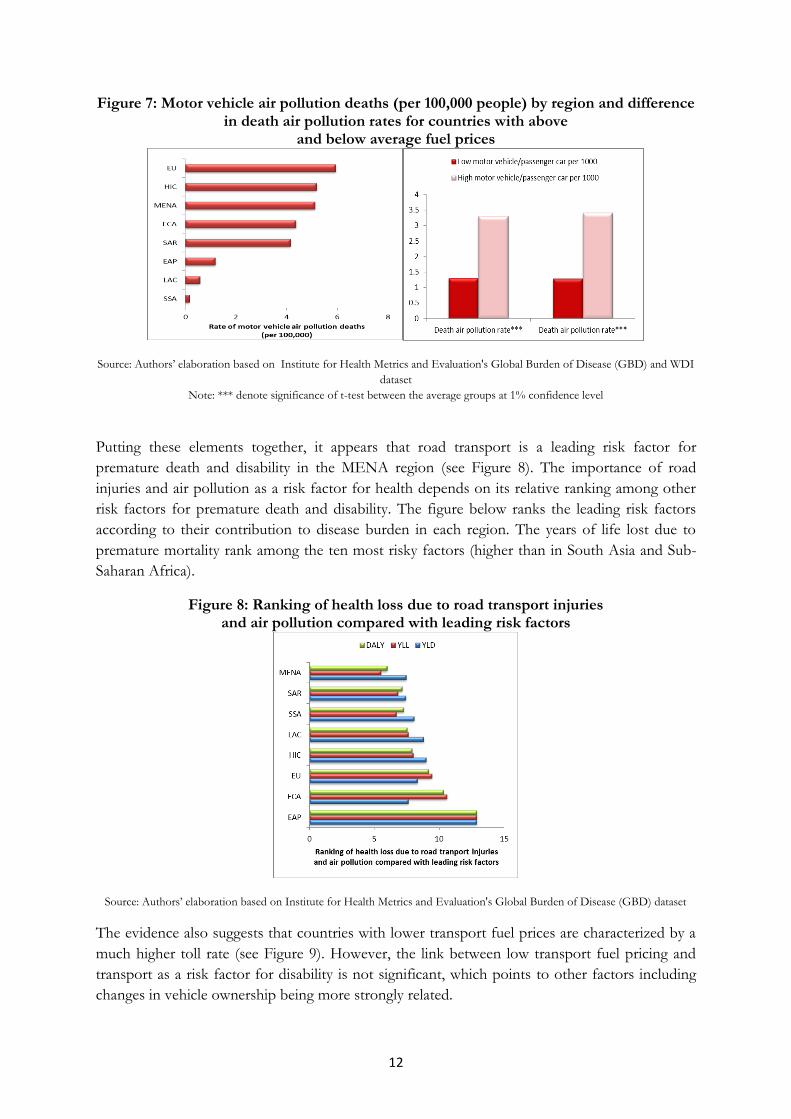
Health losses due to vehicle air pollution are very high in the MENA region, close to OECD
high-income countries (with the exception of the EU countries). The evidence also suggests that
countries with higher motor vehicles per capita are characterized by a much higher toll in terms
of deaths due to air pollution (see Figure 7).
4 Global Road Safety, World Bank and Institute for Health Metrics and Evaluation (2014)
12
Figure 7: Motor vehicle air pollution deaths (per 100,000 people) by region and difference in death air pollution rates for countries with above
and below average fuel prices
Source: Authors’ elaboration based on Institute for Health Metrics and Evaluation's Global Burden of Disease (GBD) and WDI
dataset
Note: *** denote significance of t-test between the average groups at 1% confidence level
Putting these elements together, it appears that road transport is a leading risk factor for
premature death and disability in the MENA region (see Figure 8). The importance of road
injuries and air pollution as a risk factor for health depends on its relative ranking among other
risk factors for premature death and disability. The figure below ranks the leading risk factors
according to their contribution to disease burden in each region. The years of life lost due to
premature mortality rank among the ten most risky factors (higher than in South Asia and Sub-
Saharan Africa).
Figure 8: Ranking of health loss due to road transport injuries and air pollution compared with leading risk factors
Source: Authors’ elaboration based on Institute for Health Metrics and Evaluation's Global Burden of Disease (GBD) dataset
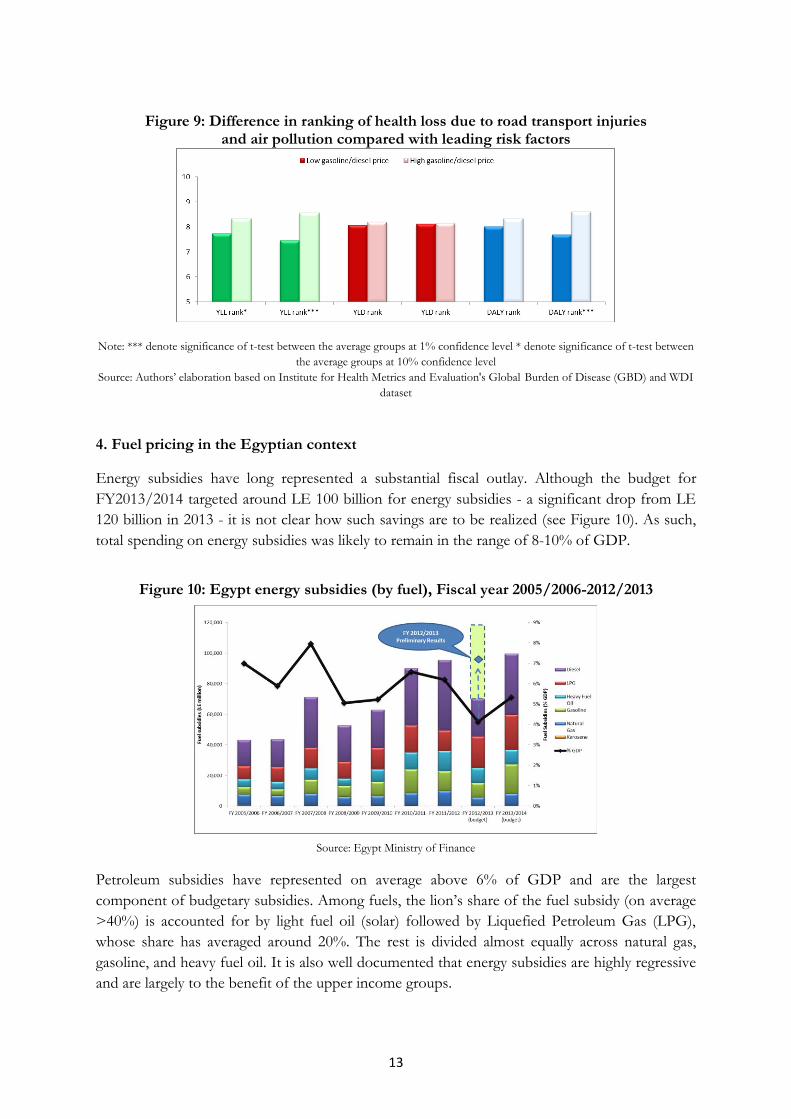
The evidence also suggests that countries with lower transport fuel prices are characterized by a
much higher toll rate (see Figure 9). However, the link between low transport fuel pricing and
transport as a risk factor for disability is not significant, which points to other factors including
changes in vehicle ownership being more strongly related.
13
Figure 9: Difference in ranking of health loss due to road transport injuries
and air pollution compared with leading risk factors
Note: *** denote significance of t-test between the average groups at 1% confidence level * denote significance of t-test between
the average groups at 10% confidence level
Source: Authors’ elaboration based on Institute for Health Metrics and Evaluation's Global Burden of Disease (GBD) and WDI
dataset
4. Fuel pricing in the Egyptian context
Energy subsidies have long represented a substantial fiscal outlay. Although the budget for
FY2013/2014 targeted around LE 100 billion for energy subsidies - a significant drop from LE
120 billion in 2013 - it is not clear how such savings are to be realized (see Figure 10). As such,
total spending on energy subsidies was likely to remain in the range of 8-10% of GDP.
Figure 10: Egypt energy subsidies (by fuel), Fiscal year 2005/2006-2012/2013
Source: Egypt Ministry of Finance
Petroleum subsidies have represented on average above 6% of GDP and are the largest
component of budgetary subsidies. Among fuels, the lion’s share of the fuel subsidy (on average
>40%) is accounted for by light fuel oil (solar) followed by Liquefied Petroleum Gas (LPG),
whose share has averaged around 20%. The rest is divided almost equally across natural gas,
gasoline, and heavy fuel oil. It is also well documented that energy subsidies are highly regressive
and are largely to the benefit of the upper income groups.
14
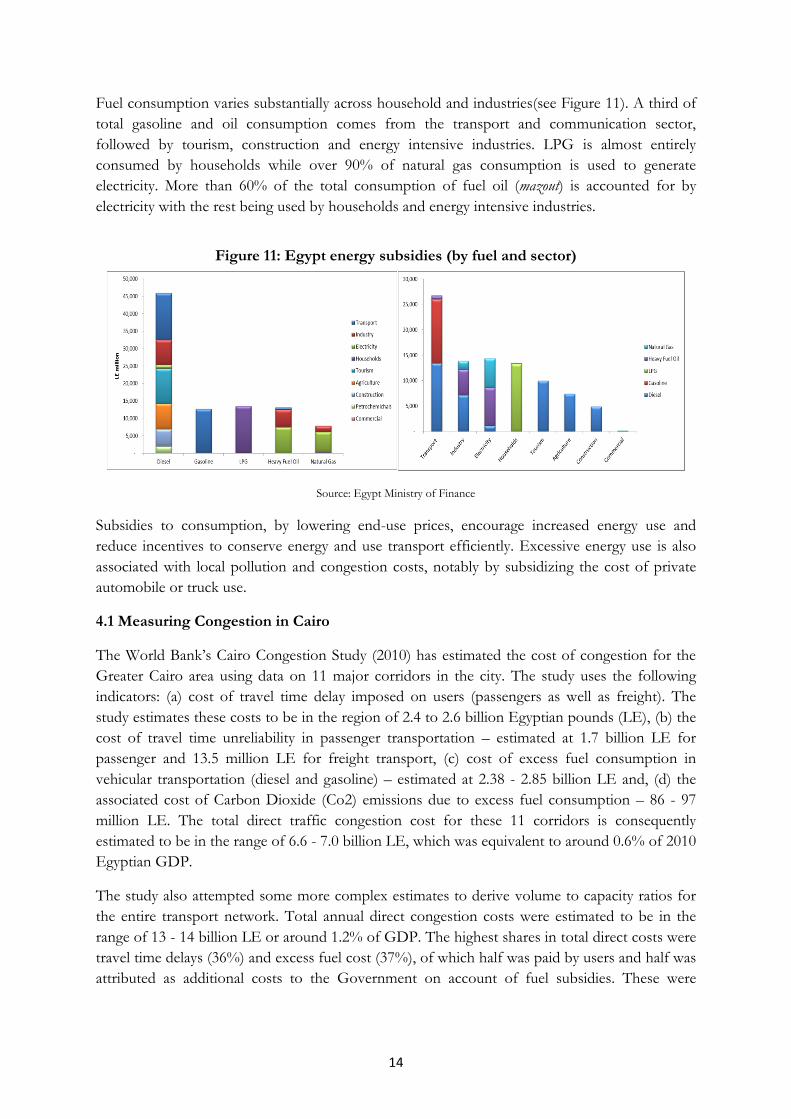
Fuel consumption varies substantially across household and industries(see Figure 11). A third of
total gasoline and oil consumption comes from the transport and communication sector,
followed by tourism, construction and energy intensive industries. LPG is almost entirely
consumed by households while over 90% of natural gas consumption is used to generate
electricity. More than 60% of the total consumption of fuel oil (mazout) is accounted for by
electricity with the rest being used by households and energy intensive industries.
Figure 11: Egypt energy subsidies (by fuel and sector)
Source: Egypt Ministry of Finance
Subsidies to consumption, by lowering end-use prices, encourage increased energy use and
reduce incentives to conserve energy and use transport efficiently. Excessive energy use is also
associated with local pollution and congestion costs, notably by subsidizing the cost of private
automobile or truck use.
4.1 Measuring Congestion in Cairo
The World Bank’s Cairo Congestion Study (2010) has estimated the cost of congestion for the
Greater Cairo area using data on 11 major corridors in the city. The study uses the following
indicators: (a) cost of travel time delay imposed on users (passengers as well as freight). The
study estimates these costs to be in the region of 2.4 to 2.6 billion Egyptian pounds (LE), (b) the
cost of travel time unreliability in passenger transportation – estimated at 1.7 billion LE for
passenger and 13.5 million LE for freight transport, (c) cost of excess fuel consumption in
vehicular transportation (diesel and gasoline) – estimated at 2.38 - 2.85 billion LE and, (d) the
associated cost of Carbon Dioxide (Co2) emissions due to excess fuel consumption – 86 - 97
million LE. The total direct traffic congestion cost for these 11 corridors is consequently
estimated to be in the range of 6.6 - 7.0 billion LE, which was equivalent to around 0.6% of 2010
Egyptian GDP.
The study also attempted some more complex estimates to derive volume to capacity ratios for
the entire transport network. Total annual direct congestion costs were estimated to be in the
range of 13 - 14 billion LE or around 1.2% of GDP. The highest shares in total direct costs were
travel time delays (36%) and excess fuel cost (37%), of which half was paid by users and half was
attributed as additional costs to the Government on account of fuel subsidies. These were
15
followed by unreliability costs (25%) and, finally, Co2 emissions costs amounting to less than 1%
of total costs.
4.2 Measuring pollution in Cairo
In similar vein to the congestion study, the World Bank (2009) has also produced a pollution
study that estimates the impact of pollution on the Greater Cairo region using the DALY
measure. According to the study, the total DALY lost to mortality and morbidity as a result of
pollution was roughly 164,124. Scaling this by GDP per capita and dividing through by GDP for
2009 gives a rough estimate of 0.2 percent of GDP. The study (2009) also provides other
estimates of the levels of pollution for 2008/2009, such as PM10, PM2.5 and Pb. These will
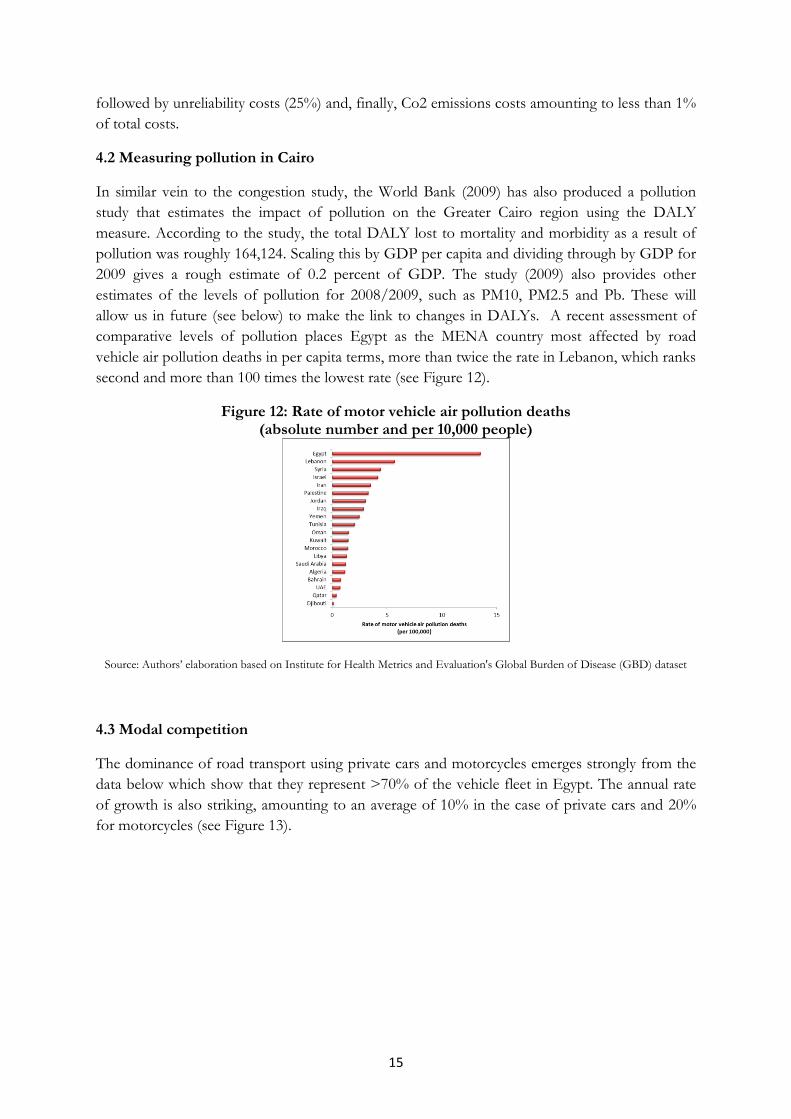
allow us in future (see below) to make the link to changes in DALYs. A recent assessment of
comparative levels of pollution places Egypt as the MENA country most affected by road
vehicle air pollution deaths in per capita terms, more than twice the rate in Lebanon, which ranks
second and more than 100 times the lowest rate (see Figure 12).
Figure 12: Rate of motor vehicle air pollution deaths (absolute number and per 10,000 people)
Source: Authors’ elaboration based on Institute for Health Metrics and Evaluation's Global Burden of Disease (GBD) dataset
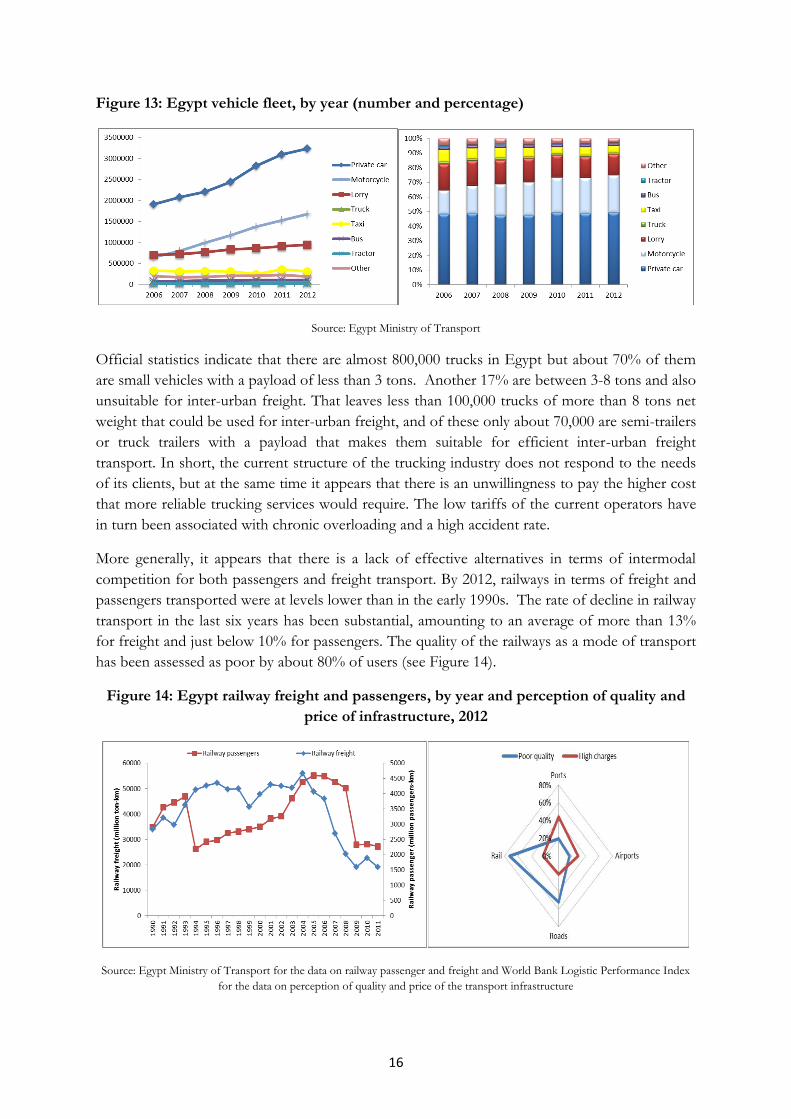
4.3 Modal competition
The dominance of road transport using private cars and motorcycles emerges strongly from the
data below which show that they represent >70% of the vehicle fleet in Egypt. The annual rate
of growth is also striking, amounting to an average of 10% in the case of private cars and 20%
for motorcycles (see Figure 13).
16
Figure 13: Egypt vehicle fleet, by year (number and percentage)
Source: Egypt Ministry of Transport
Official statistics indicate that there are almost 800,000 trucks in Egypt but about 70% of them
are small vehicles with a payload of less than 3 tons. Another 17% are between 3-8 tons and also
unsuitable for inter-urban freight. That leaves less than 100,000 trucks of more than 8 tons net
weight that could be used for inter-urban freight, and of these only about 70,000 are semi-trailers
or truck trailers with a payload that makes them suitable for efficient inter-urban freight
transport. In short, the current structure of the trucking industry does not respond to the needs
of its clients, but at the same time it appears that there is an unwillingness to pay the higher cost
that more reliable trucking services would require. The low tariffs of the current operators have
in turn been associated with chronic overloading and a high accident rate.
More generally, it appears that there is a lack of effective alternatives in terms of intermodal
competition for both passengers and freight transport. By 2012, railways in terms of freight and
passengers transported were at levels lower than in the early 1990s. The rate of decline in railway
transport in the last six years has been substantial, amounting to an average of more than 13%
for freight and just below 10% for passengers. The quality of the railways as a mode of transport
has been assessed as poor by about 80% of users (see Figure 14).
Figure 14: Egypt railway freight and passengers, by year and perception of quality and
price of infrastructure, 2012
Source: Egypt Ministry of Transport for the data on railway passenger and freight and World Bank Logistic Performance Index
for the data on perception of quality and price of the transport infrastructure

17
Transport by road has also led to a substantial increase in fuel consumption for the sector even
though its intensity (as a share of GDP) has been declining over time (see Figure 15).
Figure 15: Egypt road sector fuel consumption and intensity, by year
Source: Egypt Ministry of Transport
5. The water-energy nexus
5.1 The water-energy nexus in MENA and the social cost of water depletion
The availability of renewable water resources in the MENA region is about 500 cubic meters per
capita per annum, making the degree of water scarcity the highest in the world. Availability of
renewable water is 15 to 70 times higher in ECA and LAC respectively. Renewable water
resource availability is as low <30 cubic meters per capita per annum in Kuwait, UAE and Qatar,
followed by the Republic of Yemen. Only a few countries in MENA – such as Iraq, the Islamic
Republic of Iran and Lebanon - have more than 1,000 cubic meters per capita (see Figure 16).
Figure 16: Renewable water resource availability (m3/per inhabitant/year) by region and
for MENA countries
Source: Authors’ elaboration based on Aquastat's database
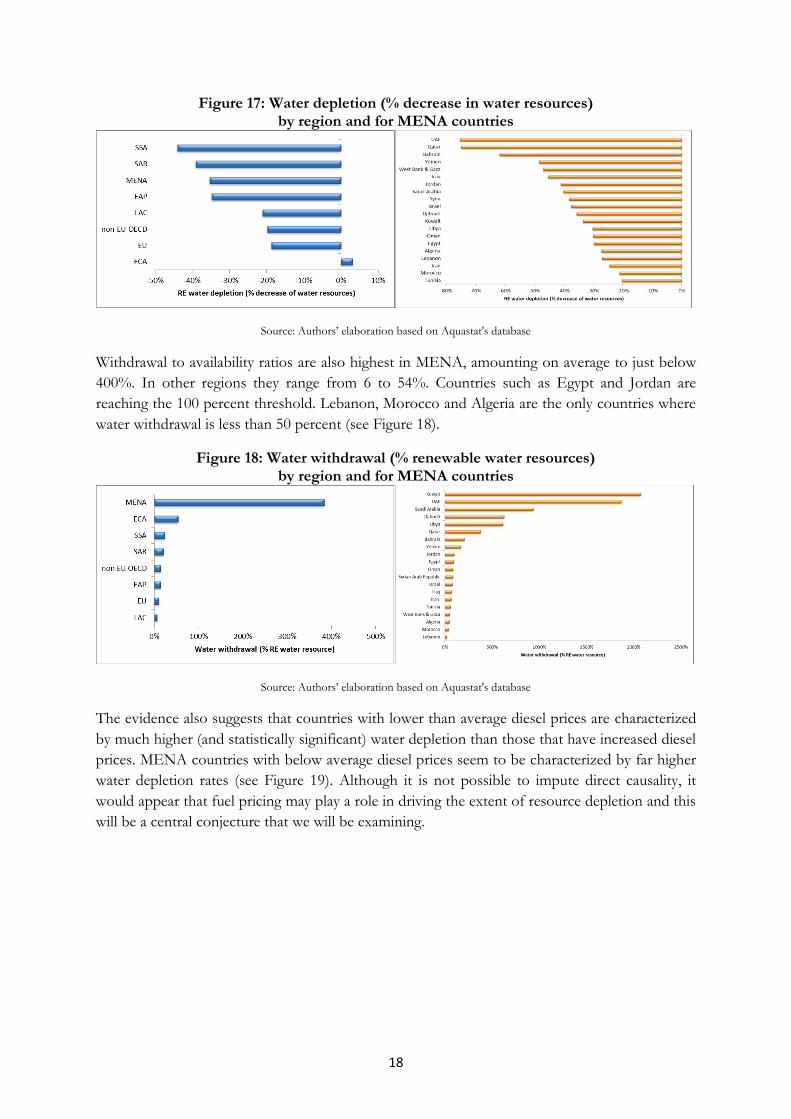
Renewable water availability has also been declining over time, with a rate of decrease of 35%
over the last decade. For some countries, the rate of decrease has been as high as 75%, for
example in UAE and Qatar (see Figure 17).
18
Figure 17: Water depletion (% decrease in water resources) by region and for MENA countries
Source: Authors’ elaboration based on Aquastat's database
Withdrawal to availability ratios are also highest in MENA, amounting on average to just below
400%. In other regions they range from 6 to 54%. Countries such as Egypt and Jordan are
reaching the 100 percent threshold. Lebanon, Morocco and Algeria are the only countries where
water withdrawal is less than 50 percent (see Figure 18).
Figure 18: Water withdrawal (% renewable water resources) by region and for MENA countries
Source: Authors’ elaboration based on Aquastat's database
The evidence also suggests that countries with lower than average diesel prices are characterized
by much higher (and statistically significant) water depletion than those that have increased diesel
prices. MENA countries with below average diesel prices seem to be characterized by far higher
water depletion rates (see Figure 19). Although it is not possible to impute direct causality, it
would appear that fuel pricing may play a role in driving the extent of resource depletion and this
will be a central conjecture that we will be examining.
19
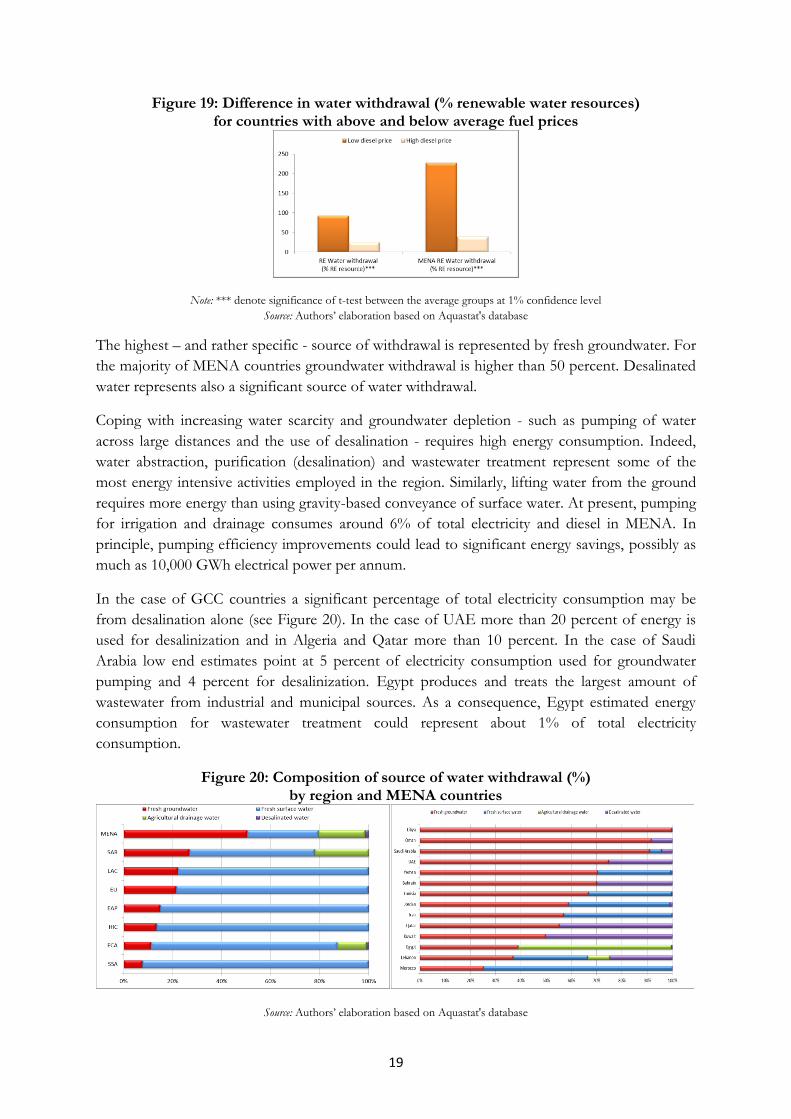
Figure 19: Difference in water withdrawal (% renewable water resources) for countries with above and below average fuel prices
Note: *** denote significance of t-test between the average groups at 1% confidence level
Source: Authors’ elaboration based on Aquastat's database
The highest – and rather specific - source of withdrawal is represented by fresh groundwater. For
the majority of MENA countries groundwater withdrawal is higher than 50 percent. Desalinated
water represents also a significant source of water withdrawal.
Coping with increasing water scarcity and groundwater depletion - such as pumping of water
across large distances and the use of desalination - requires high energy consumption. Indeed,
water abstraction, purification (desalination) and wastewater treatment represent some of the
most energy intensive activities employed in the region. Similarly, lifting water from the ground
requires more energy than using gravity-based conveyance of surface water. At present, pumping
for irrigation and drainage consumes around 6% of total electricity and diesel in MENA. In
principle, pumping efficiency improvements could lead to significant energy savings, possibly as
much as 10,000 GWh electrical power per annum.
In the case of GCC countries a significant percentage of total electricity consumption may be
from desalination alone (see Figure 20). In the case of UAE more than 20 percent of energy is
used for desalinization and in Algeria and Qatar more than 10 percent. In the case of Saudi
Arabia low end estimates point at 5 percent of electricity consumption used for groundwater
pumping and 4 percent for desalinization. Egypt produces and treats the largest amount of
wastewater from industrial and municipal sources. As a consequence, Egypt estimated energy
consumption for wastewater treatment could represent about 1% of total electricity
consumption.
Figure 20: Composition of source of water withdrawal (%) by region and MENA countries
Source: Authors’ elaboration based on Aquastat's database
20
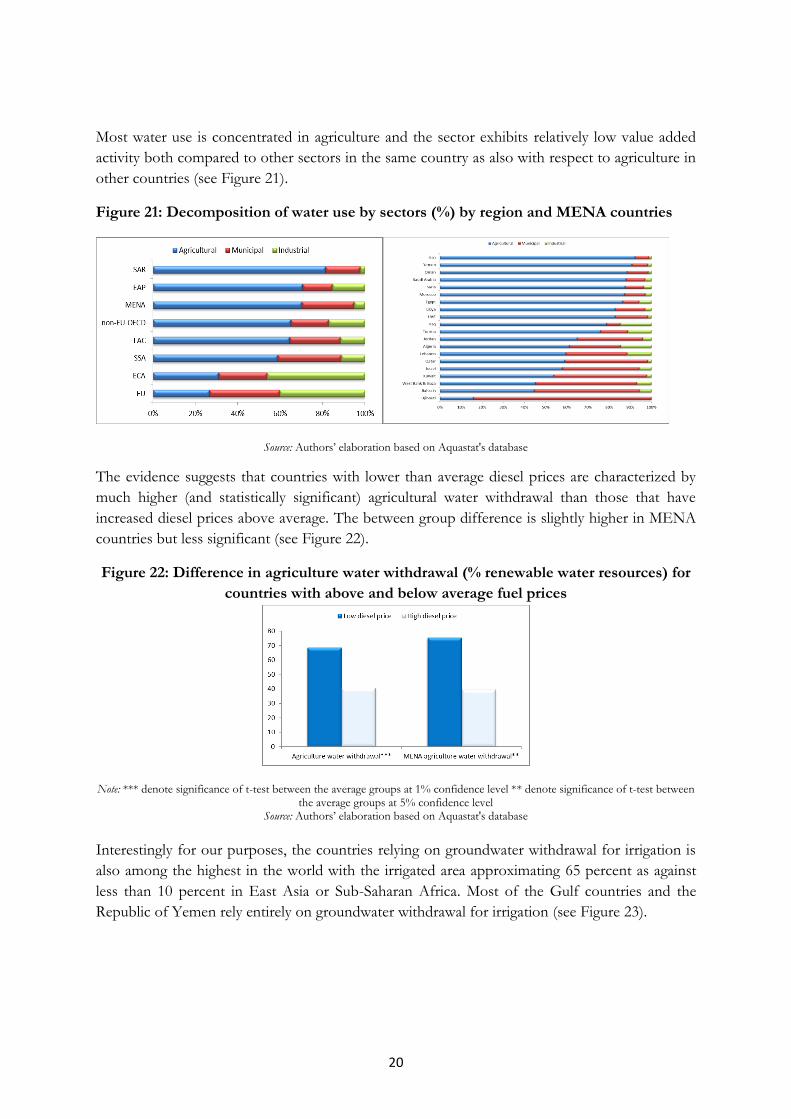
Most water use is concentrated in agriculture and the sector exhibits relatively low value added
activity both compared to other sectors in the same country as also with respect to agriculture in
other countries (see Figure 21).
Figure 21: Decomposition of water use by sectors (%) by region and MENA countries
Source: Authors’ elaboration based on Aquastat's database
The evidence suggests that countries with lower than average diesel prices are characterized by
much higher (and statistically significant) agricultural water withdrawal than those that have
increased diesel prices above average. The between group difference is slightly higher in MENA
countries but less significant (see Figure 22).
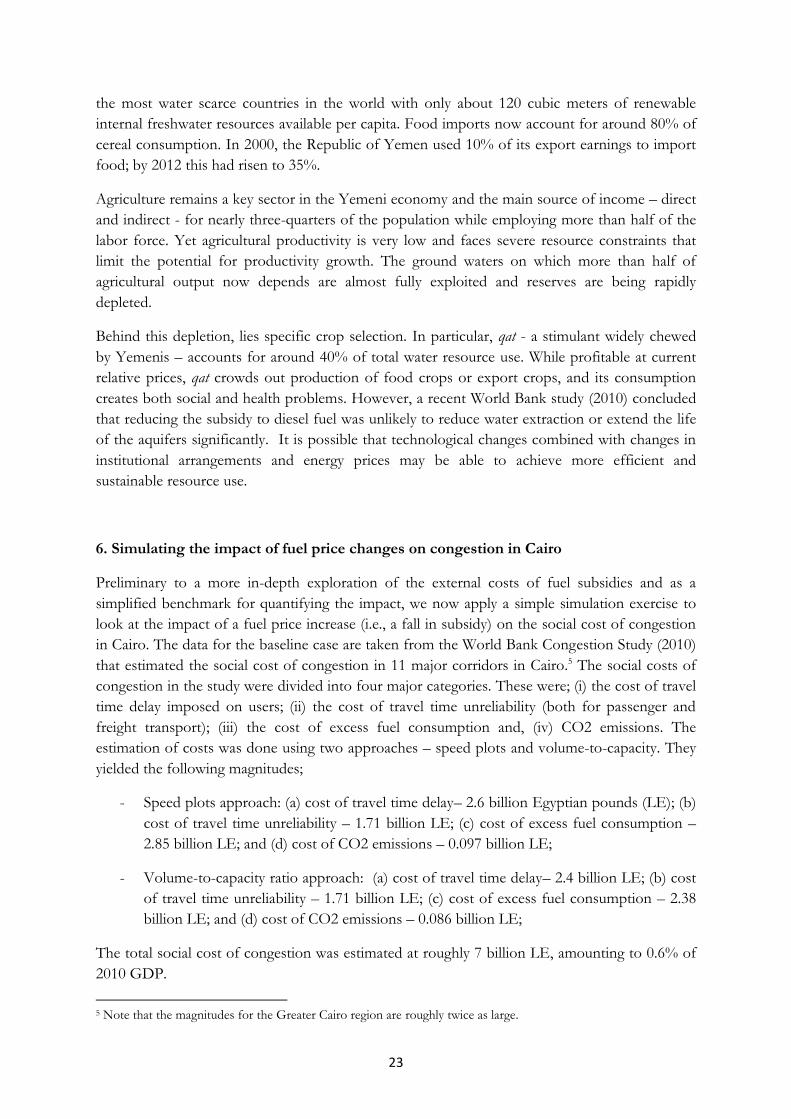
Figure 22: Difference in agriculture water withdrawal (% renewable water resources) for
countries with above and below average fuel prices
Note: *** denote significance of t-test between the average groups at 1% confidence level ** denote significance of t-test between the average groups at 5% confidence level
Source: Authors’ elaboration based on Aquastat's database
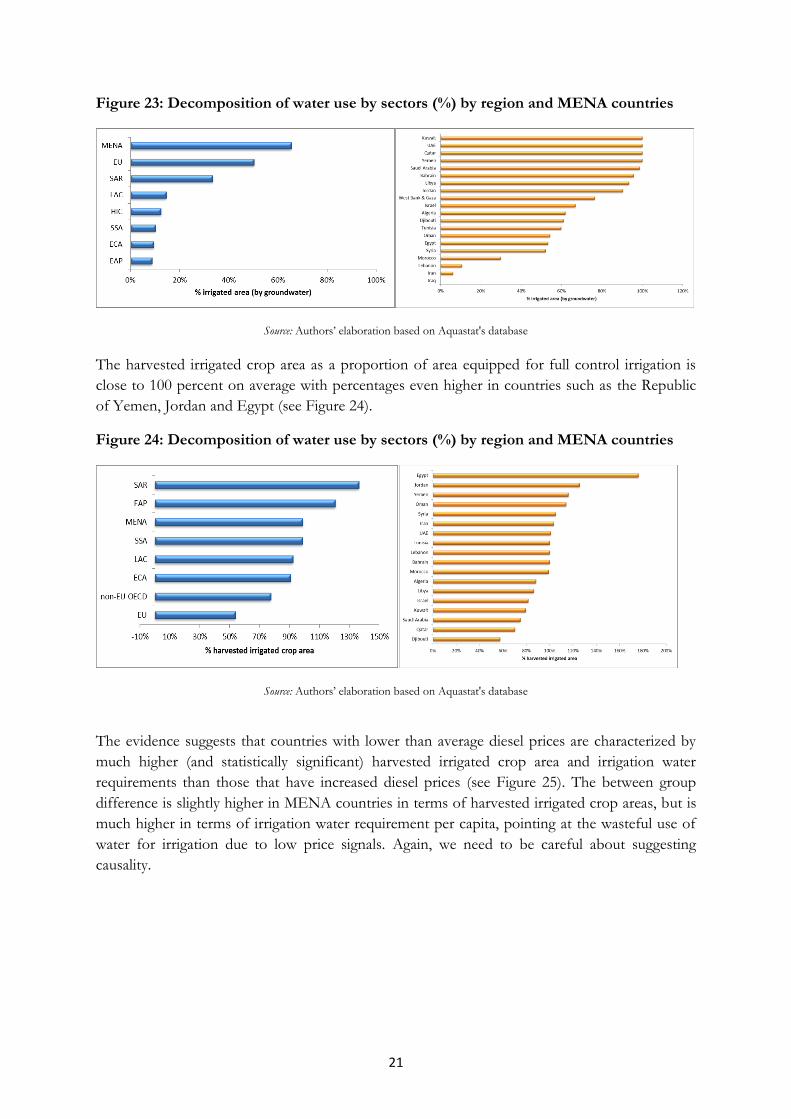
Interestingly for our purposes, the countries relying on groundwater withdrawal for irrigation is
also among the highest in the world with the irrigated area approximating 65 percent as against
less than 10 percent in East Asia or Sub-Saharan Africa. Most of the Gulf countries and the
Republic of Yemen rely entirely on groundwater withdrawal for irrigation (see Figure 23).
21
Figure 23: Decomposition of water use by sectors (%) by region and MENA countries
Source: Authors’ elaboration based on Aquastat's database
The harvested irrigated crop area as a proportion of area equipped for full control irrigation is
close to 100 percent on average with percentages even higher in countries such as the Republic
of Yemen, Jordan and Egypt (see Figure 24).
Figure 24: Decomposition of water use by sectors (%) by region and MENA countries
Source: Authors’ elaboration based on Aquastat's database
The evidence suggests that countries with lower than average diesel prices are characterized by
much higher (and statistically significant) harvested irrigated crop area and irrigation water
requirements than those that have increased diesel prices (see Figure 25). The between group
difference is slightly higher in MENA countries in terms of harvested irrigated crop areas, but is
much higher in terms of irrigation water requirement per capita, pointing at the wasteful use of
water for irrigation due to low price signals. Again, we need to be careful about suggesting
causality.

22
Figure 25: Difference in harvested irrigated crop areas and irrigation water requirement per capita globally and for MENA region for countries with above and below average
fuel prices
Note: *** denote significance of t-test between the average groups at 1% confidence level ** denote significance of t-test between the average groups at 5% confidence level
Source: Authors’ elaboration based on Aquastat's database
What is clear, however, is that greater efficiency of water use can have a significant impact on
energy consumption. Raising the effective price for pumping can reduce the incentive for
irrigating and, in some circumstances, have an impact on trading patterns, to the extent that
countries switch out of water intensive crops, relying on imports instead. Importing water
intensive crops could be associated with water and energy savings, as well as lower rates of
resource depletion from aquifers.
A study of Syria (Gul et al., 2005) showed that although subsidized fuel had a significant positive
impact on cereal production, it was also associated with intensive groundwater use and aquifer
depletion in water-scarce areas. The intensity of groundwater use had been associated with the
expansion in areas of high water-consuming crops. The study also suggested that higher fuel
costs led farmers to shift production to crops with higher water-productivity. The study also
emphasized that fuel subsidies directly contributed to low water productivity (gross margin per
cubic meter), particularly cotton.
5.2 The water-energy nexus: Evidence for the Republic of Yemen
Energy subsidies in the Republic of Yemen remain very high at around 9% of GDP in 2013 with
a peak of 14% in 2008. Of the total fuel subsidy in 2013, about 63% went to diesel, split equally
between electricity -- which is mainly used for off–grid electricity generation by industrial,
commercial, agricultural and residential consumers -- and diesel for other industries. Heavy fuel
oil and gasoline account for about 30%, and the remaining 10% of the subsidy is split mainly
between liquefied petroleum gas (LPG) and kerosene.
As elsewhere, these generalized subsidies benefit mainly the rich—since they consume most fuel
and electricity—and provide incentives for overconsumption, inefficiencies, and smuggling.
Further, they exacerbate the Republic of Yemen’s environmental problems by lowering the cost
of pumping scarce underground water. Consequently, in the Republic of Yemen, pumping for
irrigation and drainage accounts for 28% of the total electricity and diesel consumption, a share
much higher than the 6% average for the MENA region. Yet, the Republic of Yemen is one of
23
the most water scarce countries in the world with only about 120 cubic meters of renewable
internal freshwater resources available per capita. Food imports now account for around 80% of
cereal consumption. In 2000, the Republic of Yemen used 10% of its export earnings to import
food; by 2012 this had risen to 35%.
Agriculture remains a key sector in the Yemeni economy and the main source of income – direct
and indirect - for nearly three-quarters of the population while employing more than half of the
labor force. Yet agricultural productivity is very low and faces severe resource constraints that
limit the potential for productivity growth. The ground waters on which more than half of
agricultural output now depends are almost fully exploited and reserves are being rapidly
depleted.
Behind this depletion, lies specific crop selection. In particular, qat - a stimulant widely chewed
by Yemenis – accounts for around 40% of total water resource use. While profitable at current
relative prices, qat crowds out production of food crops or export crops, and its consumption
creates both social and health problems. However, a recent World Bank study (2010) concluded
that reducing the subsidy to diesel fuel was unlikely to reduce water extraction or extend the life
of the aquifers significantly. It is possible that technological changes combined with changes in
institutional arrangements and energy prices may be able to achieve more efficient and
sustainable resource use.
6. Simulating the impact of fuel price changes on congestion in Cairo
Preliminary to a more in-depth exploration of the external costs of fuel subsidies and as a
simplified benchmark for quantifying the impact, we now apply a simple simulation exercise to
look at the impact of a fuel price increase (i.e., a fall in subsidy) on the social cost of congestion
in Cairo. The data for the baseline case are taken from the World Bank Congestion Study (2010)
that estimated the social cost of congestion in 11 major corridors in Cairo.5 The social costs of
congestion in the study were divided into four major categories. These were; (i) the cost of travel
time delay imposed on users; (ii) the cost of travel time unreliability (both for passenger and
freight transport); (iii) the cost of excess fuel consumption and, (iv) CO2 emissions. The
estimation of costs was done using two approaches – speed plots and volume-to-capacity. They
yielded the following magnitudes;
- Speed plots approach: (a) cost of travel time delay– 2.6 billion Egyptian pounds (LE); (b)
cost of travel time unreliability – 1.71 billion LE; (c) cost of excess fuel consumption –
2.85 billion LE; and (d) cost of CO2 emissions – 0.097 billion LE;
- Volume-to-capacity ratio approach: (a) cost of travel time delay– 2.4 billion LE; (b) cost
of travel time unreliability – 1.71 billion LE; (c) cost of excess fuel consumption – 2.38
billion LE; and (d) cost of CO2 emissions – 0.086 billion LE;
The total social cost of congestion was estimated at roughly 7 billion LE, amounting to 0.6% of
2010 GDP.
5 Note that the magnitudes for the Greater Cairo region are roughly twice as large.

24
In order to simulate the impact of a price change, we need to have some estimates of both short
and long term elasticities of vehicle travel to changes in fuel prices. Table 1 summarizes the
findings of the recent literature. It suggests that the average short run elasticity of vehicle travel is
-0.1, whilst the long run is -0.3 – parameters that will also be applied in the simulation exercise.
However, it should be pointed out that these estimates are drawn from analysis of advanced
economies and may not reflect well developing country values. In addition, we are making two
strong assumptions. The first is that we assume that the elasticity of social cost of congestion is
equivalent to the elasticity of vehicle travel. The second is that we assume that there is no
switching across modes of transport. We report the result of 10%, 20% and 50% increases in
price for both the short and long run.
Figures 26 and 27 illustrate the short run impact of a 10%, 20% and 50% increase in fuel prices.
As suggested by the elasticities mentioned above, a 50% increase in the price of fuel will lead to a
roughly 5% decrease in the overall social cost of congestion, which translates into a monetary
value of approximately 360 million LE.
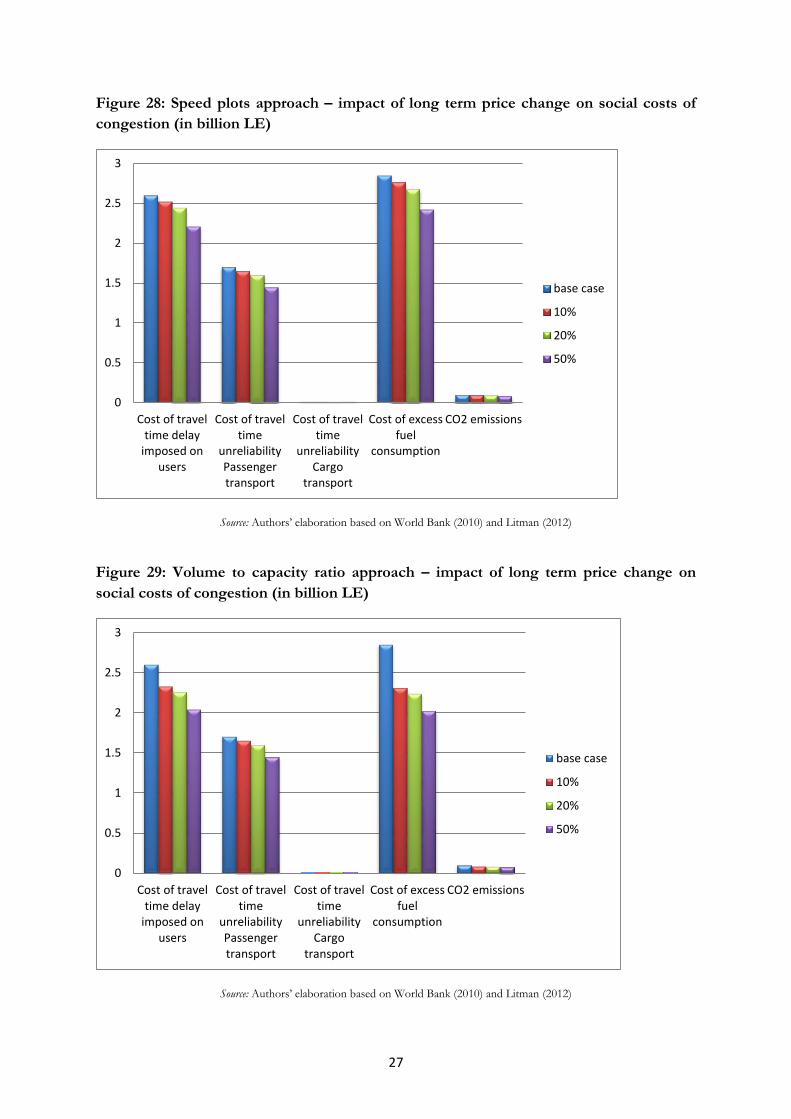
Figures 28 and 29 illustrate the long run impact of a 10%, 20% and 50% increase in fuel prices.
The long-run elasticities suggest that a 50% increase in the price of fuel will lead to a roughly
15% decrease in the overall social cost of congestion, translating into 1.089 billion LE which is
approaching 0.09% of GDP.

25
Study study type study scope Major results
Johansson and Schipper (1997)summary of previous studies International -0.2 long run
Goodwin, Dargay and Hanly (2004) Summary of various fuel price
and income elasticity studies
1929 to 1991, mostly North
America and Europe
-0.1 short run; -0.3
long run
Schimek (1997)Elasticity of vehicle travel with
respect to fuel price
1950 to 1994 time series and
1988 to 1992 pooled data, US -0.26
Small and Van Dender (2010)
Comprehensive model using
vehicle travel elasticity with
respect to fuel price 1966-2001, US
1966 to 2001 ( -
0.047 short run and -
0.22 long run); 1997
to 2001 ( -0.026
short run and -0.121
long run)
Hymel, Small and Van Dender (2010)
Comprehensive model using
state-level cross-sectional
time series gasoline price
elasticity 1966 to 2004, US
-0.026 short run, -
0.131 long run
Li, Linn and Muechlegger (2011)
Comprehensive model of
vehicle travel with respect to
fuel price 1968-2008, US -0.24 to -0.34
Brand (2009)
Gasoline price elasticity 2007-2008,US
-0.12 to -0.17 short
run; -0.21 to -0.3
long run
Gillingham (2010) comprehensive model using
odometer and fuel
consumption data 2005-2008, California
-0.15 to -0.20
medium run, with
variation by vehicle
type and location
Spiller and Stephens (2012) Comprehensive model of
monthly state-level fuel price
and VMT data 2009 US travel survey data
-0.67 short run, with
variations by
household income
and location
Table 1. Summary of vehicle travel price sensitivity studies

26
Figure 26: Speed plots approach – impact of short term price change on social costs of
congestion (in billion LE)
Source: Authors’ elaboration based on World Bank (2010) and Litman (2012)
Figure 27: Volume to capacity ratio approach – impact of short term price change on
social cost of congestion (in billion LE)
Source: Authors’ elaboration based on World Bank (2010) and Litman (2012)
0
0.5
1
1.5
2
2.5
3
Cost of traveltime delay
imposed onusers
Cost of traveltime
unreliabilityPassengertransport
Cost of traveltime
unreliabilityCargo
transport
Cost of excessfuel
consumption
CO2 emissions
base case
10%
20%
50%
0
0.5
1
1.5
2
2.5
3
Cost of traveltime delay
imposed onusers
Cost of traveltime
unreliabilityPassengertransport
Cost of traveltime
unreliabilityCargo
transport
Cost of excessfuel
consumption
CO2 emissions
base case
10%
20%
50%
27
Figure 28: Speed plots approach – impact of long term price change on social costs of
congestion (in billion LE)
Source: Authors’ elaboration based on World Bank (2010) and Litman (2012)
Figure 29: Volume to capacity ratio approach – impact of long term price change on
social costs of congestion (in billion LE)
Source: Authors’ elaboration based on World Bank (2010) and Litman (2012)
0
0.5
1
1.5
2
2.5
3
Cost of traveltime delay
imposed onusers
Cost of traveltime
unreliabilityPassengertransport
Cost of traveltime
unreliabilityCargo
transport
Cost of excessfuel
consumption
CO2 emissions
base case
10%
20%
50%
0
0.5
1
1.5
2
2.5
3
Cost of traveltime delay
imposed onusers
Cost of traveltime
unreliabilityPassengertransport
Cost of traveltime
unreliabilityCargo
transport
Cost of excessfuel
consumption
CO2 emissions
base case
10%
20%
50%
28
6.1 Linking emissions to health outcomes (DALYs)
The simulations reported above give some sense of what happens to CO2 emissions and their
cost. While there tends to be a relationship between CO2 and other pollution measures of
relevance in a health or productivity context (such as PM10 and PM2.5), this is not mechanical.
And it is these latter indicators that are used to make the link to health status.
At this point, we can retrieve some baseline data are from the World Bank Cairo Air Pollution
study (2009). This estimates the total DALY (Disability Adjusted Life Years) due to pollution at
164,124. Dhont et al (2013) estimate the impact of a 20% increase in the price of fuel on the
changes of DALY using data from Belgium. They find that a 20% increase in the price of fuel
would be associated with a rough improvement of 1650 DALYs. If applied to the Egypt base
estimate from WB (2009) this would correspond to a decrease in DALY of around 1 percentage
point.
However, an important caveat is in order. The pollution particulates responsible for increased
mortality/morbidity in Belgium are very much lower than in Cairo. For instance, PM10 and
PM2.5 concentrations in Brussels are 26 and 18 milligrams per cubic meter – significantly lower
than the PM10 and PM2.5 concentration in Cairo of 144 and 83 milligrams per cubic meter
respectively. This suggests that the calculated 1% decrease in DALYs as a result of a price
increase is a significant underestimate.
7. Modeling external effects in transport
In this section, we now move to modeling external effects using a multi-year framework
developed by the UN named ForFITS.6 This model has two objectives. The first is the estimation
of emissions in transport for a given transport stock and its composition and intensity of use.
The second is the evaluation of transport policies for, in particular, mitigating CO2 emissions.
The model also permits simulation of fuel price changes on transport activity. In an extension,
we link CO2 emissions to those for particulates – as measured by PM10 – and then in a further
step link to the impact on mortality and morbidity using the measure of DALYs.
The model evaluates transport activity expressed in units such as passenger kilometers (pkm) and
vehicle kilometers (vkm), stocks of vehicle types, energy use and CO2 emissions. A range of
possible policy contexts can be introduced that include changes in international oil prices as well
as the level and structure of domestic fuel taxes/subsidies. The model is essentially sectoral, as it
covers both passenger and freight transport services across all transport modes and the focus is
mainly on inland transport (especially road and rail). Each mode is further characterized in sub-
modes (when relevant) and vehicle classes. Vehicle classes are further split to take into account
different engine or powertrain technologies and vintages. Finally, powertrains are coupled with
fuel blends that are consistent with the particular engine technology.
Although in extended form the model requires very detailed information that is not available in
the Egyptian context, the core requires a minimum amount of data including information on the
6 An acronym: ‘For Future Inland Transport Systems’.
29
transport system in the base year (such as the composition of the transport fleet, i.e. numbers of
cars, buses, trucks, lorries etc.) and the policy context, such as tax and subsidy rates. Other core
variables needed for projections include the level and growth rates of GDP per capita, GDP
growth, population, and new vehicle registrations (see Annex 1).
The evaluation of fuel and energy consumption using information on transport activity and
vehicle characteristics is calculated using a decomposition of fuel use into transport activity,
energy intensity and structural components, such as the type of transport service (passenger
versus freight), mode, vehicle class and powertrain group (generally termed ASIF). This is then
extended to measure CO2 emissions. In developing long-term projections, the vehicle-based
ASIF approach is supplemented with relationships that link economic parameters with transport-
related ones (such as changes in the cost of travel with variations in travel per vehicle, or changes
in income per capita with variations in vehicle ownership), as well as other specifics (i.e. choice
models). As such, the model generates estimates of transport activity, vehicle use, fuel
consumption and CO2 emissions.
7.1 Applying the framework to Cairo
Our main objective is to study the impact of policy measures – notably the domestic subsidy
level for fuels as well as changes in international oil price - on CO2 emissions (as well as total
energy use and vehicle stock) and based on that, to infer the level of PM10 emissions /
concentrations and the likely impact on human health, using the measure already indicated in the
discussion above, DALYs.
Our simulation exercises use 2014 as the base year and consider the impact of policy changes
over both the medium term (up to 2024) as well as over the near term (up to 2020). We consider
several scenarios in this exercise. For the medium term, we consider four cases in addition to the
baseline:
(i) gradual decrease in fuel subsidies by 50%;
(ii) gradual elimination of fuel subsidies (100%);
(iii) gradual drop in fuel subsidies by 50% coupled with an increase in international price
of oil by 20%;
(iv) gradual elimination of subsidies (100%) coupled with an increase in the international
price of oil by 20%.
Table 1 provides CO2 emissions for all four scenarios and the baseline. (Annex Table 1 also
provides the corresponding changes in energy use associated with these emissions). There are a
few empirical regularities that emerge. First, when a gradual fall in subsidies in the medium term
is simulated, total CO2 emissions decrease by roughly 9 percent. A gradual elimination of
subsidies results in CO2 emissions dropping by 16 percent when compared to the baseline
scenario. A drop in energy use and CO2 emissions is also in evidence when there is a coupling of
policies with external shocks. The third scenario couples a gradual decrease in energy subsidies
with an increase in the international price of oil by 20 percent. This policy simulation results in a
drop in total CO2 emissions of around 16%. Finally, as expected, the biggest change in energy
use and CO2 emissions is observed when a policy of a gradual elimination of fuel subsidies is

30
coupled with an increase in the international price of oil by 20 percent. In this case, CO2
emissions fall by around 25 percent.
The simulations are then repeated but with a shorter time period (up to 2020) for policy changes.
The lower part of Table 1 gives the results. A more rapid elimination of fuel subsidies by 2020
results in a decrease in CO2 emissions by 15 percent. Additionally, elimination of subsidies by
2020 coupled with an international price of oil increase by 20 percent leads to a decline in energy
use of roughly 20 percent and an equivalent drop in CO2 emissions.
7.2 Changes in modal composition
Obviously, one of the main issues in pricing reform is the impact it may have on the relative
demand for different types of transport and hence their varying contributions to total energy use
and CO2 emissions. Reducing or eliminating subsidies should, for example, affect the propensity
to use private vehicles relative to public transport, although the extent of substitution a range of
factors including public transport pricing and the size of the public transport network as well as
the extent to which provision can be scaled up in response to a shift in relative demand.
When considering the issue of modal competition, it needs to be remembered that the
contribution of railways (both passenger and freight) in the overall emission of CO2 is low and
does not exceed 1 percent of total emissions. The great bulk of emissions and energy use is
attributable to cars and buses in the passenger sector and trucks and lorries for freight.7 In the
scenarios presented in Table 1, this implies that although there are some minor changes in the
overall contribution of CO2 emissions of various modes, the shares actually remain fairly stable
over the years and with different scenarios. There is a minor increase in the share of CO2
emissions attributable to railways and other public transport modes. But for railways, in
particular, to make an impact may require substantial investment in new capacity and
infrastructure.
To simulate such an effect – albeit in very stylized form – we consider what might happen to
emissions when we mimic the effect of a step-wise change – or positive investment shock – on
the transport sector. Embedded in the model is an index of the transport system. It ranges from
0 to 1 where 1 is characteristic of a system with high population densities and very strong focus
on public transport and 0 is characteristic of a system with little public transport and a strong
focus on use of private vehicles. In setting the initial value of this index, we looked at a number
of rankings and comparative scores and assigned Cairo a value of 0.3, characteristic of a location
with relatively weak public transport. We then employ two types of shocks aimed at capturing
the possible impact of a large investment program aimed at transport infrastructure. The first is a
20% gradual increase in the transport index over 10 years and the second is a 50% increase over
the same period. We couple these shocks with changes to subsidies and increases in oil prices as
used in Table 1.
Table 2 provides the main results. A positive shock to the transport index of 50% over 10 years,
when coupled to either a 50% or 100% reduction of subsidies, results in lowering CO2 emissions
by 20 and 29 percent respectively. When considering the cases of a 20 and 50 percent shock to
7 This is comparable to international experience, whether in advanced or developing economies

31
the transport index, coupled to the elimination of subsidies by 2024 and an oil price increase of
20%, the fall in emissions amounts to around 26 and 32 percent respectively. Compositionally,
the share of emissions accounted for by the various types of public transport increases although
not by very large magnitudes.
7.3 Linking CO2 to PM10 emissions and DALYs
There is limited information on the exact relationship between CO2 and concentration of
particulates or PM10 emissions and hence on the appropriate conversions rates to be applied.8
What evidence is available suggests that changes in CO2 emissions are associated with roughly
proportional changes in PM10 emissions. Using data from the World Bank (Table 2.2; World
Bank’s Cairo Pollution study), we now project changes in the concentration of particulates
(PM10) in Cairo for the scenarios used above. Our main assumption is that there is a linear
relationship in the increase of CO2 and PM10 emissions. However, there are a few additional
assumptions that we make in projecting PM10 emissions. First, we assume that an increase in
PM10 particulates will be associated with an increase in the overall concentration of particulates
in the Greater Cairo region. Second, based on the World Bank Greater Cairo Pollution Study, we
assume that transport pollution represents roughly 15 percent of total pollution in the city.
Hence, a doubling of PM10 due to transport would be equivalent to 15 percent of the change in
overall PM10 emissions. It should be emphasized that this exercise is static as we hold
everything else ceteris paribus, i.e. we do not consider changes in emissions/concentration due to
industrial pollution and other factors. It is quite feasible that the policy changes we are simulating
might also have an impact on those sectors. As such, we are probably underestimating the
overall impact of fuel pricing changes.
The results of this exercise are presented in Table 3. Given the assumptions, changes in PM10
concentrations in various scenarios correspond to changes in CO2 emissions from Table 1 above.
(Clearly, if changes in CO2 and PM10 emissions were not proportional, the estimates would
have to be adjusted.) For the four scenarios to 2024, decreases in PM10 concentration range
between 8 - 25 percent compared with the base case. The drop in PM10 concentration in the
shorter-term scenario (up to 2020) ranges between 15 and 20 percent. Adding the changes in the
transport index to simulate an increase in public transport, we can observe at the outer limit that
there is a decrease of over 30 percent in the concentration measure; a very substantial decline
indeed.
After projecting PM10 emissions/concentration, we again use information from the World Bank
Great Cairo Pollution study (Table 5.1: Total DALYs lost to pollution) and the ratios between
PM10 concentrations and DALYs lost to project the total DALYs lost to transport pollution in
the six scenarios. The results of this exercise are reported in Table 4 where the central calculation
is of cumulative savings when comparing a particular scenario with the baseline case over the
reference period. The table shows that a gradual 50% fall in subsidies by 2024 is associated with
8 See Haikun Wang, Lixin Fu and Jun Bi, ‘CO2 and pollutant emissions from passenger cars in China’, Energy Policy,
39, 5, May, 2011, pp3005-3011 and M. Madireddy et al, ‘Micro-Simulation of a Traffic Fleet to Predict the Impact of Traffic Management on Exhaust Emissions’, Ghent, mimeo, 2010
32
saving roughly 13,500 DALYs. A gradual elimination of fuel subsidies by 2024 saves nearly
23,000 DALYs. In the scenario where fuel subsidies are eliminated by 2024 and coupled with an
increase in the international price of oil of 20 percent, the DALYs saved amount to over 30,000.
This corresponds to roughly 0.04 percent of GDP. When we incorporate changes to the
transport index in the simulations, at the maximum the cumulative savings of DALYs rise to
around 0.07% of GDP. These are clearly not trivial numbers given that the estimated cost of
total pollution in the Greater Cairo region amounts to around 0.2 percent of GDP.
8. Conclusion
Our paper covers ground that has been relatively neglected both in analytical and policy terms;
namely the externalities associated with energy subsidies. The latter are pervasive in the MENA
region and cut across different types of economies, including those without significant natural
resources. While the broad consequences of energy mis-pricing are well understood, the
magnitudes of the external effects associated with current pricing rules have attracted limited
attention, let alone quantification. We attempt to correct this deficiency by focusing on two
sectors – transport and agriculture – with a specific emphasis on the congestion and pollution
costs associated with the first and the consequences for resource (water) depletion and crop
selection in the case of the second. The paper is, however, exploratory both in a methodological
and in an empirical sense, not least because of the absence of available data of sufficient quality.
Nevertheless, we are able to identify the dominant channels through which energy subsidies
create external costs and, particularly in the case of transport, begin to quantify their magnitudes
in the context of Cairo. We view this exercise as a prelude to a more detailed study that will
require further data assembly and collection.
In the case of transport in Cairo, we are able to quantify the impact of a change in energy pricing
involving a reduction in subsidies on energy use and CO2 emissions. We then associate those
emissions with that of particulates – as measured by PM10 – and through that channel make a
link to health outcomes, as measured in terms of excess mortality and morbidity using the
DALY measure. We find that there are non-trivial changes in energy use and CO2 emissions
when energy subsidies are reduced. Our simulations indicate at their outer limit that a gradual
elimination of fuel subsidies by 2024, when coupled with an increase in the international price of
oil by 20 percent, would result in CO2 emissions falling by as much as 25 percent. Eliminating
subsidies by 2020 would lead to a decline in energy use of around 20 percent with an equivalent
drop in CO2 emissions. As regards the impact on health, subsidy elimination by 2024 would
result in large order savings in terms of mortality and morbidity that amount to roughly 0.04
percent of GDP. When factoring in changes in the use of different transport modes linked to a
hypothetical increase in public investment in public transport infrastructure, at a maximum the
cumulative savings of DALYs rise to around 0.07% of GDP. These are clearly significant given
that an earlier World Bank study estimated the cost of total pollution in the Greater Cairo area to
be around 0.2 percent of GDP. In sum, our paper provides further evidence on the damaging
and corrosive impact of energy subsidies by demonstrating that in one sector alone the external
effects are large. Although the paper does not attempt to measure the overall costs associated
with energy underpricing on water use and scarcity, it uses available evidence to describe the

33
impact on depletion including through crop selection, notably through the choice of irrigated
crops. Using mainly evidence from the Republic of Yemen, as well as data from the MENA
region more widely, we show that energy mis-pricing has been associated with accelerated
depletion rates. Given the relative scarcity of water resources in this region, the consequences are
significantly adverse. Further analysis, and data collection, will allow more precise identification
of these costs not only in these two sectors, but also across a broader spectrum of sectors.
34
References
1. Al-Ghandoor, A., J. Jaber, I. Al-Hinti and Y. Abdallat (2013) “Statistical assessment and
analyses of the determinants of transportation sector gasoline demand in Jordan”,
Transportation Research Part A 50 (2013) 129–138.
2. Annema, J. (2002) “The policy context of transport: accessibility, safety and the
environment”, in Van Wee, B., M. Dijst, Verkeer en vervoen in hoofdjilnen, Bussum:
Coutinho.
3. Aquastat, Food and Agricultural Organization of the UN,
http://www.fao.org/nr/water/aquastat/main/index.stm
4. Bekhet, H. (2010) “Energy Use in Agriculture Sector: Input-Output Analysis”,
International Business Research, Vol.3, No.3, July 2010.
5. Brand, Dan. (2009), Impacts of Higher Fuel Costs, Federal Highway Administration,
(www.fhwa.dot.gov); at www.fhwa.dot.gov/policy/otps/innovation/issue1/impacts.htm.
6. Camagni, R., M. Gibelli and P. Rigamonti (2002) “Urban mobility and urban form: the
social and environmental costs of different patterns of urban expansion”, Ecological
Economics 40 (2002) 199–216.
7. De Witte, A., J. Hollevoet, F. Dobruszkes, M. Hubert, C. Macharis (2013) “Linking
modal choice to motility: A comprehensive review”, Transportation Research Part A 49,
pp. 329-341.
8. Doumani, F. (2011) Greater Cairo Air Pollution: Cost of Environmental Degradation,
unpublished report, 2011.
9. Egypt Ministry of Finance. http://www.mof.gov.eg/english/Pages/Home.aspx
10. Egypt Ministry of Transport. http://www.mot.gov.eg/
11. Externalities of Energy, ExternE project, Method for Estimation of Physical Impacts
and Monetary Valuation for Priority Impact Pathways, mimeo, London, UK.
12. Forkenbrock, D. (2001) “Comparison of external costs of rail and truck freight
transportation”, Transportation Research Part A, 35, pp. 321-337.
13. Forkenbrock, D. (1999) “External costs of intercity truck freight transportation”,
Transportation Research A 33 (7/8), pp 505-526.
14. Gillingham, Kenneth (2010), Identifying the Elasticity of Driving: Evidence from a
Gasoline Price Shock in California, Stanford University (www.stanford.edu); at
www.stanford.edu/~kgilling/Gillingham_IdentifyingElasticityofDriving.pdf.
15. Global Road Safety www.grsproadsafety.org/
16. Goodwin, Phil, Joyce Dargay and Mark Hanly (2004), “Elasticities of Road Traffic and
Fuel Consumption With Respect to Price and Income: A Review,” Transport Reviews
(www.tandf.co.uk), Vol. 24/3, May, pp. 275-292.
17. Gul, A., F. Rida, A. Aw-Hassan, O. Buyukalaca (2005) “Economic analysis of energy use
in groundwater irrigation of dry areas: a case study in Syria”, Applied Energy 82 (2005)
285–299.
18. He, L. W. Tyner, and R. Doukkali (2013) “Policy options to improve water allocation
efficiency: analysis on Egypt and Morocco”, mimeo, Purdue University, USA.
19. Hymel, Kent, Kenneth A. Small and Kurt Van Dender (2010), “Induced Demand And
Rebound Effects In Road Transport,” Transportation Research B

35
(www.elsevier.com/locate/trb), Vol. 44, Issue 10, December, pp. 1220-1241; at
www.socsci.uci.edu/~ksmall/Rebound_congestion_27.pdf.
20. IFPRI (2011) “The political economy of agricultural policy reform in India : fertilizers
and electricity for irrigation”, IFPRI research monograph, 2011.
21. INFRAS/IWW (2004) “External Cost of Transport: update study”, final report, mimeo,
Zurich, Switzerland, 2004.
22. Institute for Health Metrics and Evaluation. <http://www.healthdata.org/>
23. International Monetary Fund (2013) “Energy subsidy reform: lessons and implications”,
IMF Working Paper, Washington DC, USA
24. Jha, K., S. Pal and A. Singh (2012) “Changing Energy-use Pattern and the Demand
Projection for Indian Agriculture”, Agricultural Economics Research Review, Vol.
25(No.1) January-June 2012 pp 61-68.
25. Johansson, Olof and Lee Schipper (1997), “Measuring the Long-Run Fuel Demand for
Cars,” Journal of Transport Economics and Policy, Vol. 31, No. 3, pp. 277-292.
26. Li, Shanjun, Joshua Linn and Erich Muehlegger (2011), Gasoline Taxes and Consumer
Behavior, Stanford (http://economics.stanford.edu); at
http://economics.stanford.edu/files/muehlegger3_15.pdf.
27. Limtanakool, N., Dijst, M. and Sschwanen, T.(2006) “On the participation in medium-
and long-distance travel: a decomposition analysis for the UK and the Netherlands,
Tijdschrift voor Economische en Sociale Geografie, 97, pp. 389–404.
28. Litman, Todd (2012) Changing Vehicle Travel Price Sensitivities The Rebounding
Rebound Effect (www.vtpi.org)
29. Litman, Todd. (2004). Evaluating Public Transit Benefits and Costs, VTPI
(www.vtpi.org).
30. Mayeres et al., (1996) “The marginal external costs of urban transport”, Transportation
Research Part D 2: 111-130.
31. Mizutani, F., Y. Suzuki and H. Sakai (2011) “Estimation of Social Costs of Transport in
Japan”, Urban Studies, 48 (16), pp. 3537-3559.
32. Monzon, A and M-J. Guerrero (2004) “Valuation of social and health effects of
transport-related air pollution in Madrid (Spain)”, Science of the Total Environment
334– 335 (2004) 427–434.
33. Nelson, H., T. Roe, R. Smith, D. de Leon Barido, and E. Foufoula-Georgiou (2013)
“The Shadow Value of Groundwater in Punjab, India: An analysis in an Economy-Wide
Context”, University of Minnesota, Institute of the Environment, 2013.
34. Ostro, B., R. Broadwin and M. Lipsett (2004) “Fine Particles and Daily Mortality in Nine
California Counties: Results From Calfine.” Epidemiology. Volume 15, Number 4.
35. Pope, C. A., M. Thun, M. Namboodiri, D. Dockery, J. Evans, F. Speizer, and C. Heath
(1995) “Particulate Air Pollution as a Predictor of Mortality in a Prospective Study of
U.S. Adults.” Am. J. Crit. Care Med. 151: 669-74.
36. Pope, C. A., R. T. Burnett, M. J. Thun, E. E. Calle, D. Krewski, K. Ito, and G. Thurston
(2002) “Lung Cancer, Cardiopulmonary Mortality and Long Term Exposure to Fine
Particulate Air Pollution.”, Journal of the American Medical Association 287(9): 1132-
1141.

36
37. Rentziou, A., K. Gkritza and R. Souolyerette (2012) “VMT, energy consumption, and
GHG emissions forecasting for passenger transportation”, Transportation Research Part
A 46 (2012), pp. 487-500.
38. Robuste, F., A. Lopez-Pita and M. Capdet (2001) “Social cost of metropolitan passenger
transport in Barcelona”, Transactions on the Built Environment vol. 52, pp. 751-763.
39. Rojo, M., H. Gonzalo-Orden, L. dell’Olio, and A. Ibeas (2012) “Relationship Between
Service Quality and Demand for Inter-urban Buses.” Transportation Research Part A 46:
1716–1729.
40. Schafer, A (2000), Regularities In Travel Demand: An International Perspective, Journal
of Transportation and Statistics, December 2000.
41. Schimek, Paul (1997), “Gasoline and Travel Demand Models Using Time Series and
Cross-Section Data from the United States,” Transportation Research Record 1558, TRB
(www.trb.org), pp. 83-89.
42. Small, K. (2012) “Energy policies for passenger motor vehicles”, Transportation
Research Part A 46 (2012) 874–889.
43. Small, Kenneth and Kurt Van Dender (2005), The Effect of Improved Fuel Economy
on Vehicle Miles Traveled: Estimating the Rebound Effect Using U.S. State Data, 1966-
2001, University of California Energy Institute's (UCEI) (www.ucei.berkeley.edu); at
www.ucei.berkeley.edu/PDF/EPE_014.pdf.
44. Spiller, Elisheba and Heather M. Stephens (2012), The Heterogeneous Effects of
Gasoline Taxes: Why Where We Live Matters, Resources for the Future (www.rff.org); at
www.rff.org/RFF/Documents/RFF-DP-12-30.pdf; complete report at
http://papers.ssrn.com/sol3/papers.cfm?abstract_id=2129396.
45. Stanley, J.K., Hensher, D.A., Loader, C. (2011) Road transport and climate change:
Stepping off the greenhouse gas. Transportation Research Part A, 45, 1020-1030.
46. World Bank (2013) “For better or for worse: air pollution in greater Cairo”, World Bank
Concept note, April, 2013.
47. World Bank (2010) “ Cairo – Congestion Study”, mimeo, Washington DC, USA.
48. World Development Indicators. <www.wdi.org>
49. World Health Organization (1999) “Economic evaluation of health impacts due to road
traffic related air pollution”, WHO Europe, Copenhagen, mimeo.
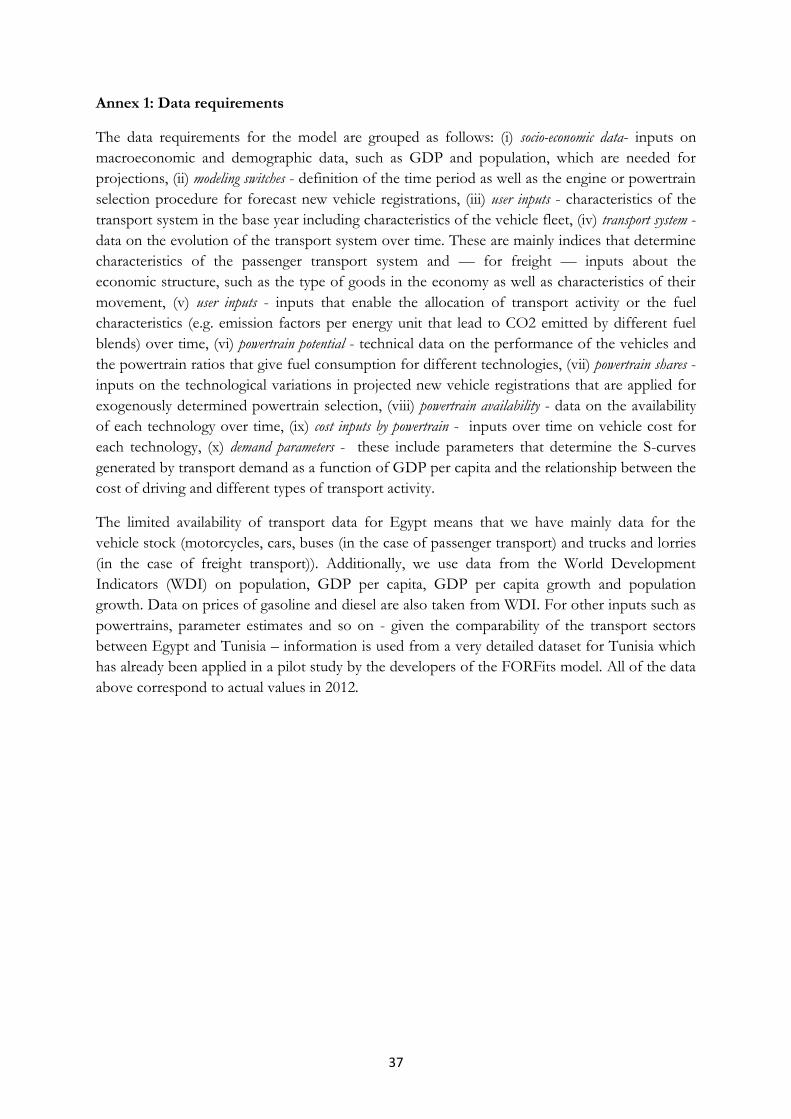
37
Annex 1: Data requirements
The data requirements for the model are grouped as follows: (i) socio-economic data- inputs on
macroeconomic and demographic data, such as GDP and population, which are needed for
projections, (ii) modeling switches - definition of the time period as well as the engine or powertrain
selection procedure for forecast new vehicle registrations, (iii) user inputs - characteristics of the
transport system in the base year including characteristics of the vehicle fleet, (iv) transport system -
data on the evolution of the transport system over time. These are mainly indices that determine
characteristics of the passenger transport system and — for freight — inputs about the
economic structure, such as the type of goods in the economy as well as characteristics of their
movement, (v) user inputs - inputs that enable the allocation of transport activity or the fuel
characteristics (e.g. emission factors per energy unit that lead to CO2 emitted by different fuel
blends) over time, (vi) powertrain potential - technical data on the performance of the vehicles and
the powertrain ratios that give fuel consumption for different technologies, (vii) powertrain shares -
inputs on the technological variations in projected new vehicle registrations that are applied for
exogenously determined powertrain selection, (viii) powertrain availability - data on the availability
of each technology over time, (ix) cost inputs by powertrain - inputs over time on vehicle cost for
each technology, (x) demand parameters - these include parameters that determine the S-curves
generated by transport demand as a function of GDP per capita and the relationship between the
cost of driving and different types of transport activity.
The limited availability of transport data for Egypt means that we have mainly data for the
vehicle stock (motorcycles, cars, buses (in the case of passenger transport) and trucks and lorries
(in the case of freight transport)). Additionally, we use data from the World Development
Indicators (WDI) on population, GDP per capita, GDP per capita growth and population
growth. Data on prices of gasoline and diesel are also taken from WDI. For other inputs such as
powertrains, parameter estimates and so on - given the comparability of the transport sectors
between Egypt and Tunisia – information is used from a very detailed dataset for Tunisia which
has already been applied in a pilot study by the developers of the FORFits model. All of the data
above correspond to actual values in 2012.

38
Unit Base year 2024 change from the base case scenario
Basecase up to 2024
Total WTW CO2 emissions billion CO2 kg 58.39 128.22
Scenario 1 - Egypt - main outputs: gradual drop of subsidies by 50% by 2024
Unit Base year 2024
Total WTW CO2 emissions billion CO2 kg 58.39 118.16 -8.51
Scenario 2 - Egypt - main outputs: gradual drop of subsidies by 100% by 2024
Unit Base year 2024
Total WTW CO2 emissions billion CO2 kg 58.39 108.2 -15.63
Scenario 3 - Egypt - main outputs: gradual drop of subsidies by 50% by 2024 and international oil price up by 20%
Unit Base year 2024
Total WTW CO2 emissions billion CO2 kg 58.39 113.6 -11.43
Scenario 4 - Egypt - main outputs: gradual drop of subsidies by 100% by 2024 and international oil price up by 20%
Unit Base year 2024
Total WTW CO2 emissions billion CO2 kg 58.39 101.67 -20.71
Basecase up to 2020
Unit Base year 2020
Total WTW CO2 emissions billion CO2 kg 58.39 84.73
Scenario 5 - Egypt - main outputs: gradual drop of subsidies by 100% in shorter term
Unit Base year 2020
Total WTW CO2 emissions billion CO2 kg 58.39 71.84 -15.21
Scenario 6 - Egypt - main outputs: drop of subsidies by 100% and increase in international price of oil by 20%
Unit Base year 2020
Total WTW CO2 emissions billion CO2 kg 58.39 67.72 -20.08
Source: Egyptian authorities, and authors' calculations
Table 1. Egypt- main outputs: FORFits simulation exercise (CO2 emissions) - subisdies and international oil price change
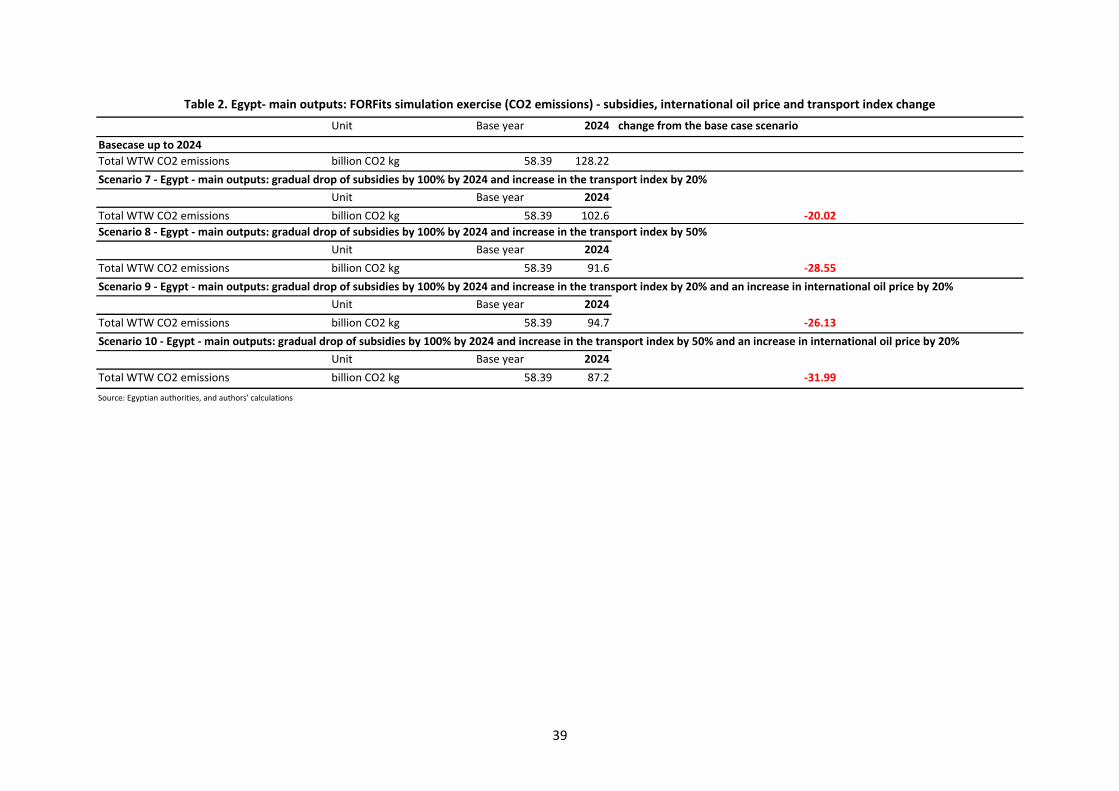
39
Unit Base year 2024 change from the base case scenario
Basecase up to 2024
Total WTW CO2 emissions billion CO2 kg 58.39 128.22
Scenario 7 - Egypt - main outputs: gradual drop of subsidies by 100% by 2024 and increase in the transport index by 20%
Unit Base year 2024
Total WTW CO2 emissions billion CO2 kg 58.39 102.6 -20.02
Scenario 8 - Egypt - main outputs: gradual drop of subsidies by 100% by 2024 and increase in the transport index by 50%
Unit Base year 2024
Total WTW CO2 emissions billion CO2 kg 58.39 91.6 -28.55
Scenario 9 - Egypt - main outputs: gradual drop of subsidies by 100% by 2024 and increase in the transport index by 20% and an increase in international oil price by 20%
Unit Base year 2024
Total WTW CO2 emissions billion CO2 kg 58.39 94.7 -26.13
Scenario 10 - Egypt - main outputs: gradual drop of subsidies by 100% by 2024 and increase in the transport index by 50% and an increase in international oil price by 20%
Unit Base year 2024
Total WTW CO2 emissions billion CO2 kg 58.39 87.2 -31.99
Source: Egyptian authorities, and authors' calculations
Table 2. Egypt- main outputs: FORFits simulation exercise (CO2 emissions) - subsidies, international oil price and transport index change

40
2014 2015 2016 2017 2018 2019 2020 2021 2022 2023 2024
basecase up to 2024 PM10 concentration 142 144.13 146.26 148.39 150.52 152.65 154.78 156.91 159.04 161.17 163.3
scenario 1 PM10 concentration 142 142.82 143.64 144.46 145.28 146.1 146.92 147.74 148.56 149.38 150.2
scenario 2 PM10 concentration 142 141.55 141.1 140.65 140.2 139.75 139.3 138.85 138.4 137.95 137.5
scenario 3 PM10 concentration 142 142.26 142.52 142.78 143.04 143.3 143.56 143.82 144.08 144.34 144.6
scenario 4 PM10 concentration 142 140.8 139.6 138.4 137.2 136 134.8 133.6 132.4 131.2 130
basecase up to 2020 142 142.96 143.92 144.88 145.83 146.79 147.75
scenario 5 PM10 concentration 142 139.27 136.54 133.81 131.08 128.35 125.6
scenario 6 PM10 concentration 142 139.48 136.96 134.44 131.92 129.4 116.72
Transport index
scenario 7 PM10 concentration 142 140.87 139.74 138.61 137.48 136.35 135.22 134.09 132.96 131.83 130.7
scenario 8 PM10 concentration 142 139.56 137.12 134.68 132.24 129.8 127.36 124.92 122.48 120.04 117.6
scenario 9 PM10 concentration 142 139.89 137.78 135.67 133.56 131.45 129.34 127.23 125.12 123.01 120.9
scenario 10 PM10 concentration 142 139 136 133 130 127 124 121 118 115 112
based on original Table 2.2. World Bank Cairo Pollution report
Table 3. PM10 projected concentration in Cairo

41
2014 2015 2016 2017 2018 2019 2020 2021 2022 2023 2024
basecase up to 2024 transport pollution DALY 24276.68 24618.6 24982.42 25346.24 25710.07 26073.89 26437.71 26801.53 27165.35 27529.17 27893
scenario 1 transport pollution DALY 24276.68 24276.68 24416.06 24555.44 24694.83 24834.21 24973.6 25112.98 25252.37 25391.75 25537
scenario 2 transport pollution DALY 24276.68 23873.85 24276.68 24199.25 24121.83 24044.4 23966.98 23889.56 23812.13 23734.71 23657
scenario 3 transport pollution DALY 24276.68 24618.6 24276.68 24320.96 24365.25 24409.54 24453.83 24498.12 24542.4 24586.69 24631
scenario 4 transport pollution DALY 24276.68 24105.71 23900.27 23694.82 23489.37 23283.93 23078.48 22873.03 22667.59 22462.14 22257
basecase up to 2020 transport pollution DALY 24276.68 24440.54 24604.41 24768.28 24932.15 25096.01 25259.88
scenario 5 transport pollution DALY 24276.68 23809.95 23343.22 22876.49 22409.76 21943.04 21470.9
scenario 6 transport pollution DALY 24276.68 23845.85 23415.02 22984.2 22553.37 22122.55 19955.31
Transport index
scenario 7 transport pollution DALY 24276.68 24083.49 23890.3 23697.11 23503.92 23310.74 23117.55 22924.36 22731.17 22537.99 22344.8
scenario 8 transport pollution DALY 24276.68 23859.53 23442.38 23025.23 22608.08 22190.93 21773.78 21356.64 20939.49 20522.34 20105.19
scenario 9 transport pollution DALY 24276.68 23915.94 23555.21 23194.48 22833.75 22473.02 22112.29 21751.56 21390.83 21030.1 20669.37
scenario 10 transport pollution DALY 24276.68 23763.79 23250.9 22738.01 22225.13 21712.24 21199.35 20686.46 20173.58 19660.69 19147.8
based on original Table 5.1. World Bank Cairo Pollution report
Table 4. Total DALYs lost to transport pollution
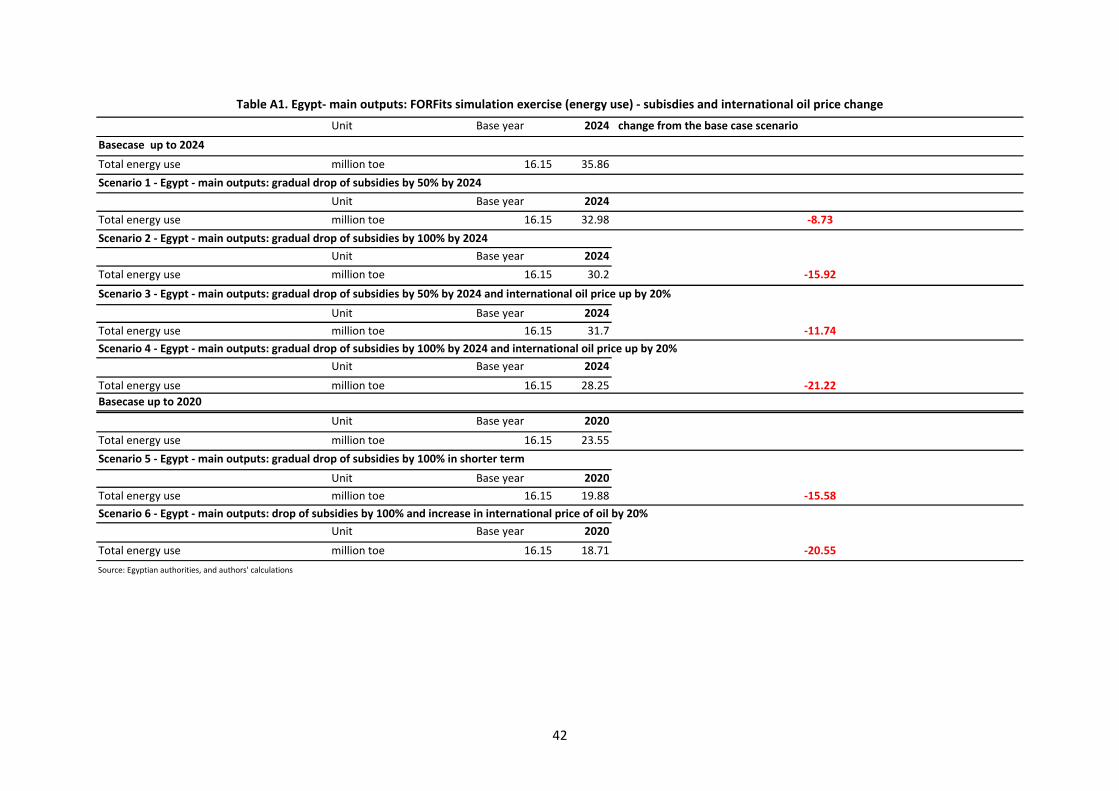
42
Unit Base year 2024 change from the base case scenario
Basecase up to 2024
Total energy use million toe 16.15 35.86
Scenario 1 - Egypt - main outputs: gradual drop of subsidies by 50% by 2024
Unit Base year 2024
Total energy use million toe 16.15 32.98 -8.73
Scenario 2 - Egypt - main outputs: gradual drop of subsidies by 100% by 2024
Unit Base year 2024
Total energy use million toe 16.15 30.2 -15.92
Scenario 3 - Egypt - main outputs: gradual drop of subsidies by 50% by 2024 and international oil price up by 20%
Unit Base year 2024
Total energy use million toe 16.15 31.7 -11.74
Scenario 4 - Egypt - main outputs: gradual drop of subsidies by 100% by 2024 and international oil price up by 20%
Unit Base year 2024
Total energy use million toe 16.15 28.25 -21.22
Basecase up to 2020
Unit Base year 2020
Total energy use million toe 16.15 23.55
Scenario 5 - Egypt - main outputs: gradual drop of subsidies by 100% in shorter term
Unit Base year 2020
Total energy use million toe 16.15 19.88 -15.58
Scenario 6 - Egypt - main outputs: drop of subsidies by 100% and increase in international price of oil by 20%
Unit Base year 2020
Total energy use million toe 16.15 18.71 -20.55
Source: Egyptian authorities, and authors' calculations
Table A1. Egypt- main outputs: FORFits simulation exercise (energy use) - subisdies and international oil price change

43
Unit Base year 2024 change from the base case scenario
Basecase up to 2024
Total energy use million toe 16.15 35.86
Scenario 7 - Egypt - main outputs: gradual drop of subsidies by 100% by 2024 and increase in the transport index by 20%
Unit Base year 2024
Total energy use million toe 16.15 27.8 -22.56
Scenario 8 - Egypt - main outputs: gradual drop of subsidies by 100% by 2024 and increase in the transport index by 50%
Unit Base year 2024
Total energy use million toe 16.15 26.0 -27.50
Scenario 9 - Egypt - main outputs: gradual drop of subsidies by 100% by 2024 and increase in the transport index by 20% and an increase in international oil price by 20%
Unit Base year 2024
Total energy use million toe 16.15 26.2 -26.94
Scenario 10 - Egypt - main outputs: gradual drop of subsidies by 100% by 2024 and increase in the transport index by 50% and an increase in international oil price by 20%
Unit Base year 2024
Total energy use million toe 16.15 25.0 -30.20
Source: Egyptian authorities, and authors' calculations
Table A2. Egypt- main outputs: FORFits simulation exercise (energy use) - subsidies, international oil price and transport index change