estimating trait heritability in highly fecund species · estimating heritability 1 abstract 2...
TRANSCRIPT

Estimating trait heritability in highly fecundspeciesSarah W. Davies1,*,+, Samuel V. Scarpino2,*,++, Thanapat Pongwarin1, JamesScott3,4, and Mikhail V. Matz1,+++
1Department of Integrative Biology, The University of Texas at Austin, Austin, Texas, USA2Santa Fe Institute, Santa Fe, New Mexico, USA3Department of Statistics and Data Sciences, The University of Texas at Austin, Austin, Texas, USA4Department of Information, Risk, and Operations Management, The University of Texas at Austin,Austin, Texas, USA*these authors contributed equally to this work+address corespondence regarding experiments to [email protected]++address corespondence regarding statistics to [email protected]+++address general corespondence to [email protected]
G3: Genes|Genomes|Genetics Early Online, published on October 4, 2015 as doi:10.1534/g3.115.020701
© The Author(s) 2013. Published by the Genetics Society of America.

Estimating heritability
Running Title: Estimating heritability
Keywords: Heritability; Non-model organisms; Common Garden; Binary Variable Traits;
Coral Settlement
Corresponding Author Contact:
Mikhail V. MatzDepartment of Integrative BiologyThe University of Texas at Austin1 University Station #C0930Austin, Texas, 78712, [email protected](512) 475-6424
2

Estimating heritability
Abstract1
Increasingly, researchers are interested in estimating the heritability of traits for non-model2
organisms. However, estimating the heritability of these traits presents both experimental and3
statistical challenges, which typically arise from logistical difficulties associated with rearing4
large numbers of families independently in the field, a lack of known pedigree, the need to5
account for group or batch effects, etc. Here we develop both an empirical and computational6
methodology for estimating the narrow-sense heritability of traits for highly fecund species.7
Our experimental approach controls for undesirable culturing effects, while minimizing culture8
numbers, increasing feasibility in the field. Our statistical approach accounts for known issues9
with model-selection by using a permutation test to calculate significance values and includes10
both fitting and power calculation methods. We further demonstrate that even with moderately11
high sample-sizes, the p-values derived from asymptotic properties of the likelihood ratio test12
are overly conservative, thus reducing statistical power. We illustrate our methodology by13
estimating the narrow-sense heritability for larval settlement, a key life-history trait, in the reef-14
building coral Orbicella faveolata. The experimental, statistical and computational methods,15
along with all of the data from this study, are available in the R package multiDimBio.16
Introduction17
Organisms with high fecundity, small propagule size, and limited parental investment, also18
referred to as r-selected species, often exhibit higher levels of nucleotide diversity and/or19
standing genetic variation when compared to k-selected species (Romiguier et al., 2014).20
Many marine species, including fish and invertebrates, exhibit these r-selected life history21
characteristics (Doherty & Fowler, 1994) and indeed have been shown to exhibit high levels of22
genetic diversity (Bay et al., 2004; Davies et al., 2015). However, this high genetic diversity23
does little to predict how a population will respond to environmental perturbations, such24
as those caused by climate change. Instead, the key question is not how much variation is25
present, but what is the heritability of the traits under selection following the perturbation.26
3
Estimating heritability
Quantifying narrow-sense heritability, the proportion of phenotypic variance attributable to27
additive genetic effects (Lynch & Walsh, 1998), for non-model organisms presents both28
experimental and statistical challenges. Most experiments aiming to quantify narrow-sense29
heritability involve multi-generational breeding programs and large numbers of crosses with30
many culture replicates to account for “jar effects,” both of which are rarely feasible in31
non-model species.32
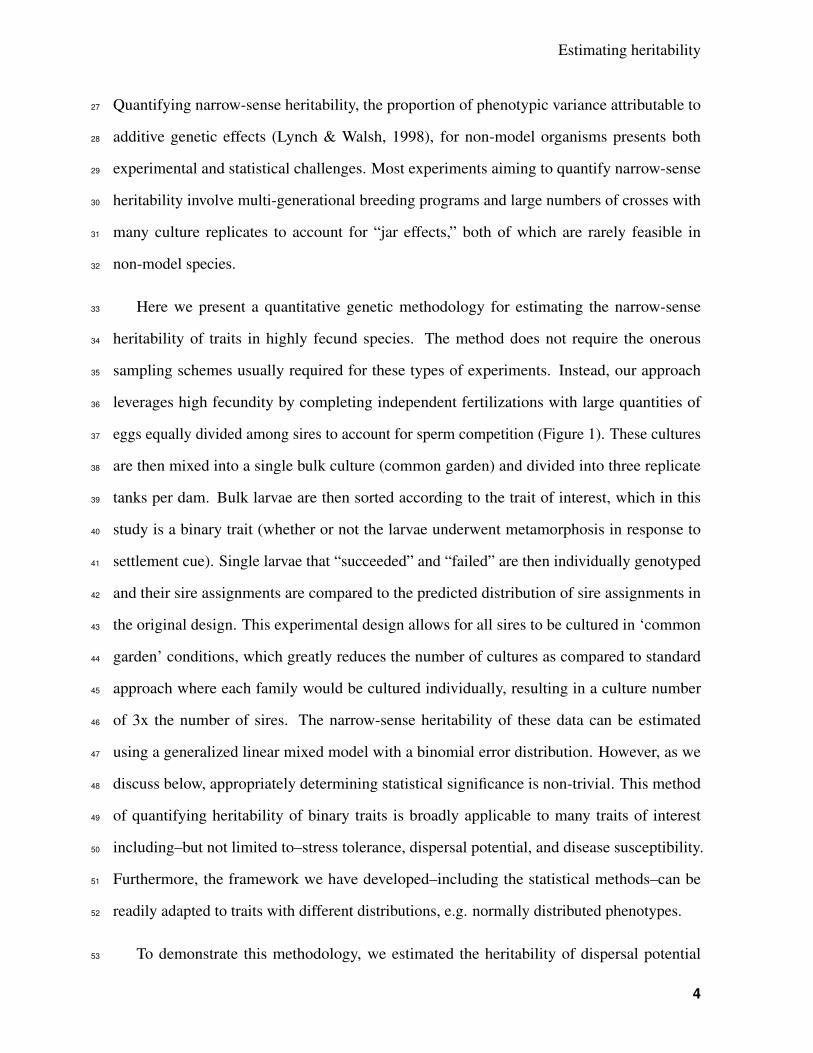
Here we present a quantitative genetic methodology for estimating the narrow-sense33
heritability of traits in highly fecund species. The method does not require the onerous34
sampling schemes usually required for these types of experiments. Instead, our approach35
leverages high fecundity by completing independent fertilizations with large quantities of36
eggs equally divided among sires to account for sperm competition (Figure 1). These cultures37
are then mixed into a single bulk culture (common garden) and divided into three replicate38
tanks per dam. Bulk larvae are then sorted according to the trait of interest, which in this39
study is a binary trait (whether or not the larvae underwent metamorphosis in response to40
settlement cue). Single larvae that “succeeded” and “failed” are then individually genotyped41
and their sire assignments are compared to the predicted distribution of sire assignments in42
the original design. This experimental design allows for all sires to be cultured in ‘common43
garden’ conditions, which greatly reduces the number of cultures as compared to standard44
approach where each family would be cultured individually, resulting in a culture number45
of 3x the number of sires. The narrow-sense heritability of these data can be estimated46
using a generalized linear mixed model with a binomial error distribution. However, as we47
discuss below, appropriately determining statistical significance is non-trivial. This method48
of quantifying heritability of binary traits is broadly applicable to many traits of interest49
including–but not limited to–stress tolerance, dispersal potential, and disease susceptibility.50
Furthermore, the framework we have developed–including the statistical methods–can be51
readily adapted to traits with different distributions, e.g. normally distributed phenotypes.52
To demonstrate this methodology, we estimated the heritability of dispersal potential53
4

Estimating heritability
in reef-building coral larvae. The majority of corals–like many other marine invertebrates–54
release gametes into the water annually. These gametes develop into planktonic larvae that55
are dispersed by ocean currents, representing each coral’s only dispersal opportunity (Baird56
et al., 2009). The now pelagic larvae can travel great distances before settling on a reef, but57
once the larva settles, it will remain there for the duration of its life. Therefore, selection for58
dispersal potential is limited to optimizing larval traits, which can be investigated through59
classical quantitative genetics, e.g. Meyer et al. (2009). Specifically, we determined how60
much variation in the early larval responsiveness to settlement cue depends on the genetic61
background of larvae. The experiments were performed on larvae of the hermaphroditic62
mountainous star coral, Orbicella faveolata, which is an important but endangered Caribbean63
reef-building coral. To analyze these data, and estimate the narrow-sense heritability of64
this binary trait, we developed a Monte Carlo method for performing model selection and65
calculating statistical power with generalized linear mixed models. The code and data are66
available in the R package multiDimBio (Scarpino et al., 2014).67
Materials and methods68
Experimental Framework69
Our experimental framework, which is summarized in Figure 1, proceeds in four steps. First,70
we perform crosses between the desired number of parents. Second, all offspring from a single71
dam are reared in the same environment (‘common garden’). Third, offspring are phenotyped72
for the trait of interest and genotyped to determine paternity. Fourth, these data are analyzed73
using random-effects models and a permutation test to determine statistical significance. What74
follows is a detailed description of how to estimate the narrow-sense heritability of coral75
settlement using this framework.76
5

Estimating heritability
Application of the experimental framework to coral settlement77
Crossing design and larval rearing78
One day prior to the annual coral spawn on August 7, 2012, ten independent O. faveolata79
colony fragments (10cm x 10cm) were collected from the East Flower Garden Banks National80
Marine Sanctuary, Gulf of Mexico. Colonies were maintained in flow through conditions81
aboard the vessel and were shaded from direct sunlight. Colonies were at least 10m apart to82
avoid sampling clones, as clones within reefs have been detected in this genus (Severance and83
Karl, 2006; Baums et al., 2010). However, intracolony variation (chimerism) in scleractinian84
corals is very rare (Puill-Stephan et al., 2009), so each sire was assumed to only produce85
sperm of a single genotype. Prior to spawning, at 20:00CDT on August 8, 2012, colonies were86
isolated in individual bins filled with 1µm filtered seawater and were shaded completely. Nine87
colonies spawned at approximately 23:30CDT. From these spawning colonies, we collected88
gamete bundles and separated eggs and sperm with nylon mesh. Each colony was used as an89
independent sire, with no additional sperm/sires included in this study. Samples from each90
sire were preserved in ethanol for genotyping.91
Divers collected gamete bundles directly from three colonies during spawning and eggs92
were separated to serve as maternal material (N=3 dams). Eggs were divided equally among93
fertilization bins (N=9 per dam) and sperm from each sire was added at 0200CDT on August94
9, 2012 for a total of 27 fertilization bins. Control self-cross trials verified that self-fertilization95
was not detectable in our samples. After fertilization, at 0800CDT, excess sperm was removed96
by rinsing with nylon mesh, and embryos for each dam across all sires were pooled in one97
common culture. Densities were determined and larvae were stocked into three replicate98
culture vessels at 1 larva per 2ml for a total of nine culture containers (N=3 per dam). Larvae99
were transferred to the University of Texas at Austin on August 10, 2012. Following spawning,100
colony fragments were returned to the reef. All work was completed under the Flower garden101
Banks National Marine Sanctuary permit #FGBNMS-2012-002.102
6

Estimating heritability
Common Garden Settlement Assay103
On August 14, 2012, 6 day old, pre-competent larvae from the three replicate bins for a single104
dam were divided across three settlement assays. Four hundred healthy larvae per culture105
replicate were added to a sterile 800ml container with five conditioned glass slides and finely106
ground, locally collected crustose coralline algae (CCA), a known settlement inducer for this107
coral genus (Davies et al., 2014). Cultures were maintained for three days after which each108
slide was removed and recruits were individually preserved in 96% ethanol, representing109
larvae exhibiting “early” responsiveness to settlement cue. Culture water was changed, new110
slides were added with additional CCA and larvae were maintained until they reached 14 days111
old. All settled larvae on slides were discarded and 50 larvae per culture were individually112
preserved in 96% ethanol. Larvae from the other two dams were not used in these assays due113
to high culture mortality.114
Larval DNA Extraction115
Larval DNA extraction followed a standard phenol-chloroform iso-amyl alcohol extraction116
protocol, see Davies et al. (2013), with modifications to accommodate for the single larva117
instead of bulk adult tissue.118
Parental Genotyping119
Sire genotyping was completed using nine loci from Davies et al. (2014) and four loci from120
Severance et al. (2004) following published protocols. Amplicons were resolved on agarose gel121
to verify amplification and molecular weights were analyzed using the ABI 3130XL capillary122
sequencer. GeneMarker V2.4.0 (Soft Genetics) assessed genotypes and loci representing the123
highest allelic diversities amongst the sires were chosen as larval parentage markers. To ensure124
that each sire was a unique multilocus genotype (MLG) and that the relatedness between sires125
was negligible, we compared the allelic composition of each sire across six microsatellite loci126
(MLG) and calculated the Probability of Identity at each locus in GENALEX v6.5 Peakall &127
Smouse (2006).128
7

Estimating heritability
Table 1. Summary of the six microsatellite loci from Davies et al. (2013) used in paternityassignment.
Locus Observed (bp) Na FluorescenceM fav4 375-391 5 FAMmaMS2-5 280-328 20 FAMmaMS8 197-203 3 FAMM fav6 387-429 11 HEXM fav7 453-498 9 HEXmaMS2-8 187-205 10 NED
Larval Parentage129
To compensate for the low larval DNA concentrations, 3µl of each single extracted larva130
(unknown concentration) was amplified in a multiplex reaction with six loci from Davies et al.131
(2013) with the following modifications: 1µM of each fluorescent primer pair (N=6) and132
20µL reaction volumes (Table 1). Alleles were called in GeneMarker V2.4.0 and offspring133
parentage was assigned based on presence/absence of sire alleles. Data were formatted into a134
dataframe consisting of the number of early settlers and swimming larvae that were assigned135
to each sire (A-J) from each of three replicate bins (1-3).136
Statistical Methods137
Estimating narrow-sense heritability from binary data138
In principle, estimating narrow-sense heritability for a binomially distributed trait, such as coral139
settlement, is straightforward, see Gilmour et al. (1985); Foulley et al. (1987); Vazquez et al.140
(2009); Biscarini et al. (2014, 2015). The desired quantity is the among-sire variance, denoted141
as τ2, which can be estimated using a generalized linear mixed model with a binomial error142
distribution. Although this a departure from the standard threshold approach for estimating the143
heritability of binomial traits, it is now fairly common in the quantitative genetics literature,144
see Foulley et al. (1987) and Vazquez et al. (2009).145
Suppose we have binary observations yi j ∈ {0,1} where i index units (sires) and j indexes
observations within units. The model is simple Bernoulli sampling, parameterized by log
8
Estimating heritability
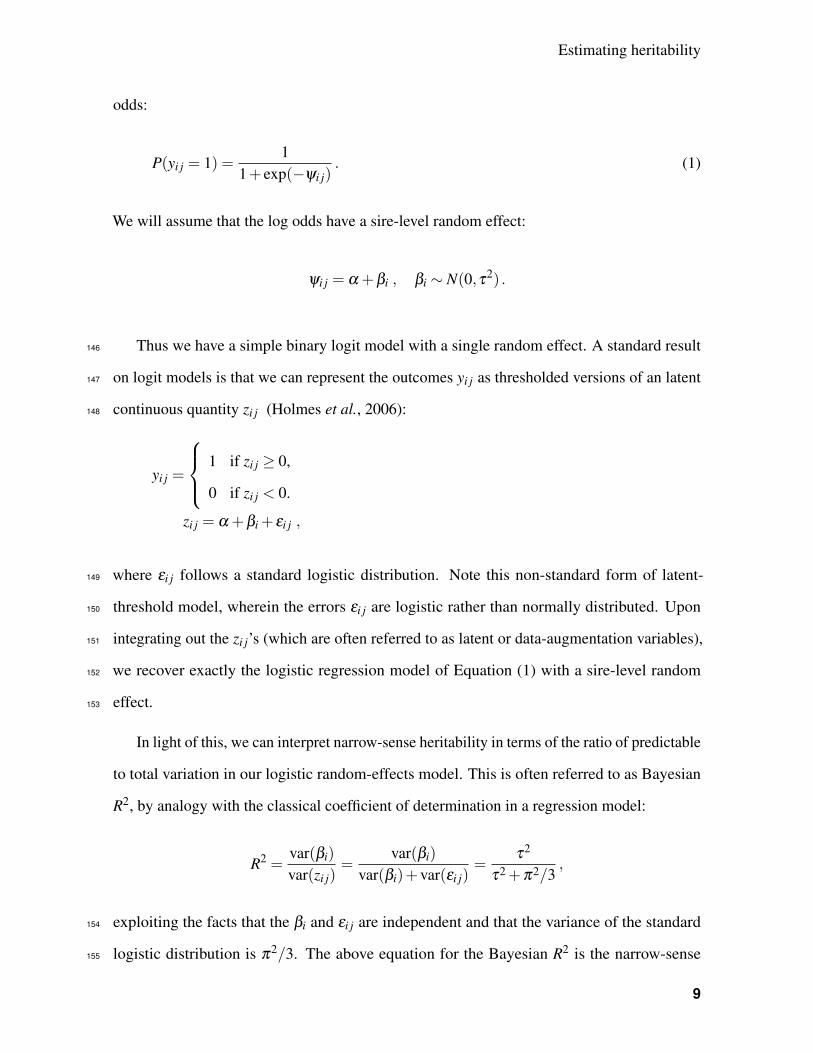
odds:
P(yi j = 1) =1
1+ exp(−ψi j). (1)
We will assume that the log odds have a sire-level random effect:
ψi j = α +βi , βi ∼ N(0,τ2) .
Thus we have a simple binary logit model with a single random effect. A standard result146
on logit models is that we can represent the outcomes yi j as thresholded versions of an latent147
continuous quantity zi j (Holmes et al., 2006):148
yi j =
1 if zi j ≥ 0,
0 if zi j < 0.
zi j = α +βi + εi j ,
where εi j follows a standard logistic distribution. Note this non-standard form of latent-149
threshold model, wherein the errors εi j are logistic rather than normally distributed. Upon150
integrating out the zi j’s (which are often referred to as latent or data-augmentation variables),151
we recover exactly the logistic regression model of Equation (1) with a sire-level random152
effect.153
In light of this, we can interpret narrow-sense heritability in terms of the ratio of predictable
to total variation in our logistic random-effects model. This is often referred to as Bayesian
R2, by analogy with the classical coefficient of determination in a regression model:
R2 =var(βi)
var(zi j)=
var(βi)
var(βi)+var(εi j)=
τ2
τ2 +π2/3,
exploiting the facts that the βi and εi j are independent and that the variance of the standard154
logistic distribution is π2/3. The above equation for the Bayesian R2 is the narrow-sense155
9

Estimating heritability
heritability for the animal model. Therefore, the among-sire variance can be transformed156
into an approximation of narrow-sense heritability under the sire model by multiplying the157
Bayesian R2 by four, see Foulley et al. (1987) and Vazquez et al. (2009) for a more detailed158
derivation and Lynch & Walsh (1998) for a discussion of the assumptions this approximation159
relies on.160
However, under this model, determining whether statistical support exists for an among-161
sire variance greater than zero remains a challenge. Traditionally, an approach to the problem162
would be to fit two models, one where τ2, the among-sire variance, is a free parameter and163
one where it is constrained to zero. These models can then be compared, and model selection164
performed, using a likelihood ratio test, or in this case the difference in each model’s deviance,165
which is equivalent to a likelihood ratio test for nested models. Although, critically, this166
is a special kind of likelihood ratio test because the null hypothesis resides on the edge of167
the parameter space. The large sample reference distribution for this type of test is usually168
considered to be a 50% mixture of a point of mass at zero and a χ2(1) (Self & Liang, 1987).169
However there is still substantial debate in the literature about what mixture should be used –170
e.g., Crainiceanu et al. (2003) – and it is not clear whether any of these mixtures are valid null171
distributions for finite sample sizes.172
Instead, our approach is to construct a permutation-based method for calculating a p value173
for the likelihood ratio test and performing model selection. This test is simple to implement,174
as it only involves randomly shuffling the identity of each offspring’s sire a large number of175
times (say, 500) and re-fitting the random-effects model to each shuffled data set. This avoids176
making assumptions about the asymptotic distribution of the test statistic that may fail to hold177
for finite sample sizes.178
Monte Carlo simulation for the likelihood ratio test179
Our simulations assume a fixed probability of settlement, psettle, to be equal across all sires, in180
this case psettle = 0.285 (the global mean), and simulate 1,000 data sets where the number of181
offspring for each sire in each of three bins is drawn from a negative binomial distribution182
10

Estimating heritability
with µ = 4.63 and size = µ2/(√
12.63−µ), again these are the empirically observed values183
across sires. The resulting 1,000 data sets have the same structure as the observed data, but the184
only among sire variability comes from sampling, the true τ2 = 0. For each simulated data set,185
we calculated the likelihood-ratio test statistic. This provides a Monte Carlo approximation to186
the true sampling distribution of the test statistic under the null.187
Power analysis188
With any novel experimental design, it is desirable to construct a method for estimating its189
statistical power. Using the Monte Carlo approach designed to calculate p-values for likelihood190
ratio tests, we can simulate data sets with an arbitrary number of sires, number and variance in191
offspring, among-sires variance, and number of bins. By repeatedly simulating data sets using192
fixed combinations of these parameters, the statistical power is simply the fraction of times we193
correctly reject the null hypothesis. Similarly, the false positive rate is the fraction of times we194
falsely reject the null hypothesis.195
Implementation196
All code and data developed for this study are available in the R package multiDimBio (Scarpino197
et al., 2014). The statistical models were fit using the R packages stats in R version 3.2.1 (R198
Core Team, 2015) and lme4 version 1.1-8 (Bates et al., 2015).199
Results200
Sire Independence201
Each sire was determined to be a unique multilocus genotype (MLG) across the six microsatel-202
lite loci indicating that no clones were collected (Table 2). In order to ensure that each sire203
could be considered independent, we calculated the Probability of Identity at each locus and204
found that these probabilities ranged from 3.2E-01 for a single locus down to 2.0E-06 when205
all six loci are considered and therefore each sire was considered independent.206
11

Estimating heritability
Table 2. Summary of paternity assignment results. Values are the microsatellite lengths foreach of six loci from Davies et al. (2014).
Locus 1 Locus 2 Locus 3 Locus 4 Locus 5 Locus 6Sire MaMS8 MaMS8.1 Sev5 Sev5.1 Mfav4 Mfav4.1 Mfav6 Mfav6.1 Mfav7 Mfav7.1 Sev8 Sev8.1
A 200 200 280 322 379 379 391 391 453 465 190 196B 200 203 292 322 379 379 389 391 471 486 187 190C 200 200 283 313 375 375 419 429 453 471 190 193D 197 200 301 322 375 379 423 423 465 486 190 196E 200 200 283 316 375 391 389 389 453 474 190 193F 197 197 307 313 375 375 391 391 462 471 190 202G 197 200 301 328 379 379 391 391 474 474 193 205H 197 200 280 307 383 383 389 389 453 453 190 1931J 197 200 280 313 379 379 389 389 477 498 193 193
Parentage207
Larvae that amplified at > 2 loci were considered successful amplifications. A total number208
of 55 recruits (binary successes) were collected and of these 47 were amplified and 37 were209
assigned parentage. A total number of 129 swimming larvae (binary failures) were extracted210
and of these 112 amplified successfully and 81 were assigned parentage.211
Monte Carlo simulation for the likelihood ratio test212
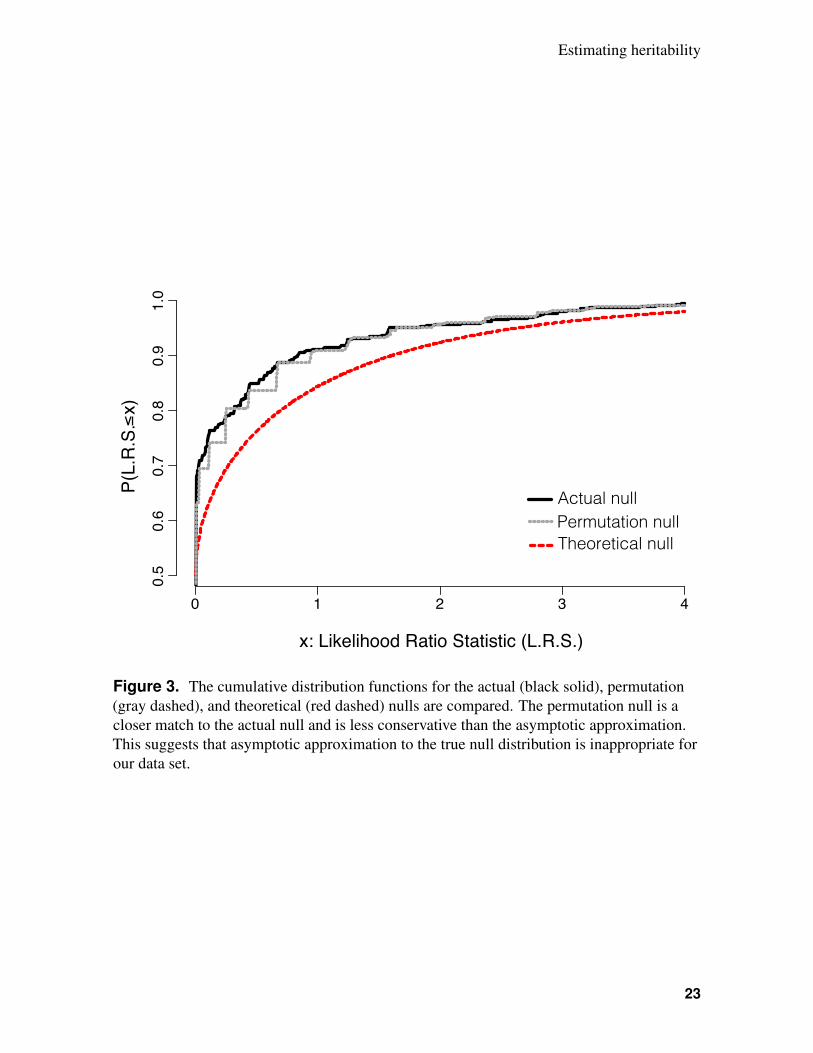
To test whether the procedure proposed in this study provided any benefits over the traditional213
approach to performing a likelihood ratio test, we first simulated the true sampling distribution214
of the likelihood ratio statistic under the null hypothesis. This was accomplished by repeatedly215
simulating data from a model where the true among-sire variance (τ2) was zero. The cumula-216
tive distribution function (CDF) of this random variable is shown as a black curve (actual null)217
in Figure 3. We then calculated two approximations to this sampling distribution; these CDFs218
are also plotted in Figure 3. First, the red curve (theoretical null) shows a mixture distribution219
of a point mass at 0 (with probability 0.5) and χ2(1) random variable (with probability 0.5).220
This is the asymptotic approximation to the true null used in the traditional likelihood-ratio test221
of a variance component in a mixed-effects model. Second, the dotted grey curve (permutation222
null) shows the estimated null distribution obtained by running the permutation test on a single223
simulated data set. The permutation null is clearly a better approximation to the actual null224
than is the theoretical null, whose distribution is shifted to the right. This fact suggests that–at225
12

Estimating heritability
least for data sets similar to ours–the asymptotic approximation is too conservative, and will226
therefore lead to reduced power at a specified false-positive rate.227
Statistics228
Using the described experimental design and statistical methods, we were unable to detect229
a significant random effect of sire, although there was a trend in overall variation in early230
settlement among sires (Figure 2). However, by bootstrapping the data, we were able to231
obtain an estimated τ2 of approximately 0.176 (0.42 standard deviation), corresponding to a232
narrow-sense heritability of around 0.2 (95% CI 0.0 - 1.0). Considering the number of sires233
used and offspring sampled in our study, the true narrow-sense heritability would have to234
be well above 0.6 to achieve 80% power (Figure 4a). Nevertheless, this experimental set up235
should be sufficiently powered to correctly fail to reject the null hypothesis if in fact the true236
among sire variance was zero (Figure 4b).237
Power analysis238
Power analysis results suggest that increasing the number of sires is the most effective239
mechanism to increase statistical power. Unfortunately, for heritabilities less then 0.4, very240
large numbers of sires will be required. The intuition is that substantial amounts of variability241
between sires is expected just due to sampling alone, and therefore statistical support for a242
non-zero heritability requires large sample sizes. Despite the lack of statistical power, this243
approach does have the desirable property of low false positive rates. For example, even with244
nine sires, we expect to have a nearly 90% chance of failing to reject the null hypothesis on245
data sets simulated with an among-sire variance equal to zero (Figure 4b). Lastly, if sequencing246
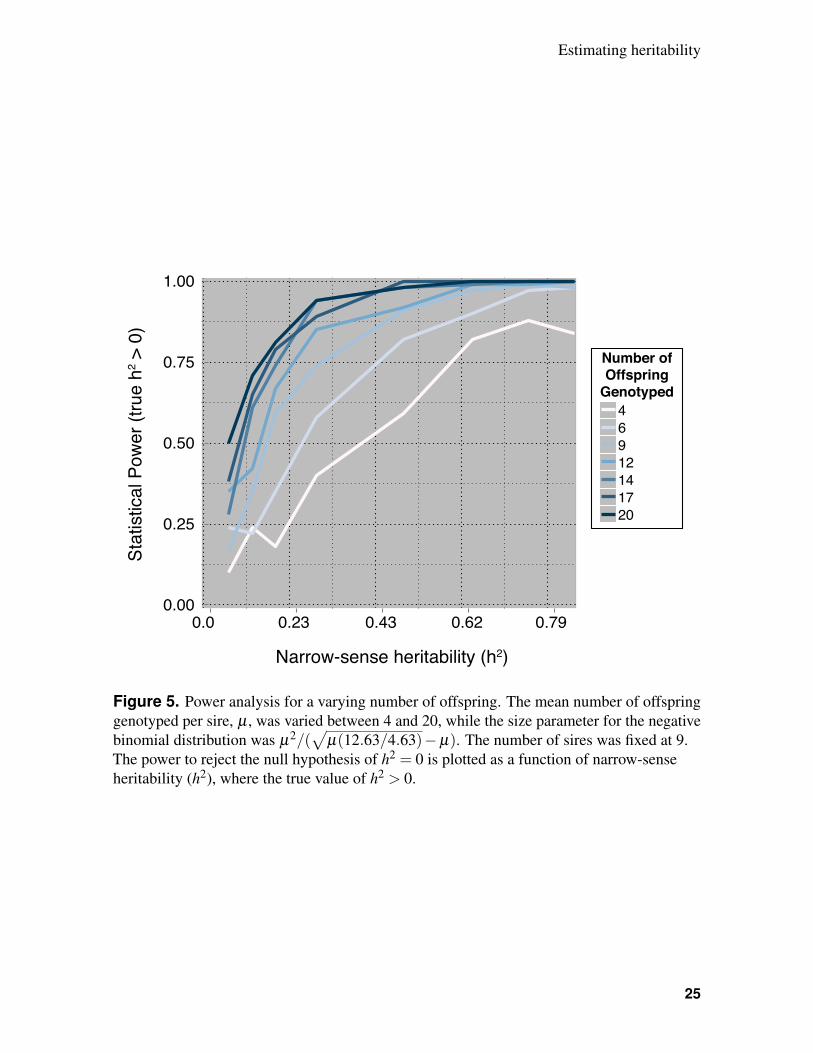
additional offspring is an option, statistical power can be improved (Figure 5).247
Discussion248
In this paper, we present an experimental and statistical methodology for estimating the249
heritability of traits in non-model, highly fecund organisms. We applied this approach250
13

Estimating heritability
to determine whether settlement is a heritable trait in the reef-building coral O. faveolata.251
Although we did not find statistical support for a non-zero, heritability in this trait, a power252
analysis suggests we lacked a sufficient number of individuals. Our computational method253
includes code for fitting model parameters, performing model selection using a permutation254
test, and calculating the expected statistical power for proposed or completed studies. The255
power calculation method is especially important for studies requiring animal care and use256
approval and/or those with complex or expensive collection demands.257
Previous work suggests that heritable variation exists for a variety of traits across many258
marine organisms (Foo et al., 2012; Johnson et al., 2010; Kelly et al., 2013; Lobon et al., 2011;259
McKenzie et al., 2011; Parsons, 1997), including corals (Kenkel et al., 2011; Meyer et al.,260
2009). These studies have found significant heritability for nearly every trait measured in261
corals (Kenkel et al., 2011; Meyer et al., 2009, 2011; Carlon et al., 2011), but see Csaszar et al.262
(2010). In fact, one study specifically quantified the additive genetic variance in settlement263
rates of the Pacific reef-building coral Acropora millepora and found h2 = 0.49, however no264
variance around this mean was estimated (Meyer et al., 2009). It would not be surprising265
from an evolutionary standpoint if an ecologically important life-history trait such as larval266
settlement was heritable in other coral species, such as O. faveoalta. However, in this study267
we were unable to detect heritable variation, likely due to insufficient numbers of individuals.268
There is a rich quantitative genetics literature on estimating the heritability of binomial269
traits dating back to Wright (1917) and Fisher (1918); however, the first use of Generalized270
Linear Models fit to observed presence/absence data is from Gilmour et al. (1985), with key271
future contributions from Foulley et al. (1987) and Vazquez et al. (2009). These methods were272
originally developed for agricultural breeders, where fewer constraints exist on the number of273
families used to estimate the heritability–for example the viability of poultry (Robertson &274
Lerner, 1949), common genetic disorders of Holstein cows (Uribe et al., 1995) and root vigor275
in sugar beets (Biscarini et al., 2014, 2015). Uribe et al. (1995) estimated sire and residual276
variance components using REML modeling of 7416 paternal half-sib cows and found that277
14

Estimating heritability
heritability of common diseases in cows ranged from 0 to 0.28. These sorts of numbers are278
unreasonable to sample in natural populations of corals since parentage is rarely known unless279
controlled crosses are completed and then the costs associated with genotyping thousands of280
individuals are prohibitive.281
A pair of recent papers by Biscarini et al. (2014 and 2015) developed a cross-validation282
based algorithm for selecting single nucleotide polymorphisms that maximally classified sugar283
beets into high and low root vigor. Therefore, our principle contribution is in terms of model284
selection, in the form of a permutation test to determine whether statistical support exists for a285
non-zero narrow-sense heritability, and the methods application to non-model organisms. In286
such organisms, where breeding, collection, and/or budgetary constraints may exist, such a287
model-selection procedure is essential.288
Our approach has three important caveats. First, as stated in the methods section, one289
cannot disentangle additive variation due to sire from dam-specific sire effects under the sire290
model Lynch & Walsh (1998). Therefore, conservatively, heritability estimates using our291
approach should be considered estimates of broad-sense heritability. Second, our methods292
are somewhat lacking in statistical power. For heritabilities thought to be typical of studies293
in non-model organisms, well more than 50 individuals may need to be typed across 9 sires,294
see Figures 4a and 5. However, our methods perform very well with respect to minimizing295
the type-I error rate, see Figure 4b. Lastly, as stated in the methods, the accepted approach–296
based on mixtures of chi-squared distributions–has even less statistical power and was a poor297
approximation to our observed null distribution. Future work should focus on adapting existing298
methods and developing new methods to allow for smaller sample sizes. This effort is meant299
to be a project that will grow and develop organically; therefore, we welcome suggestions and300
contributions and plan regular updates to the statistical methods.301
15

Estimating heritability
Acknowledgements302
The authors acknowledge funding from the Santa Fe Institute and the Omidyar Group to SVS.303
Funding was also provided by the National Science Foundation grant DEB-1054766 to MVM,304
NSF grant DMS-1255187 to JGS, a departmental start-up grant from the Section of Integrative305
Biology at the University of Texas at Austin to SWD and the PADI Foundation Award to SWD.306
In addition the Flower Garden Banks National Marine Sanctuary is acknowledged for boat307
time aboard the R/V Manta.308
References309
Baird, A.H., Guest, J.R. & Willis, B.L. (2009) Systematic and biogeographical patterns in310
the reproductive biology of scleractinian corals. Annual Review of Ecology Evolution and311
Systematics, 40, 551–571.312
Bates, D., Maechler, M., Bolker, B. & Walker, S. (2015) lme4: Linear mixed-effects models313
using eigen and s4. R package version 11-8, 1.314
Bay, L.K., Choat, J.H., van Herwerden, L. & Robertson, D.R. (2004) High genetic diversities315
and complex genetic structure in an indo-pacific tropical reef fish (chlorurus sordidus):316
evidence of an unstable evolutionary past? Marine Biology, 144, 757–767.317
Biscarini, F., Marini, S., Stevanato, P., Broccanello, C., Bellazzi, R. & Nazzicari, N. (2015)318
Developing a parsimonius predictor for binary traits in sugar beet (beta vulgaris). Molecular319
Breeding, 35, 1–12.320
Biscarini, F., Stevanato, P., Broccanello, C., Stella, A. & Saccomani, M. (2014) Genome-321
enabled predictions for binomial traits in sugar beet populations. BMC genetics, 15, 87.322
Carlon, D.B., Budd, A.F., Lippe, C. & Andrew, R.L. (2011) The quantitative genetics of323
incipient speciation: heritability and genetic correlations of skeletal traits in populations of324
diverging favia fragum ecomorphs. Evolution, 65, 3428–47.325
16

Estimating heritability
Crainiceanu, C.M., Ruppert, D. & Vogelsang, T.J. (2003) Some properties of likelihood ratio326
tests in linear mixed models. U RL http://legacy orie cornell edu/˜ davidr/papers, Retrieved327
May, 31, 2007.328
Csaszar, N.B., Ralph, P.J., Frankham, R., Berkelmans, R. & van Oppen, M.J. (2010) Estimating329
the potential for adaptation of corals to climate warming. PLoS One, 5, e9751.330
Davies, S.W., Meyer, E., Guermond, S.M. & Matz, M.V. (2014) A cross-ocean comparison of331
responses to settlement cues in reef-building corals. PeerJ, 2, e333.332
Davies, S.W., Treml, E.A., Kenkel, C.D. & Matz, M.V. (2015) Exploring the role of microne-333
sian islands in the maintenance of coral genetic diversity in the pacific ocean. Mol Ecol, 24,334
70–82.335
Davies, S., Rahman, M., Meyer, E., Green, E., Buschiazzo, E., Medina, M. & Matz, M.336
(2013) Novel polymorphic microsatellite markers for population genetics of the endangered337
caribbean star coral, montastraea faveolata. Marine Biodiversity, 43, 167–172.338
Doherty, P. & Fowler, T. (1994) An empirical test of recruitment limitation in a coral reef fish.339
Science, 263, 935–9.340
Fisher, R.A. (1918) Xv.—the correlation between relatives on the supposition of mendelian341
inheritance. Transactions of the royal society of Edinburgh, 52, 399–433.342
Foo, S.A., Dworjanyn, S.A., Poore, A.G.B. & Byrne, M. (2012) Adaptive capacity of the343
habitat modifying sea urchin centrostephanus rodgersii to ocean warming and ocean acidifi-344
cation: Performance of early embryos. Plos One, 7.345
Foulley, J., Gianola, D. & Im, S. (1987) Genetic evaluation of traits distributed as poisson-346
binomial with reference to reproductive characters. Theoretical and Applied Genetics, 73,347
870–877.348
17

Estimating heritability
Gilmour, A., Anderson, R. & Rae, A. (1985) The analysis of binomial data by a generalized349
linear mixed model. Biometrika, 72, 593–599.350
Holmes, C.C., Held, L. et al. (2006) Bayesian auxiliary variable models for binary and351
multinomial regression. Bayesian Analysis, 1, 145–168.352
Johnson, D.W., Christie, M.R. & Moye, J. (2010) Quantifying evolutionary potential of marine353
fish larvae: Heritability, selection, and evolutionary constraints. Evolution, 64, 2614–2628.354
Kelly, M.W., Padilla-Gamino, J.L. & Hofmann, G.E. (2013) Natural variation and the capacity355
to adapt to ocean acidification in the keystone sea urchin strongylocentrotus purpuratus.356
Glob Chang Biol.357
Kenkel, C.D., Traylor, M.R., Wiedenmann, J., Salih, A. & Matz, M.V. (2011) Fluorescence of358
coral larvae predicts their settlement response to crustose coralline algae and reflects stress.359
Proceedings of the Royal Society B-Biological Sciences, 278, 2691–2697.360
Lobon, C.M., Acuna, J.L., Lopez-Alvarez, M. & Capitanio, F.L. (2011) Heritability of361
morphological and life history traits in a pelagic tunicate. Marine Ecology Progress Series,362
422, 145–154.363
Lynch, M. & Walsh, B. (1998) Genetics and the analysis of quantitative traits. Sinauer364
Associates: Sunderland.365
McKenzie, L.A., Brooks, R. & Johnston, E.L. (2011) Heritable pollution tolerance in a marine366
invader. Environ Res, 111, 926–32.367
Meyer, E., Aglyamova, G.V. & Matz, M.V. (2011) Profiling gene expression responses of368
coral larvae (acropora millepora) to elevated temperature and settlement inducers using a369
novel rna-seq procedure. Molecular Ecology, 20, 3599–3616.370
Meyer, E., Davies, S., Wang, S., Willis, B.L., Abrego, D., Juenger, T.E. & Matz, M.V.371
18

Estimating heritability
(2009) Genetic variation in responses to a settlement cue and elevated temperature in the372
reef-building coral acropora millepora. Marine Ecology Progress Series, 392, 81–92.373
Parsons, K.E. (1997) Contrasting patterns of heritable geographic variation in shell morphology374
and growth potential in the marine gastropod bembicium vittatum: Evidence from field375
experiments. Evolution, 51, 784–796.376
Peakall, R. & Smouse, P.E. (2006) Genalex 6: genetic analysis in excel. population genetic377
software for teaching and research. Molecular ecology notes, 6, 288–295.378
R Core Team (2015) R: A Language and Environment for Statistical Computing. R Foundation379
for Statistical Computing, Vienna, Austria.380
Robertson, A. & Lerner, I.M. (1949) The heritability of all-or-none traits: viability of poultry.381
Genetics, 34, 395.382
Romiguier, J., Gayral, P., Ballenghien, M., Bernard, A., Cahais, V., Chenuil, A., Chiari,383
Y., Dernat, R., Duret, L., Faivre, N., Loire, E., Lourenco, J.M., Nabholz, B., Roux, C.,384
Tsagkogeorga, G., Weber, A.A., Weinert, L.A., Belkhir, K., Bierne, N., Glemin, S. &385
Galtier, N. (2014) Comparative population genomics in animals uncovers the determinants386
of genetic diversity. Nature, 515, 261–3.387
Scarpino, S.V., Gillette, R. & Crews, D. (2014) multidimbio: an r package for the design,388
analysis, and visualization of systems biology experiments. arXiv preprint arXiv:14040594.389
Self, S.G. & Liang, K.Y. (1987) Asymptotic properties of maximum likelihood estimators390
and likelihood ratio tests under nonstandard conditions. Journal of the American Statistical391
Association, 82, 605–610.392
Severance, E.G., Szmant, A.M. & Karl, S.A. (2004) Microsatellite loci isolated from the393
caribbean coral, montastraea annularis. Molecular Ecology Notes, 4, 74–76.394
19

Estimating heritability
Uribe, H., Kennedy, B., Martin, S. & Kelton, D. (1995) Genetic parameters for common health395
disorders of holstein cows. Journal of Dairy Science, 78, 421–430.396
Vazquez, A., Weigel, K., Gianola, D., Bates, D., Perez-Cabal, M., Rosa, G. & Chang, Y. (2009)397
Poisson versus threshold models for genetic analysis of clinical mastitis in us holsteins.398
Journal of dairy science, 92, 5239–5247.399
Wright, S. (1917) The average correlation within subgroups of a population. Journal of the400
Washington Academy of Science, 7, 532–535.401
20

Estimating heritability
Figure 1. Diagram representing the design of the common garden experiment. First,independent fertilizations are completed for each sire and dam (in this case only one dam andnine sires are used). Second, equal quantities of fertilized embryos are pooled into one singlecommon garden tank. This common garden is the split into three replicate tanks (N=400larvae per tank). Settlement slides are added to each experimental tank and after 4 days thesettled larvae are collected and individually preserved. Larvae were then left for an additional10 days and settled larvae were removed every few days. N=50 larvae that remainedswimming after 14 days were collected and individually preserved for genotyping, to comparetheir parentage to the parentage of the early-settling larvae.
21

Estimating heritability
0.0
0.2
0.4
0.6
0.8
1.0
A B C D E F G H JSire (Paternal Effect)
Pro
porti
on o
f Res
pons
e
ResponseSettled
Swimming
11 35 11 17 3 19 5 9 12
Figure 2. Proportion of settled (successes) and swimming (failures) larvae belonging to eachsire. The total number of genotyped larvae assigning to each sire is indicated at the top ofeach bar.
22
Estimating heritability
0 1 2 3 4
0.5
0.6
0.7
0.8
0.9
1.0
x: Likelihood Ratio Statistic (L.R.S.)
P(L.
R.S
. x)
Actual null
Theoretical nullPermutation null
Figure 3. The cumulative distribution functions for the actual (black solid), permutation(gray dashed), and theoretical (red dashed) nulls are compared. The permutation null is acloser match to the actual null and is less conservative than the asymptotic approximation.This suggests that asymptotic approximation to the true null distribution is inappropriate forour data set.
23

Estimating heritability
Sires910111213141516171819200.25
0.50
0.75
1.00
0.0 0.23 0.43 0.62 0.79
Narrow-sense heritability (h2)
Stat
istic
al P
ower
(tru
e h2 >
0)
a.
0.00
0.25
0.50
0.75
1.00
9 10 11 12 13 14 15 16 17 18 19 20
Number of Sires
Stat
istic
al P
ower
(tru
e h2 =
0)
b.
0.00
Figure 4. Power analysis for a varying number of sires. The offspring number was fixed, atµ = 4.63 and size = µ2/(
√12.63−µ) respectively, and the number of sires was varied
between 9 and 20. In panel a., the power to reject the null hypothesis of h2 = 0 is plotted as afunction of narrow-sense heritability (h2), where the true value of h2 > 0. In panel b., thepower to fail-to-reject the null hypothesis when the true value of h2 was equal to zero isplotted for varying numbers of sires.
24
Estimating heritability
0.00
0.25
0.50
0.75
1.00
0.0 0.23 0.43 0.62 0.79
Stat
istic
al P
ower
(tru
e h2 >
0)
Narrow-sense heritability (h2)
Number ofOffspring
Genotyped46912141720
Figure 5. Power analysis for a varying number of offspring. The mean number of offspringgenotyped per sire, µ , was varied between 4 and 20, while the size parameter for the negativebinomial distribution was µ2/(
√µ(12.63/4.63)−µ). The number of sires was fixed at 9.
The power to reject the null hypothesis of h2 = 0 is plotted as a function of narrow-senseheritability (h2), where the true value of h2 > 0.
25