estimating uncertainty in quantitative text analysis · this is combined with a logistic model of...
TRANSCRIPT

Estimating Uncertainty in Quantitative Text Analysis∗
Will LoweMZES, University of [email protected]
Kenneth BenoitLondon School of Economics
March 30, 2011
Abstract
Several methods have now become popular in political science for scaling latent traits—usually left-right policy positions—from political texts. Following a great deal of de-velopment, application, and replication, we now have a fairly good understanding ofthe estimates produced by scaling models such as “Wordscores”, “Wordfish”, and othervariants (i.e. Monroe and Maeda’s two-dimensional estimates). Less well understood,however, are the appropriate methods for estimating uncertainty around these esti-mates, which are based on untested assumptions about the stochastic processes thatgenerate text. In this paper we address this gap in our understanding on three fronts.First, we lay out the model assumptions of scaling models and how to generate un-certainty estimates that would be appropriate if all assumptions are correct. Second,we examine a set of real texts to see where and to what extent these assumptions fail.Finally, we introduce a sequence of bootstrap methods to deal with assumption failureand demonstrate their application using a series of simulated and real political texts.
Keywords: quantitative text analysis, bootstrapping, Poisson scaling model, wordfish,wordscores, correspondence analysis
∗Paper prepared for presentation at the Annual Conference of the Midwest Political Science Association,31 March–April 3 2011, Chicago.
1

The quantitative analysis of text as data, especially when it involves scaling models to
estimate latent traits, requires strong assumptions about the stochastic distribution for
observed text frequencies conditional on some generating function. In political science,
text scaling methods are typically used to estimate unobservable characteristics treated as
latent traits—usually left-right policy positions—or latent classes—such as topics—from
political texts. Following a great deal of development, application, and replication, we
now have a fairly good understanding of the estimates produced by scaling models such as
“Wordscores”, “Wordfish”, and other variants (i.e. Monroe and Maeda’s two-dimensional
estimates). Less well understood, however, are the appropriate methods for estimating
uncertainty around these estimates, which are based on untested assumptions about the
stochastic processes that generate text. In analyzing data using statistical models when
strong parametric assumptions are doubtful, or cannot be easily derived, resampling meth-
ods such as bootstrapping are commonly used. In quantitative text analysis, however,
despite precisely being unable to make strong parametric assumptions about the data-
generating process, bootstrapping methods are almost never applied (Benoit, Laver and
Mikhaylov (2009) is an exception, although here coded units of text rather than text was
resampled.)
In this paper we explore bootstrap methods for estimating uncertainty from estimates
based on parametric text scaling models, following a detailed discussion of the stochastic
process generating observed text. We use both simulated and real political texts to demon-
strate the textual bootstrap approach, including a simple i.i.d. bootstrap applied to words,
a unit-level bootstrap applied to sentences, and a block bootstrap applied to fixed-length
word sequences.
Our paper proceeds as follows. First, we review the conceptual foundations of the
stochastic process leading to observed texts and what this means for the most commonly
observed textual unit: the (relative) word frequency. Second, we explore parametric scal-
ing models for estimating latent parameters generating observed word counts, and discuss
several methods of generating uncertainty estimates in inference about these latent pa-
rameters, including the bootstrap solutions we provide here. We then apply the different
2

methods to artificial and real-world texts, comparing the bootstrap estimates of uncertainty
to parametric and semi-parametric methods of accounting for uncertainty. Our paper con-
cludes with some recommendations for employing non-parametric bootstrap methods in
quantitative text analysis.
1 Scaling as Measurement: The conceptual foundations
of θ to data
Political scientists have analysed linguistic data at many levels, from the topic of a complete
text (e.g. Hopkins and King, 2010; Hilliard, Purpura and Wilkerson, 2006) to the balance
of topics within a text (Quinn et al., 2010; Blei, Ng and Jordan, 2003; Grimmer, 2010),
to individually topic-coded sentences (Budge, Robertson and Hearl, 1987; Pennings and
Keman, 2002), to counts of individual words (Monroe and Maeda, 2004; Laver, Benoit
and Garry, 2003a; Slapin and Proksch, 2008). In all of these cases, the primary focus lies
in inferring unobserved content, such as an an ideological position in scaling models or
a topic in other methods. In what follows, we refer to this content generically as θi, and
treat it as a latent, unobservable attribute of each political actor i. While all our arguments
should apply equally to discrete content, the extensions to topic models we leave to further
work.
We will also work with matrices of counts of words, rather than any large unit. This
involves no loss of generality because methods to deal with word count data are applicable
to counts of any other quantity. Indeed this is arguably the hardest unit to deal with
since it is the closest to the linguistic variation that, while “signal” for linguists is “noise”
relative to our interest in θ . We also do not distinguish between speeches and written
materials. Although there are good linguistic reasons to expect linguistic structures to differ
between these modes, e.g. type-token ratios are substantially larger in written language,
there is no reason to think that political content is differently expressed, except where the
institutional context motivates a different choice of θ . We also assume that θ is constant
3
within whatever unit is chosen as the text1.
For this paper then, our focus will be on models that are designed for extracting con-
tinuous unobserved positions from matrices representing the number of times each word
in a vocabulary appears in each text in a corpus.
The general framework for thinking about inferring an unobserved θ from observa-
tional data is measurement theory and its realizations in the form of item response theory
(IRT) models. In the following we trace the application of this style of modeling from its
original applications scaling student ability from tests, scaling ideological position from
voting records, to scaling policy position from word counts. This exposition clarifies the
similarities and differences between the methods and focuses attention on model assump-
tions and which might be problematic.
IRT models were designed for, and are most often applied in formal educational testing
contexts. In this setting, students are presented a set of questions in an asocial setting
where the only aim is generate as many correct answers as possible. The IRT model ap-
proach assumes that (1) questions are not chosen by the student; (2) social and strategic
context is minimal or absent; and (3) that the main determinant of each answer is student
ability, an underlying trait that cannot be directly observed. Instead, this underlying abil-
ity trait θ must be estimated using observations on item response modeled as Bernoulli
random with the dichotomous outcome of a correct answer (1) or a false answer (0). The
observed data is then an N ×V matrix Y where Yi j = 1 when the i-th of N student answers
the j-th of V questions correctly. This model generalizes readily to other contexts, and in
political science has received the widest application to the scaling of roll call votes (Jack-
man, 2001; Clinton, Jackman and Rivers, 2004), where Y represent Yeas or Nays and θ
represents an ideological position instead of an ability parameter.
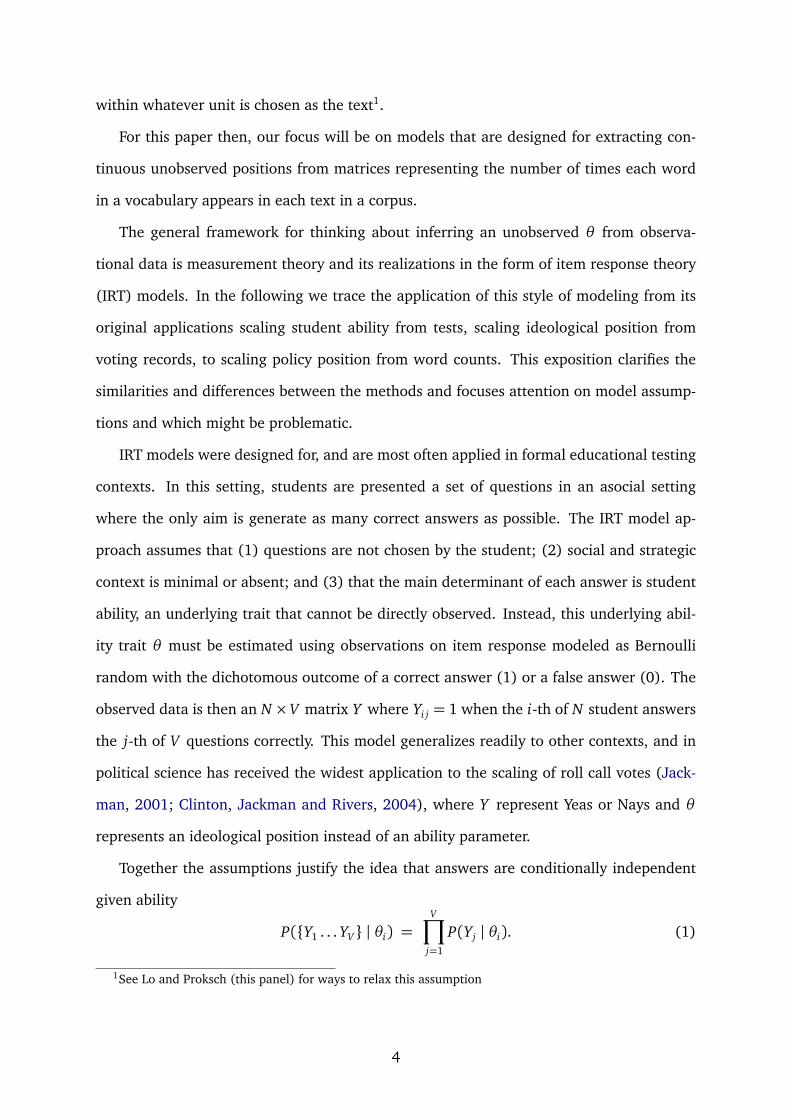
Together the assumptions justify the idea that answers are conditionally independent
given ability
P({Y1 . . . YV} | θi) =V∏
j=1
P(Yj | θi). (1)
1See Lo and Proksch (this panel) for ways to relax this assumption
4

This is combined with a logistic model of the relationship between answers and ability
logπi j
1−πi j=ψ j + θiβ j (2)
where πi j is the parameter of a Bernoulli variable. In this model, β j reflects the sensitivity
of the question the students ability and ψ j is an offset representing the baseline difficulty
of the question.2 Inference about θ is performed by estimating the model parameters and
using a factor scoring procedure to back out θ and a measure of uncertainty for each
individual via regression, factor, or maximum a posteriori techniques.
The general IRT-type scaling model generalizes easily to word counts, where θi repre-
sents an underlying ideological position found in text i, and Yi j is the number of times
the j-th word occurs in the i-th text (Monroe and Maeda, 2004; Slapin and Proksch,
2008). Word counts are still considered to be conditionally independent given θ , but
different models make different distributional assumptions. In Laver et al.’s Wordscores
model (Laver, Benoit and Garry, 2003a) and in correspondence analysis (Benzécri, 1992;
Greenacre, 2007), this means that words have a position themselves and occur most often
as the words’ positions moves closer to θ . In Slapin and Proksch’s Poisson scaling model
(“wordfish”), model word rates have an log-linear relationship to θ . In this model
logλi j =ψ∗j + θiβ
∗j +αi (3)
where λ is the mean parameter of a Poisson distribution representing the rate of generating
word type j in the i-th text3. The parameter β∗j represents the sensitivity of the word rate
to θi, and ψ∗j reflects the baseline frequency of the word when expressing ideologically
centre positions. The parameter αi is a fixed effect for each text. The remainder of our
discussion of parametric scaling approaches for text focuses on this model.
2This is not the standard parameterization in IRT texts, but is equivalent and designed to make compar-isons with text scaling models more obvious.
3Monroe and Maeda add a grand mean which simply rescales the model parameters.
5

2 Two Key Assumptions of Text Scaling Models
The Poisson text-scaling model (Eq. 3) rests on two principal statistical assumptions com-
mon to all parametric IRT-type scaling models: the conditional independence assumption
in Eq. 1, and the distributional assumption in Eq. 2. Here, as in all subsequent models,
failures in the model assumptions lead to over-certain inferences, even in the absence of
systematic bias.
2.1 Assumption: Observed text units are conditionally independent
The assumption that observed text units are conditionally independent means that condi-
tional on the model being correct, words are generated independently from one another,
without regard to structure, sequence, or the occurrence of other words. When this as-
sumption is unmet, then the information from one observed word (or question or vote
or other IRT-scaled outcome) provides less information about θ than the model assumes,
which translates into over-certainty about θi and inappropriately small standard errors.
In educational testing applications, the conditional independence and distributional
assumptions can be quite plausible, and easily fixed if violated. For example, if conditional
independence is violated by a block of questions all relating to a particular stimulus, then
changes to the distributional assumption in Eq. 2 can solve the problem (see e.g. Samejima,
1969, or methods for “testlets”).
The conditional independence and distributional assumptions have seemed more doubt-
ful, however, in the context of vote scaling. Deal making between legislators acts to couple
voting outcomes even conditional on policy position. It is also well-established that roll-call
votes do not reflect in any sense a random assignment of issues, since they could useful
depend on strategies to exploit expectations about the distribution, or particular values of
θi in the chamber (Carrubba, Gabel and Hug, 2008; Hoyland, 2010). In addition, roll-call
voting is subject to party discipline, meaning that political factors external to the model
(threat of punishment or even expulsion by party leaders) affect the link between ideolog-
ical position θi and observed votes Yi j. Finally, the outcome in voting applications is not
6

truly dichotomous: voting outcomes are in fact yea, nay, or abstention, where the latter is
typically treated as a value that is missing at random. If this is acceptable then this implies
that the total number of votes a legislator casts is uninformative about their policy posi-
tion. This seems unlikely in legislative contexts where we would expect careful choice of
abstentions to be a useful strategy4. We return to this particular assumption when turning
to scaling models for text, where it seems more reasonable.
Text models bring still more problems. Words will typically not be conditionally inde-
pendent given θ . To begin, word order matters in natural language, and words simply do
not occur without respect to the occurrence of other words. For example, the observance
of the word word “conditional” in this section of the paper, for instance, greatly increases
the probability of observing the word “independence”.
In defense of the conditional independence assumption, Laver, Benoit and Garry (2003)
point out that some single words do have strongly direction associations — the word tax
and its variants, for instance, is used almost exclusively by more right-leaning parties (who
prefer to cut taxes). However, this fails to distinguish all sorts of politically interesting
differences among taxes however such as “income taxes”, “taxes on banks”, “carbon taxes”,
“inheritance taxes”, and “capital gains taxes”. A similar argument can be made for another
right-leaning word ‘free’ which can nevertheless can, and is used for “free enterprise” and
“GMO-free”. From this perspective, it may seem remarkable that text scaling models based
purely on the relative frequencies of atomic words—what linguists call the “bag of words”
approach—work at all.5
There is also the fact that political texts in particular — but also texts generally —
tend to be written in sections on similar topics. A text unit found in one section of a
text is more likely to be from the same category as text units from the same section, as
texts are grouped into sentences, and sentences are grouped into paragraphs, contained
in sections. If θ represents topic then this is obviously not a problem but when this is
not the case the third assumption – that θ is the main determinant of word rates will be
4In the extreme case legislators from one party abstain by leaving the state.5(Zhang, 2004) has offered some interesting arguments why tight collocations like the ones above need
not compromise inferences about θ in models with strong conditional independence assumptions, althoughhe admits they will still bias uncertainty estimates downwards.
7

compromised. This affects all attempts to generate country-comparable general left-right
scores from manifestos. If the extracted θ is a weighted average of issue specific θs then
the changes in the topic distribution will compromise inferences about general left-right
positioning. Slapin and Proksch (2008) avoid this by manually isolating text on particular
policy issues and scaling them separately.
2.2 Assumption: The stochastic process of text generation is correctly
specified
Distributional assumptions also pose unique problems in text scaling models. If θ were
genuinely the only cause of word rate variation, then we might expect Poisson structured
count distributions. In natural language texts, however we do not expect conditional text
frequencies to fit the Poisson model well. In particular, we expect three varieties of problem
to occur: overdispersion, underdispersion, and zero inflation.
Overdispersion occurs when Var(Yi j) > λi j and may have many causes, some of which
are substantively interesting for political scientists and some not. Of interest is within text
variation in θ , particularly when it is caused by genuine intra-party policy disagreement.
From a statistical perspective any source of within-text variation in θ will generate over-
dispersion.
Word counts can also be under-dispersed across documents. Underdispersion occurs
when Var(Yi j) < λi j. For example, in English each sentence contains on average about
one instance of the word “the”. This regularity is very strong: In the Irish budget debate
speeches we examine in more depth later, the rate per 100 words of the word “the” is 7.28
with variance 0.75, about 10 times smaller than even a Poisson model with no covariates
would predict. Regrettably this phenomena is strongest for function words that have almost
no role in expressing ideological positions, and are in any case never a large proportion of
any vocabulary list, despite generating very high counts. Hence we cannot reasonably
expect the underestimation of θ uncertainty they could bring to offset their over dispersed
colleagues.
A pure form of zero-inflation problem appears when a word has no chance of occurring
8

in some documents, e.g. the term “European Union” prior to the 1980s for instance (when
the EU was still called the European Economic Community) or in the party manifestos if
Australia where EU policy was never a feature of the political discourse. Within a single
context, furthermore, there may be single-issue parties tending to use particular words,
word which are strongly associated with their ideological positions, but which other parties
may avoid using altogether. The result for estimation is that some words, even within a
context where they do occur in the corpus, may be completely absent from particular texts
at a rate quite different from that predicted for texts that do not avoid using them.
It is important to note, when applying such terms as “under-” and “over-dispersion”
and “zero inflation”, that these are descriptive terms that can only roughly reflect the root
causes of non-Poisson variance structure. As an extreme example, it has long been known
that the Negative Binomial distribution can be motivated as an over-dispersed alternative
for the Poisson in cases where there is real dependency between nearby Y – called ‘true
contagion’ in the biostatistics literature, when there is no true contagion but there is vari-
ation in the value of θ within units that follows a Gamma distribution, and when there
is ‘apparent contagion’ due to serial correlation in values of θ (see Cameron and Trivedi,
1998, p.106 for a review).
In text scaling applications we can immediately identify ‘true contagion’ as what com-
putational linguists call “burstiness”. First described by Church and Gale (1995), burstiness
refers to the fact that once a word has occurred, it is significantly more likely to re-occur
— implying that variation in word counts is much less informative about θ than the Pois-
son model assumes. Indeed, burstiness has prompted some authors give up on using word
counts altogether in favor of recording presence of absence of word (Wilbur and Kim, 2009,
e.g.). This approach loses information (though perhaps not very much) and leads fairly di-
rectly back to Eq. 2. Burstiness also shows up in the form of excess zeros relative to the
Poisson assumption.
To conclude, the problems with conditional independence point to a fundamental ob-
servation about applying measurement models to the text scaling task: We have very little
9

idea what the functional form of the relationship between Y and θ is.6 Even less, perhaps,
than for voting in legislatures. The best we can do is identify the model assumptions that
fail, and find ways to correct them. We turn now to this task.
3 Accounting for Uncertainty in Text Scaling
The starting point for all our subsequent suggestions about uncertainty accounting in text
scaling models is the standard errors that would be appropriate if all model assumption
held. Slapin and Proksch (2008) do not offer standard errors for their model, suggesting
parametric bootstrapping instead. This makes the model considerably more time consum-
ing to fit while, as we shall see later, still depending fundamentally on the correctness of
the model assumptions. In this section we digress slightly to show how to get standard
errors for the Wordfish model easily.
As a model fitted by by (penalized) maximum likelihood it is natural to want to compute
and invert the information matrix for all fitted parameters. However, with a reasonable
number of documents the word parameters β∗ and ψ∗ are quite accurately estimated so
we may fix these at their ML estimates and consider the profile likelihood of θ . However
there is still the question of α. A direct IRT approach would not require an offset like α, so
what is it for?
If the length of a text Ni is not informative about θ then we can condition on it. If more-
over the elements in the word count vector representing text i are Poisson distributed, as
they are in Wordfish by assumption, then the distribution of counts given Ni is multinomial.
A product multinomial formulation does offer a reasonable substantive story about text
generation: many legislative speeches are time limited by various institutional mechanisms
which are reasonably modeled by constraints on Ni and these institutional constraints in-
dependent of the position being expressed within their bounds.7 From an IRT perspec-
tive it might seem more natural to model the text generating process from the start as
6If we did have a plausible generative model of generating text from policy positions, then we would infact have solved most of the problems of linguistics and a large portion of artificial intelligence.
7Note that this is is true at the constitutional level but not in the case where parties themselves determinewho gets to speak.
10

multinomial, but this will necessarily correlate (negatively) counts of different words and
complicate the estimation.
In fact α is part of the multinomial-Poisson (MP) transformation, first formulated in a
general fashion by Baker (1994) that connects Poisson and multinomial regression mod-
els. According to the MP each multinomial regression model has an equivalent log linear
formulation with an extra set of parameters, here called α, corresponding to each case that
mimic explicit conditioning on Ni. It is well known that the multinomial likelihood is sepa-
rable into a part modeling the Ni and a part modeling the conditional distribution of words
(Agresti, 2002). The MP transformation simply puts parameters on both parts. The equiva-
lent log-linear style model is then much easier to fit than the original multinomial because
each set of word parameters can then be fitted in separate Poisson regression-structured
maximizations.
The general maximization strategy of alternating Poisson regressions (with offsets) is
noted in Monroe and Maeda (2004) and taken for an Expectation Maximisation algorithm
in Slapin and Proksch (2008)8. What these authors do not explore is the equivalent multi-
nomial choice model that is implicitly also being fitted this way. What is this model?
If the multinomial logistic regression of word counts given document positions uses the
count of word 1 as a reference category then the original scaling formulation and the MP-
transformed multinomial parameter sets are related as
ψ j =ψ∗j −ψ
∗1
β j = β∗j − β
∗1
in a multinomial model with log-linear contrast as in Eq. 2. Because only word count
contrasts are being computed in the multinomial logistic formulation the α parameters
(and any grand mean parameters) will cancel out.
There are three advantages to thinking about scaling models this way: First the MP
transformation clarifies what α is – a free parameter designed to substitute for explicit
8It cannot be an EM algorithm because there is no random variable whose expectation could be taken.The model contains only fixed effects.
11

conditioning on Ni and speed up fitting. Substantively speaking, the real model is a multi-
nomial choice model and the Poisson formulation is simply a means to this end.
Second, since we know that α parameters are designed to capture the marginal totals
Ni it is straightforward to derive their (profile) maximum likelihood values in closed form.
Capturing these totals requires that
V∑
j=1
exp(ψ∗j + β∗j θi +αi) = Ni
For fixed values of all other parameters therefore
αi = − logV∑
j=1
exp(ψ∗j + β∗j θi) + log Ni
will exactly fulfill the constraint. The first term on the right hand side ensures the ele-
ments sum to 1 and the second inflates the total up to Ni. For identification in the main
maximisation (since everything on the right hand side is unobserved) α1 can be set to 0.
Aside from speeding the model fitting procedure the the MP transform has a third
advantage: easy asymptotic standard errors. Palmgren (1981) proved that the Fisher in-
formation for both sides of the MP transformation is the same. We therefore switch to
the multinomial formulation so as not to have to deal with α nuisance parameters and
compute the information there. Taking the word parameters as known, and noting that
the problem can be solved for each text separately, we then compute the square root of
one over the negative second derivative of the data Likelihood with respect to θ to get a
measure of estimation uncertainty9. Standard errors derived this way tend, empirically, to
be very slightly larger than the standard errors provided by a parametric bootstrap accord-
ing to the procedure recommended by Slapin and Proksch, but effectively instantaneous
to compute. If accounting for word parameter uncertainty is of interest, a CLARIFY proce-
dure can be used where word parameters are sampled from the Normal approximations to
their sampling distributions and the θ point and uncertainty estimates are averaged across
draws.9These are implemented by finite differencing in the R package Austin
12

4 Relaxing Model Assumptions Using the Bootstrap
Now that standard errors that assume the correctness of the model assumptions are in
hand, we can investigate ways to address departures from these assumptions and compare
the results. There are, as always, two directions to take when relaxing model assumptions.
We can find a way to represent departures within the model itself, effectively making a
more complex model, or we can find a way to make fewer assumptions in the model and
attempt to deal with divergences within the estimation method. Bayesian approaches such
as that taken by Monroe and Maeda are an example of the former, more detailed modeling
approach. For this paper we pursue some examples of the latter approach based around
the bootstrap (Efron and Tibshirani, 1994; Davison and Hinkley, 1997).
Simple bootstrapping involves resampling cases or residuals with replacement from the
original data, refitting the model on each resampled data set and summarizing the quantity
of interest. Here the quantity of interest is θ and the cases are texts. Bootstrapping works
in general because the empirical distribution function computed from a single sample is
informative about the population distribution function from which we imagine that sample
was drawn.
When the population distribution function is known or can be assumed, and when it
is a familiar algebraic form, then we can account for uncertainty using analytic methods.
In these cases bootstrapping is mostly unnecessary, except as a check on the assumptions,
or in some cases as a way to adjust asymptotic uncertainty estimates to deal with small
numbers of cases.
In simple models, cases are assumed to be independent so resampling cases gives a
good view of the distribution function. When cases are not independent, we need find a
suitable i.i.d. quantity to resample. A simple example is a linear regression model. The
dependent variable is only independent conditional on some covariates, so it is only the
residuals that are identically and independently distributed. Consequently we resample
them instead. The minimal requirement then is to resample on quantities whose func-
tional dependencies have been effectively removed. Bootstrap methods are typically more
accurate if pivotal or asymptotically pivotal quantities are used and there is a considerable
13

literature discussing variations on these themes (see Davison and Hinkley, 1997, for a re-
view). Here we eschew this level of sophistication, focusing attention instead on correctly
identifying the (re)sampling unit.
In the following we will assume that the mean word rate λ is correctly modeled as log-
linear function of θ and some word parameters. However, we will not, except in the section
on parametric bootstrapping, assume that the conditional variance is correctly specified.
The sections below deal with the concerns about dispersion and auto-correlation discussed
above.
4.1 Parametric Bootstrap Standard Errors
To estimate uncertainty about θ in the Poisson scaling model, Slapin and Proksch (2008)
suggest a parametric bootstrap. This variety of bootstrap does not resample the texts di-
rectly (or even residuals) but rather draws samples from the fitted model and uses the
count matrix thus derived as resampled data to refit the model. In each refitting the θ
estimates are saved. The final point estimate and uncertainty is constructed from the set of
refitted values, for example using the mean as the point estimate and the standard devia-
tion as a standard error. Alternatively, percentiles can be computed to provide confidence
intervals that do not assume normality.
Whatever the precise method, these samples clearly reflect all the model’s assumptions.
In particular, they will by construction be equidispersed, non-autocorrelated and reflect the
relevant conditional independence assumptions. Parametric bootstrapping should there-
fore recover the asymptotic standard errors for θ whose computation was discussed —
something clearly shown below in Figure 1. Thus, while very easy to implement, a para-
metric bootstrap approach is no use for relaxing model assumptions to better reflect what
we think is going on with real political text.
4.2 Non-parametric Bootstrap Standard Errors
A tempting step away from the parametric bootstrap is to make less restrictive assumptions
about the distribution from which counts are drawn. The weakest such assumption is
14

that each text is a multinomial with probabilities given by its normalized word counts.
Bootstrapping this way, however, may remove too much information, leading to overly
wide confidence intervals for θ .
If we had constructed and sampled from the multinomial formulation of the wordfish
model we would have returned to the parametric bootstrap approach. Here we resample
from the raw data but without allowing any relationship to θ to be part of the sampling
procedure. Worse, while removing the dependency on θ we have enforced the dispersion
to structure to reflect the Poisson assumptions that we doubted above. Word-level boot-
strapping, in other words, loosens the distributional assumptions that are untested in real
text, but does nothing directly against violations of conditional independence. A supe-
rior procedure would be a non-parametric bootstrapping approach that did both: a block
bootstrap method.
4.3 Block Bootstrap Standard Errors
To motivate block bootstrapping, our preferred option, we start by noting that text is fun-
damentally multivariate time series count data with multiple unknown dependencies even
after we have conditioned on θ . Using the bootstrap for any kind of time series data is not
common outside econometrics and the the theory is still begin developed – Lahiri (2010)
seems to be the first book-length review.
Existing bootstrap approaches to time series take one of two directions. In the first, a
parametric time series model is estimated and its residuals are resampled as in the non-
time series context (see Davison and Hinkley, 1997, ch. 8 for a discussion). A variant of
this approach that would seem better suited to textual data is based on estimating and
then making use of the Markov transition matrix of the series (Horowitz, 2003). Here the
state space of the chain is the V -length indicator matrix indicating which word is spoken
or written and the transition matrix is the conditional probability of any other word in the
vocabulary. In the Markov chain framework temporal dependencies are reflected by the
number of transitions necessary to return the conditional probabilities to their marginal
values and this information can be used during bootstrapping. Unfortunately, estimating
15

such a transition matrix is computationally prohibitive, and only addresses temporal de-
pendency issues and not the full range of concerns discussed above.
In the second bootstrap approach to times series data, the cases are resampled directly
but in a way that encapsulates their temporal dependency structure. This leads to the block
bootstrap methods. In block bootstrap, consecutive blocks of observations of length K are
resampled from the original time series, either in fixed blocks (Carlstein, 1986) or over-
lapping blocks (Künsch, 1989). These methods assume that the time series is stationary,
which is reasonable for our applications since we are thinking of texts as being segments
of discourse about θ which can be generated at arbitrary length given time or institutional
constraints. Politis and Romano (1994) suggest K be drawn from a geometric distribu-
tion for the resulting bootstrap samples to maintain stationarity. However, reviewing the
choices among block bootstrapping procedures
Lahiri (1999) shows that K is effectively a smoothing parameter that can will, depend-
ing on its value, increase the bias or variance components of an estimator’s mean square
error. Specifically, as K increases bias decreases and variance increases. However, for fixed
block length the asymptotic bias of fixed blocks or overlapping blocks estimators is the
same but the variance is asymptotically higher for fixed blocks, and substantially higher
for randomized K . Although we typically will not know K this is nevertheless a reason to
choose overlapping blocks of fixed size.
In theory there is, for any block bootstrap approach and data set, an optimal K that
fully encapsulates the temporal dependencies, although all values do better than non-
resampling estimation methods that do not model the relevant dependencies. In practice
we find that results are very similar within a wide range of K values. This is important
because we have very little idea what dependencies we are up against in text and would
find it hard to justify particular values of K on substantive grounds.
Practically speaking, we block bootstrap a document containing N words by first sam-
pling dN/Ke starting points from the document’s word offsets with replacement, extracting
K consecutive words from each start point, and constructing a bootstrap document by past-
ing the sequences together to match the length of the original text. The (relatively rare)
16

sequences that run over past the end of the document are wrapped to the beginning, a
choice that appears not to make any difference to our results.
For comparison, we implement a sentence-level bootstrap that resamples only sen-
tences. We choose sentences because they are a natural unit of linguistic dependency
that is also easily identified in most most languages. Clearly this is equivalent to allowing
K to vary (although sentence lengths are more log-normal than Gamma in our samples)
but we hope that they capture better the linguistic dependencies.
5 Uncertainty Estimation Using Simulated Texts
One of the chief problems involved in estimating latent traits from text scaling models
concerns the basic fact that we have no benchmark of “truth” with which to compare
estimated parameters, coupled with the fact that these parameters — and their standard
errors — are heavily model-dependent. In an attempt to get around this problem, in this
section we generate some artificial texts and attempt to recover the parameter values using
different methods for estimating uncertainty.
5.1 Simulated texts that conform to the Poisson model
Our first set of tests applied the Poisson scaling model to data generated from this model,
to attempt to recover the θi parameters. We simulated a set of textual frequencies that con-
formed to the Poisson scaling model for with 10 documents, using a 100-word vocabulary,
and document lengths of (approximately) 1000 words. We then estimated the θi latent po-
sitions and estimated the uncertainty of these positions using three methods: analytically
computed standard errors, the parametric bootstrapped standard errors used by Slapin and
Proksch (2008), and a simple (i.i.d.) non-parametric bootstrap from resampling the word
frequencies of the texts themselves.
*** FIGURE 1 ABOUT HERE ***
The results from the Poisson-conformant data can be seen in Figure 2. The top panel
17

compares the analytically computed standard errors for θi (in black) to the standard errors
from the parametric bootstrap (in blue). The brown dots indicate the true θi from which
the data were generated. As can be easily seen from a comparison of the intervals, there is
virtually no difference between the two methods of computing uncertainty — except that
the analytical method is vastly more efficient computationally.
The bottom panel of Figure 1 shows the results from the non-parametric bootstrap,
using word-level resampling with 100 replicates. The results are also virtually identical
to those from the analytical and parametric bootstrapping procedures, in terms of both
the point estimates and the width of the intervals. The conclusion is clear: when the
distributional and conditional independence assumptions of the estimation model are fully
met, then all three methods of estimating uncertainty — analytical errors, parametric boot-
strapping, and non-parametric bootstrapping — yield identical intervals and accurate point
estimates.
5.2 Simulated texts with non-Poisson noise
That the estimated parameters from the Poisson model fit the Poisson-generated text so
well is not surprising, since the word frequencies behave perfectly according to the model
assumptions. In practice, however, for the many reasons we have outlined above, it is very
unlikely that natural language text will fit such model assumptions. Instead, observed word
frequencies will have additional noise that cannot be described by the Poisson distribution’s
characterization of word rate variance being equal to its conditional mean. A closely re-
lated distribution is the negative binomial distribution, which adds an additional variance
parameter δ j to allow count data to be over- or under-dispersed. To simulate this effect, we
generated artificial data from this distribution, using the parameterization from Venables
and Ripley (2002, 206) wherein Var(Yi j) = λi j +λ2
i j
δ j, with δ j measuring overdispersion.10
*** FIGURE 2 ABOUT HERE ***
The results can be seen in Figure 2. Clearly, when the model assumptions no longer
10This is what Cameron and Trivedi (2005, 670) parameterize as α where α= 1/δ. We use δ instead of θsince the latter is already used for a different parameter in the Poisson text scaling model!
18
fit because of added noise, no method accurately recovers θi, although the non-parametric
bootstrapping standard errors are significantly larger, especially for the severely overdis-
persed case. The poorer fit of the Poisson scaling model causes the non-parametric boot-
strapped standard errors to be larger, although in 4 of the 10 cases (in the severely overdis-
persed case) the intervals still do not contain the true θi values — although this compares
to none of the analytically computed standard errors. In the mildly overdispersed case,
only three of the bootstrapped confidence intervals contained the true θi, compared with
zero for the analytical method. The non-parametric bootstrap is superior to more model-
dependent parametric methods, but still unsatisfactory when the model assumptions are
badly violated.
6 Non-parametric bootstrap applied to real texts
Just how badly the assumptions of the Poisson scaling model are violated in natural lan-
guage texts is unknown. As a first means of assessing this problem, we fit the model to two
sets of political texts that have been analyzed in previous work, comparing the θi and the
seθi from the analytical model to different types of non-parametric block bootstrapping.
6.1 Irish Budget Debate of 2009
The first example comes from a set of legislative speeches for and against the Irish budget
of 2009, made in December 2009 in the Irish Daíl, the lower house of the Irish parliament.
Before 2010 at least, this budget was widely acknowledged to be the harshest budget in
Irish history. Consisting of 14 speeches by party leaders, the speeches urged either adoption
of the harsh fiscal measures or rejection of the budget and the government behind it. On the
government side, speeches by the Taoiseach Brian Cowan of the governing Fianna Fáil party,
and Finance Minister Brian Lenihan of the same party, represented the most pro-budget
positions. Three speeches from Green party ministers (Gormley, Cuffe, and Ryan) provided
support for the budget but somewhat more reluctantly, as many in the party regretted the
austerity measures but the party leadership was bound to support the budget by the terms
19

of the coalition agreement. On the opposition side, the leaders of the Fine Gael and Labour
parties shows the greatest opposition to the budget. In all, the budget debates provide
a good example of text expressing positions that plausibly reflects a single dimension of
relative preference for fiscal austerity versus social protection, and also directly relates to
the approval or rejection of specific legislation.
*** FIGURE 3 ABOUT HERE ***
Figure 3 provides estimates of the positions of each speaker, using the analytical stan-
dard errors and point estimates (in black), which in our tests (not shown) were also iden-
tical to the parametric bootstrapped error estimates. Our focus here is on comparing the
non-parametric bootstrap to these analytic estimates. The three panels show the word-,
sentence-, and random block-level bootstrap methods.
One result immediately apparent is the robustness of the three approaches in terms of
the relative placement of the speakers, although this is to be expected given that each re-
sampled is estimated using this model. Another noticeable result is that the error estimates
from non-parametric bootstrapping are far wider than those from the analytic errors: up
to 6 times wider in some cases. From a substantive standpoint, the edges of the intervals
(for the word-level bootstrap especially) almost perfectly divide the government coalition
parties (Fianna Fáil and the Greens) from the opposition parties. From these results, given
these short speeches, the non-parametric model suggests a division at 0 of opposition and
government positions, but far less ability to distinguish additional differences within each
side from sampling error. The width of the non-parametric intervals in all three appli-
cations suggests that the more model-dependent analytical (and parametric bootstrapped
results, which are identical) are far too small, suggesting far more certainty even in these
relatively short texts than is warranted.
The widest intervals are produced by the sentence-level bootstrap, produced here by
resampling texts sentence-by-sentence, before converting these into word frequency matri-
ces. The zero-position line still divides government and opposition in the debate, but Ea-
mon Ryan (then Minister for Communications, Energy and Natural Resources) produced
20

a speech that might have been net opposed to the budget.11 The same result occurs for
the two Sinn Féin deputies, who were not only strongly opposed to the government but
also to the solutions debated overall by the mainstream parties (including Fine Gael and
Labour in mainstream opposition). From the non-parametric bootstrap results, the Sinn
Féin positions have the widest uncertainty and stray into the pro-budget positions, a result
that seems to indicate ambiguity with respect to the main government-opposition divide.
(It also suggests a second possible dimension to the budget debate not captured here in the
one-dimensional scaling result.)
In our implementation of the 50-word and 20-word length block bootstrap (the lat-
ter, while not shown, produced results indistinguishable from those in Figure 3), there
were few noticeable differences between the word-level and random-block bootstrap meth-
ods, probably because the random starting points and overlapping blocks produced results
not too different from simple word-level resamples, although producing slightly wider un-
certainty estimates. The real difference was seen in the sentence-level bootstrap results,
which produced much wider intervals in most cases than the other methods. Linguistically,
there are strong reasons to prefer the sentence-level bootstrap over the other methods,
because word dependencies tend to occur mainly at the sentence-level, and because sen-
tences provide a naturally occurring (variable) block within which alternative texts could
be reconstructed with the greatest theoretical justification. While we intend to investigate
this more thoroughly, we recommend sentence-level resampling as the best method for
non-parametric block bootstrapping of natural language texts.
6.2 Economic sections of German party manifestos
For the second example of real texts, we replicated Slapin and Proksch (2008)’s analysis of
economic positions using the economic segments from 25 German party manifestos. These
results are shown in Figure 4.
11In his speech, Ryan urged protection from many of the austerity measures, although he did not specifyhow this would take place: “One of the egalitarian questions raised in this budget was whether to cut services.That was a prospect to which I say no. It is better for us to manage our affairs here, taking some of the harddecisions on pay and social welfare to protect the services that are integral to an equal society. . . I am notsure that the IMF would make a similar call.”
21

*** FIGURE 4 ABOUT HERE ***
As a matter of fact, the results shown in Figure 4 are not exactly what we wished to
show — what we aimed to produce were results similar to those in Figure 3. However we
have been having difficult reproducing even the basic “Wordfish” estimates when working
from word frequency matrices that we created from the original texts,12 rather than the
already-compiled word frequency matrices supplied with Slapin and Proksch (2008).
What the existing Figure 4 does show is further confirmation — as with our simulated
texts — that the analytical method of computing standard errors is identical to those from
the parametric bootstrap, even for natural language texts (and in this case, in German).
The bottom panel also shows that the non-parametric word-level bootstrap (for which we
did not require the original texts) produces wider uncertainty estimates than the para-
metric methods. In both cases, similar to the Irish budget debate results, we see a clean
division between opposition and government parties, which during the period examined
tended to consist of the CDU/CSU-FDP pair alternating with the SPD-Green alliance.
7 Extension to non-parametric scaling models
The maximum-likelihood solution to the Poisson scaling model (equation 3) can be very
computationally demanding to estimate, a demand that is compounded when bootstrap-
ping (parametrically or not) standard errors from the model. A very general alternative
exists in the form of a non-parametric technique known as correspondence analysis, first
introduced by Benzécri (1973), and described in detail by Greenacre (2007). Correspon-
dence analysis is a descriptive method for analyzing contingency tables that is equivalent
to principal components analysis but for categorical data. Because its computation is based
on singular value decomposition rather than any iterative or numerical procedures, it can
be applied very efficiently to even very large word frequency matrices to score documents
on one or more latent dimensions.13
12We thank Oli Proksch for sending us these texts.13Our results here score document positions in one dimension, although several popular software packages,
such as Alceste, provide two-dimensional representations by default.
22

As a method of estimating uncertainty, we use the i.i.d. word-level non-parametric boot-
strap. While bootstrapping methods are considered problematic for data-reduction tech-
niques driven by singular value decomposition (see Milan and Whittaker, 1995), the appli-
cation of bootstrapping to correspondence analysis has been demonstrated by Greenacre
(2007), who suggests “peeling” the outer 5% of the convex hull of replicates, a procedure
that removes the most influential points to produce an approximate 95% confidence inter-
val.14 Our procedure estimates 100 replicates of the document scores (approximating θi)
and plots the 95% empirical confidence intervals along with point estimates from the mean
of the replicates.
*** FIGURE 5 ABOUT HERE ***
In Figure 5, we apply word-bootstrapped one-dimensional correspondence analysis to
the same set of simulated texts used in Figure 1. The results look almost indistinguishable
from the much more time-consuming parametric model estimates. The Poisson-generated
results are almost perfectly recovered, with intervals extremely similar to the analytically
computed intervals from the parametric model. The mild overdispersion intervals contain
the true values in 3 of 10 cases, compared to 6 of 10 for the severely overdispersed case
(slightly better, even, than the word-bootstrapped parametric scaling approach). Not only
did the correspondence analysis estimates perform as well or better than the Poisson scaling
model, but also took a fraction of the time to estimate and to bootstrap — a matter of
seconds rather than hours.
*** FIGURE 6 ABOUT HERE ***
In figure 6, we have applied one-dimensional correspondence analysis to scale the doc-
ument positions from the Irish and German political text examples. The dividing line of
zero still demarcates government and opposition in both debates, with only minor differ-
14Another key problem with bootstrapping different data (re)samples with correspondence analysis con-cerns rotation and inversion, although problems with rotation are mitigated in our estimates by using aone-dimensional approach. We eliminate the problem of inversion by anchoring all scaled estimates to anorientation determined in advance by specifying the ordering a pair of texts whose relative positions are“known” to be different.
23

ences that are almost always explained by the confidence intervals. The intervals are much
wider for the German economic manifestos, whose parametrically computed confidence
intervals suggest an extremely low amount of uncertainty compared to the bootstrapped
CA estimates.
While here we do not take the non-parametric bootstrapping of non-parametric scal-
ing further, we have demonstrated how the very general technique of text-level, non-
parametric bootstrapping can be used with almost any text-based scaling model, including
models that have no parametric models for error computation, such as correspondence
analysis. This includes the Laver, Benoit and Garry (2003b) method of “wordscores”, as
Lowe (2008) showed that this method is directly related to one-dimensional correspon-
dence analysis. While we have applied only word-level bootstrapping here, there is no
reason why correspondence analysis could not also be used with the sentence-level boot-
strap. And because it involves no iterative, numerical estimation, correspondence analysis
produces extremely fast results, even when repeating the estimation on hundreds or even
thousands of bootstrapped resamples.
8 Recommendations
Our investigation of uncertainty in text scaling models suggests the following conclusions.
First, all scaling results are heavily dependent on the data-generation process and on the
assumption of conditional independence, even non-parametric scaling methods. When ir-
regular data generation is introduced in artificial texts by increasing the variance relative to
the expected word rate, point estimates from every procedure are badly affected. We can-
not offer a solution for this problem here, but wish to underscore the importance of scaling
models whose assumptions reflect the data-generating process as accurately as possible.
This includes both correctly accounting for the inter-dependencies and serial processes
generating text units, as well as correctly modeling the stochastic processes that generates
observed text units even when conditional independence can be assumed.
Next, all of our results from non-parametric bootstrapping methods of estimating un-
24

certainty in textual positions suggest that standard errors from analytical and parametric
bootstrap procedures are far too small, grossly underestimating the uncertainty present in
underlying positions estimated from text scaling. In some applications, parametric esti-
mates were smaller by a factor of five or six. Substantively, the overly small parametric-
based intervals suggest very different interpretations of textual similarities and differences
on the dimensions of underlying traits (such as left-right or pro- versus anti-budget).
Finally, while a firmer recommendation will require more investigation, we tentatively
embrace the sentence-level bootstrap as the most realistic and linguistically justified method
for estimating uncertainty in text scaling applications. The sentence the naturally occurring
variable-length block that is most likely to contain the word-level interdependencies that
violate model assumptions regarding conditional independence. The non-parametric boot-
strap is most likely to reflect this uncertainty by recreating the sampling distribution from
observed texts, in the absence of clear, tenable assumptions about the stochastic processes
generating natural language texts — assumptions that simply do not hold in the manner
stipulated by the simple Poisson scaling model.
Our study points to two promising areas for additional work. First, we suggest broad-
ening the tests on block-level bootstrapping, especially sentences, in the face of specific
problems such as serial correlation, word clustering (“burstiness”), and zero-inflation that
could be created in simulated data. We are currently working on simulation methods as
well as diagnostic tests to create, diagnose, and attempt to solve problems of this sort.
Our results also suggest that promising results may be achieved by metric scaling mod-
els such as correspondence analysis that do not require a generative, parametric model
of the word-generation process. Our demonstration of non-parametric bootstrapping to
one-dimensional correspondence analysis suggests that it offers a cheap, robust, and valid
alternative to much more computationally intensive scaling methods, warranting more de-
tailed research and development.
25

References
Agresti, A. 2002. Categorical Data Analysis. 2 ed. New York: Wiley-Interscience.
Baker, A. G. 1994. “The multinomial-Poisson transformation.” Journal of the Royal Statisti-cal Society. Series D (The Statistician) 43(4):495–504.
Benoit, Kenneth, Michael Laver and Slava Mikhaylov. 2009. “Treating Words as Data withError: Uncertainty in Text Statements of Policy Positions.” American Journal of PoliticalScience 53(2, April):495–513.
Benzécri, J.-P. 1973. Analyse des Données. Tôme 2: L’Analyse des Correspondances. Paris:Dunod.
Benzécri, J.-P. 1992. Correspondence Analysis Handbook. New York, NY: Marcel Dekker.
Blei, D.M., A.Y. Ng and M.I. Jordan. 2003. “Latent dirichlet allocation.” The Journal ofMachine Learning Research 3:993–1022.
Budge, I., D. Robertson and D. Hearl, eds. 1987. Ideology, Strategy and Party Change: Spa-tial Analyses of Post-War Election Programmes in 19 Democracies. Cambridge UniversityPress.
Cameron, A. Colin and Pravin K. Trivedi. 1998. Regression Analysis of Count Data. Cam-bridge University Press.
Cameron, Adrian Colin and P. K. Trivedi. 2005. Microeconometrics: Methods and Applica-tions. New York: Cambridge University Press.
Carlstein, E. 1986. “The use of subseries methods for estimating the variance of a generalstatistic from a stationary time series.” Annals of Statistics 14:1171–1179.
Carrubba, Clifford, Matthew Gabel and Simon Hug. 2008. “Legislative Voting Behavior,Seen and Unseen: A Theory of Roll-Call Vote Selection.” Legislative Studies Quarterly33(4):543–572.URL: http://dx.doi.org/10.3162/036298008786403079
Church, K. and W. Gale. 1995. “Poisson mixtures.” Natural Language Engineering 1(2):163–190.
Clinton, J., S. Jackman and D. Rivers. 2004. “The statistical analysis of roll call voting: Aunified approach.” American Journal of Political Science 98(2):355–370.
Davison, A. C. and D. V. Hinkley. 1997. Bootstrap Methods and Their Application. CambridgeUniversity Press.
Efron, Bradley and Robert Tibshirani. 1994. An Introduction to the Bootstrap. New York:Chapman and Hall/CRC Hall.
Greenacre, Micahel. 2007. Correspondence Analysis in Practice. 2nd ed. Chapman and Hall.
Grimmer, Justin. 2010. “A Bayesian Hierarchical Topic Model for Political Texts: MeasuringExpressed Agendas in Senate Press Releases.” Political Analysis 18(1):1–35.
26

Hilliard, D., S. J. Purpura and S. Wilkerson. 2006. “Computer Assisted Topic Classifica-tion for Mixed Methods Social Science Research.” Journal of Information Technology andPolitics 4(4).
Hopkins, Daniel and Gary King. 2010. “A Method of Automated Nonparametric ContentAnalysis for Social Science.” American Journal of Political Science 54:229–247.
Horowitz, J. L. 2003. “Bootstrap methods for Markov processes.” Econometrica71(4):1049–1082.
Hoyland, Bjorn. 2010. “Procedural and party effects in European Parliament roll-callvotes.” European Union Politics 11(4):597–613.URL: http://eup.sagepub.com/content/11/4/597.abstract
Jackman, S. 2001. “Multidimensional analysis of roll call data via Bayesian simulation:Identification, estimation, inference and model checking.” Political Analysis 9(3):227–241.
Künsch, H. R. 1989. “The jackknife and the bootstrap for general stationary observations.”Annals of Statistics 17:1217–1241.
Lahiri, S. N. 1999. “Theoretical comparisons of block bootstrap methods.” Annals of Statis-tics 27(1):386–404.
Lahiri, S. N. 2010. Resampling Methods for Dependent Data. New York: Springer.
Laver, M., K. Benoit and J. Garry. 2003a. “Extracting policy positions from political textsusing words as data.” American Political Science Review 97(2, May):311–331.
Laver, Michael, Kenneth Benoit and John Garry. 2003b. “Estimating the policy positions ofpolitical actors using words as data.” American Political Science Review 97(2):311–331.
Lowe, W. 2008. “Understanding Wordscores.” Political Analysis 16(4).
Milan, Luis and Joe Whittaker. 1995. “Application of the Parametric Bootstrap to Modelsthat Incorporate a Singular Value Decomposition.” Journal of the Royal Statistical Society.Series C (Applied Statistics) 44(1):31–49.
Monroe, B. and K. Maeda. 2004. “Talk’s Cheap: Text-Based Estimation of Rhetorical Ideal-Points.” POLMETH Working Paper.
Palmgren, J. 1981. “The Fisher information matrix for log linear models arguing condition-ally on observed explanatory variables.” Biometrika 68(2):563–566.
Pennings, P. and H. Keman. 2002. “Towards a new methodology of estimating party policypositions.” Quality and Quantity 36(1):55–79.
Politis, D. N. and J. P. Romano. 1994. “The stationary bootstrap.” Journal of the AmericanStatistical Association 89(428):1303–1313.
Quinn, K. M., B. L. Monroe, M. Colaresi, M. Crespin and D. R. Radev. 2010. “How ToAnalyze Political Attention With Minimal Assumptions And Costs.” American Journal ofPolitical Science 54(1):209–228.
27

Samejima, F. 1969. “Estimation of latent ability using a pattern of graded scores.” Psy-chometrika 34:100–114.
Slapin, J. B. and S.-O. Proksch. 2008. “A scaling model for estimating time-series partypositions from texts.” American Journal of Political Science 52(3):705–722.
Venables, W.N. and B.D. Ripley. 2002. Modern Applied Statistics with S. Springer, New York.
Wilbur, W. and Won Kim. 2009. “The ineffectiveness of within-document term frequencyin text classification.” Information Retrieval 12:509–525. 10.1007/s10791-008-9069-5.URL: http://dx.doi.org/10.1007/s10791-008-9069-5
Zhang, H. 2004. The Optimality of Naïve Bayes. In FLAIRS Conference, ed. V. Barr and Z.Markov. AAAI Press.
28

D01
D02
D03
D04
D05
D06
D07
D08
D09
D10
●
●
●
●
●
●
●
●
●
●
−1.5 −1.0 −0.5 0.0 0.5 1.0 1.5
(a) Parametric bootstrap in blue
●
●
●
●
●
●
●
●
●
●
D01
D02
D03
D04
D05
D06
D07
D08
D09
D10
●
●
●
●
●
●
●
●
●
●
−1.5 −1.0 −0.5 0.0 0.5 1.0 1.5
(b) Non−parametric (iid) bootstrap in blue
●
●
●
●
●
●
●
●
●
●
Figure 1: Point estimates of θi and 95% confidence intervals in Poisson-simulated texts. Browndots represent the true θi from which the texts were generated; black lines are fromanalytical point estimates and standard errors; blue points and lines are non-parametricbootstrapped point estimates and confidence intervals. Texts were generated according tothe Poisson generative model, with 10 documents, a 100-word vocabulary, and documentlengths of (approximately) 1000 words.
29

D01
D02
D03
D04
D05
D06
D07
D08
D09
D10
●
●
●
●
●
●
●
●
●
●
−2 −1 0 1
(a) Mild overdispersion model, 1/δ=0.8
●
●
●
●
●
●
●
●
●
●
D01
D02
D03
D04
D05
D06
D07
D08
D09
D10
●
●
●
●
●
●
●
●
●
●
−2 −1 0 1
(b) Severe overdispersion model, 1/δ=2.0
●
●
●
●
●
●
●
●
●
●
Figure 2: Point estimates of θi and 95% confidence intervals in non-Poisson simulated texts.Brown dots represent the true θi from which the texts were generated; black lines are fromanalytical point estimates and standard errors; blue points and lines are non-parametricbootstrapped point estimates and confidence intervals. Texts were generated accordingto a negative binomial distributions, conditional on the Poisson scaling model, with 10documents, a 100-word vocabulary, and document lengths of (approximately) 1000 words.The two negative binomial distributions were simulated with δ j = 0.5 and δ j = 1.25∀ j.
30

Burton Lab
Higgins Lab
Quinn Lab
Kenny FG
Gilmore Lab
Bruton FG
Odonnell FG
Ocaolain SF
Morgan SF
Ryan Green
Cuffe Green
Gormley Green
Lenihan FF
Cowen FF
●
●
●
●
●
●
●
●
●
●
●
●
●
●
−1.0 −0.5 0.0 0.5 1.0 1.5 2.0
Word−level non−parametric bootstrap
●
●
●
●
●
●
●
●
●
●
●
●
●
●
Burton Lab
Higgins Lab
Quinn Lab
Kenny FG
Gilmore Lab
Bruton FG
Odonnell FG
Ocaolain SF
Morgan SF
Ryan Green
Cuffe Green
Gormley Green
Lenihan FF
Cowen FF
●
●
●
●
●
●
●
●
●
●
●
●
●
●
−1.0 −0.5 0.0 0.5 1.0 1.5 2.0
Sentence−level non−parametric bootstrap
●
●
●
●
●
●
●
●
●
●
●
●
●
●
Burton Lab
Higgins Lab
Quinn Lab
Kenny FG
Gilmore Lab
Bruton FG
Odonnell FG
Ocaolain SF
Morgan SF
Ryan Green
Cuffe Green
Gormley Green
Lenihan FF
Cowen FF
●
●
●
●
●
●
●
●
●
●
●
●
●
●
−1.0 −0.5 0.0 0.5 1.0 1.5 2.0
Random block (size 50) non−parametric bootstrap
●
●
●
●
●
●
●
●
●
●
●
●
●
●
Figure 3: Estimates of θi and 95% confidence intervals from the 2009 Irish Budget Debatesusing Block Bootstrapping. Black points and lines are analytical SEs; blue point estimatesand 95% CIs correspond to the labelled method.
31

GREENS 1990PDS 1990PDS 1998PDS 1994GREENS 1994GREENS 1998PDS 2005PDS 2002GREENS 2002GREENS 2005SPD 1998SPD 1990SPD 1994SPD 2005SPD 2002CDU 1990CDU 1998CDU 2002CDU 2005CDU 1994FDP 2005FDP 2002FDP 1998FDP 1990FDP 1994
●
●
●
●
●
●
●
●
●
●
●
●
●
●
●
●
●
●
●
●
●
●
●
●
●
−1.0 −0.5 0.0 0.5 1.0 1.5 2.0
Parametric bootstrap (blue) versus Analytical SEs (black)
●
●
●
●
●
●
●
●
●
●
●
●
●
●
●
●
●
●
●
●
●
●
●
●
●
GREENS 1990PDS 1990PDS 1998PDS 1994GREENS 1994GREENS 1998PDS 2005PDS 2002GREENS 2002GREENS 2005SPD 1998SPD 1990SPD 1994SPD 2005SPD 2002CDU 1990CDU 1998CDU 2002CDU 2005CDU 1994FDP 2005FDP 2002FDP 1998FDP 1990FDP 1994
●
●
●
●
●
●
●
●
●
●
●
●
●
●
●
●
●
●
●
●
●
●
●
●
●
−1.0 −0.5 0.0 0.5 1.0 1.5 2.0
Non−parametric bootstrap (blue) versus Analytical SEs (black)
●
●
●
●
●
●
●
●
●
●
●
●
●
●
●
●
●
●
●
●
●
●
●
●
●
Figure 4: Point estimates of θi and 95% confidence intervals from German (economic) man-ifestos. Black points and lines are analytical SEs; blue point estimates and 95% CIs corre-spond to the labelled method.
32

D01
D02
D03
D04
D05
D06
D07
D08
D09
D10
●
●
●
●
●
●
●
●
●
●
−1.5 −1.0 −0.5 0.0 0.5 1.0 1.5
(a) Poisson−generated texts, 1/δ=0
●
●
●
●
●
●
●
●
●
●
D01
D02
D03
D04
D05
D06
D07
D08
D09
D10
●
●
●
●
●
●
●
●
●
●
−2 −1 0 1
(b) Mild overdispersion, 1/δ=0.8
●
●
●
●
●
●
●
●
●
●
D01
D02
D03
D04
D05
D06
D07
D08
D09
D10
●
●
●
●
●
●
●
●
●
●
−1.5 −1.0 −0.5 0.0 0.5 1.0 1.5 2.0
(c) Severe overdispersion, 1/δ=2.0
●
●
●
●
●
●
●
●
●
●
Figure 5: Correspondence Analysis point estimates of θi using simulated texts, with 95%confidence intervals from non-parametric bootstrapping. Black points and lines are Poisson-scaled estimates and analytical SEs; blue are CA estimates and non-parametric word-levelbootstrapped 95% CIs.
33

Burton Lab
Higgins Lab
Quinn Lab
Kenny FG
Gilmore Lab
Bruton FG
Odonnell FG
Ocaolain SF
Morgan SF
Ryan Green
Cuffe Green
Gormley Green
Lenihan FF
Cowen FF
●
●
●
●
●
●
●
●
●
●
●
●
●
●
−1.5 −1.0 −0.5 0.0 0.5 1.0 1.5 2.0
(a) Irish 2009 Budget Speeches
●
●
●
●
●
●
●
●
●
●
●
●
●
●
GREENS 1990PDS 1990PDS 1998PDS 1994GREENS 1994GREENS 1998PDS 2005PDS 2002GREENS 2002GREENS 2005SPD 1998SPD 1990SPD 1994SPD 2005SPD 2002CDU 1990CDU 1998CDU 2002CDU 2005CDU 1994FDP 2005FDP 2002FDP 1998FDP 1990FDP 1994
●
●
●
●
●
●
●
●
●
●
●
●
●
●
●
●
●
●
●
●
●
●
●
●
●
−2 −1 0 1 2
(b) German Economic Manifestos
●
●
●
●
●
●
●
●
●
●
●
●
●
●
●
●
●
●
●
●
●
●
●
●
●
Figure 6: Correspondence Analysis point estimates of θi using real texts, with 95% confidenceintervals from non-parametric bootstrapping. Black points and lines are Poisson-scaled es-timates and analytical SEs; blue are CA estimates and non-parametric word-level boot-strapped 95% CIs.
34