estimation of bit error rate for satellite communication
TRANSCRIPT
Estimation of Bit Error Rate for
Satellite Communication in Ka-band
under atmospheric disturbances for
India
Ph.D. Synopsis
Submitted To
Gujarat Technological University
For The Degree
Of
Doctor of Philosophy
In
Electronics & Communication Engineering
By
DAFDA ALPESHKUMAR HARISHBHAI
Enrollment No: 139997111001 (EC Engineering)
Supervisor:
Dr. Kishor G. Maradia, Prof. & HOD (E.C),
Govt. Engg. College, Sector-28, Gandhinagar.
2 | P a g e
Index
1 Abstract.......................................................................................................................................………………2
2 Brief description on the state of the art of the research topic..............................................................................3
3 Definition of the problem....................................................................................................................................3
4 Objective and scope of work ............................................................................................. .................................4
5 Original contributions by the thesis.............................................................................................................. .......4
6 Methodology of Research, Results / Comparisons.............................................................................................5
6.1 Different attenuations for Ka-band..............................................................................................................5
6.2 Generalized BER calculation model ..........................................................................................................5
6.3 Estimation of Rain attenuation…................................................................................................................7
6.4 Cloud attenuation calculation for different cities of India………………………………………………12
6.5 Gases attenuation calculation for different cities of India……………………………………………….12
6.6 Different mean attenuations (for 0.01% of time) calculated for different cities of India………………..13
6.7 Estimation of BER for different cities of India………………………………………………………….13
7 Achievements with respect to objectives..........................................................................................................15
8 Conclusions.......................................................................................................................................................15
9 Publications.......................................................................................................................................................16
10 References................................................................................................................... ....................................17
1 Abstract
Satellite Communication using C and Ku bands is already exhausted for India and it is
the time to move to the next Ka-band. Ka-band Satellite Communication offers higher
bandwidth and data rates for future next generation communication systems. But Ka-band is
much more susceptible to attenuation due to atmospheric disturbances especially rain
attenuation for tropical country like India. Bit Error Rate (BER) is an important parameter for
performance evaluation of a digital communication system. The bit error rate or bit error ratio
(BER) is the number of bit errors divided by the total number of transferred bits during a

3 | P a g e
studied time interval. It is a unitless performance measure, often expressed as a percentage.
For example if 3 of total 10 transferred bits are erroneous, than BER is 30 %.
For estimation of BER for satellite communication we need to find out different
attenuations that can cause BER to increase. These attenuations include rain attenuation,
cloud attenuation, gaseous attenuation and atmospheric scintillations. Rain attenuation is very
large for Ka-band as compared to cloud and gaseous attenuation. Atmospheric scintillations
are negligible and are not considered for the research work.
Rain attenuation is calculated using ITU-R model, Crane-Global model and
Moupfouma model and it is found that the attenuation values are varying largely as compared
to actual attenuation values. Hence a new rain attenuation model which is a modified version
of ITU-R model is proposed for India and is named as Dafda-Maradia rain attenuation model
for India. Cloud and Gaseous attenuation is found using standard ITU-R model. Finally BER
for different regions of India is calculated. This research will be helpful in the application of
different fade-mitigation techniques to avoid link failure under atmospheric disturbances.
2 Brief description on the state of the art of the research topic
C and Ku-band satellite communication is congested now for India due to rapid use of
internet and high speed communication. Ka-band will allow higher bandwidth and higher
speed communication. Ka-band is more prone to attenuation due to atmospheric disturbances
especially rain attenuation. Ka-band satellite communication is the future of satellite
communication in India and is going to be used in the next upcoming satellite series. Hence it
becomes essential to carry out attenuation studies for Ka-band. There are many rain
attenuation models but none are tested and verified for Ka-band satellite communication for
India. This testing will help application of Ka-band satellite communication in India.
Whenever there are heavy atmospheric disturbances like heavy rainfall, the satellite link fails.
To avoid this link failure, necessary fade mitigation techniques needs to be applied. If proper
attenuation values are predicted, the application of fade mitigation technique becomes easier
helping in saving of power and money for the nation.
3 Definition of the problem
The problem title is “Estimation of Bit Error Rate for Satellite Communications in Ka-
band under atmospheric disturbances for India”. The problem is to estimate the BER or
Signal strength for Ka-band Satellite Communication, which is still under experimentation
stage.

4 | P a g e
• This estimation can be done by :
1. Collecting data of atmospheric conditions in India at different places and using them
in different estimation models.
2. Optimization of existing models for estimation.
4 Objective and scope of work
To find out attenuation due to rainfall for Ka-band satellite communication for India (this is
still under experimentation stage).
To apply different rain attenuation models for India and optimize existing models.
To propose a new rain attenuation model for India.
To calculate cloud attenuation for Ka-band for India.
To find gaseous attenuation for Ka-band for India. Gaseous attenuation includes water
vapour attenuation and dry-air attenuation.
To calculate Bit Error Rate (BER) for different modulation schemes for Ka-band using a
generalized model.
5 Original contributions by the thesis
1. In this thesis different rain attenuation models are applied and compared for Ka-band.
These models are ITU-R model, Crane-Global model and Moupfouma model. After
detailed analysis, modified ITU-R model called Dafda-Maradia Rain attenuation
model is proposed for India. The estimation of rain attenuation is done using 64 years
rainfall data collected from Indian Meteorological Department(IMD).
2. Rain attenuation is estimated to lie in between 20 to 30 dB for Ka-band Satellite
Communication for India.
3. It is estimated that the Cloud Attenuation for Ka-band for India is around 0.3 dB.
4. Calculated value of Gaseous Attenuation for Ka-band for India is around 0.5 dB.
5. The BER comes out to be lowest for North India and highest for East India.
5 | P a g e
6 Methodology of Research, Results / Comparisons
6.1 Different attenuations for Ka-band
Different attenuations caused for Ka-band due to atmospheric disturbances are:
1. Rain attenuation (0 - 40 dB)[1].
2. Cloud attenuation(0 - 2 dB)[2].
3. Gaseous attenuation is relatively small and nearly constant at high elevation angles.(0
- 2 dB for India)[1],[3].
- Water vapor attenuation(0 - 1 dB for India)
- Oxygen attenuation(0 - 1 dB for India)
4. Tropospheric scintillations (0 - 0. 3dB)[4].
5. FSL (>200 dB)[3].
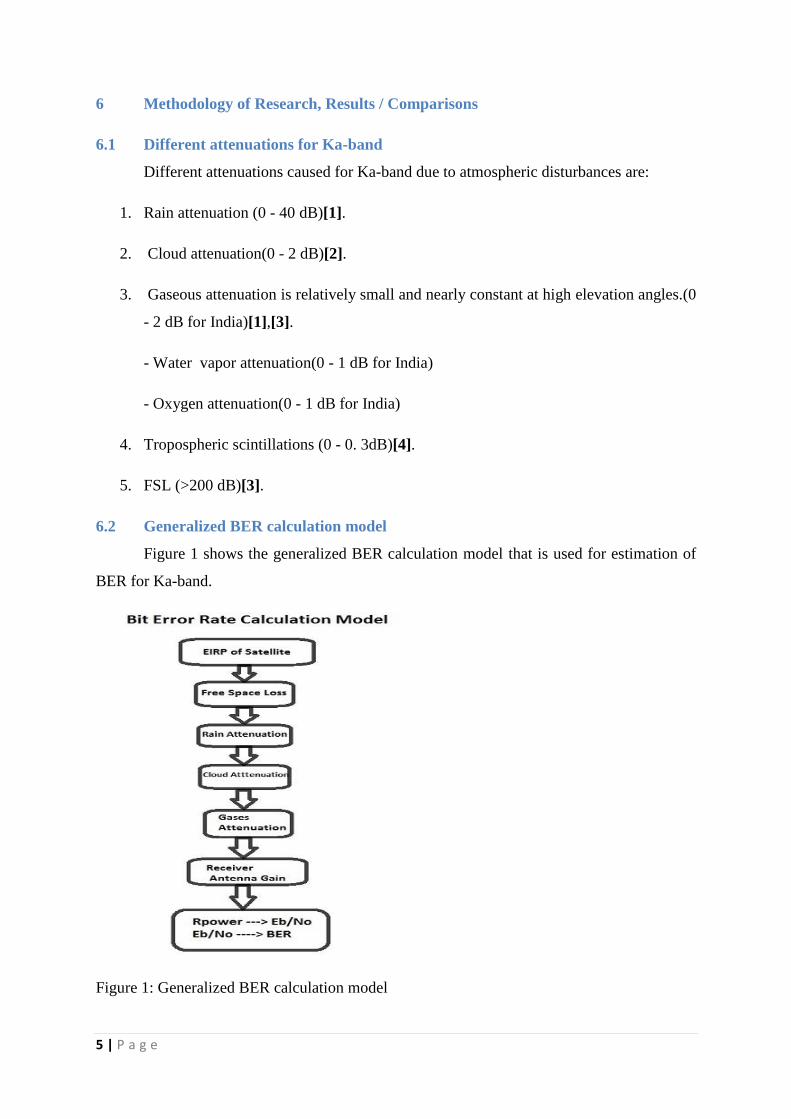
6.2 Generalized BER calculation model
Figure 1 shows the generalized BER calculation model that is used for estimation of
BER for Ka-band.
Figure 1: Generalized BER calculation model

6 | P a g e
The receiver input antenna gain is Gr and the value of Noise spectral density is taken as N0 =
10-7
[5]. The received power at earth station is calculated using,
Rpower = EIRP + Gr – FSL – La – Ls ……………….(1)
Here EIRP is the Effective Isotropic Radiated Power of satellite, Gr is the receiver antenna
gain, La is the losses due to atmospheric disturbances and Ls = System losses. The free space
loss(FSL) is given by [6],
𝐹𝑆𝐿 = 20𝐿𝑜𝑔(4𝜋𝑑
𝜆) ………....…….(2)
Where FSL is the path loss in dBs,
d is the distance between satellite and earth station,
λ is the wavelength of the signal in use.
Hence we can see that FSL increase with the increase in frequency or conversely decrease in
the wavelength. FSL depends on the frequency and is relatively constant.
While FSL is calculated using equation 2 above, La is given by,
La = Lrain + Lcloud + Lgas ……………….(3)
Lrain, Lcloud and Lgas are losses due to rain, cloud and gaseous attenuation respectively. Ls is
system losses which is assumed to be 2 dB [7]. System losses include receiver feeder
loss(RFL), antenna misalignment loss(AML) etc. Next the Eb/N0 is calculated using equation
4 below for different bit rates (brate) of 30, 50, 70, 90 and 110 Mbps.
Eb/N0 = Rpower – N0 – 10*10Log10(brate) ……....……….(4)
Now, the probability of bit error for a general M-PSK modulation is given by
𝐵𝐸𝑅 = 𝑃𝑏 =1
𝑘𝑒𝑟𝑓𝑐 [√
𝑘𝐸𝑏𝑁0
𝑠𝑖𝑛 (𝜋
𝑀)] ……..………..(5)
Here k is bits per symbol given by,
k = log2(M) ………………(6)
7 | P a g e
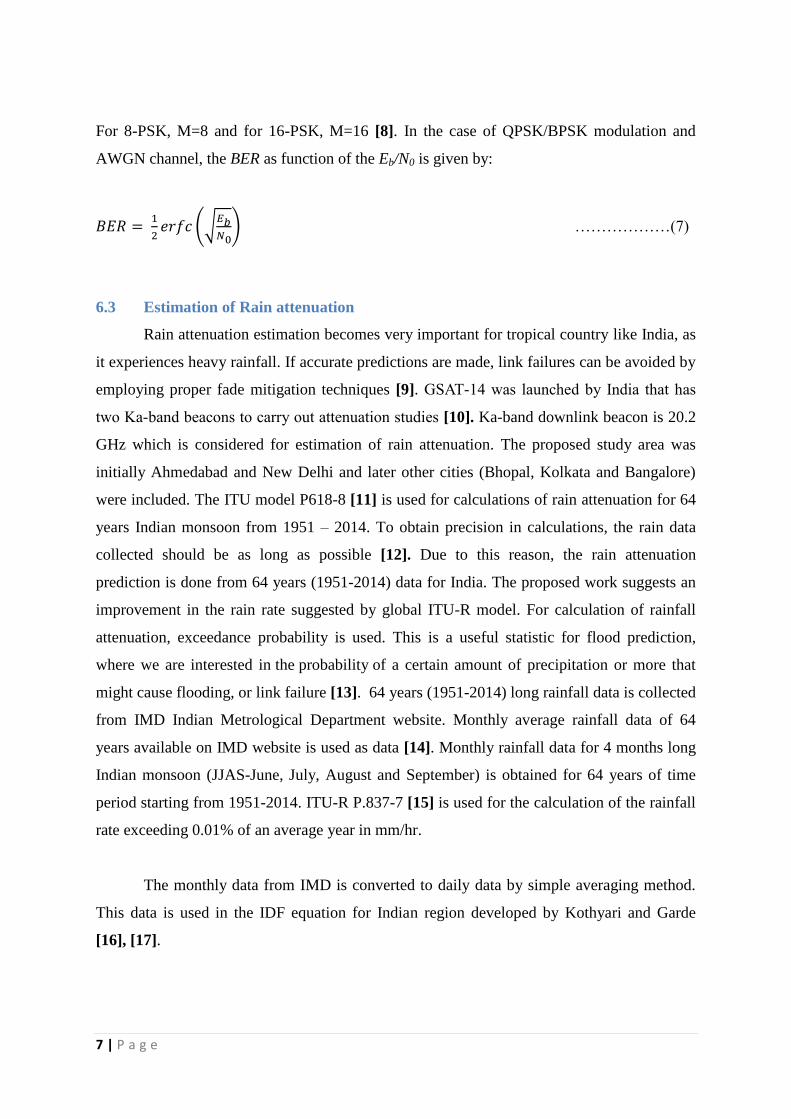
For 8-PSK, M=8 and for 16-PSK, M=16 [8]. In the case of QPSK/BPSK modulation and
AWGN channel, the BER as function of the Eb/N0 is given by:
𝐵𝐸𝑅 = 1
2𝑒𝑟𝑓𝑐 (√
𝐸𝑏𝑁0
) ………………(7)
6.3 Estimation of Rain attenuation
Rain attenuation estimation becomes very important for tropical country like India, as
it experiences heavy rainfall. If accurate predictions are made, link failures can be avoided by
employing proper fade mitigation techniques [9]. GSAT-14 was launched by India that has
two Ka-band beacons to carry out attenuation studies [10]. Ka-band downlink beacon is 20.2
GHz which is considered for estimation of rain attenuation. The proposed study area was
initially Ahmedabad and New Delhi and later other cities (Bhopal, Kolkata and Bangalore)
were included. The ITU model P618-8 [11] is used for calculations of rain attenuation for 64
years Indian monsoon from 1951 – 2014. To obtain precision in calculations, the rain data
collected should be as long as possible [12]. Due to this reason, the rain attenuation
prediction is done from 64 years (1951-2014) data for India. The proposed work suggests an
improvement in the rain rate suggested by global ITU-R model. For calculation of rainfall
attenuation, exceedance probability is used. This is a useful statistic for flood prediction,
where we are interested in the probability of a certain amount of precipitation or more that
might cause flooding, or link failure [13]. 64 years (1951-2014) long rainfall data is collected
from IMD Indian Metrological Department website. Monthly average rainfall data of 64
years available on IMD website is used as data [14]. Monthly rainfall data for 4 months long
Indian monsoon (JJAS-June, July, August and September) is obtained for 64 years of time
period starting from 1951-2014. ITU-R P.837-7 [15] is used for the calculation of the rainfall
rate exceeding 0.01% of an average year in mm/hr.
The monthly data from IMD is converted to daily data by simple averaging method.
This data is used in the IDF equation for Indian region developed by Kothyari and Garde
[16], [17].
8 | P a g e
IDF equation by Kothyari and Garde gives the rain intensity in mm/hours. IDF is a
statistical relationship between the rainfall intensity (i), the duration (d), and the return period
(T). This equation is [16]:
𝑰𝒕𝑻 = 𝑪 𝑻𝟎.𝟐𝟎
𝒕𝟎.𝟕𝟏 (𝑹𝟐𝟒𝟐)𝟎. 𝟑𝟑 …………………… (8)
where, ItT is the rainfall intensity/ rainfall rate in mm/hr;
T return period in years and
t duration of rainfall in hr.,
R242 is 24 hr., a two-year return period rainfall in mm.
t is chosen be 1 hour as we need 60 minutes integration rainfall data, which can be
applied to Rain rate statistics conversion MATLAB program[15]. This program gives the
conversion of 60 minutes integration rainfall to 1 minute integration rainfall.
C is a constant given by Kothyari and Garde, which has different value for different
parts of India. The rain intensity obtained from equation 8 above for 64 years is applied to
Rain rate statistics conversion MATLAB program [15] giving conversion of 60 minutes
integration rainfall to 1 minute integration rainfall.
The output of Rain rate statistics conversion MATLAB program is applied to ITU-R
model (P.618-8) [11] for estimation of Rainfall attenuation in dBs. India comes under K and
N region of different rain climate zones for Asia-Pacific Region. New Delhi and Ahmedabad
comes under region K [18]. The rain intensity for 0.01% time exceedance is 42mm/hour for
Ahmedabad and New-Delhi as given by ITU-R. For Ahmedabad region, the mean rainfall
intensity observed is 41.56 mm/hour. A deviation of 1.047 % is obtained for Ahmedabad
region as compared to ITU-R standard model. Similarly for New Delhi, the mean rainfall
intensity during monsoon period is observed to be 40.92 mm/hour. This result is matching
with the work done by Shraddha Mohanty et. al. [19] where they have obtained value of
40.48 mm/hr. For this mean rainfall intensity of 40.92 mm/hour, the mean rainfall attenuation
obtained is 23.12 dBs. A deviation of 2.57 % is obtained for Delhi region as compared to
ITU-R standard model [18]. The variation in rainfall attenuation is between 11.94 to 31.14
dB on average for New-Delhi. Also the rain attenuation for Delhi is lower as compared to
Ahmedabad.
Similarly rain attenuation was calculated for five different cities of India so as to
cover five different regions of India. These cities are New Delhi (North India),
9 | P a g e
Ahmedabad(West India), Bhopal(Central India), Kolkata(East India) and Bengaluru(South
India). Chennai was not chosen from south India since it receives its maximum rainfall
through northeast monsoon during the months of October to December [20], whereas primary
rain season of Bengaluru is June to September [21].
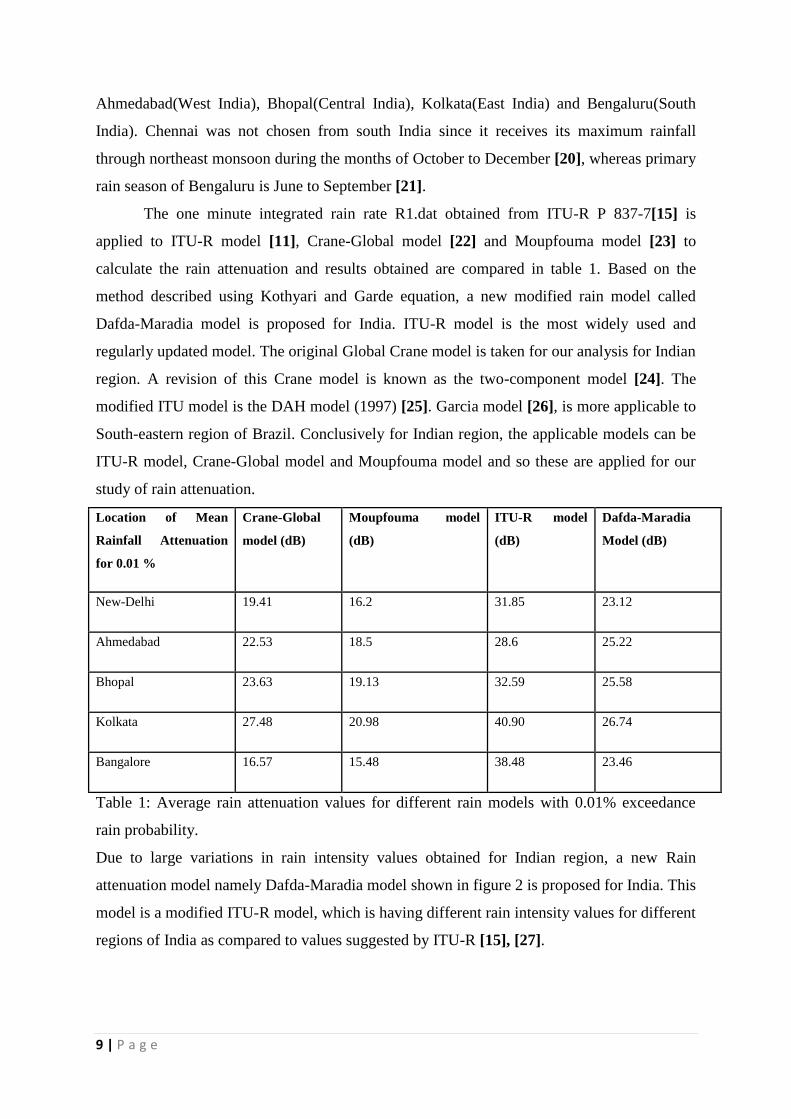
The one minute integrated rain rate R1.dat obtained from ITU-R P 837-7[15] is
applied to ITU-R model [11], Crane-Global model [22] and Moupfouma model [23] to
calculate the rain attenuation and results obtained are compared in table 1. Based on the
method described using Kothyari and Garde equation, a new modified rain model called
Dafda-Maradia model is proposed for India. ITU-R model is the most widely used and
regularly updated model. The original Global Crane model is taken for our analysis for Indian
region. A revision of this Crane model is known as the two-component model [24]. The
modified ITU model is the DAH model (1997) [25]. Garcia model [26], is more applicable to
South-eastern region of Brazil. Conclusively for Indian region, the applicable models can be
ITU-R model, Crane-Global model and Moupfouma model and so these are applied for our
study of rain attenuation.
Location of Mean
Rainfall Attenuation
for 0.01 %
Crane-Global
model (dB)
Moupfouma model
(dB)
ITU-R model
(dB)
Dafda-Maradia
Model (dB)
New-Delhi 19.41 16.2 31.85 23.12
Ahmedabad 22.53 18.5 28.6 25.22
Bhopal 23.63 19.13 32.59 25.58
Kolkata 27.48 20.98 40.90 26.74
Bangalore 16.57 15.48 38.48 23.46
Table 1: Average rain attenuation values for different rain models with 0.01% exceedance
rain probability.
Due to large variations in rain intensity values obtained for Indian region, a new Rain
attenuation model namely Dafda-Maradia model shown in figure 2 is proposed for India. This
model is a modified ITU-R model, which is having different rain intensity values for different
regions of India as compared to values suggested by ITU-R [15], [27].
10 | P a g e
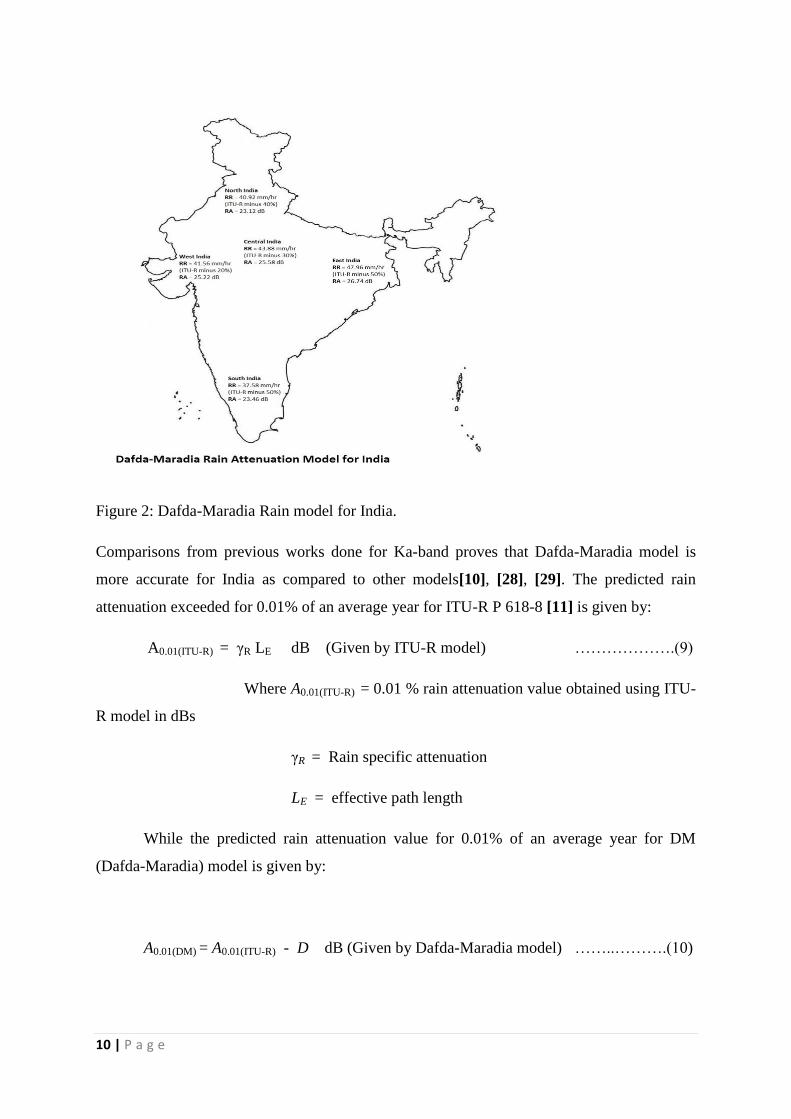
Figure 2: Dafda-Maradia Rain model for India.
Comparisons from previous works done for Ka-band proves that Dafda-Maradia model is
more accurate for India as compared to other models[10], [28], [29]. The predicted rain
attenuation exceeded for 0.01% of an average year for ITU-R P 618-8 [11] is given by:
A0.01(ITU-R) = γR LE dB (Given by ITU-R model) ……………….(9)
Where A0.01(ITU-R) = 0.01 % rain attenuation value obtained using ITU-
R model in dBs
γR = Rain specific attenuation
LE = effective path length
While the predicted rain attenuation value for 0.01% of an average year for DM
(Dafda-Maradia) model is given by:
A0.01(DM) = A0.01(ITU-R) - D dB (Given by Dafda-Maradia model) ……..……….(10)

11 | P a g e
Where A0.01(DM) = 0.01 % rain attenuation value obtained using Dafda-
Maradia model in dBs
A0.01(ITU-R) = 0.01 % rain attenuation value obtained using ITU-R
model in dBs
D = Constant in dB having value as given in table 2 below.
Location D(dB)
North India 8.7
West India 3.4
Central India 7
East India 14.2
South India 15
Table 2: Constant D for different Indian regions suggested by Dafda-Maradia model
Consider for example, for New-Delhi ITU-R model suggests RA of 31.85 dB [27]. So, to find
out RA due to Dafda-Maradia model, as per DM equation above,
A0.01(DM) = A0.01(ITU-R) - D dB
= 31.85 - 8.7 dB ( As, New-Delhi is in North India, constant D = 8.7 as per table 2
above)
= 23.15 dB.
Applying mean values of rain rate and finding out rain attenuation for other
percentages of time, gives cumulative distribution of rain attenuation for different cities
(zones) of India. From the cumulative distribution of rain attenuation calculated for different
India cities, it is concluded that Moupfouma and Crane model much underestimates the RA
for most part of India, while ITU-R model much overestimates the RA for whole of India.
This is due to the predicted average RR values for 0.01% of time, which are much higher
given by ITU-R model [15], [27]. While the RR values calculated by DM model are lower

12 | P a g e
than ITU-R model. The RA values for 0.01% of time (99.99% link availability) ranges from
23 dB to 27 dB as per DM model proposed for India. Keeping in mind rain variability for
different regions of India, it can be concluded that average RA for 0.01% of time varies from
20 dB to 30 dB for any location in India.
6.4 Cloud attenuation calculation for different cities of India
The clouds even causes scattering and absorption of electromagnetic energy specially
for frequencies higher than 10 GHz, but its intensity is very less as compared to rain [30].
Cloud attenuation also depends on signal frequency and elevation angle, but additional
important parameters are average height and thickness of clouds, the total columnar content
of liquid water in kg/m2 (liquid water contents LWC) and the temperature. The cloud
attenuation has been predicted using ITU-R model, P.840 [31].
For Cloud attenuation, temperature T is chosen to be the mean temperature in the months
of monsoon [32]. It comes out to be 27 °C or 300 °K. Even if we vary from -27 to 0 to +27
°C, variation in attenuation is 1.33 dB to 0.6209 to 0.3160 dB. Similarly liquid water
contents LWC is chosen to be 1.5 kg/m2 as the average/mean LWC for India [33]. The
variation in LWC is 0.0 kg/m2 to 2.5 kg/m
2. Even if we vary LWC from 0.0 to 1.5 to 2.5,
variation in attenuation is 0 to 0.3160 to 0.5267 dB. The mean cloud attenuation estimated for
India is around 0.3 dB.
6.5 Gases attenuation calculation for different cities of India
Gases Attenuation includes Water vapour and Oxygen (dry air) attenuations. Weather
parameters like temperature, water vapour content, and altitude above sea level affects the
water vapour attenuation. Water vapour attenuation increases proportionally once the
temperature and relative humidity (RH) increase [34]. The effect of oxygen attenuation is
different as compared to other atmospheric disturbances because its effect on all the regions
on the earth remains almost constant and independent. For gaseous attenuation, the ITU-R
prediction model P.676-10 [35] has gained global agreement. The other important parameters
for Gases attenuation are Relative humidity and atmospheric pressure. Relative humidity for
different Indian cities is obtained from [36]. Similarly average atmospheric pressure value is
taken as 850 hPa from [37].The variation in atmospheric pressure is 5 to 1000 hPa. Even if
we vary pressure from 5 to 850 to 1000, variation in attenuation is 0.1115 to 0.5003 to 0.5104
dB. Mean gaseous attenuation for India is estimated to be around 0.5 dB.
13 | P a g e
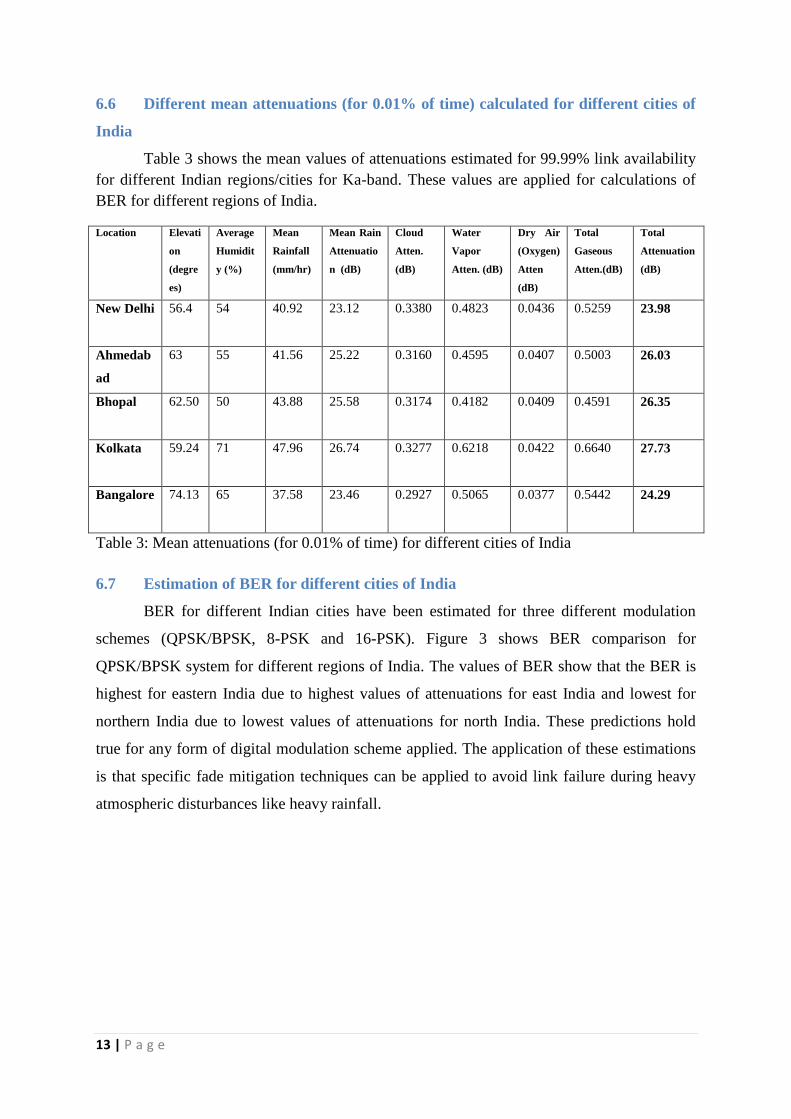
6.6 Different mean attenuations (for 0.01% of time) calculated for different cities of
India
Table 3 shows the mean values of attenuations estimated for 99.99% link availability
for different Indian regions/cities for Ka-band. These values are applied for calculations of
BER for different regions of India.
Location Elevati
on
(degre
es)
Average
Humidit
y (%)
Mean
Rainfall
(mm/hr)
Mean Rain
Attenuatio
n (dB)
Cloud
Atten.
(dB)
Water
Vapor
Atten. (dB)
Dry Air
(Oxygen)
Atten
(dB)
Total
Gaseous
Atten.(dB)
Total
Attenuation
(dB)
New Delhi 56.4
54
40.92 23.12 0.3380 0.4823 0.0436 0.5259 23.98
Ahmedab
ad
63 55
41.56 25.22 0.3160 0.4595 0.0407 0.5003 26.03
Bhopal 62.50
50 43.88 25.58 0.3174 0.4182 0.0409 0.4591 26.35
Kolkata 59.24
71
47.96 26.74 0.3277 0.6218 0.0422 0.6640 27.73
Bangalore 74.13
65
37.58 23.46 0.2927 0.5065 0.0377 0.5442 24.29
Table 3: Mean attenuations (for 0.01% of time) for different cities of India
6.7 Estimation of BER for different cities of India
BER for different Indian cities have been estimated for three different modulation
schemes (QPSK/BPSK, 8-PSK and 16-PSK). Figure 3 shows BER comparison for
QPSK/BPSK system for different regions of India. The values of BER show that the BER is
highest for eastern India due to highest values of attenuations for east India and lowest for
northern India due to lowest values of attenuations for north India. These predictions hold
true for any form of digital modulation scheme applied. The application of these estimations
is that specific fade mitigation techniques can be applied to avoid link failure during heavy
atmospheric disturbances like heavy rainfall.

14 | P a g e
Figure 3: BER comparison for QPSK/BPSK modulation for 0.01% Rainfall exceedance value
Figure shows that BER is lowest for North India and Highest for East India. Table 4 below
shows the BER comparison for different Indian cities.
Location City Bit Rate Eb/No
(dB)
BER
(QPSK/BPSK)
BER
(8PSK)
BER
(16PSK)
North India New Delhi 30Mbps 9.57 6.0734e-06 0.0012446 0.021955
50Mbps 7.3516 6.292e-05 0.0036784 0.033655
70Mbps 5.8903 0.00029927 0.0076352 0.045126
90Mbps 4.7988 0.00097413 0.013343 0.056687
110Mbps 3.9273 0.0025345 0.021073 0.068541
West India Ahmedabad 30Mbps 7.5176 5.276e-05 0.0033886 0.032574
50Mbps 5.2992 0.00056596 0.010314 0.051
70Mbps 3.8379 0.0027984 0.022101 0.069924
90Mbps 2.7464 0.0095472 0.040105 0.090119
110Mbps 1.8749 0.026406 0.066435 0.11248
Central India Bhopal 30Mbps 7.1974 7.4103e-05 0.0039699 0.034694
50Mbps 4.979 0.0008008 0.012157 0.054556
70Mbps 3.5177 0.0039958 0.026244 0.075176
90Mbps 2.4262 0.013803 0.048088 0.097516

15 | P a g e
110Mbps 1.5547 0.03892 0.080827 0.12286
East India Kolkata 30Mbps 5.8222 0.00032197 0.0079026 0.04576
50Mbps 3.6038 0.00363 0.025054 0.073716
70Mbps 2.1425 0.019226 0.056682 0.10482
90Mbps 1.051 0.073551 0.11218 0.1429
110Mbps 0.1795 0.27452 0.23041 0.20379
South India Bangalore 30Mbps 9.257 8.4327e-06 0.0014481 0.023294
50Mbps 7.0386 8.7734e-05 0.0042955 0.035803
70Mbps 5.5773 0.00041913 0.0089489 0.048132
90Mbps 4.4858 0.001371 0.015702 0.060631
110Mbps 3.6143 0.0035875 0.024912 0.073539
Table 4: BER comparison for different Indian cities for three different modulation schemes
7 Achievements with respect to objectives
Rainfall attenuation for Ka-band satellite communication for India is carried out using
three different models and a new Rain model named Dafda-Maradia model is
proposed for India.
This new model is a modified/optimized ITU-R model for Indian region.
Cloud and Gaseous attenuation for India is estimated and it is found that the values
are much smaller as compared to the Rain attenuation values.
Bit Error Rate (BER) for different modulation schemes for Ka-band using a
generalized model is calculated for India and it is concluded that that BER is highest
for East India and lowest for North India.
8 Conclusions
From the Eb/N0 and BER values obtained, it is observed that, the BER is lowest for
QPSK/BPSK modulation and is highest for 16-PSK modulation system. The values of 8-PSK
modulation obtained are in between the values of QPSK/BPSK and 16-PSK modulation. As
expected for digital modulation, with the increase in bits of modulation, the transmission
capacity/bit rate increases but the BER also increases simultaneously.

16 | P a g e
From table 4, the BER values obtained for different regions/cities of India for
different modulation scheme for 99.99% link availability or 0.01% exceedance values can be
judged. As can be observed and highlighted, North India (New-Delhi) is having highest Eb/N0
and conversely lowest BER for a particular bit rate of 30 Mbps, whereas East-India (Kolkata)
is having lowest Eb/N0 or highest BER for same bit rate of 30 Mbps. After North India
(lowest BER) comes the region of South India (Bengaluru), West India (Ahmedabad),
Central India (Bhopal) and East India (Kolkata) in increasing order in the terms of BER.
The reason of highest BER for Kolkata is the heavy rainfall, fog, clouds and other
gases in the season of monsoon (June, July, August and September). Hence it can be
concluded that the mean atmospheric disturbances like rain, cloud and gases are highest for
East India and lowest for North India during the season of monsoon. Consequently, the Bit
Error Rate (BER) is highest for East India and lowest for North India. These results are
helpful for designing of different fade mitigation techniques for different regions of India for
Ka-band satellite communication.
9 Publications
1. Alpesh H. Dafda and Kishor G. Maradia, “A Novel method for estimation of Rainfall
Attenuation using coarse rainfall data and proposal of Modified ITU-R Rain model for
India”, Springer Nature - Applied Science Journal, Volume 01, Issue 04, March-2019, pages
379, ISSN: 2523-3963 (Print) 2523-3971 (Online), DOI: 10.1007/s42452-019-0356-0.
2. Alpesh H. Dafda and Dr. K. G. Maradia, “Estimation of Bit Error Rate for Satellite
Communication in Ka-band under atmospheric disturbances for India”, “International Journal
of Management Technology and Engineering (IJMTE), Volume 8, Issue 10, October-2018,
page 2299-2310.
3. Alpesh H. Dafda and Dr. K. G. Maradia, “Monthly variation in Rainfall Attenuation for
Ka-band Satellite Communication for monsoon in Ahmedabad and New Delhi”, International
Journal of Scientific Research in Science, Engineering and Technology (IJSRSET), Volume
3, Issue 6, September-October-2017, ISSN(print): 2395-1990, ISSN(online): 2394-4099.
4. Alpesh H. Dafda and Dr. K. G. Maradia, “Modifications in rainfall intensity values
suggested by ITU-R model and estimation of rainfall attenuation for Ka-band for India”,
17 | P a g e
International Journal of Advance Engineering and Research Development (IJAERD),
Volume 04, Issue 08, August-2017, ISSN(print): 2348-6406, ISSN(online): 2348-4470, DOI:
10.21090/ IJAERD.
5. Alpesh H. Dafda and Dr. K. G. Maradia, “Estimation of Mean Cloud and Gaseous
Attenuation for Ka-band for India”, “International Journal of Research in Engineering, IT and
Social Sciences (IJREISS), ISSN-2250-0588 (Online), UGC approved Journal No. 42301,
Volume-8, Issue-8, August 2018, page 335-339.
6. Alpesh H. Dafda and Dr. K. G. Maradia, “Estimation of Rain Attenuation for Ka-Band
Satellite Communication for India – A Survey”, “International Journal of Research in
Engineering, IT and Social Sciences (IJREISS), ISSN-2250-0588 (Online), UGC
approved Journal No. 42301, Volume-8, Issue-10, October 2018, page 218-222.
10. References:
1. J. Jena and P. K. Sahu, “Rain fade and Ka-band Spot Beam Satellite communication
in India”, IEEE international conference on Recent advances in space technology
services and climate change(RSTCC),2010, 13-15 Nov. 2010.
2. R. Shriram , S. I. Ahamed and L. S. Kumar, “Calculation of cloud attenuation at Ku
and Ka-band frequencies over Indian region”, IEEE Applied Electromagnetics
Conference(AEMC), 2015, 18-21 Dec. 2015.
3. B. R. Elbert, “Introduction to Satellite Communication”, 3rd
edition, Artech house,
London, 2008.
4. R. Prabhakar and T.V. Ramana,” Effect of Scintillations on Ka-band Frequency
Satellite signals”, IJAETMAS, Volume 04 - Issue 03 ,March-2017, pp. 136-141.
5. D. Roddy, Satellite communications, McGraw-Hill Publication, Fourth edition-2006,
page 305.
6. D. Roddy, Satellite communications, McGraw-Hill Publication, Fourth edition-2006,
page 353.
7. D. Roddy, Satellite communications, McGraw-Hill Publication, Fourth edition-2006,
page 375.

18 | P a g e
8. Bit error rate for 16PSK modulation using Gray mapping,
http://www.dsplog.com/2008/05/18/bit-error-rate-for-16psk-modulation-using-gray-
mapping/
9. Propagation Effects Handbook for Satellite Systems Design, NASA.
10. M. R. Sujimol, R. Acharya, G. Singh and R. K. Gupta, “Rain attenuation using Ka
and Ku band frequency beacons at Delhi Earth Station”, Indian Journal of Radio and
Space Physics, Vol-44, March-2015, pp.45-50.
11. P. Series, “Propagation data and prediction methods required for the design of Earth-
space telecommunication systems”, Recomm. ITU-R P 618-8, vol. 10, 2009.
12. M. C. Kestwal, S. Joshi and L. S. Garia, “Prediction of Rain Attenuation and Impact
of Rain in Wave Propagation at Microwave Frequency for Tropical Region
(Uttarakhand, India)”, International Journal of Microwave Science and Technology,
Volume 2014 (2014), Article ID 958498.
13. http://geog.uoregon.edu/amarcus/geog422/Handout_Recurrence_calcs.htm
14. Area Weighted Monthly, Seasonal And Annual Rainfall (in mm) For 36
Meteorological Subdivisions | Open Government Data (OGD) Platform India,
https://data.gov.in/resources/area-weighted-monthly-seasonal-and-annual-rainfall-
mm-36-meteorological-subdivisions.
15. P. Series, “Characteristics of precipitation for propagation modelling”, Recomm. ITU-
R P 837-7, 2013.
16. U. C. Kothyari and R. J. Garde, “Rainfall Intensity-Duration-Frequency Formula for
India”, Journal of Hydraulic Engineering, ASCE, 118(2), 323-336, 1992.
17. P. E. Zope, T. I. Eldho and V. Jothiprakash, “Development of Rainfall Intensity
Duration Frequency Curves for Mumbai City, India” , Journal of Water Resource and
Protection, 2016, 8, 756-765, http://dx.doi.org/10.4236/jwarp.2016.87061
18. Rec. ITU-R PN.837-1, RECOMMENDATION ITU-R PN.837-1,
CHARACTERISTICS OF PRECIPITATION FOR PROPAGATION MODELLING,
1992-1994.
19. S. Mohanty, C. Singh and V. Tiwari, “Estimation of rain attenuation losses in signal
link for microwave frequencies using ITU-R model”, IGARSS 2016, pp. 532-535,
IEEE Explore.
20. NORTHEAST MONSOON, http://www.imdchennai.gov.in/northeastmonsoon:htm
21. Bangalore facts|Temperature|Rainfall, https://www.karnataka.com/bangalore/facts/.

19 | P a g e
22. R. K. Crane, “Prediction of Attenuation by Rain”, IEEE Transactions on
Communications, Vol. COM-28(9), Sept-1980, pp. 1717-1733.
23. F. Moupfouma, “Improvement of rain attenuation prediction method for terrestrial
microwave links”, IEEE Trans. Antennas Propag., 1984, 32, (12), pp. 1368–1372.
24. L. J. Ippolito, Satellite communications Systems Engineering, John Wiley & Sons
publication, Third edition-2008, pp. 177-179.
25. J. S. Ojo, M. O. Ajewole and S. K. Sarkar, “Rain rate and rain attenuation prediction
for satellite communication in Ku and Ka bands over Nigeria”, Progress In
Electromagnetics Research B, Vol. 5, 2008, pp. 207-223.
26. N.A.P. Garcia, L.A.R. de Silva Mello and M.S. Pontes, “Measurement and prediction
of differential rain attenuation in convergent links”, Electron. Lett., 2005, 41, (17), pp.
11–12, IEEE Xplore.
27. N. Meghanathan, B. Kaushik and D. Nagamalai, Advances in Networks and
Communication, CCSIT 2011, Proceedings Part II, Springer, pp. 313-316.
28. A. Debnath, R. K. Das and D. Gogoi, “A study of Ka-Band Signal Attenuation at
Umiam”, Meghalaya with ISROs GSAT-14 Satellite, ADBU-Journal of Engineering
Technology, ISSN: 2348-7305, Volume 6, Issue 2, (July-2017), pp. 7-10.
29. J. X. Yeo, Y. H. Lee and J. T. Ong, “Ka-band Satellite Beacon Attenuation and Rain
Rate Measurements in Singapore Comparison with ITU-R Models”, Antennas and
Propagation Society International Symposium(2009), APSURI09, IEEE conference,
pp. 1-4.
30. A. M. Al-Saegh, A. Sali, J. S. Mandeep, and A. Ismail, “Extracted atmospheric
impairments on earth-sky signal quality in tropical regions at Ku-band”, Journal of
Atmospheric and Solar-Terrestrial Physics”, Elsevier, vol. 104, pp. 96-105, 2013.
31. I. T. U. ITU, “Attenuation due to clouds and fog”, ed: International
Telecommunication Union-Recommendation P.840, 2012.
32. https://data.gov.in/catalog/annual-and-seasonal-mean-temperature-india
33. S. Banerjee , R. Chakraborty , A. Maitra , “A comparative study of liquid water
profiles over Indian Subcontinent using CLOUDSAT data”, ICMARS-2014, 9-12
Dec, 2014, pp 319 -321, IEEE Xplore.
34. R. Bhattacharya, R. Das, R. Guha, S. D. Barman, and A. B. Bhattacharya,
"Variability of millimetre wave rain attenuation and rain rate prediction: A survey,"
Indian Journal of Radio & Space Physics (IJRSP), vol. 36, pp. 325-344, Aug-2007
2007
20 | P a g e
35. I. T. U. ITU, "Attenuation by atmospheric gases.," ed: International
Telecommunication Union-Recommendation P.676-11, 2013
36. https://www.currentresults.com/Weather/India/humidity-annual.php
37. S. Chandra , A. Dwivedi and M. Kumar , “Characterization of the atmospheric
boundary layer from Radiosonde observations along eastern end of monsoon trough
of India”, Indian Academy of Sciences, J. Earth Syst. Sci. 123, No. 6, August 2014,
pp. 1233–1240.