estimation of fracture aperture from petrophysical logs using … · · 2018-03-01fractures...
TRANSCRIPT

ORIGINAL PAPER - EXPLORATION GEOLOGY
Estimation of fracture aperture from petrophysical logs usingteaching–learning-based optimization algorithm into a fuzzyinference system
Hesam Zarehparvar Ghoochaninejad1 • Mohammad Reza Asef1 •
Seyed Ali Moallemi2
Received: 19 April 2017 / Accepted: 25 September 2017 / Published online: 4 October 2017
� The Author(s) 2017. This article is an open access publication
Abstract Aperture, which refers to the opening size of a
fracture, is a critical parameter controlling rock mass per-
meability. Moreover, distribution of permeability within
the reservoir is commonly affected by natural fracture
occurrences. In a water-based mud environment, borehole-
imaging tools are able to identify both location and aper-
ture size of the intersected fractures, whereas in oil-based
environment, due to invasion of resistive mud into the
fractures, this technique is impractical. Recently, some
artificial intelligence techniques facilitated reliable esti-
mations of reservoir parameters. In this paper, a teaching–
learning-based optimization algorithm (TLBO) trained an
initial fuzzy inference system to estimate hydraulic aper-
ture of detected fractures using well logs responses.
Comparing the results with real measurements revealed
that the model can provide reliable estimations in both
conductive and resistive mud environments, wherever the
aperture size is unknown. TLBO, besides of its easier
application, outperformed earlier optimization algorithms,
which were used to evaluate the method effectiveness.
Keywords Aperture size � Fracture permeability � Fuzzylogic � Image logs � TLBO
Introduction
Natural fractures can affect essential reservoir character-
istics tremendously. As a fluid conduit, natural open frac-
tures can control the reservoir permeability (Boro et al.
2014). Conventional techniques of oil recovery may drain
fractured reservoirs inefficiently, leading to early break-
through in the secondary recovery (Alvarado and Manrique
2010; Speight 2016). In these cases, where production
substantially takes place through fracture networks, aper-
ture size is one of the basic parameters controlling reservoir
permeability (Nelson 2001; Tiab and Donaldson 2015).
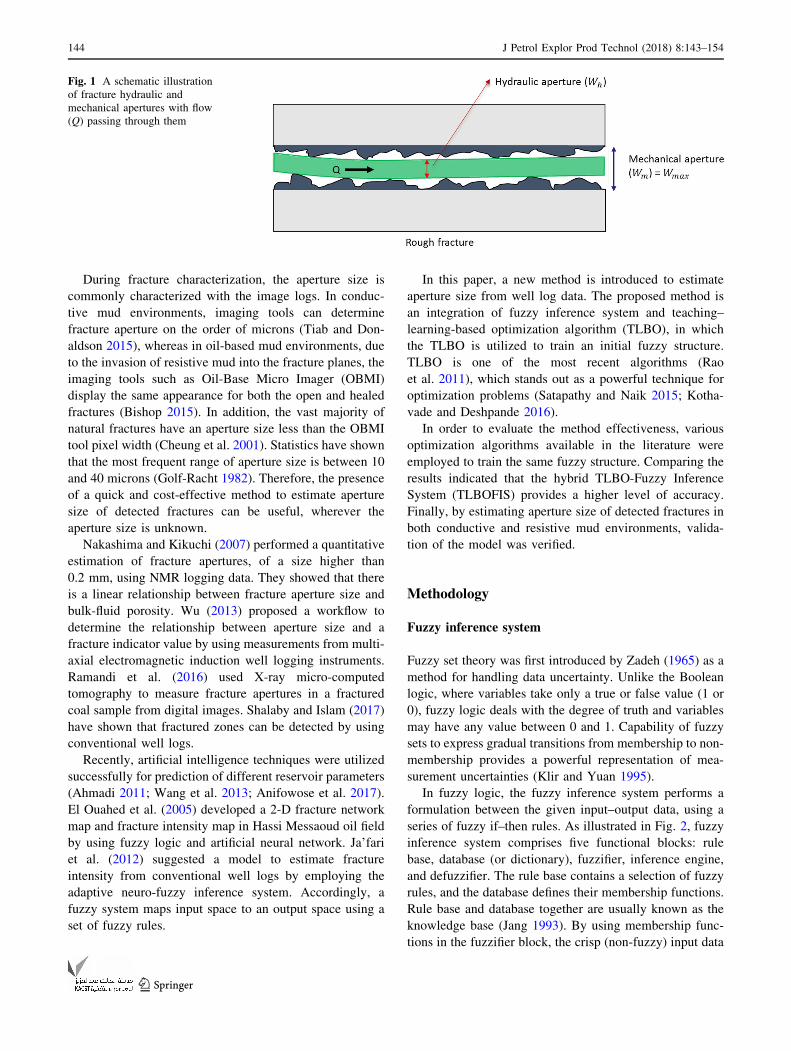
Mechanically, aperture is defined as the physical sepa-
ration of the fracture walls (Fossen 2010). Moreover, the
equivalent open part of the aperture is an indication of
roughness characteristics, through which fluid can flow,
and it is assumed as the hydraulic aperture as illustrated in
Fig. 1 (Klimczak et al. 2010; Dardashti and Ajalloeian
2015).
Witherspoon et al. (1980) and Klimczak et al. (2010)
indicated that the cubic law accurately describes the rela-
tionship between fluid flow and aperture size, considering
fracture walls as smooth parallel plates. Accordingly,
fracture permeability is related to the square of aperture
size. Nevertheless, asperity and aperture size variation are
commonly observed (Klimczak et al. 2010). Thus, the
equivalent hydraulic aperture can express the relationship
more accurately as follows (Sarkar et al. 2004; Watanabe
et al. 2008; Ishibashi et al. 2012):
k ¼ w2h
12ð1Þ
where K is the fracture permeability (millidarcy) and wh is
the hydraulic aperture size (microns).
& Hesam Zarehparvar Ghoochaninejad
1 Faculty of Earth Sciences, Kharazmi University, Tehran, Iran
2 National Iranian Oil Company, Exploration Directorate,
Tehran, Iran
123
J Petrol Explor Prod Technol (2018) 8:143–154
https://doi.org/10.1007/s13202-017-0396-1
During fracture characterization, the aperture size is
commonly characterized with the image logs. In conduc-
tive mud environments, imaging tools can determine
fracture aperture on the order of microns (Tiab and Don-
aldson 2015), whereas in oil-based mud environments, due
to the invasion of resistive mud into the fracture planes, the
imaging tools such as Oil-Base Micro Imager (OBMI)
display the same appearance for both the open and healed
fractures (Bishop 2015). In addition, the vast majority of
natural fractures have an aperture size less than the OBMI
tool pixel width (Cheung et al. 2001). Statistics have shown
that the most frequent range of aperture size is between 10
and 40 microns (Golf-Racht 1982). Therefore, the presence
of a quick and cost-effective method to estimate aperture
size of detected fractures can be useful, wherever the
aperture size is unknown.
Nakashima and Kikuchi (2007) performed a quantitative
estimation of fracture apertures, of a size higher than
0.2 mm, using NMR logging data. They showed that there
is a linear relationship between fracture aperture size and
bulk-fluid porosity. Wu (2013) proposed a workflow to
determine the relationship between aperture size and a
fracture indicator value by using measurements from multi-
axial electromagnetic induction well logging instruments.
Ramandi et al. (2016) used X-ray micro-computed
tomography to measure fracture apertures in a fractured
coal sample from digital images. Shalaby and Islam (2017)
have shown that fractured zones can be detected by using
conventional well logs.
Recently, artificial intelligence techniques were utilized
successfully for prediction of different reservoir parameters
(Ahmadi 2011; Wang et al. 2013; Anifowose et al. 2017).
El Ouahed et al. (2005) developed a 2-D fracture network
map and fracture intensity map in Hassi Messaoud oil field
by using fuzzy logic and artificial neural network. Ja’fari
et al. (2012) suggested a model to estimate fracture
intensity from conventional well logs by employing the
adaptive neuro-fuzzy inference system. Accordingly, a
fuzzy system maps input space to an output space using a
set of fuzzy rules.
In this paper, a new method is introduced to estimate
aperture size from well log data. The proposed method is
an integration of fuzzy inference system and teaching–
learning-based optimization algorithm (TLBO), in which
the TLBO is utilized to train an initial fuzzy structure.
TLBO is one of the most recent algorithms (Rao
et al. 2011), which stands out as a powerful technique for
optimization problems (Satapathy and Naik 2015; Kotha-
vade and Deshpande 2016).
In order to evaluate the method effectiveness, various
optimization algorithms available in the literature were
employed to train the same fuzzy structure. Comparing the
results indicated that the hybrid TLBO-Fuzzy Inference
System (TLBOFIS) provides a higher level of accuracy.
Finally, by estimating aperture size of detected fractures in
both conductive and resistive mud environments, valida-
tion of the model was verified.
Methodology
Fuzzy inference system
Fuzzy set theory was first introduced by Zadeh (1965) as a
method for handling data uncertainty. Unlike the Boolean
logic, where variables take only a true or false value (1 or
0), fuzzy logic deals with the degree of truth and variables
may have any value between 0 and 1. Capability of fuzzy
sets to express gradual transitions from membership to non-
membership provides a powerful representation of mea-
surement uncertainties (Klir and Yuan 1995).
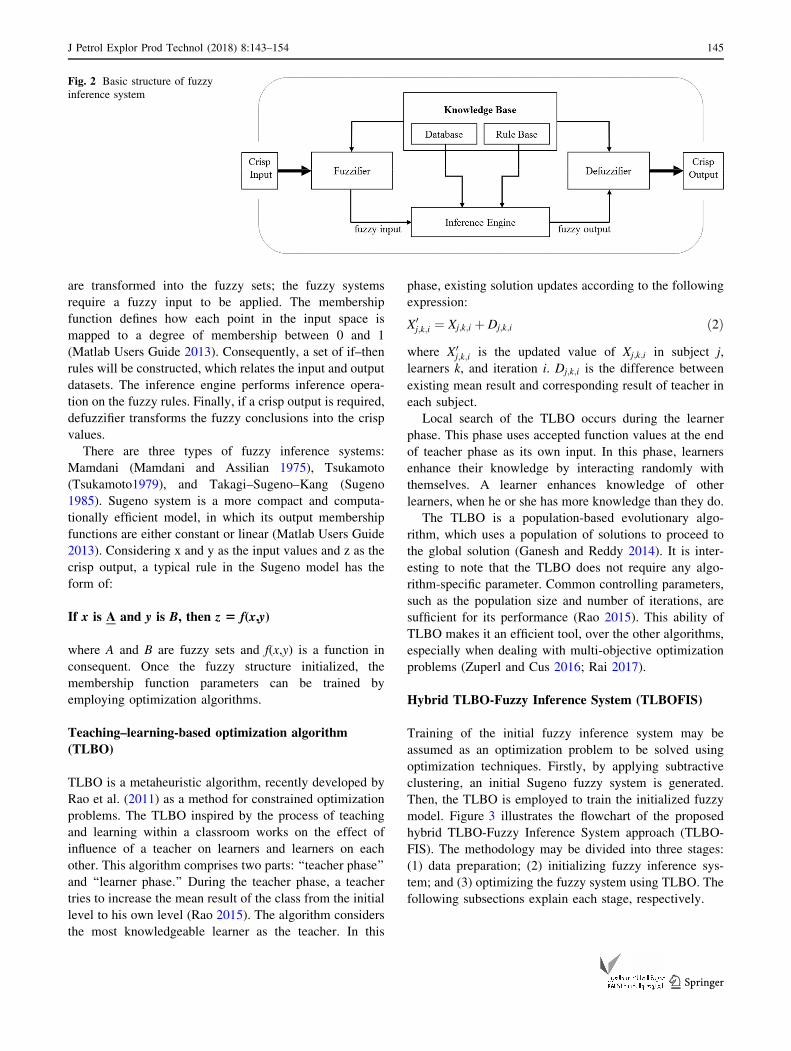
In fuzzy logic, the fuzzy inference system performs a
formulation between the given input–output data, using a
series of fuzzy if–then rules. As illustrated in Fig. 2, fuzzy
inference system comprises five functional blocks: rule
base, database (or dictionary), fuzzifier, inference engine,
and defuzzifier. The rule base contains a selection of fuzzy
rules, and the database defines their membership functions.
Rule base and database together are usually known as the
knowledge base (Jang 1993). By using membership func-
tions in the fuzzifier block, the crisp (non-fuzzy) input data
Fig. 1 A schematic illustration
of fracture hydraulic and
mechanical apertures with flow
(Q) passing through them
144 J Petrol Explor Prod Technol (2018) 8:143–154
123
are transformed into the fuzzy sets; the fuzzy systems
require a fuzzy input to be applied. The membership
function defines how each point in the input space is
mapped to a degree of membership between 0 and 1
(Matlab Users Guide 2013). Consequently, a set of if–then
rules will be constructed, which relates the input and output
datasets. The inference engine performs inference opera-
tion on the fuzzy rules. Finally, if a crisp output is required,
defuzzifier transforms the fuzzy conclusions into the crisp
values.
There are three types of fuzzy inference systems:
Mamdani (Mamdani and Assilian 1975), Tsukamoto
(Tsukamoto1979), and Takagi–Sugeno–Kang (Sugeno
1985). Sugeno system is a more compact and computa-
tionally efficient model, in which its output membership
functions are either constant or linear (Matlab Users Guide
2013). Considering x and y as the input values and z as the
crisp output, a typical rule in the Sugeno model has the
form of:
If x is A and y is B, then z 5 f(x,y)
where A and B are fuzzy sets and f(x,y) is a function in
consequent. Once the fuzzy structure initialized, the
membership function parameters can be trained by
employing optimization algorithms.
Teaching–learning-based optimization algorithm
(TLBO)
TLBO is a metaheuristic algorithm, recently developed by
Rao et al. (2011) as a method for constrained optimization
problems. The TLBO inspired by the process of teaching
and learning within a classroom works on the effect of
influence of a teacher on learners and learners on each
other. This algorithm comprises two parts: ‘‘teacher phase’’
and ‘‘learner phase.’’ During the teacher phase, a teacher
tries to increase the mean result of the class from the initial
level to his own level (Rao 2015). The algorithm considers
the most knowledgeable learner as the teacher. In this
phase, existing solution updates according to the following
expression:
X0j;k;i ¼ Xj;k;i þ Dj;k;i ð2Þ
where X0j;k;i is the updated value of Xj;k;i in subject j,
learners k, and iteration i. Dj;k;i is the difference between
existing mean result and corresponding result of teacher in
each subject.
Local search of the TLBO occurs during the learner
phase. This phase uses accepted function values at the end
of teacher phase as its own input. In this phase, learners
enhance their knowledge by interacting randomly with
themselves. A learner enhances knowledge of other
learners, when he or she has more knowledge than they do.
The TLBO is a population-based evolutionary algo-
rithm, which uses a population of solutions to proceed to
the global solution (Ganesh and Reddy 2014). It is inter-
esting to note that the TLBO does not require any algo-
rithm-specific parameter. Common controlling parameters,
such as the population size and number of iterations, are
sufficient for its performance (Rao 2015). This ability of
TLBO makes it an efficient tool, over the other algorithms,
especially when dealing with multi-objective optimization
problems (Zuperl and Cus 2016; Rai 2017).
Hybrid TLBO-Fuzzy Inference System (TLBOFIS)
Training of the initial fuzzy inference system may be
assumed as an optimization problem to be solved using
optimization techniques. Firstly, by applying subtractive
clustering, an initial Sugeno fuzzy system is generated.
Then, the TLBO is employed to train the initialized fuzzy
model. Figure 3 illustrates the flowchart of the proposed
hybrid TLBO-Fuzzy Inference System approach (TLBO-
FIS). The methodology may be divided into three stages:
(1) data preparation; (2) initializing fuzzy inference sys-
tem; and (3) optimizing the fuzzy system using TLBO. The
following subsections explain each stage, respectively.
Fig. 2 Basic structure of fuzzy
inference system
J Petrol Explor Prod Technol (2018) 8:143–154 145
123

Data preparation
Here, Electrical Micro Imaging (EMI) logs along with the
conventional well logs from the same intervals were the
used data for initializing fuzzy model. These data were
acquired from five wells drilled into two different hydro-
carbon fields. The study area lies in the Zagros Basin in the
Fars Province of Iran. The first field contains three wells
with recorded well logs ranging in depths between 3050
and 3500 m. In the second field, which includes the other
two wells, studied depths range between 2500 and 2850 m.
Lithology of the logged intervals consists of anhydrite,
bedded dolomite, limestone, and shale, assigned to the
Permo-Triassic Dehram Group.
EMI is a water-based formation-imaging tool, which
performs a qualitative micro-resistivity reading around the
borehole. Six imaging pads of the EMI, in contrast to four-
arm tools, provide more accurate hole volumes and diam-
eter computations (Changxiong 2004).
Available image logs were processed using CIFLog-
GeoMatrix software, in order to obtain static and dynamic
wellbore images. Using these images, several features such
as the natural fractures, bed boundaries, and faults can be
discriminated. Figure 4 displays EMI static and dynamic
images in cross section of a studied well. Commonly,
higher conductivities are illustrated by darker colors;
therefore, the open fractures appear as dark-colored sinu-
soidal features, due to the mud conductivity (Fig. 4).
By processing available image logs, a total number of
132 conductive fractures were detected and their hydraulic
aperture sizes were calculated. In the first studied hydro-
carbon field, fractures show a NEE-SWW dominant strike,
southeast azimuth, and dip inclination ranging between 75�and 85�. Fracture orientations in the second hydrocarbon
field are disordered. Nevertheless, NE–SW strike, mean
azimuth of 110� and mean dip of 78�, is dominant.
Luthi and Souhaite (1990) and Faivre (1993) showed
that in a conductive mud environment, imaging tools
measure the fracture aperture size as follows:
W ¼ c � A � Rbm � R1�b
xo ð3Þ
whereW refers to fracture width (i.e., aperture); Rm and Rxo
indicate the resistivity of mud and shallow rock, respec-
tively; c is tool constant; and b is a value slightly smaller
than 1. Excess current A is caused by the presence of
fracture.
In the literature, various empirical models were pro-
posed in order to relate the mechanical and hydraulic
Fig. 3 Flowchart of the
proposed hybrid TLBOFIS
approach
146 J Petrol Explor Prod Technol (2018) 8:143–154
123

apertures (Renshaw 1995; Zimmerman and Bodvarsson
1996; Li and Jiang 2013). The CIFLog-GeoMatrix com-
putes the average hydraulic aperture as the cubic mean
value of fracture trace aperture.
In the next step, image logs were correlated against
petrophysical well log and responses at the exact depth of
each fracture were specified. In Fig. 5, measured aperture
values are compared against acoustic travel time (DT),
bulk density (RHOB), deep laterolog (LLD), gamma ray
(GR), neutron porosity (NPHI), and photoelectric factor
(PEF) logs. Among the available logs, LLD, NPHI, DT,
and RHOB showed the highest correlations with aperture
size and therefore, they were chosen as the input of the
fuzzy model:
• LLD measures formation deep resistivity and, among
other well logs, has the highest correlation with
aperture size. Generally, wider apertures show lower
resistivities (Fig. 5).
• NPHI tracks hydrogen concentration in the formation
and shows a linear relationship with measured aperture
sizes, as illustrated in Fig. 5.
• DT displays travel time of elastic wave through the
formation rock. Generally, void spaces reduce the
speed of the sound (Serra 2008). Bigger apertures
accompany with slower velocity records.
• RHOB is a record of formation bulk density and is
related to the rock porosity. As seen in Fig. 5, lower
densities imply bigger aperture sizes.
Final data sets, consisting of measured hydraulic aper-
ture and well log responses, were merged and divided into
two groups: a group including 98 sets for training the
model and another group with 34 sets for testing.
In order to remove the effect value dimensions and
achieve a better estimation, all input data were normalized
between 0 and 1. Normalization was performed by the
following expression:
xi;norm ¼ xi �min xið Þmax xið Þ �min xið Þ ð4Þ
where xi is the data point to be normalized and min xið Þ andmax xið Þ are the minimum and maximum values.
Initializing fuzzy inference system
In order to generate the initial fuzzy inference system and
define membership functions, a fuzzy clustering technique
Fig. 4 A cross section of the
studied wells, showing the EMI
static and dynamic images.
Additionally, a conductive
fracture is specified
J Petrol Explor Prod Technol (2018) 8:143–154 147
123

may be used. Subtractive clustering and Fuzzy C-Means
are two basic methods of fuzzy clustering. Here, a sub-
tractive clustering method was employed to determine the
fuzzy rules. In a set of data, subtractive clustering defines
the number of clusters and cluster centers and returns a
fuzzy structure that contains fuzzy if–then rules. This
method eliminates the need of specifying grid resolution, in
which the agreement between the accuracy and computa-
tional complexity must be regarded (Bataineh et al. 2011).
Membership functions define each crisp data with a
degree of membership. The membership functions can
have different forms, such as the triangular, trapezoidal,
and Gaussian. Here, the Gaussian membership function
shows the best fit to the input well logs (Fig. 6). Gaussian
membership function is represented by center and width
values:
lAixð Þ ¼ exp � 1
2
x� ci
ri
� �2" #
ð5Þ
where ci and ri are the mean (center) and standard devia-
tion (width) of the ith fuzzy set, respectively.
In subtractive clustering, cluster radius determines the
range of influence of a cluster. The optimum clustering
Fig. 5 Cross-plots of well logs responses versus the measured hydraulic aperture (H. Aperture) for detected fractures in the studied wells. R2
indicates the coefficient of determination
148 J Petrol Explor Prod Technol (2018) 8:143–154
123

radius can be determined by trial and error. As discussed,
the teaching–learning-based optimization algorithm is
needless of any algorithm-specific parameter. However,
common controlling parameters such as the population size
and number of iterations can be modified in order to
enhance the model accuracy. TLBO considers the number
of learners as the population size (Rao 2015).
Optimizing the fuzzy system using TLBO
By training an initial fuzzy inference system, its member-
ship function parameters are adjusted until the optimal
solution is achieved. This tuning process can be performed
utilizing various optimization algorithms. Sugeno fuzzy
inference system trained with the neuro-adaptive learning
was introduced by Jang (1993) as the adaptive neuro-fuzzy
inference system (ANFIS). In this study, the optimization
of initial Sugeno fuzzy system was performed using TLBO,
rather than the classic neuro-adaptive method. The opti-
mization process was repeated until a solution with desired
satisfaction was achieved or the maximum number of
iterations was reached. Figure 7 displays root-mean-square
errors (RMSE) obtained by each iteration of hybrid
TLBOFIS. Accordingly, RMSE declined mostly in the
early iterations.
Fig. 6 Histograms showing the fitted Gaussian membership function to the RHOB, NPHI, DT, and LLD well logs
Fig. 7 Acquired RMSE by each iteration epoch of TLBOFIS
(clustering radius = 0.6) in training data
J Petrol Explor Prod Technol (2018) 8:143–154 149
123

Results and discussion
By applying subtractive clustering, a Sugeno fuzzy infer-
ence system was initialized. The cluster radius was varied
gradually from 0.1 to 1 by intervals of 0.1, in order to find
the optimal radius. As given in Table 1, clustering with a
radius of 0.6 provides the hybrid TLBOFIS with the
highest accuracy. For evaluating the method, several opti-
mization algorithms were employed to train the fuzzy
structure using the same database. These algorithms con-
tain Neuro-Fuzzy (ANFIS), Genetic Algorithm (GA),
Artificial Bee Colony (ABC), and Ant Colony Optimiza-
tion (ACO). For all these algorithms, including TLBO, the
population size and maximum number of iterations were
considered as 800 and 350, respectively. Associated
Table 1 Correlation coefficients (R), RMSE, and number of fuzzy
rules achieved by each clustering radius
Clustering radius Fuzzy rules RMSE R
0.1 92 0.0056 0.7999
0.2 65 0.0052 0.8041
0.3 39 0.0049 0.8357
0.4 11 0.0050 0.8200
0.5 7 0.0044 0.8668
0.6 6 0.0044 0.8735
0.7 4 0.0050 0.8546
0.8 2 0.0045 0.8665
0.9 2 0.0048 0.8581
1 2 0.0055 0.7816
The optimum radius and corresponding parameters are bolded
Table 2 Algorithm-specific parameters and the highest accuracy achieved by each method, in test data
Used method RMSE R Algorithm-specific parameters
ABC-FIS 0.0055 0.7902 Number of onlooker bees = 800
Trial limit (L) = 600
Acceleration coefficient upper bound (a) = 1
ACOFIS 0.0059 0.0804 Sample size = 400
Intensification factor (q) = 0 .5
Deviation–distance ratio (zeta) = 1
ANFIS 0.0061 0.7556 Optimization method = hybrid
GA-FIS 0.0048 0.8414 Crossover percentage (pc) = 0.5
Number of parents (nc) = 400
Mutation percentage (pm) = 0.6
Number of mutants (nm) = 480
Mutation rate (mu) = 0.25
Selection pressure (beta) = 6
Gamma = 0.8
TLBOFIS 0.0044 0.8735 Needless
Fig. 8 A comparison between the measured hydraulic aperture and TLBOFIS predicted values for fractures in the test datasets
150 J Petrol Explor Prod Technol (2018) 8:143–154
123

Fig. 9 Cross-plots showing correlation between the measured and estimated values of aperture size, for each methods
J Petrol Explor Prod Technol (2018) 8:143–154 151
123

algorithm-specific parameters and the highest accuracy of
each method are presented in Table 2.
Estimated hydraulic aperture (by TLBOFIS method) and
measured values (from EMI log) are compared in Fig. 8.
Integration of the fuzzy inference system with TLBO
resulted in a correlation coefficient of 0.8735 and RMSE
equal to 0.0044 that significantly improved compared to the
other methods. Cross-plots of all methods are illustrated in
Fig. 9.
In the next step, a new wellbore from a different
hydrocarbon field (the third field) was selected to evaluate
the model performance in an oil-based environment. The
field was located in Fars Province in southern territories of
Iran. Mud system used for drilling was oil based, with an
oil–water ratio of 70/30. The studied well contained both
the OBMI and UBI image logs and a full set of conven-
tional well logs. The RCAL and SCAL core test data, also,
were available for recovered cores from a 50-m interval.
Fig. 10 Processed image logs, conventional well logs, and estimated hydraulic aperture for each fracture plane. The last column shows the
comparison between core permeability and derived values
152 J Petrol Explor Prod Technol (2018) 8:143–154
123

The cored interval lies in the Upper Dalan Formation (of
Upper Permian age) with a lithology consisting of car-
bonate and anhydrite.
By processing available image logs on the cored inter-
val, a total number of seven intersected fractures were
detected. Afterward, well log records (RHOB, NPHI, DT,
and LLD) at the exact depth of each fracture were speci-
fied. By normalization of input data, the developed
TLBOFIS model was applied and the hydraulic aperture
size of intersected fractures was estimated. The core per-
meability to the air (from SCAL data) was employed in
order to relate estimated values to real measurements.
Using Eq. (1), the estimated hydraulic aperture was con-
verted to permeability values. Figure 10 illustrates the
processed image logs and petrophysical well logs in the
studied interval. The estimated hydraulic aperture and
permeability for each fracture plane are also presented.
Comparing the measured permeability (from core test data)
and estimated permeability (from cubic law) showed a
coefficient of determination (R2) equal to 0.82 that indi-
cates a strong relationship.
Conclusion
Aperture size is a key parameter to indicate the influence of
natural fractures on reservoir performance, and borehole
imaging is the basic method for its measurement. In oil-
based mud environment, however, image logs are unable to
specify this parameter. In this paper, a novel method was
introduced to estimate hydraulic aperture of detected
fractures using conventional well logs. Required well logs
are usually available in most of the drilled wells. The
proposed method utilized the TLBO algorithm, in order to
optimize an initial Sugeno fuzzy inference system. The
TLBO does not need of any algorithm-specific parameter,
and this feature makes it a useful tool for optimization
problems. Examination of the developed model, in both
conductive and resistive mud environments, confirmed that
the estimated values are in a good agreement with real
measurements. The proposed hybrid method, as an easy-
going tool, may also be employed to estimate other reser-
voir parameters.
Acknowledgements The authors would like to appreciate Dr. Ali
Kadkhodaie-Ilkhchi and Christian Klimczak for helping during the
research.
Open Access This article is distributed under the terms of the
Creative Commons Attribution 4.0 International License (http://
creativecommons.org/licenses/by/4.0/), which permits unrestricted
use, distribution, and reproduction in any medium, provided you give
appropriate credit to the original author(s) and the source, provide a
link to the Creative Commons license, and indicate if changes were
made.
References
Ahmadi MA (2011) Prediction of asphaltene precipitation using
artificial neural network optimized by imperialist competitive
algorithm. J Petrol Explor Prod Technol 1(2):99–106
Alvarado M, Manrique E (2010) Enhanced oil recovery: an update
review. Energies 3:1529–1575
Anifowose FA, Labadin J, Abdulraheem A (2017) Hybrid intelligent
systems in petroleum reservoir characterization and modeling:
the journey so far and the challenges ahead. J Petrol Explor Prod
Technol 7(1):251–263. doi:10.1007/s13202-016-0257-3
Bataineh KM, Najia M, Saqera M (2011) A comparison study
between various fuzzy clustering algorithms. Jordan J Mech Ind
Eng 5(4):335–343
Bishop K (2015) Mechanical stratigraphy of the Vaca Muerta
Formation, Neuquen Basin, Argentina. M.Sc. Thesis, Colorado
School of Mines, USA
Boro H, Rosero E, Bertotti G (2014) Fracture-network analysis of the
Latemar Platform (northern Italy): integrating outcrop studies to
constrain the hydraulic properties of fractures in reservoir
models. Pet Geosci 20:79–92
Changxiong W (2004) EMI log evaluation report (Internal report).
Geoscience Center, Ahwaz, Iran
Cheung P, Hayman A, Laronga R, Cook G, Flournoy G, Goetz
Marshal M, Hansen S, Lamb M, Li B, Larsen M, Orgren M,
Redden J (2001) A clear picture in oil-base muds. Oilfield Rev
13(4):2–27
Dardashti AF, Ajalloeian R (2015) Evaluation of hydraulic aperture
of the joints of Behesht Abad Dam foundation, Iran. Open J Geol
5:375–382
El Ouahed AK, Tiab D, Mazouzi A (2005) Application of artificial
intelligence to characterize naturally fractured zones in Hassi
Messaoud Oil Field, Algeria. J Petrol Sci Eng 49(3):122–141
Faivre O (1993) Fracture evaluation from quantitative azimuthal
resistivity. In: Society of Petroleum Engineering, 68th annual
technical conference and exhibition, Houston, Texas,
pp 179–192
Fossen H (2010) Structural geology. Cambridge University Press,
Cambridge
Ganesh BS, Reddy AS (2014) Teaching learning based optimization
for economic dispatch problem with valve point loading effect.
Int J Educ Appl Res 4(1):9–15
Golf-Racht TD (1982) Fundamentals of Fractured Reservoir Engi-
neering. Development in Petroleum Science, no 12, Elsevier
Scientific Pub Co, Amsterdam
Ishibashi T, Watanabe N, Hirano N, Okamoto A, Tsuchiya N (2012)
Experimental and numerical evaluation of channeling flow in
fractured type of geothermal reservoir. In: Proceedings of 37th
workshop on geothermal reservoir engineering, Stanford Univer-
sity, Stanford, California, pp 759–766
Ja’fari A, Kadkhodaie-Ilkhchi A, Sharghi Y, Ghanavati K (2012)
Fracture density estimation from petrophysical log data using the
adaptive neuro-fuzzy inference system. J Geophys Eng
9:105–114. doi:10.1088/1742-2132/9/1/013
Jang JSR (1993) ANFIS: adaptive-network-based fuzzy inference
system. IEEE Trans Syst Man Cybern 23(3):665–685
Klimczak C, Schultz RA, Parashar R, Reeves DM (2010) Cubic law
with aperture-length correlation: implications for network scale
fluid flow. Hydrogeol J 18:851–862
Klir GJ, Yuan B (1995) Fuzzy sets and fuzzy logic: theory and
applications. Prentice Hall, Englewood Cliffs
Kothavade SV, Deshpande SP (2016) Teaching learning based
optimization algorithm to solve assembly line balancing prob-
lem. Int J Curr Eng Technol 6(5):1558–1561
J Petrol Explor Prod Technol (2018) 8:143–154 153
123

Li B, Jiang Y (2013) Quantitative estimation of fluid flow mechanism
in rock fracture taking into account the influences of JRC and
Reynolds number. J MMIJ 129:479–484 (in Japanese)Luthi SM, Souhaite P (1990) Fracture apertures from electrical
borehole scans. J Geophys 55(7):821–833
Mamdani EH, Assilian S (1975) An experimental in linguistic
synthesis with a fuzzy logic control. Int J Man Mach Stud 7:1–13
Matlab User’s Guide (2013) Fuzzy logic toolbox. Matlab CD-ROM.
The Mathworks, Inc
Nakashima Y, Kikuchi T (2007) Estimation of the apertures of water-
saturated fractures by nuclear magnetic resonance well logging.
Geophys Prospect 55(2):235–254
Nelson RA (2001) Geologic analysis of naturally fractured reservoirs,
2nd edn. Butterworth-Heinemann, Gulf Professional Publishing,
Oxford, p 332
Rai DP (2017) Comments on ‘‘A note on multi-objective improved
teaching-learning based optimization algorithm (MO-ITLBO)’’.
Int J Ind Eng Comput 8(2):179–190. doi:10.5267/j.ijiec.2016.11.
002
Ramandi HL, Armstrong RT, Mostaghimi P (2016) Micro-CT image
calibration to improve fracture aperture measurement. Case Stud
Nondestruct Test Eval. doi:10.1016/j.csndt.2016.03.001 (inpress)
Rao RV (2015) Review of applications of TLBO algorithm and a
tutorial for beginners to solve the unconstrained and constrained
optimization problems. Decis Sci Lett 5:1–30
Rao RV, Savsani VJ, Vakharia DP (2011) Teaching–learning-based
optimization: a novel method for constrained mechanical design
optimization problems. Comput-Aided Des 43(3):303–315
Renshaw CE (1995) On the relationship between mechanical and
hydraulic apertures in rough-walled fractures. J Geophys Res
100:24629–24636
Sarkar S, Toksoz MN, Burns D (2004) Fluid flow modeling in
fractures. Massachusetts Institute of Technology, Earth, Atmo-
spheric and Planetary Sciences, Cambridge
Satapathy SC, Naik A (2015) A modified teaching-learning-based
optimization (mTLBO) for global search. Recent Pat Comput Sci
6(1):60–72
Serra O (2008) Well logging handbook. Editions Technip, Paris
Shalaby MR, Islam MA (2017) Fracture detection using conventional
well logging in carbonate Matulla Formation, Geisum oil field,
Southern Gulf of Suez, Egypt. J Petrol Explor Prod Technol.
doi:10.1007/s13202-017-0343-1
Speight JG (2016) Introduction to enhanced recovery methods for
heavy oil and tar sands, 2nd edn. Gulf Professional Publishing,
Elsevier, Oxford
Sugeno M (1985) Industrial applications of fuzzy control. Elsevier
Science Publisher, North Holland
Tiab D, Donaldson EC (2015) Petrophysics: theory and practice of
measuring reservoir rock and fluid transport properties, 4th edn.
Gulf Professional Publishing, Elsevier, Oxford
Tsukamoto Y (1979) An approach to fuzzy reasoning method. In:
Gupta MM, Ragade RK, Yager RR (eds) Advances in fuzzy sets
theory and applications. North-Holland, Amsterdam, pp 137–149
Wang B, Wang X, Chen Z (2013) A hybrid framework for reservoir
characterization using fuzzy ranking and an artificial neural
network. Comput Geosci 57:1–10
Watanabe N, Hirano N, Tsuchiya N (2008) Determination of aperture
structure and fluid flow in a rock fracture by high-resolution
numerical modeling on the basis of a flow-through experiment
under confining pressure. Water Resour Res. doi:10.1029/
2006WR005411
Witherspoon PA, Wang JSY, Iwai K, Gale JE (1980) Validity of
cubic law for fluid flow in a deformable rock fracture. Water
Resour Res 16:1016–1024
Wu PT (2013) Fracture aperture estimation using multi-axial
induction tool. Filed by Schlumberger Technology Corporation,
Sugar Land, TX (US), as Appl. No. 13/784,153
Zadeh LA (1965) Fuzzy sets. Inf Control 8:338–353
Zimmerman RW, Bodvarsson GS (1996) Hydraulic conductivity of
rock fractures. Transp Porous Media 23:1–30
Zuperl U, Cus F (2016) End milling optimization using teaching-
learning-based optimization algorithm with cutting force model.
Proc Manuf Syst 11(2):57–62
Publisher’s Note
Springer Nature remains neutral with regard to jurisdictional claims in
published maps and institutional affiliations.
154 J Petrol Explor Prod Technol (2018) 8:143–154
123