estimation of global inventories of radioactive waste and ... · radioactive waste and other...
TRANSCRIPT
IAEA-TECDOC-1591
Estimation of Global Inventories ofRadioactive Waste and Other
Radioactive Materials
June 2007
IAEA-TECDOC-1591
June 2008
Estimation of Global Inventories ofRadioactive Waste and Other
Radioactive Materials
The originating Section of this publication in the IAEA was:
Waste and Environment Safety Section International Atomic Energy Agency
Wagramer Strasse 5 P.O. Box 100
A-1400 Vienna, Austria
ESTIMATION OF GLOBAL INVENTORIES OF RADIOACTIVE WASTE AND OTHER RADIOACTIVE MATERIALS
IAEA, VIENNA, 2008 IAEA-TECDOC-1591
ISBN 978–92–0–105608–5 ISSN 1011–4289
© IAEA, 2008
Printed by the IAEA in Austria June 2008
FOREWORD
A variety of nuclear activities have been carried out in the second part of the twentieth century for different purposes.
Initially the emphasis was on military applications, but with the passage of time the main focus of nuclear activities has shifted to peaceful uses of nuclear energy and to the use of radioactive material in industry, medicine and research. Regardless of the objectives, the nuclear activities generate radioactive waste.
It was considered worthwhile to produce a set of worldwide data that could be assessed to evaluate the legacy of the nuclear activities performed up to the transition between the twentieth and the twenty first century.
The assessment tries to cover the inventory of all the human produced radioactive material that can be considered to result from both military and civilian applications. This has caused remarkable difficulties since much of the data, particularly relating to military programmes, are not readily available. Consequently the data on the inventory of radioactive material should be considered as order-of-magnitude approximations. This report as a whole should be considered as a first iteration in a continuing process of updating and upgrading.
The accumulations of radioactive materials can be considered a burden for human society, both at present and in the future, since they require continuing monitoring and control. Knowing the amounts and types of such radioactive inventories can help in the assessment of the relative burdens. Knowledge of the national or regional radioactive waste inventory is necessary for planning management operations, including the sizing and design of conditioning, storage and disposal facilities. A global inventory, either of radioactive waste or of other environmental accumulations of radioactive material, could be used to provide a perspective on the requirements and burdens associated with their management, by means of comparisons with the burdens caused by other types of waste or other environmental threats.
The IAEA officer responsible for this publication was K. Hioki of the Division of Radiation, Transport and Waste Safety.

EDITORIAL NOTE
The use of particular designations of countries or territories does not imply any judgement by the publisher, the IAEA, as to the legal status of such countries or territories, of their authorities and institutions or of the delimitation of their boundaries.
The mention of names of specific companies or products (whether or not indicated as registered) does not imply any intention to infringe proprietary rights, nor should it be construed as an endorsement or recommendation on the part of the IAEA.
CONTENTS
1. INTRODUCTION ............................................................................................................ 1 1.1. Background......................................................................................................... 1 1.2. Objective............................................................................................................. 2 1.3. Scope .................................................................................................................. 2 1.4. Structure.............................................................................................................. 3
2. DERIVATION OF THE GLOBAL INVENTORY ......................................................... 3 2.1. Mine and mill tailings......................................................................................... 5 2.2. Waste from nuclear power generation................................................................ 8
2.2.1. Low and intermediate level waste .......................................................... 9 2.2.2. Spent nuclear fuel and high level waste................................................ 11 2.2.3. Decommissioning waste ....................................................................... 16 2.2.4. Remediation waste................................................................................ 16
2.3. Waste from institutional activities .................................................................... 17 2.3.1. High level waste.................................................................................... 17 2.3.2. Low and intermediate level waste ........................................................ 17 2.3.3. Decommissioning waste ....................................................................... 18
2.4. Defence and weapon related waste................................................................... 18 2.4.1. Published information on waste quantities ........................................... 19 2.4.2. Waste quantities derived from the plutonium inventory ...................... 19 2.4.3. Reprocessing and high level waste ....................................................... 20 2.4.4. Transuranic waste ................................................................................. 22
2.5. Environmental inventories of radioactive material .......................................... 23
3. SUMMARY AND CONCLUSIONS ............................................................................. 23 3.1. Summary of waste inventories ......................................................................... 23 3.2. Conclusions ...................................................................................................... 25
REFERENCES......................................................................................................................... 27
ABBREVIATIONS.................................................................................................................. 29
ANNEX I: WASTE CLASSES .......................................................................................... 31
ANNEX II: DETAILS ON CALCULATIONS AND INPUT NUMERICAL DATA........ 32 II-1. Basic documents ............................................................................................... 32 II-2. Uranium mill tailings due to weapon grade plutonium .................................... 33 II-3. The inventory of liquid HLW from defence programmes................................ 33 II-4. Waste data about specific countries.................................................................. 33
II-4.1. France.................................................................................................... 33 II-4.2. Germany................................................................................................ 33 II-4.3. United States of America...................................................................... 34
ANNEX III: ENVIRONMENTAL INVENTORIES OF RADIOACTIVE MATERIAL .... 36 III-1. Releases to the environment from past operations ........................................... 36 III-2. Sites contaminated by accidental releases ........................................................ 37 III-3. Weapon test sites .............................................................................................. 38
III-3.1. United States of America...................................................................... 38 III-3.2. Kazakhstan............................................................................................ 39

III-3.3. Russian Federation................................................................................ 39 III-3.4. United Kingdom ................................................................................... 40 III-3.5. France.................................................................................................... 40 III-3.6. China..................................................................................................... 40
III-4. Deposition from atmospheric testing................................................................ 41 III-5. Summary of environmental accumulations ...................................................... 41
CONTRIBUTORS TO DRAFTING AND REVIEW ............................................................. 45
1. INTRODUCTION
1.1. BACKGROUND
The production of electricity by nuclear means has created radioactive residues which have to be carefully managed and accounted for because they are potentially hazardous to human health. Similar residues have been generated as a result of the defence programmes in several countries. The residues include solid and liquid radioactive waste from civilian nuclear power production and from the production of nuclear weapons and residues from the above surface or underground testing of nuclear weapons.
In most countries, high level solid radioactive waste that is the product of solidification of the liquid waste generated by the first extraction cycle in the reprocessing of spent fuel, including spent fuel that is declared to be waste, is currently being stored in purpose-built stores pending disposal deep underground. In many countries, some lower activity waste containing mainly comparatively short lived radionuclides is being disposed of in near surface repositories. Liquid radioactive waste is generally converted to a solid form suitable for disposal, but there are some exceptions.
In some cases, mainly in the past, some liquid radioactive waste, considered too active for environmental dispersal, in the absence of safer management solutions has been pumped underground within enclosed aquifers or mixed with cement and injected as sludge in a low-permeability formation. Cases exist where high level waste (HLW) and higher activity low and intermediate level waste (LILW) in liquid form have been stored in near surface underground tanks and, after some decades, are still being kept in that form.
Gaseous and liquid waste containing very low levels of radionuclides are discharged to the environment in the same way as other low level industrial pollutants. This practice is subject to close regulatory control and environmental monitoring to ensure that the hazards to the public are minimal.
Finally there are sites, either above or below the ground, used in the past for either nuclear weapon testing or other purposes, or with significant amounts of radioactive materials, , that are considered to require continuing surveillance and monitoring to control access to the radioactive material.
Accumulations of radioactive material can be considered a burden for human society, both at present and in the future, since they require some level of continuing control. Knowing the amounts and types of such radioactive inventories can help in the assessment of the relative burdens. Knowledge of the national or regional radioactive waste inventory is necessary for the planning of management operations, including the sizing and design of processing, storage and disposal facilities. A global inventory, of radioactive waste and other environmental accumulations of radioactive material, could be used to provide a perspective on the requirements associated with their management, by means of comparisons with other types of waste or other environmental threats.
Radioactive waste and other environmental accumulations of radioactive material have been and are being generated by various activities, which can be grouped in two main categories: civilian applications and military or defence programmes. In some countries and in some applications, the distinction is not always clear.
1
Efforts are being made to collect waste inventory data from various countries. The IAEA is involved in such efforts; for example the Net Enabled Waste Management Database (NEWMDB) [1] provides a collection of national data on solid radioactive waste. Information on national radioactive waste inventories is also becoming available as a result of the reporting mechanism within the Joint Convention on the Safety of Spent Fuel Management and on the Safety of Radioactive Waste Management [2]. However, the information provided by these two sources is not complete and, as far as the Joint Convention is concerned, access to some data may be restricted. A few countries do not yet subscribe to either the NEWMDB or the Joint Convention. However most countries with important arisings of radioactive waste subscribe to the NEWMDB, which is therefore a reliable and up to date source of information on the inventories of radioactive waste generated by commercial and institutional activities in the nuclear sector. As far as defence waste is concerned, the information provided by the NEWMDB is less comprehensive, but the situation is improving in that area as well.
Other IAEA data collection mechanisms in the field of interest include the database on radioactive waste disposed of at sea [3], a new database on gaseous and liquid discharges of radioactive material to the environment [4] and the Directory of Radioactively Contaminated Sites [5].
In the past, reliable information on the radioactive waste production of military or defence programmes has been rather difficult to obtain. This difficulty may continue in the future; for example, military waste is not included within the scope of the Joint Convention. In some countries, defence waste is not even subject to the normal controls of the national regulatory authorities or may be mixed with the waste from civilian uses.
Information on other environmental accumulations of radioactive material, such as those at nuclear test sites and locations of past disposal operations of liquid waste, is also not always complete.
It is evident that, globally, information on radioactive waste and on other radioactive residues in the environment is not complete. For this reason an estimation approach has been adopted in this report, which intends to provide an approximate but comprehensive assessment of the global inventory of radioactive waste and other human generated accumulations of radioactive material in the environment. The inventory derived in this publication should be considered the result of a first iteration. More reliable estimates may become available in the coming years as a result of progress within the various international data collection mechanisms.
With minor exceptions, the waste arisings estimated in this publication have been grouped in the waste classes defined by the IAEA classification as shown in Annex I.
1.2. OBJECTIVE
The main objective of this report is to provide estimates of the worldwide accumulations of different categories of radioactive material generated from both civilian applications of nuclear technologies and defence programmes.
1.3. SCOPE
The scope of this report includes all human generated accumulations of radioactive material generated within the nuclear sector and expected to require some form of continuing control. Spent fuel declared to be waste is included in the inventory within the category comprising
2

also HLW. Waste generated by civilian applications and defence programmes is within the scope of the report.
Environmental accumulations of radioactive material resulting from nuclear explosions or other activities that have caused contaminated sites requiring continuing care are also within the scope of the report, even if obtaining reliable data about such accumulations is a very difficult task. Waste containing naturally occurring radioactive material (NORM), which is generated by activities outside the nuclear sector, such as mining and processing of phosphate minerals and oil extraction, is not included within the scope of this report.
As far as possible, the inventories include data on mass, volume, radioactivity and form of the material. Regarding the radionuclide content of the material, which has been included whenever possible, it is important to keep in mind that it is a time-dependent property which, for many radionuclides, is subject to relatively rapid change and allowance may have to be made for radioactive decay when using the data provided here.
1.4. STRUCTURE
Section 2 describes how these estimates of the global inventory of radioactive waste have been produced. Section 3 contains a short summary of the results and concluding remarks. A table summarizing the IAEA waste classification used in this publication is included in Annex I. Some details on calculations and input numerical data are presented in Annex II. Preliminary data on environmental accumulations of radioactive material are presented in Annex III.
2. DERIVATION OF THE GLOBAL INVENTORY
It is the purpose of this publication to produce reasonable estimates, accurate to within a factor of two where possible, of the global inventory of radioactive waste and other radioactive material in the environment. For this purpose a number of different estimation approaches have been adopted.
Figure 1 shows the general fuel production flowchart for light water reactors, while Fig. 2 shows the material balance for the annual production of 1 GWe.
Source:WISE Uranium Project
FIG. 1. Nuclear fuel production chain for light water reactors [31].
3

For some types of radioactive waste, the global inventory has been estimated on the basis of more than one line of reasoning. The results can show substantial differences, indicating the unavoidable uncertainty of estimates relying on broad, simplifying assumptions. Other factors contributing to the uncertainty include the lack of complete information from the early days of the nuclear industry and the reluctance of some Member States to provide data, particularly on defence activities.
Most values reported in the publication are based on sources where the activity was expressed in curies (Ci) and conversion has been necessary in order to uniformly report in terms of bequerels (Bq).
FIG. 2. Nuclear fuel chain material balance for electricity production of 1 GWyear(e)[31].
Source: WISE
Uranium
Project
4
2.1. MINE AND MILL TAILINGS
The initial step in the nuclear fuel cycle is the mining of uranium or thorium ores that are then used to produce nuclear fuel. However, other radioactive products may also be separated from the ores, such as radium, for a variety of applications. Mining activities lead to the extraction of ore, which is sufficiently rich to justify processing, and also of relatively large amounts of material that contains uranium or thorium in such small quantities that further treatment is not economically justified. The mined material not subjected to additional processing constitute the mine residues generally accumulated as waste piles, usually in proximity to the mines. Mine residues resulting from the mining of uranium and thorium ores generally contain some radioactive components and require to be managed in order to prevent their dispersion through natural processes which could cause harm to humans living in the vicinity of the facilities.
The amounts of mine residues in comparison with the amounts of mill tailings are highly variable as a result of the mining method (in situ leaching, underground mining, open pit mining) and of the geological properties of the ore deposits. In uranium leaching operations almost no solid mine residues are generated, while in some open pit mines the production of mine residues is very large. In Fig. 2 the indicated ratio between mine residues and mill tailings is about five. In other sources the amounts of mine residues is indicated to be similar to the amount of mill tailings, which is probably the case for many underground mining operations. In this publication, for the sake of simplicity and since the assumption has a minor impact on the results of the assessment, equal amounts of the two types of waste have been assumed.
Radioactive waste generated by mining and milling of uranium and thorium ores _ and also through the extraction and/or processing of other material that happens to be rich in naturally occurring radioactive material (NORM), such as phosphate minerals, mineral sands, some gold bearing rocks, coal, hydrocarbons, etc. contains long lived radionuclides with relatively low concentrations. The very large volume of this type of waste makes it impractical, if not impossible, to dispose of it in deep geological repositories, as the longevity of the associated radiological hazard would otherwise indicate. Waste considered being radioactive but containing only naturally occurring radioactive material is defined as NORM waste. 1
The richer ores from which uranium or thorium are to be separated are sent to mills for treatment, generally consisting of crushing and chemical processing. Uranium mills, depending on the characteristics of the ore, use either an acid or an alkaline leach process to recover uranium. After removal of the uranium, the residuals, the mill tailings, contain little of the parent nuclide of the decay chain of the mined element, but they still contain most of its decay products. The radioactive matter in uranium mill tailings is primarily due to the decay chain of 230Th, which is the daughter of 234U and is not extracted by the chemical treatment process. 230Th has a half-life of about 80 000 years. The shorter half-life daughter products will, of course, eventually build back up to the equilibrium activity. Some of the daughter products may be more susceptible to leaching and off gassing from the tailings than from the original ore. In addition, mill tailings contain significant amounts of hazardous chemicals, including heavy metals such as copper, arsenic, molybdenum and vanadium; these need to be considered in assessing the safety of planned management options.
1 Data on the inventory of NORM waste generated by activities outside the nuclear sector, either on the global or national scale, are not readily available and/or reliable. The arisings of NORM waste generated by industrial activities outside the nuclear sector are not included in the estimates produced in this publication.
5
In the early days of uranium milling, the resulting waste was generally disposed of in low elevation areas of the site. The usual procedure was to let process water carry the tailings to the disposal areas, which were often bounded by dams. The result of the procedure was the creation of disposal ponds that, with continuing accumulation and evaporation, were eventually transformed into piles. Even when piles started to be stabilized and covered, in consideration of the longevity of the hazard, the results were not always entirely satisfactory. Consequently, many old disposal sites of uranium mine and mill tailings are now the objects of environmental restoration programmes or have already been remediated.
The amounts of mine and mill tailings accumulated worldwide are not known in detail, since this information is not reported by all Member States in a consistent and reliable way. However, estimates of the inventory of uranium mining and milling waste can be produced from consideration of the data on global uranium production. No equivalent data on thorium production are available, but the extraction of thorium has been relatively small in comparison with uranium. An additional uncertainty associated with such estimates is due to the fact that average uranium concentrations in mined ores has to be used to calculate the inventory of both mine and mill tailings. Since these values are not always available, the resulting average concentrations used to derive the amounts of tailings from the reported amounts of produced uranium are necessarily uncertain. Further, the values are distorted by the fact that early use of uranium in the US was largely with imported ores of higher quality. Additionally, the greater use of in situ leaching techniques has reduced the production of tailings. Finally, new mining techniques including the freeze drill system and the mining of higher grade ores has resulted in smaller mill tailings production [6]. The utilization of down-blended enriched weapons uranium and the use of mixed weapons plutonium and natural uranium has further complicated the picture. The vagaries of the uranium market including price changes has also influenced the amount of uranium mined. Therefore, estimations of future production are very uncertain.
The total amount of uranium produced worldwide up to the year 2004, is approximately 2.2 million tonnes2 [6].
Specific data regarding accumulated inventories of uranium tailings in three Member States are reported below. Consideration of such data in relation to the total production of uranium in the US and Australia allows average ratios between tailings and produced uranium to be derived. Up to 2002, the US and Canada dominated the production of uranium with approximately 1/6 of the world total each [6]. In the years 2002 to 2004, Canada produced approximately 30 % of the world total and Australia approximately 20 % [6]. In recent years, Canada has mined higher grade ores and so for legacy waste, it was judged to be most appropriate to use only the Australian and US data.
In the late 1990s, there were two uranium mines operating in Australia: Ranger in the Northern Territory and Olympic Dam in South Australia. Together they generated about 3 million tonnes per year of tailings, containing about 70% of the radioactivity originally present in the ore - including almost all of the 230Th and 226Ra. The total quantity of tailings accumulated in Australia at that time was about 50 million tonnes, resulting from a total uranium production of about 70 000 tonnes.
In the United States of America, the accumulation of commercial mill tailings, generated up to the end of 1996, amounts to about 190 million tonnes with a volume of about 120 million m3 [7]. To estimate the accumulation of uranium mine and mill tailings generated by defence 2 Tonne is metric ton, abbreviated also as MT in other sections of the report.
6
activities in the USA, a possible approach is to apply the estimated production of tailings per warhead to the total number of warheads produced in the country. Using the published estimates of 2000 tonnes of both mine and mill tailings for single warhead and 17 000 as the total number of warheads produced, about 34 million tonnes each of mine and mill tailing can be assumed to have been generated by defence programmes 3 [8]. Adding this amount to the estimated production of commercial mill tailings gives a total close to 220 million tonnes. Accepting the assumption used in [8], that mine tailings amounts are roughly the same as mill tailings, it is possible to estimate that about 220 million tonnes of mine residues exist in proximity to the mines.
The total historical uranium production in the USA, up to the end of 1992, is reported in [9] to be about 339 000 tonnes. The subsequent uranium production in the USA is irrelevant for this estimate, since, in 1993, traditional uranium mining was abandoned in favour of in situ leaching. In the late 90s, four leach facilities were in operation [6]. The leach solutions are processed directly to extract uranium, eliminating the need for milling activities. In situ leaching presents the significant advantage of eliminating the production of tailings, however, it still presents environmental problems, mainly related to the management of contaminated water.
Most of Canada’s uranium, through 1996, came from Blind River/Elliot Lake, Ontario and the Athabasca Basin in Saskatchewan. Now, all the production is in underground mines located within the Athabasca Basin.
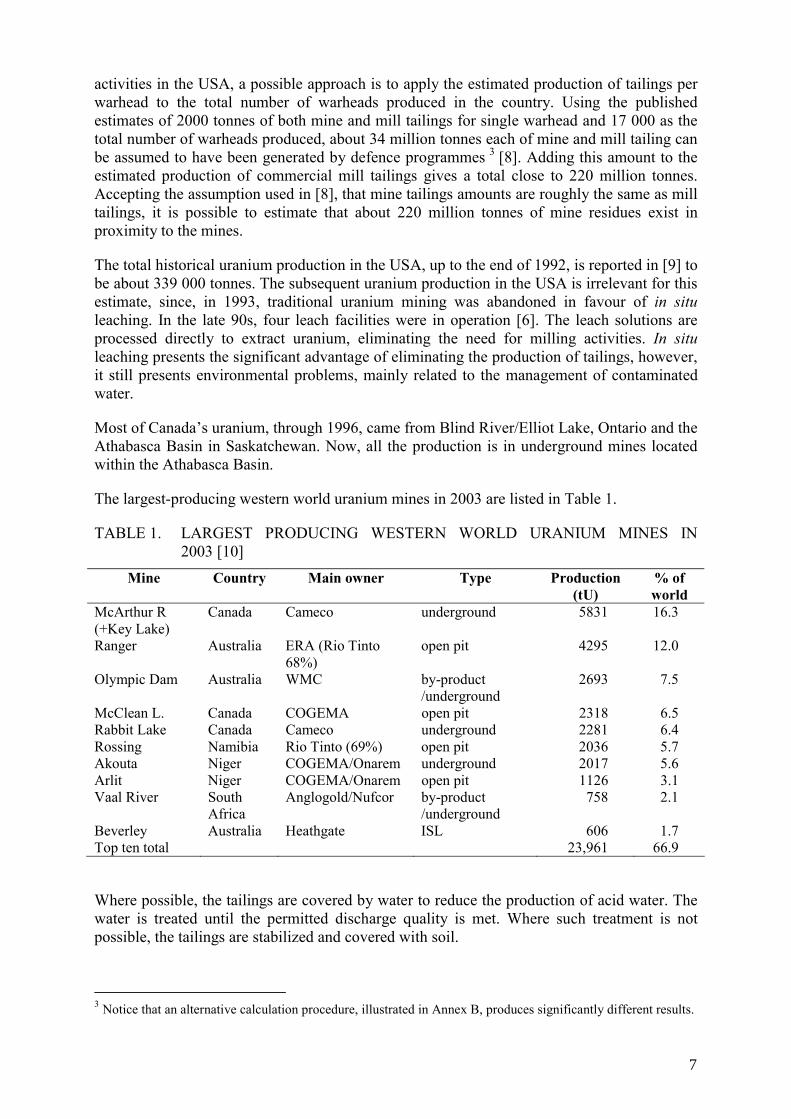
The largest-producing western world uranium mines in 2003 are listed in Table 1.
TABLE 1. LARGEST PRODUCING WESTERN WORLD URANIUM MINES IN 2003 [10]
Mine Country Main owner Type Production (tU)
% of world
McArthur R (+Key Lake)
Canada Cameco underground 5831 16.3
Ranger Australia ERA (Rio Tinto 68%)
open pit 4295 12.0
Olympic Dam Australia WMC by-product /underground
2693 7.5
McClean L. Canada COGEMA open pit 2318 6.5 Rabbit Lake Canada Cameco underground 2281 6.4 Rossing Namibia Rio Tinto (69%) open pit 2036 5.7 Akouta Niger COGEMA/Onarem underground 2017 5.6 Arlit Niger COGEMA/Onarem open pit 1126 3.1 Vaal River South
Africa Anglogold/Nufcor by-product
/underground 758 2.1
Beverley Australia Heathgate ISL 606 1.7 Top ten total 23,961 66.9
Where possible, the tailings are covered by water to reduce the production of acid water. The water is treated until the permitted discharge quality is met. Where such treatment is not possible, the tailings are stabilized and covered with soil.
3 Notice that an alternative calculation procedure, illustrated in Annex B, produces significantly different results.
7
Consideration of the data for Australia allows a uranium to mill tailings ratio of about 0.15% to be estimated, while the USA data give a ratio of 0.17% [6]. Despite the unavoidable uncertainties, these ratios are related to the average grade of the ore processed in the countries. The data in Figure 2 show a ratio of 0.2%. The application of one of such ratios to the worldwide uranium production to estimate the total inventory of tailings is undoubtedly an oversimplification leading to an uncertain result, however the resulting uncertainty is of relatively minor concern in consideration of the objectives of the estimates. It is assumed that an estimate of worldwide tailings accumulation based on a ratio (uranium/mill tailings) of 0.15% and on a total uranium production, up to the year 2000, of 1 900 000 tonnes should not be in error by more than a factor of 2. Assuming also the quantity of mine residues to be equal to that of mill tailings, the estimated worldwide total inventory of both types of waste is about 1.3 billion tonnes. Taking an average tailings density (tonnes/m3) of 1.5 gives an estimated volume for each type of tailings of about 900 million m3. Assuming a specific activity of the mill tailings, for both 230Th and 226Ra, of 0.033 GBq/m3 their total radioactive inventory for both long lived radionuclides would be about 30 000 TBq. Assuming also that the specific activity of mine residues is lower by a factor of 10 the resulting radioactive inventory of mine residues would be about 3000 TBq of uranium.
Regarding the worldwide inventory of tailings generated as a result of defence activities, the estimates have been obtained considering the global production of warheads equal to 70 000 and assuming that each warhead has caused the production of 2000 tonnes of both mine and mill tailings [8].
Verification of the estimated inventory of mine and mill tailings by comparison with the NEWMDB is not possible since this type of waste is not generally reported to the database.
2.2. WASTE FROM NUCLEAR POWER GENERATION
In addition to the waste generated by the nuclear fuel cycle front-end activities discussed in the preceding section, nuclear power generation causes the production of several kinds of radioactive waste, including spent reactor fuel (if it is declared waste), high level waste (HLW) that is generated mainly from the chemical reprocessing of spent fuel and low and intermediate level waste (LILW) that is generated as a result of reactor operations, reprocessing, decontamination, decommissioning and other fuel cycle activities.
Of all radioactive waste sources, nuclear power stations are the most predictable and documented. Experience from about 4,600 GWe-years gives a relatively good knowledge of the amounts of radioactive waste that has been generated by nuclear power plants [11] However, the production at specific power plants is subject to changes over time as a consequence of different economic and social situations (the same is true, to a certain extent, for waste production by reprocessing activities). Over the years, waste volumes generated per unit energy produced have been continuously reduced, due to technological advances and the increasing costs of unit waste disposal. This has to be taken into account in estimating the waste inventory, particularly in relation to estimates of future waste production.
However, if an average waste production for a particular reactor type could be assumed, then multiplying it by the cumulative power generated by that reactor type, would allow a reasonable estimate to be made of the waste amounts generated. Adding up the waste generations of the various reactor types would then produce a global inventory of waste generated by reactor operations.
8
In the following sections, worldwide inventories of radioactive waste generated by nuclear power plants are estimated for the categories:
• low and intermediate level waste (LILW); • spent fuel and HLW; • decommissioning waste.
2.2.1. Low and intermediate level waste
Several references give fairly consistent estimates of the typical waste amounts generated by the different reactor types, enabling the assessment of LILW amounts generated by nuclear power plants.
For light water reactors (LWRs), three references were considered:
• An American report of the 90s [7] presents typical waste amounts generated by pressurized water reactors (PWRs) and boiling water reactors (BWRs). PWR waste volumes and activities are substantially lower (almost by a factor of 3) than the corresponding BWR values. Reported annual waste production per GWe is 513 m3 (with 549 TBq) for BWRs and 177 m3 (with 112 TBq) for PWRs.
• A second report [12] shows a similar variance between PWRs and BWRs, but with somewhat larger values, that is 613 m3 with 1180 TBq for BWRs and 338 m3 with 27 TBq for PWRs.
• A third report [13] gives similar estimates for the volumes of LILW generated by LWRs with 600 and 200 m3 respectively for BWRs and PWRs. Regarding the activity of the waste, the estimated values have a wide range, that is 2.24 to 224 TBq and 0.74 to 74 TBq for BWRs and PWRs, respectively; which indicates the large uncertainty in these estimates.
The Nuclear Energy Institute reports that since 1980, when about 100 000 m3 of low-level waste were disposed of commercially in the US, annual amounts of low level waste disposed of have decreased sharply. In 1999 the amount was reduced by more than 93% to approximately 7600 m3 even though the number of power plants had increased by more than 50% [14]. These results were prompted by the sharp rise in the cost of disposal and uncertainty about access to disposal sites in the USA.
In spite of this uncertainty, for the purpose of producing approximate the worldwide inventory for waste accumulations, one of the above sets of values was used. Reference [7] was chosen as the source of data regarding the waste production of the two types of LWRs. Consequently the assumed annual generation of LILW for LWRs is 500 m3 with 550 TBq for BWRs and 200 m3 with 100 TBq for PWRs (these values have been further rounded up in Table 2).
For some of the other reactor types, the following sources of waste production data have been used.
• Values for AGRs (advanced gas reactors) and GCRs (gas cooled reactors) were derived from the UK Nirex CD [15].
• Values for the Russian type reactors (WWER and LWGR/RBMK) were taken from the IIASA report on the radiation legacy of the Soviet nuclear complex [16].
9
• For the Canadian reactor type, PHWR (pressurized heavy water reactor), the estimates were derived from Ref. [17].
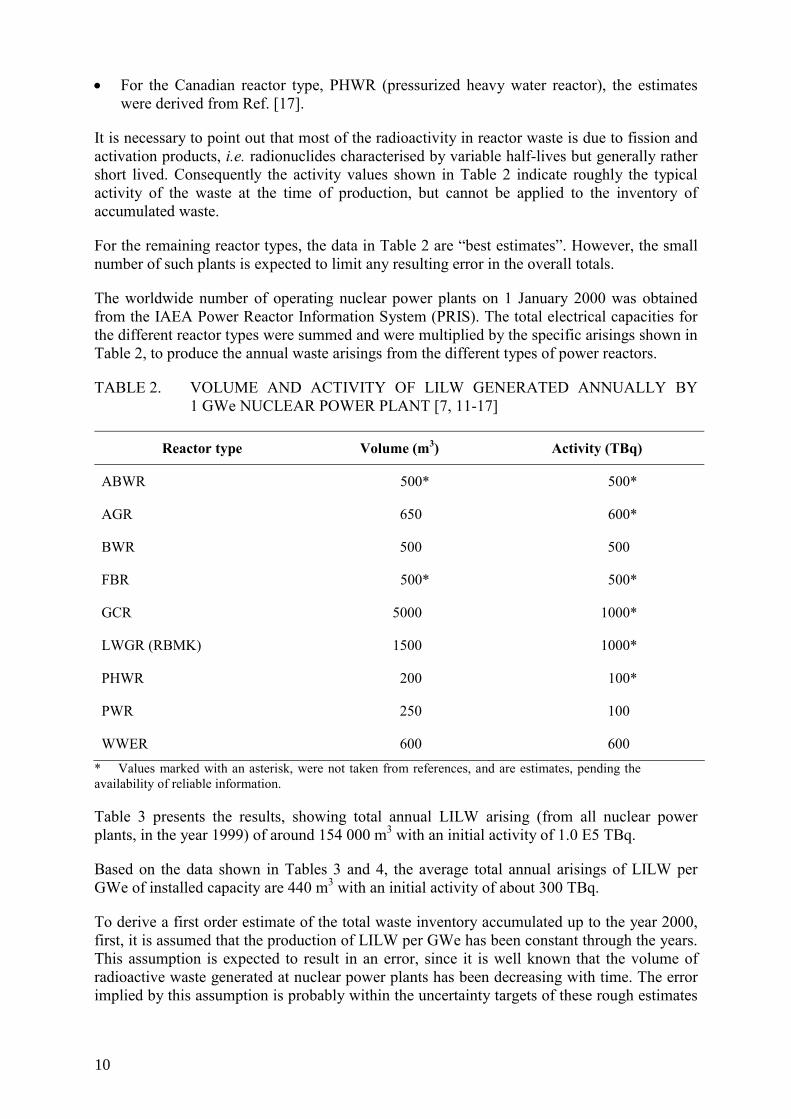
It is necessary to point out that most of the radioactivity in reactor waste is due to fission and activation products, i.e. radionuclides characterised by variable half-lives but generally rather short lived. Consequently the activity values shown in Table 2 indicate roughly the typical activity of the waste at the time of production, but cannot be applied to the inventory of accumulated waste.
For the remaining reactor types, the data in Table 2 are “best estimates”. However, the small number of such plants is expected to limit any resulting error in the overall totals.
The worldwide number of operating nuclear power plants on 1 January 2000 was obtained from the IAEA Power Reactor Information System (PRIS). The total electrical capacities for the different reactor types were summed and were multiplied by the specific arisings shown in Table 2, to produce the annual waste arisings from the different types of power reactors.
TABLE 2. VOLUME AND ACTIVITY OF LILW GENERATED ANNUALLY BY 1 GWe NUCLEAR POWER PLANT [7, 11-17]
Reactor type Volume (m3) Activity (TBq)
ABWR 500* 500*
AGR 650 600*
BWR 500 500
FBR 500* 500*
GCR 5000 1000*
LWGR (RBMK) 1500 1000*
PHWR 200 100*
PWR 250 100
WWER 600 600
* Values marked with an asterisk, were not taken from references, and are estimates, pending the availability of reliable information.
Table 3 presents the results, showing total annual LILW arising (from all nuclear power plants, in the year 1999) of around 154 000 m3 with an initial activity of 1.0 E5 TBq.
Based on the data shown in Tables 3 and 4, the average total annual arisings of LILW per GWe of installed capacity are 440 m3 with an initial activity of about 300 TBq.
To derive a first order estimate of the total waste inventory accumulated up to the year 2000, first, it is assumed that the production of LILW per GWe has been constant through the years. This assumption is expected to result in an error, since it is well known that the volume of radioactive waste generated at nuclear power plants has been decreasing with time. The error implied by this assumption is probably within the uncertainty targets of these rough estimates
10
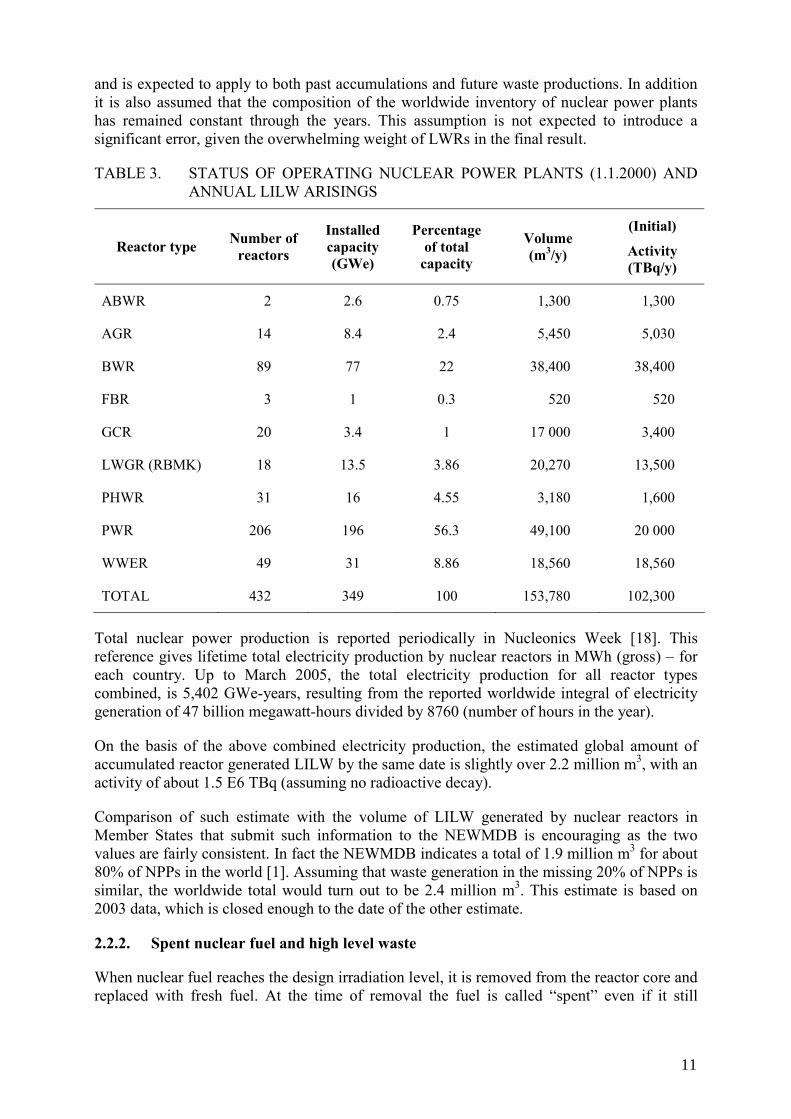
and is expected to apply to both past accumulations and future waste productions. In addition it is also assumed that the composition of the worldwide inventory of nuclear power plants has remained constant through the years. This assumption is not expected to introduce a significant error, given the overwhelming weight of LWRs in the final result.
TABLE 3. STATUS OF OPERATING NUCLEAR POWER PLANTS (1.1.2000) AND ANNUAL LILW ARISINGS
Reactor type Number of reactors
Installed capacity (GWe)
Percentage of total
capacity
Volume (m3/y)
(Initial)
Activity (TBq/y)
ABWR 2 2.6 0.75 1,300 1,300
AGR 14 8.4 2.4 5,450 5,030
BWR 89 77 22 38,400 38,400
FBR 3 1 0.3 520 520
GCR 20 3.4 1 17 000 3,400
LWGR (RBMK) 18 13.5 3.86 20,270 13,500
PHWR 31 16 4.55 3,180 1,600
PWR 206 196 56.3 49,100 20 000
WWER 49 31 8.86 18,560 18,560
TOTAL 432 349 100 153,780 102,300
Total nuclear power production is reported periodically in Nucleonics Week [18]. This reference gives lifetime total electricity production by nuclear reactors in MWh (gross) – for each country. Up to March 2005, the total electricity production for all reactor types combined, is 5,402 GWe-years, resulting from the reported worldwide integral of electricity generation of 47 billion megawatt-hours divided by 8760 (number of hours in the year).
On the basis of the above combined electricity production, the estimated global amount of accumulated reactor generated LILW by the same date is slightly over 2.2 million m3, with an activity of about 1.5 E6 TBq (assuming no radioactive decay).
Comparison of such estimate with the volume of LILW generated by nuclear reactors in Member States that submit such information to the NEWMDB is encouraging as the two values are fairly consistent. In fact the NEWMDB indicates a total of 1.9 million m3 for about 80% of NPPs in the world [1]. Assuming that waste generation in the missing 20% of NPPs is similar, the worldwide total would turn out to be 2.4 million m3. This estimate is based on 2003 data, which is closed enough to the date of the other estimate.
2.2.2. Spent nuclear fuel and high level waste
When nuclear fuel reaches the design irradiation level, it is removed from the reactor core and replaced with fresh fuel. At the time of removal the fuel is called “spent” even if it still
11
contains significant amounts of fissile material. The accumulation of fission products in the fuel interferes with the neutron flux and reduces the efficiency of the chain reaction, requiring, therefore, its replacement.
After removal from the reactor core, spent fuel is placed in storage pools, generally located within the reactor building. Storage at the reactor site is planned to last a number of years, but eventually the spent fuel will need to be removed and subjected to a management option to be chosen among a few possibilities.
(1) Reprocessing: in this case the fuel is dissolved and treated to separate the remaining fissile components from the fission and activation products. The extremely radioactive liquids generated by the first-cycle extraction process constitute HLW. Additional reprocessing activities generate less active waste, generally classified as LILW.
(2) Disposal: a number of Member States have decided that spent fuel is not worth reprocessing and can be considered a waste, requiring therefore disposal. The disposal solution generally under consideration is emplacement in geological repositories.
(3) Long term storage: if reprocessing is not carried out, and as long as geological repositories are not operational, storage of spent fuel is obviously unavoidable. Most Member States not following the reprocessing option are making plans for the extended storage of spent fuel. Long term storage may take place at reactor sites or in facilities removed from the reactors. Storage is possible either under water or in dry storage facilities. Extended storage of spent fuel may be motivated also by the need to delay the decision between reprocessing and direct disposal. Spent fuel may contain a significant energy potential and, while, at present, its reprocessing may not be economically motivated, it might, in future, become a resource and reprocessing may then be considered justified.
Spent fuel and HLW contain by far the largest activity of the radioactive substances produced by nuclear fission. Liquid HLW is generally stored in tanks, prior to eventual solidification (vitrification is the currently used approach). While there is general agreement that liquid HLW needs to be transformed into a solid, there are a number of sites where liquid HLW has been kept in tanks for time periods now extending to several decades. Most liquid HLW subjected to such long term storage has been generated by defence programmes.
Due to their very high concentrations of radionuclides and high heat generation rate, spent fuel and HLW require to be managed with the greatest care.
A positive aspect is that, in comparison with other classes of radioactive waste and with the waste production of other industrial sectors, spent fuel and/or HLW are generated in relatively small volumes and masses, as shown below.
Typically, from one year of operation of 1 GWe LWR, spent fuel assemblies containing around 30 to 50 metric tons of heavy metal (MTHM) are generated, with a corresponding initial activity of around 5.0 to 8.3 E6 TBq [13].
Current reprocessing procedures would convert such an annual arising of spent fuel into 15 m3
of vitrified HLW (a six fold reduction over the past two decades). Table 4 provides data about the status of spent fuel reprocessing at the beginning of 2002 in various countries. The reprocessing included in the table is entirely within the civilian nuclear power sector. Using the estimated generation of vitrified HLW of 400 litres per MTHM of spent fuel the global
12
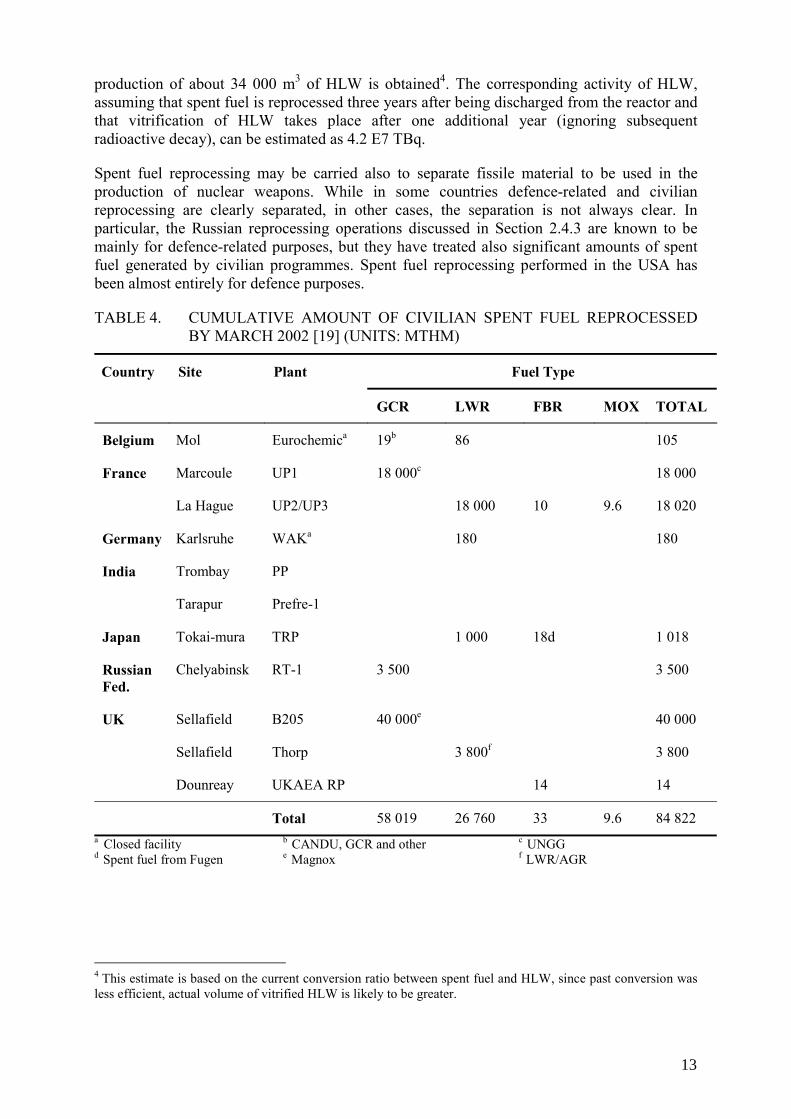
production of about 34 000 m3 of HLW is obtained4. The corresponding activity of HLW, assuming that spent fuel is reprocessed three years after being discharged from the reactor and that vitrification of HLW takes place after one additional year (ignoring subsequent radioactive decay), can be estimated as 4.2 E7 TBq.
Spent fuel reprocessing may be carried also to separate fissile material to be used in the production of nuclear weapons. While in some countries defence-related and civilian reprocessing are clearly separated, in other cases, the separation is not always clear. In particular, the Russian reprocessing operations discussed in Section 2.4.3 are known to be mainly for defence-related purposes, but they have treated also significant amounts of spent fuel generated by civilian programmes. Spent fuel reprocessing performed in the USA has been almost entirely for defence purposes.
TABLE 4. CUMULATIVE AMOUNT OF CIVILIAN SPENT FUEL REPROCESSED BY MARCH 2002 [19] (UNITS: MTHM)
Fuel Type Country Site Plant
GCR LWR FBR MOX TOTAL
Belgium Mol Eurochemica 19b 86 105
Marcoule UP1 18 000c 18 000 France
La Hague UP2/UP3 18 000 10 9.6 18 020
Germany Karlsruhe WAKa 180 180
Trombay PP India
Tarapur Prefre-1
Japan Tokai-mura TRP 1 000 18d 1 018
Russian Fed.
Chelyabinsk RT-1 3 500 3 500
Sellafield B205 40 000e 40 000
Sellafield Thorp 3 800f 3 800
UK
Dounreay UKAEA RP 14 14
Total 58 019 26 760 33 9.6 84 822 a Closed facility b CANDU, GCR and other c UNGG d Spent fuel from Fugen e Magnox f LWR/AGR
4 This estimate is based on the current conversion ratio between spent fuel and HLW, since past conversion was less efficient, actual volume of vitrified HLW is likely to be greater.
13
Various literature sources provide gross amounts of reprocessed fuel within the civilian sector. For example the Nuclear Energy Institute reports that about 75 000 MT of spent fuel have been reprocessed worldwide up to the beginning of the years 2000. Of this total France has reprocessed more than 10 000 MT of spent fuel and UK has reused more than 15 000 MT of uranium recovered through reprocessing [14].
2.2.2.1 Global amounts of spent fuel
The American integrated data base report [7], shows the ratio of spent fuel mass (MTHM) to volume (m3) to be 2.5 for LWRs, which allows the volume of accumulated spent fuel to be assessed.
Since about 80% of the world reactors are LWRs, a first order estimate could be based on the corresponding spent fuel arisings for LWRs. Multiplying them by the total capacity in one year (e.g. 350 GWe at the beginning of January 2000) gives such an estimate.
Consequently, using 30 to 50 MTHM with 5.0 to 8.3 E6 TBq per GWe yields an estimate of annual generation in the year 1999 of about 10000 MTHM, with an initial activity of 1.7 E9 TBq. Applying the same generation rate to the integral of nuclear power generation, that is, 4650 GWe-years, yields an estimated total amount of spent fuel generated by the year 2000 of 140000 to 233000 MTHM with 2.4 to 3.7 E10 TBq. In reality, a fraction of this spent fuel has been reprocessed, producing therefore radioactive waste of different classes.
A different source indicates that worldwide the spent fuel generation rate is now at about 10,500 MTHM/year. The total amount of spent fuel cumulatively generated worldwide by the beginning of 2003 was close to 255000 MTHM. Subtracting from this amount reprocessed spent fuel shown in Table 4, the amount remaining in storage is about 170000 MTHM [20]. Most spent fuel subjected to commercial reprocessing has been generated by LWRs.
Another source indicates that the spent fuel cumulatively generated worldwide by 2000 is 228,300 MTHM [21].
Table 5 shows the spent fuel inventory data collected from the publicly available National Reports submitted to the Second Review Meeting of the Joint Convention on the Safety of Spent Fuel Management and on the Safety of Radioactive Waste Management [2]. The total amount of spent fuel is approximately 180000 MTHM. The deadline for submission of National Reports was October 2005. Therefore most National Reports were prepared in 2005, based on the data up to the end of 2005.
14

TABLE 5. SPENT FUEL INVENTORY DATA COLLECTED FROM THE NATIONAL REPORTS SUBMITTED TO THE SECOND REVIEW MEETING OF THE JOINT CONVENTION HELD IN MAY 2006
Contracting Parties to the Joint Convention that have NPPs
Number of assemblies
Mass / Heavy Metal ton
1 Argentina 3 234 2 Belgium 2 668 4 300 3 Brazil 943 113 Note 1 4 Bulgaria 6 341 943 5 Canada 1 793 168 33 858 6 China Note 2 7 Czech 7 555 882 8 Finland 9 019 1 377 9 France 10 920
10 Germany 4 738 11 Hungary 6 355 743 Note 3 12 Italy 2 058 237 13 Japan 13 000 14 Rep. of Korea 7 286 15 Lithuania 16 087 1 818 Note 4 16 Netherlands 0.43 17 Romania 40 312 762 Note 5 18 Russia 18 500 19 Slovakia 10 609 1 263 Note 6 20 Slovenia 732 285 21 South Africa Note 7 22 Spain 9 676 3 196 23 Sweden 24 129 4 957 24 Switzerland 3 728 737 25 UK 9 585 26 Ukraine Note 8 27 USA 49 352 total 176 419
Note 1 Brazil: Weight was calculated assuming 120 kg per assembly. Note 2 China became Contracting Party after the Second Review Meeting. Note 3 Hungary: Weight was calculated assuming 117 kg per assembly. Note 4 Lithuania: Weight was calculated assuming 113 kg per assembly. Note 5 Romania: Weight was calculated assuming 18.9 kg U per CANDU bundle. Note 6 Slovakia: Weight was calculated assuming 119 kg per assembly. Note 7 South Africa became Contracting Party after the Second Review Meeting. Note 8 Ukraine has not made the National Report publicly available.
15
2.2.3. Decommissioning waste
At the end of their useful lives nuclear facilities need to be decommissioned. At present the number of facilities that have been decommissioned is relatively small, but the experience that has been accumulated to date allows some simple deductions to be made [22].
Recognising that the amounts of decommissioning waste may vary depending on a variety of factors, including, for example, the clearance levels applied for release from regulatory control of the material generated in decommissioning, it is reported that decommissioning a LWR with an installed capacity of about 1 GWe can be expected to generate a quantity of short lived LILW between 5000 and 6000 metric tons (MT) [23]. The production of long lived LILW and HLW is significantly lower, generally less than 1000 MT.
Decommissioning of reprocessing plants is expected to generate quantities of radioactive waste somewhat similar to power reactors but with a significantly higher fraction of long lived waste.
Accepting 6000 MT per GWe as a representative average production of decommissioning waste, the existing NPPs will eventually cause a total production of about 2.5 million MT of LILW. Depending on the assumed average density of the waste and on conditioning and packaging procedures, decommissioning of existing NPPs may eventually cause the production of a volume of LILW between one and two million m3 [23].
The estimate of decommissioning waste shown in the preceding section includes only waste generated or expected to be generated by the decommissioning of nuclear facilities. This value is not comparable with the waste arisings reported in the NEWMDB, since in the database decommissioning waste is combined with remediation waste that is waste generated during operations aimed at decontamination/remediation of contaminated sites.
2.2.4. Remediation waste
No estimates of remediation waste have been produced in this publication. Major contaminated sites are discussed briefly in Annex III, but no estimates about the waste production resulting from their remediation have been found in the literature. In addition, it is expected that most of the remediation waste included in the inventories reported by the NEWMDB (see Table 12 in Section 3) are generated by remediation work carried out at facilities involved in historical defence-related work in the major nuclear states. Table 12 reports more than 19 million m3 of LILW generated by decommissioning/remediation. Considering that the figures in the NEWMDB do not include the waste which will be generated by future decommissioning activities, it can be estimated that the volume of remediation waste in Member States subscribing to the NEWMDB should be about 19 million m3.
It should be pointed out that Russia is not currently subscribing to the NEWMDB and that large amounts of remediation waste may have been generated at the main sites where defence-related work has been carried out.
In conclusion it appears that the inventory of remediation waste needs to be considered as a weak point of the present publication. If one or more future versions of this report will be produced this is definitely one aspect requiring additional work. It is also likely that the majority of remediation waste would belong more correctly to the waste discussed in Section 2.4, “Defence and Weapon Related Waste”.
16
2.3. WASTE FROM INSTITUTIONAL ACTIVITIES
Institutional uses of radioactive material include activities in the fields of research, industry and medicine. The activities, particularly in the field of research, are widely variable and result in the production of different categories of radioactive waste. As in other fields of the nuclear sector, institutional waste can be in gaseous, liquid or solid form.
Most institutional waste of interest in the present discussion is in solid form and is generally handled in a comparable way to waste generated within the nuclear fuel cycle.
2.3.1. High level waste
Particularly significant types of radioactive waste generated in the institutional sector are the HLW generated by reprocessing the spent fuel generated by research reactors. Detailed information about the global inventory of HLW generated by research reactors is currently not available, however this type of waste will eventually require disposal in a way similar to that required by HLW or spent fuel generated by the nuclear fuel cycle. The total amount of such institutional HLW is expected to be small by comparison with the quantities generated by reprocessing of spent fuel within civilian nuclear power programmes or by defence activities.
2.3.2. Low and intermediate level waste
The major part of institutional waste is expected to fall in the category defined as LILW. The duration of required isolation will depend on the longevity of the radionuclides contained in the waste. Some of this waste contains significant amounts of long lived radionuclides and must be considered as long lived waste, therefore to be eventually disposed of in geological repositories, but the great majority can be classified as short lived waste.
Disused radioactive sources constitute a particular type of institutional waste that requires special consideration. Disused radioactive sources can contain large and highly concentrated amounts of a single radionuclide and in many cases may not meet the waste acceptance criteria for near surface repositories even when the source radionuclide is not particularly long lived. Radioactive sources unsuitable for near surface disposal require to be emplaced at greater depth, either in geological repositories, probably together with HLW and spent fuel, or in specifically designed boreholes.
Amounts of radioactive waste generated by institutional activities are included in the reports provided by Member States to the NEWMDB in the class defined “nuclear applications”, but a direct comparison between the amounts estimated in this report and the database values is not possible because the institutional activities assumed are somewhat broader than the nuclear applications of the NEWMDB. In addition the limitation due to the fact that not all Member States contribute to the database is still there.
Available information seem to indicate that for countries with large nuclear power programmes, institutional waste amounts to 20% to 30% of the total, while in countries with relatively small nuclear power programmes the waste from institutional activities ranges between 30% and more than 50% of the total volume. In countries without nuclear power production, institutional waste represents the great majority of a very small total generation of radioactive waste. However countries without nuclear power production are believed to make small contribution to the total inventory. “Nuclear applications” LILW waste in the NEWMDB seems to be between 30% and 50% of the volume of LILW generated by nuclear power production
17
In conclusion, the majority of institutional radioactive waste can be classified as short lived LILW and for the purpose of this report and until more data become available it is assumed that their worldwide inventory (by volume) is about 50% of the inventory of LILW generated by nuclear fuel cycle activities.
2.3.3. Decommissioning waste
Nuclear facilities within the institutional sector will also require decommissioning. A typical research reactor, for example, may eventually cause the production of about 500 MT of LILW [23]. On the basis of this waste generation value and of the total number of research reactors (686 by the end of 2002 [22]), the global production of waste from decommissioning of research reactors can be estimated as about 350000 MT, of which a significant fraction has not yet been generated. Assuming a similar density as for waste generated by decommissioning NPPs, the estimated mass might correspond to a volume between 200 000 and 300000 m3. The same limitations discussed in Section 2.2.3 apply to any attempt to compare the present estimates with the inventories reported by the NEWMDB.
2.4. DEFENCE AND WEAPON RELATED WASTE
To date, the largest quantities of defence and weapon-related radioactive waste are those created in the early days of the development and testing of nuclear weapons. The production of nuclear weapons is presently in a retrograde mode with the USA and Russia taking weapons out of service and blending the highly enriched uranium and/or plutonium with natural uranium to produce UO2 and/or mixed uranium-plutonium fuel for commercial power reactors or storing this material for future disposal in geological repositories with HLW or spent fuel. However, some countries continue to produce plutonium for military purposes as evidenced by recent nuclear bomb tests. However, at the present time plutonium production for military purposes is much smaller than the historical production. Because of the military nature of the topic, most of the data, until recently, have been classified. Even now, much of this information is still classified. Under the stress of the wartime and cold war conditions, the main objective was to produce weapon-grade fissile material and not an accurate measure of the waste material. This helps to explain the difficulty in obtaining reliable radioactive and chemical waste data. Also, since alpha and gamma spectrometers had not been developed when much of the waste was created, most data, if collected, were in terms of measurements of gross beta/gamma emissions and occasionally of gross alpha emissions. Therefore, all literature derived estimates of the quantities of radioactive waste generated by defence activities must be considered highly uncertain.
This situation is currently improving since Member States subscribing to the NEWMDB include data on defence waste. Besides relying on the NEWMDB, which anyway does not include all countries with defence waste, there are two options to estimating the inventory of defence and weapon related waste. The estimates produced in this publication are the result of a combination of the two approaches. One is to use information, from a variety of non-governmental sources. The second option is to piece together the information about plutonium production for nuclear weapons released on the occasion of the definition of weapons reduction treaties. Then, knowledge of the processes and quantities involved to produce nuclear weapons can be used to make an estimate of associated waste arisings.
Since, in regard to military programmes, it is not feasible to start from the feed material data, which are unknown, in order to compute the product information and the associated waste, it has been necessary to begin at the product output values, which can be reasonably
18
approximated, and work backwards to the initial input values. This analysis entails all of the well known inverse procedures problems.
2.4.1. Published information on waste quantities
The main source of information available from non-governmental organisations comes from groups interested in assessing the impact of radioactive material on public health. Examples of publications containing useful data are [24] and its update [8]. Based on order of magnitude estimates of USA information on radioactive waste production per kilogram of highly enriched uranium and per nuclear weapon5, the following estimates of the global inventory (Summary of findings, pp 580-584 [8]) are produced:
• 70 000 nuclear warheads have been fabricated worldwide.
• The corresponding worldwide production of uranium mill tailings is between 100 and 200 million tonnes, containing: - 4 E3 TBq of 226Ra; - 4 E3 TBq of 230Th.
• 400 000 tonnes of natural uranium have been processed worldwide - in broad terms there would be the same quantity of remaining depleted uranium.
• HLW with an activity of 1.0 E8 TBq has been generated from plutonium production. This estimate is only for 90Sr, 137Cs and their daughter products. Taking radioactive decay into account would reduce this value by half.
• 7.0 E5 TBq of other radionuclides have also been generated.
It should be noticed that the discussion in this section addresses only waste generated by defence activities. It should be noticed also that the number of warheads reported as produced worldwide vary significantly according to the sources. This is probably unavoidable for two kinds of reasons. First the information has been considered as classified for a long time and some of the estimates are probably based on a good deal of guesswork. Second the estimates have been produced at different times and the number of warheads has changed significantly, for example the number in existence now is expected to be much lower than at the peak of the cold war. In respect to using the number of warheads as a starting point for the estimation of waste arisings the relevant figure is not the number in existence but the total number that has been generated through the years.
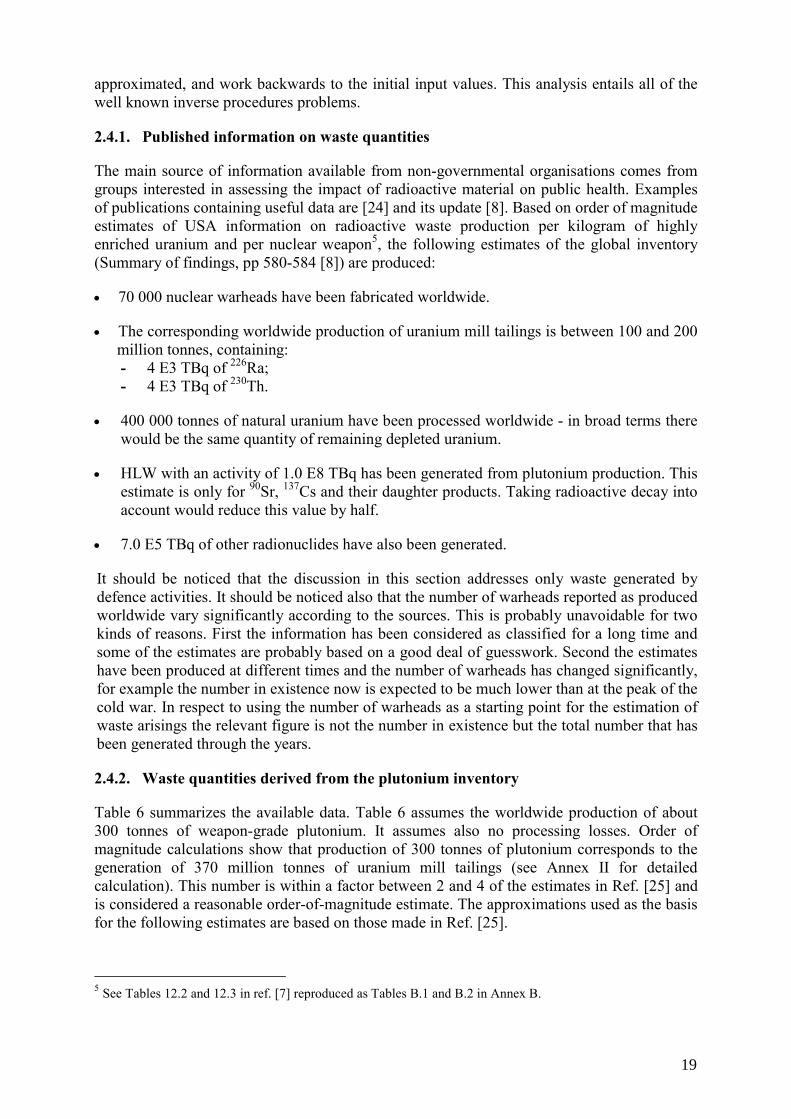
2.4.2. Waste quantities derived from the plutonium inventory
Table 6 summarizes the available data. Table 6 assumes the worldwide production of about 300 tonnes of weapon-grade plutonium. It assumes also no processing losses. Order of magnitude calculations show that production of 300 tonnes of plutonium corresponds to the generation of 370 million tonnes of uranium mill tailings (see Annex II for detailed calculation). This number is within a factor between 2 and 4 of the estimates in Ref. [25] and is considered a reasonable order-of-magnitude estimate. The approximations used as the basis for the following estimates are based on those made in Ref. [25].
5 See Tables 12.2 and 12.3 in ref. [7] reproduced as Tables B.1 and B.2 in Annex B.
19
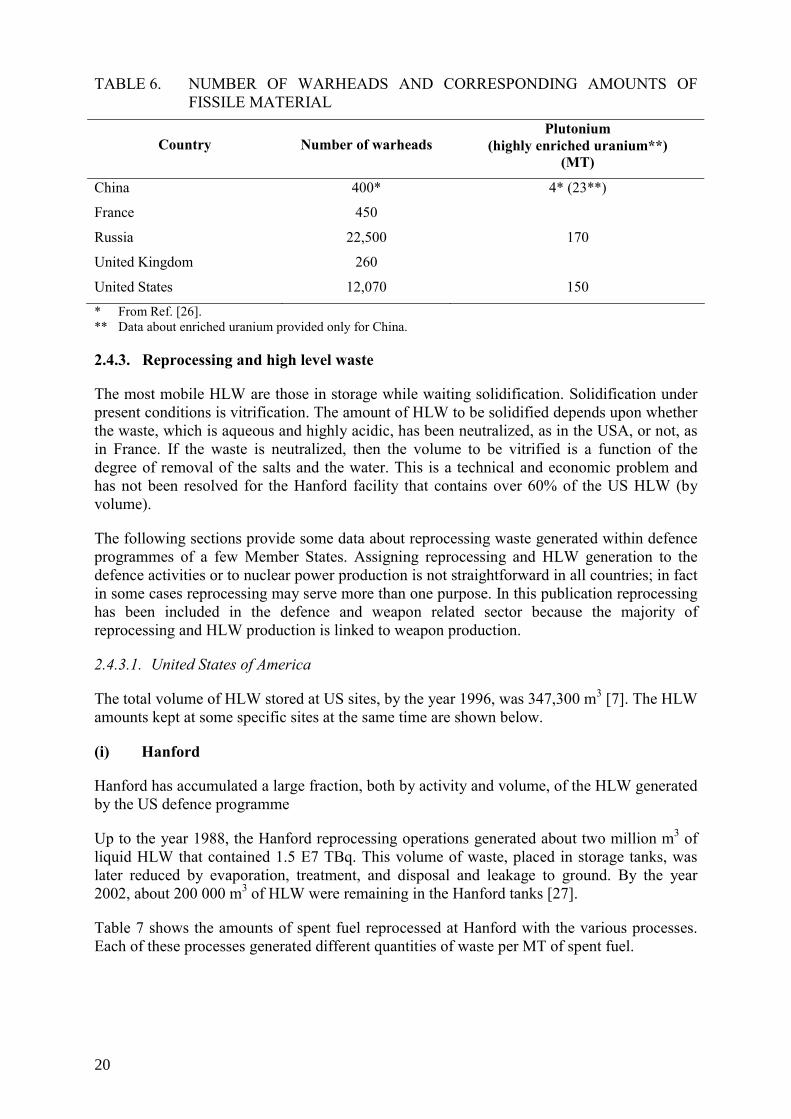
TABLE 6. NUMBER OF WARHEADS AND CORRESPONDING AMOUNTS OF FISSILE MATERIAL
Country Number of warheads Plutonium
(highly enriched uranium**) (MT)
China 400* 4* (23**)
France 450
Russia 22,500 170
United Kingdom 260
United States 12,070 150
* From Ref. [26]. ** Data about enriched uranium provided only for China.
2.4.3. Reprocessing and high level waste
The most mobile HLW are those in storage while waiting solidification. Solidification under present conditions is vitrification. The amount of HLW to be solidified depends upon whether the waste, which is aqueous and highly acidic, has been neutralized, as in the USA, or not, as in France. If the waste is neutralized, then the volume to be vitrified is a function of the degree of removal of the salts and the water. This is a technical and economic problem and has not been resolved for the Hanford facility that contains over 60% of the US HLW (by volume).
The following sections provide some data about reprocessing waste generated within defence programmes of a few Member States. Assigning reprocessing and HLW generation to the defence activities or to nuclear power production is not straightforward in all countries; in fact in some cases reprocessing may serve more than one purpose. In this publication reprocessing has been included in the defence and weapon related sector because the majority of reprocessing and HLW production is linked to weapon production.
2.4.3.1. United States of America
The total volume of HLW stored at US sites, by the year 1996, was 347,300 m3 [7]. The HLW amounts kept at some specific sites at the same time are shown below.
(i) Hanford
Hanford has accumulated a large fraction, both by activity and volume, of the HLW generated by the US defence programme
Up to the year 1988, the Hanford reprocessing operations generated about two million m3 of liquid HLW that contained 1.5 E7 TBq. This volume of waste, placed in storage tanks, was later reduced by evaporation, treatment, and disposal and leakage to ground. By the year 2002, about 200 000 m3 of HLW were remaining in the Hanford tanks [27].
Table 7 shows the amounts of spent fuel reprocessed at Hanford with the various processes. Each of these processes generated different quantities of waste per MT of spent fuel.
20
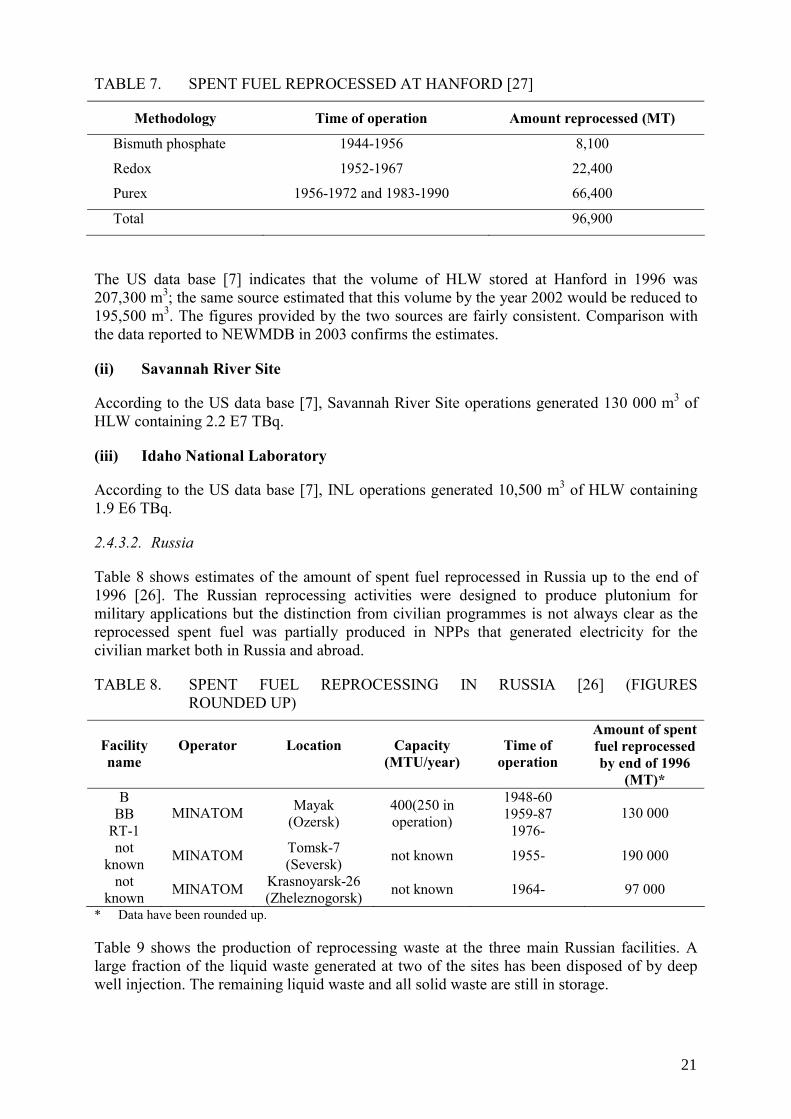
TABLE 7. SPENT FUEL REPROCESSED AT HANFORD [27]
Methodology Time of operation Amount reprocessed (MT)
Bismuth phosphate 1944-1956 8,100
Redox 1952-1967 22,400
Purex 1956-1972 and 1983-1990 66,400
Total 96,900
The US data base [7] indicates that the volume of HLW stored at Hanford in 1996 was 207,300 m3; the same source estimated that this volume by the year 2002 would be reduced to 195,500 m3. The figures provided by the two sources are fairly consistent. Comparison with the data reported to NEWMDB in 2003 confirms the estimates.
(ii) Savannah River Site
According to the US data base [7], Savannah River Site operations generated 130 000 m3 of HLW containing 2.2 E7 TBq.
(iii) Idaho National Laboratory
According to the US data base [7], INL operations generated 10,500 m3 of HLW containing 1.9 E6 TBq.
2.4.3.2. Russia
Table 8 shows estimates of the amount of spent fuel reprocessed in Russia up to the end of 1996 [26]. The Russian reprocessing activities were designed to produce plutonium for military applications but the distinction from civilian programmes is not always clear as the reprocessed spent fuel was partially produced in NPPs that generated electricity for the civilian market both in Russia and abroad.
TABLE 8. SPENT FUEL REPROCESSING IN RUSSIA [26] (FIGURES ROUNDED UP)
Facility name
Operator Location Capacity (MTU/year)
Time of operation
Amount of spent fuel reprocessed by end of 1996
(MT)* B
BB RT-1
MINATOM Mayak (Ozersk)
400(250 in operation)
1948-60 1959-87 1976-
130 000
not known MINATOM Tomsk-7
(Seversk) not known 1955- 190 000
not known MINATOM Krasnoyarsk-26
(Zheleznogorsk) not known 1964- 97 000
* Data have been rounded up.
Table 9 shows the production of reprocessing waste at the three main Russian facilities. A large fraction of the liquid waste generated at two of the sites has been disposed of by deep well injection. The remaining liquid waste and all solid waste are still in storage.
21
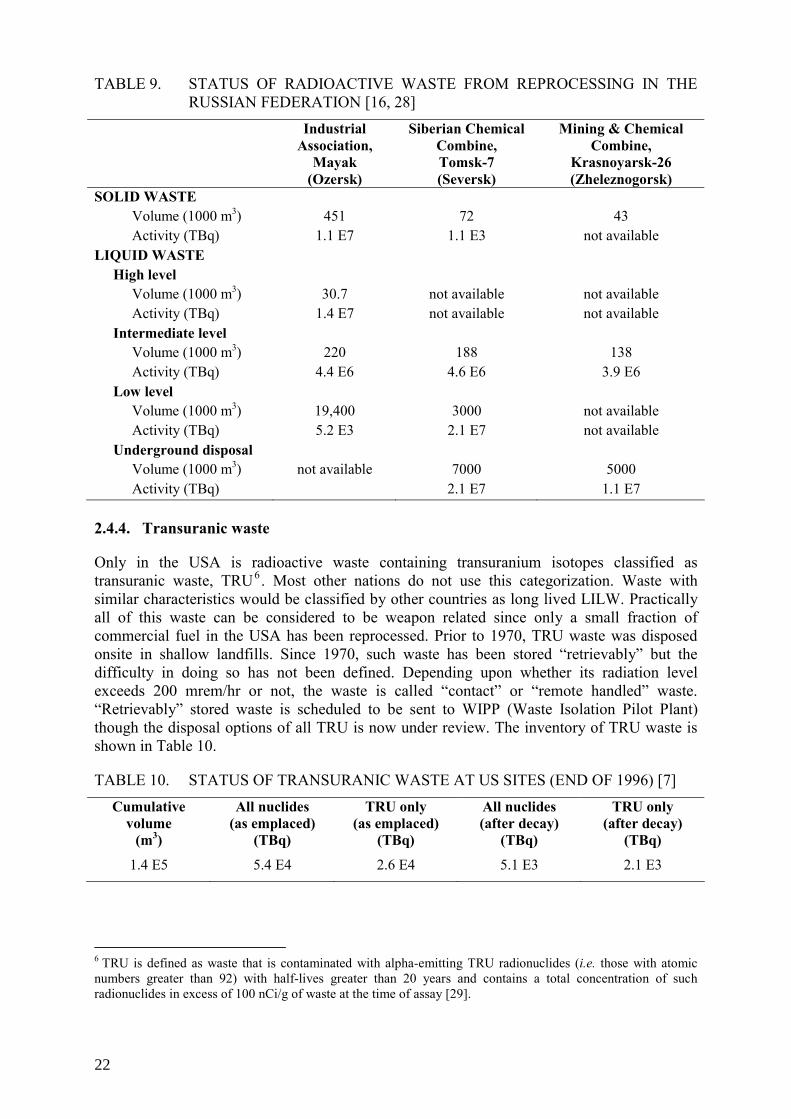
TABLE 9. STATUS OF RADIOACTIVE WASTE FROM REPROCESSING IN THE RUSSIAN FEDERATION [16, 28]
Industrial Association,
Mayak (Ozersk)
Siberian Chemical Combine, Tomsk-7 (Seversk)
Mining & Chemical Combine,
Krasnoyarsk-26 (Zheleznogorsk)
SOLID WASTE Volume (1000 m3) 451 72 43 Activity (TBq) 1.1 E7 1.1 E3 not available
LIQUID WASTE High level
Volume (1000 m3) 30.7 not available not available Activity (TBq) 1.4 E7 not available not available
Intermediate level Volume (1000 m3) 220 188 138 Activity (TBq) 4.4 E6 4.6 E6 3.9 E6
Low level Volume (1000 m3) 19,400 3000 not available Activity (TBq) 5.2 E3 2.1 E7 not available
Underground disposal Volume (1000 m3) not available 7000 5000 Activity (TBq) 2.1 E7 1.1 E7
2.4.4. Transuranic waste
Only in the USA is radioactive waste containing transuranium isotopes classified as transuranic waste, TRU6. Most other nations do not use this categorization. Waste with similar characteristics would be classified by other countries as long lived LILW. Practically all of this waste can be considered to be weapon related since only a small fraction of commercial fuel in the USA has been reprocessed. Prior to 1970, TRU waste was disposed onsite in shallow landfills. Since 1970, such waste has been stored “retrievably” but the difficulty in doing so has not been defined. Depending upon whether its radiation level exceeds 200 mrem/hr or not, the waste is called “contact” or “remote handled” waste. “Retrievably” stored waste is scheduled to be sent to WIPP (Waste Isolation Pilot Plant) though the disposal options of all TRU is now under review. The inventory of TRU waste is shown in Table 10.
TABLE 10. STATUS OF TRANSURANIC WASTE AT US SITES (END OF 1996) [7] Cumulative
volume (m3)
All nuclides (as emplaced)
(TBq)
TRU only (as emplaced)
(TBq)
All nuclides (after decay)
(TBq)
TRU only (after decay)
(TBq)
1.4 E5 5.4 E4 2.6 E4 5.1 E3 2.1 E3
6 TRU is defined as waste that is contaminated with alpha-emitting TRU radionuclides (i.e. those with atomic numbers greater than 92) with half-lives greater than 20 years and contains a total concentration of such radionuclides in excess of 100 nCi/g of waste at the time of assay [29].
22
2.5. ENVIRONMENTAL INVENTORIES OF RADIOACTIVE MATERIAL
Radioactive residues have been deposited on the earth’s surface as a result of a variety of activities including nuclear weapon testing and accidents at nuclear facilities. The information available for the present publication on this subject is incomplete. However a compilation of some of these data is contained in Annex III.
3. SUMMARY AND CONCLUSIONS
3.1. SUMMARY OF WASTE INVENTORIES
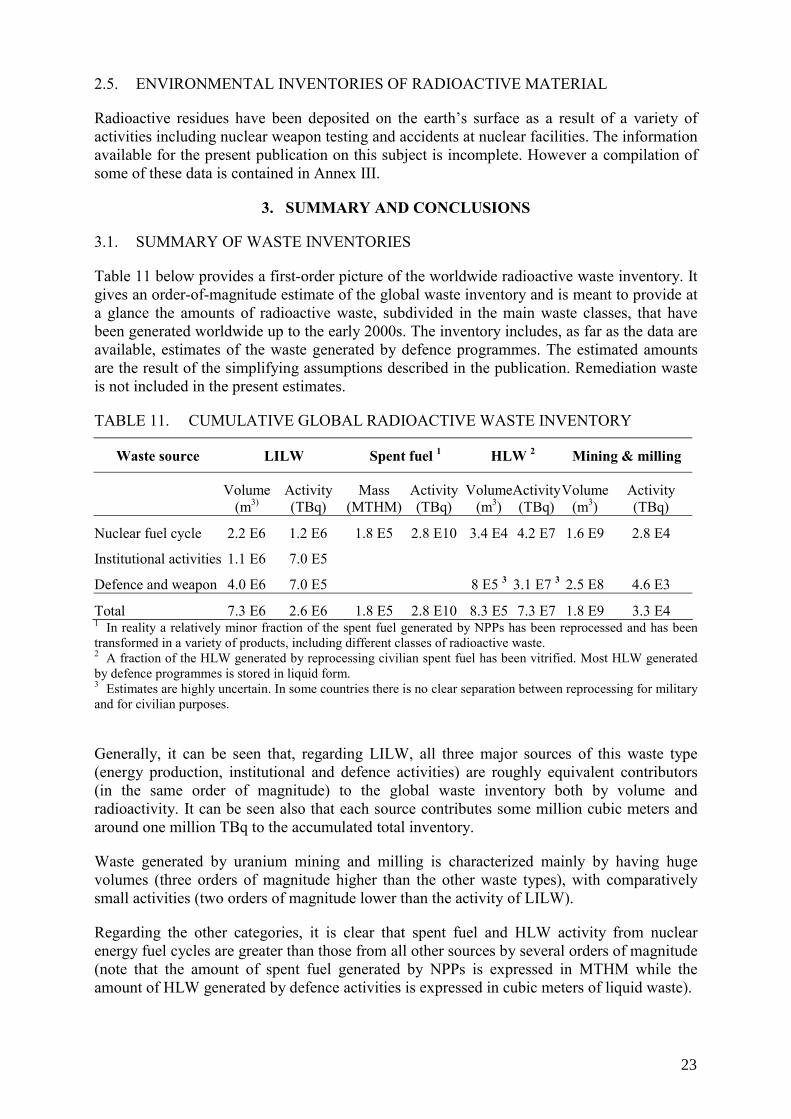
Table 11 below provides a first-order picture of the worldwide radioactive waste inventory. It gives an order-of-magnitude estimate of the global waste inventory and is meant to provide at a glance the amounts of radioactive waste, subdivided in the main waste classes, that have been generated worldwide up to the early 2000s. The inventory includes, as far as the data are available, estimates of the waste generated by defence programmes. The estimated amounts are the result of the simplifying assumptions described in the publication. Remediation waste is not included in the present estimates.
TABLE 11. CUMULATIVE GLOBAL RADIOACTIVE WASTE INVENTORY
Waste source LILW Spent fuel 1 HLW 2 Mining & milling
Volume
(m3) Activity (TBq)
Mass (MTHM)
Activity(TBq)
Volume(m3)
Activity(TBq)
Volume (m3)
Activity (TBq)
Nuclear fuel cycle 2.2 E6 1.2 E6 1.8 E5 2.8 E10 3.4 E4 4.2 E7 1.6 E9 2.8 E4
Institutional activities 1.1 E6 7.0 E5
Defence and weapon 4.0 E6 7.0 E5 8 E5 3 3.1 E7 3 2.5 E8 4.6 E3
Total 7.3 E6 2.6 E6 1.8 E5 2.8 E10 8.3 E5 7.3 E7 1.8 E9 3.3 E4 1 In reality a relatively minor fraction of the spent fuel generated by NPPs has been reprocessed and has been transformed in a variety of products, including different classes of radioactive waste. 2 A fraction of the HLW generated by reprocessing civilian spent fuel has been vitrified. Most HLW generated by defence programmes is stored in liquid form. 3 Estimates are highly uncertain. In some countries there is no clear separation between reprocessing for military and for civilian purposes.
Generally, it can be seen that, regarding LILW, all three major sources of this waste type (energy production, institutional and defence activities) are roughly equivalent contributors (in the same order of magnitude) to the global waste inventory both by volume and radioactivity. It can be seen also that each source contributes some million cubic meters and around one million TBq to the accumulated total inventory.
Waste generated by uranium mining and milling is characterized mainly by having huge volumes (three orders of magnitude higher than the other waste types), with comparatively small activities (two orders of magnitude lower than the activity of LILW).
Regarding the other categories, it is clear that spent fuel and HLW activity from nuclear energy fuel cycles are greater than those from all other sources by several orders of magnitude (note that the amount of spent fuel generated by NPPs is expressed in MTHM while the amount of HLW generated by defence activities is expressed in cubic meters of liquid waste).
23
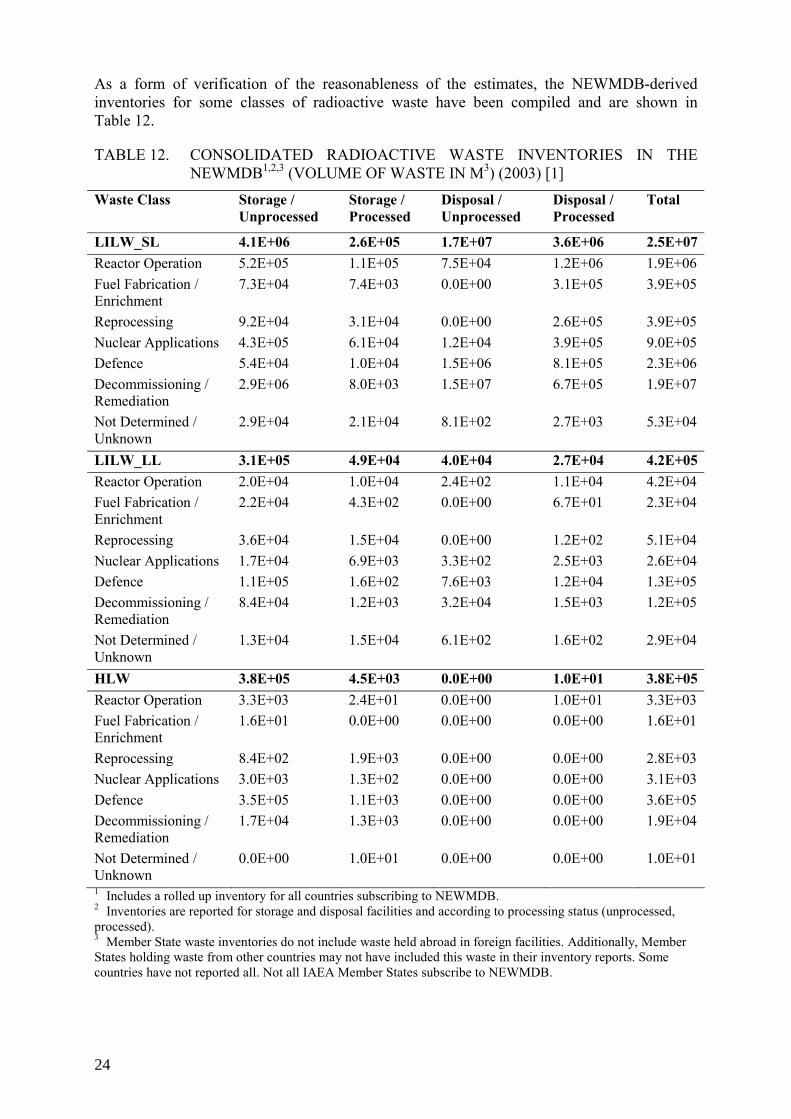
As a form of verification of the reasonableness of the estimates, the NEWMDB-derived inventories for some classes of radioactive waste have been compiled and are shown in Table 12.
TABLE 12. CONSOLIDATED RADIOACTIVE WASTE INVENTORIES IN THE NEWMDB1,2,3 (VOLUME OF WASTE IN M3) (2003) [1]
Waste Class Storage / Unprocessed
Storage / Processed
Disposal / Unprocessed
Disposal / Processed
Total
LILW_SL 4.1E+06 2.6E+05 1.7E+07 3.6E+06 2.5E+07Reactor Operation 5.2E+05 1.1E+05 7.5E+04 1.2E+06 1.9E+06 Fuel Fabrication / Enrichment
7.3E+04 7.4E+03 0.0E+00 3.1E+05 3.9E+05
Reprocessing 9.2E+04 3.1E+04 0.0E+00 2.6E+05 3.9E+05 Nuclear Applications 4.3E+05 6.1E+04 1.2E+04 3.9E+05 9.0E+05 Defence 5.4E+04 1.0E+04 1.5E+06 8.1E+05 2.3E+06 Decommissioning / Remediation
2.9E+06 8.0E+03 1.5E+07 6.7E+05 1.9E+07
Not Determined / Unknown
2.9E+04 2.1E+04 8.1E+02 2.7E+03 5.3E+04
LILW_LL 3.1E+05 4.9E+04 4.0E+04 2.7E+04 4.2E+05Reactor Operation 2.0E+04 1.0E+04 2.4E+02 1.1E+04 4.2E+04 Fuel Fabrication / Enrichment
2.2E+04 4.3E+02 0.0E+00 6.7E+01 2.3E+04
Reprocessing 3.6E+04 1.5E+04 0.0E+00 1.2E+02 5.1E+04 Nuclear Applications 1.7E+04 6.9E+03 3.3E+02 2.5E+03 2.6E+04 Defence 1.1E+05 1.6E+02 7.6E+03 1.2E+04 1.3E+05 Decommissioning / Remediation
8.4E+04 1.2E+03 3.2E+04 1.5E+03 1.2E+05
Not Determined / Unknown
1.3E+04 1.5E+04 6.1E+02 1.6E+02 2.9E+04
HLW 3.8E+05 4.5E+03 0.0E+00 1.0E+01 3.8E+05Reactor Operation 3.3E+03 2.4E+01 0.0E+00 1.0E+01 3.3E+03 Fuel Fabrication / Enrichment
1.6E+01 0.0E+00 0.0E+00 0.0E+00 1.6E+01
Reprocessing 8.4E+02 1.9E+03 0.0E+00 0.0E+00 2.8E+03 Nuclear Applications 3.0E+03 1.3E+02 0.0E+00 0.0E+00 3.1E+03 Defence 3.5E+05 1.1E+03 0.0E+00 0.0E+00 3.6E+05 Decommissioning / Remediation
1.7E+04 1.3E+03 0.0E+00 0.0E+00 1.9E+04
Not Determined / Unknown
0.0E+00 1.0E+01 0.0E+00 0.0E+00 1.0E+01
1 Includes a rolled up inventory for all countries subscribing to NEWMDB. 2 Inventories are reported for storage and disposal facilities and according to processing status (unprocessed, processed). 3 Member State waste inventories do not include waste held abroad in foreign facilities. Additionally, Member States holding waste from other countries may not have included this waste in their inventory reports. Some countries have not reported all. Not all IAEA Member States subscribe to NEWMDB.
24
3.2. CONCLUSIONS
The purpose of this publication is to produce global estimates of the amounts of residual radioactive material accumulated by nuclear activities up to the beginning of the 2000s and requiring continuing institutional controls. Despite the great progress achieved in many areas, particularly thank to the NEWMDB, some information is still open to question, since not all Member States have provided the required waste inventories. An additional uncertainty, due to the differences among classification systems used by various Member States has been also addressed by the NEWMDB by means of a matrix tool to normalize information submitted under a variety of classification systems. A number of promising activities aimed at improving the situation are currently going on at the international level [29, 30].
Official information about radioactivity in contaminated sites as a result of accidents or weapon testing is even more incomplete. As a result it was felt that exploring alternative approaches aimed at produced global estimates of the radioactive waste inventory and of radioactive material present in the environment was a worthwhile exercise.
The resulting estimates, which are based on broad simplifications, are characterised by unavoidable uncertainty. However, considering that they are not to be used for design purposes, for example for planning management activities, but simply to produce an order-of-magnitude assessment of the societal burden generated by nuclear activities, the exercise may help to place in a rational perspective the radiological and environmental burden generated by the first half century of nuclear activities. The estimates may be used for comparison with environmental burdens created by other means of energy production and other human activities and to provide some rationality to the societal controversy about nuclear energy.
This publication has to be considered as a first iteration to be revised and updated in the future as more reliable and comprehensive data become available.
25

REFERENCES
[1] CSULLOG G. W., POZDNIAKOV I., The IAEA Net Enabled Waste Management Database – Development and Implementation of version II, DISTEC 2004, an International Conference on Radioactive Waste Disposal, April 26-28, 2004, Berlin, Germany (2004). NEWMDB is accessible on: http://www-newmdb.iaea.org/reports.asp
[2] INTERNATIONAL ATOMIC ENERGY AGENCY, Joint Convention on the Safety of Spent Fuel Management and on the Safety of Radioactive Waste Management, IAEA International Law Series No. 1, IAEA, Vienna (2006). http://www-ns.iaea.org/conventions/waste-jointconvention.htm
[3] INTERNATIONAL ATOMIC ENERGY AGENCY, Inventory of Radioactive Waste Disposals at Sea, IAEA-TECDOC-1105, IAEA, Vienna (1999).
[4] INTERNATIONAL ATOMIC ENERGY AGENCY, DIRATA: Discharge of Radionuclides to Atmosphere and Aquatic environment: (Internet site under development).
[5] INTERNATIONAL ATOMIC ENERGY AGENCY, Directory of Radioactively Contaminated Sites: http://www-drcs.iaea.org/
[6] OECD NUCLEAR ENERGY AGENCY, Uranium 2005: Resources, Production and Demand, OECD, Paris (2006).
[7] UNITED STATES DEPARTMENT OF ENERGY, Integrated Data Base Report – 1996: U.S. Spent Nuclear Fuel and Radioactive Waste Inventories, Projections, and Characteristics, DOE/RW-0006, Rev. 13, Washington, DC (1997).
[8] MAKHIJANI A., HU H., YIH K., (Editors), Nuclear Wastelands: A global Guide to Nuclear Weapons Production and its Health and Environmental Effects, The MIT Press, Cambridge, MA (1995).
[9] OECD NUCLEAR ENERGY AGENCY, Uranium 1997: Resources, Production and Demand, OECD/NEA, Paris (1998).
[10] URANIUM INFORMATION CENTRE, World Uranium Mining, Nuclear Issues Briefing Paper 41 (June 2003). www.uic.com.au/nip41.htm
[11] INTERNATIONAL ATOMIC ENERGY AGENCY, Nuclear Technology Review 2000, IAEA General Conference, 44th regular session, GC(44)/9, IAEA, Vienna (2000).
[12] MURRAY R. L., Understanding Radioactive Waste, Edited by Judith A. Powell, Battelle Press (1994).
[13] INTERNATIONAL ATOMIC ENERGY AGENCY, Radioactive Waste Management, an IAEA Source Book, STI/PUB/889, IAEA, Vienna (1992).
[14] NUCLEAR ENERGY INSTITUTE www.nei.org/index.asp?catnum=2&catid=74
[15] NIREX, The 1994 United Kingdom Radioactive Waste Inventory, DOE/RAS/96.001, UK Nirex Ltd Report no. 695 (1996).
[16] INTERNATIONAL INSTITUTE FOR APPLIED SYSTEMS ANALYSIS, The Radiation Legacy of the Soviet Nuclear Complex, an analytical overview, N. N. Egorov, V. M. Novikov, F. L. Parker and V. K. Popov (editors), IIASA, Laxenburg, Austria (2000).
[17] GARAMSZEGHY M., CANDU Annual Radioactive Waste Generation, private communication, October 2 (2000).
[18] NUCLEONICS WEEK, Nuclear Electricity Generation for March 2005, May 12, 2005, Vol. 46, No. 19 (2005).
[19] INTERNATIONAL ATOMIC ENERGY AGENCY, Status and Trends in Spent Fuel Reprocessing, IAEA-TECDOC-1467, IAEA, Vienna (2005).
27
[20] FUKUDA, K., DANKER, W., LEE, J.S., BONNE, A., and CRIJNS, M.J., IAEA Overview of global spent fuel storage, in Proceedings of an International Conference on Storage of Spent Fuel from Power Reactors, IAEA in cooperation with OECD/NEA, Vienna, 2-6 June (2003).
[21] UNITED STATES DEPARTMENT OF ENERGY, World Cumulative Spent Fuel Projections by Region and Country (2001). www.eia.doe.gov/cneaf/nuclear/page/forecast/cumfuel.html
[22] INTERNATIONAL ATOMIC ENERGY AGENCY, Transition from Operation to Decommissioning of Nuclear Installations, Technical Report Series No. 420, IAEA, Vienna (2004).
[23] INTERNATIONAL ATOMIC ENERGY AGENCY, Methods for the minimization of radioactive waste from decontamination and decommissioning of nuclear facilities, Technical Report Series No. 401, IAEA, Vienna (2001).
[24] JONES R. W., MCDONOUGH M. G., “Tracking Nuclear Proliferation: A Guide in Maps and Charts”, Carnegie Endowment for International Peace (1998).
[25] ROBBINS A., MAKHIJANI A., YIH K., Radioactive Heaven and Earth, The Apex Press, New York (1991).
[26] BRADLEY D. J., “Behind the Nuclear Curtain: Radioactive Waste Management in the Former Soviet Union”, Battelle Press, Columbus, Richland (1997).
[27] GEPHART R., “Hanford: A conversation about nuclear waste and cleanup”, Battelle Press, Columbus, Richland (2003).
[28] UNITED STATES DEPARTMENT OF ENERGY, Radioactive Waste Management, DOE Order 5820.2A, Washington, D.C., September 26 (1988).
[29] INTERNATIONAL ATOMIC ENERGY AGENCY, Waste Inventory Record Keeping Systems (WIRKS) for the Management and Disposal of Radioactive Waste, IAEA-TECDOC-1222, IAEA, Vienna (2001).
[30] NUCLEAR INFORMATION AND RECORDS MANAGEMENT ASSOCIATION (NIRMA) home page: http://www.nirma.org/index.htm
[31] WORLD INFORMATION SERVICE ON ENERGY (WISE) Uranium Project, home page: http://www.wise-uranium.org/nfp.html
28
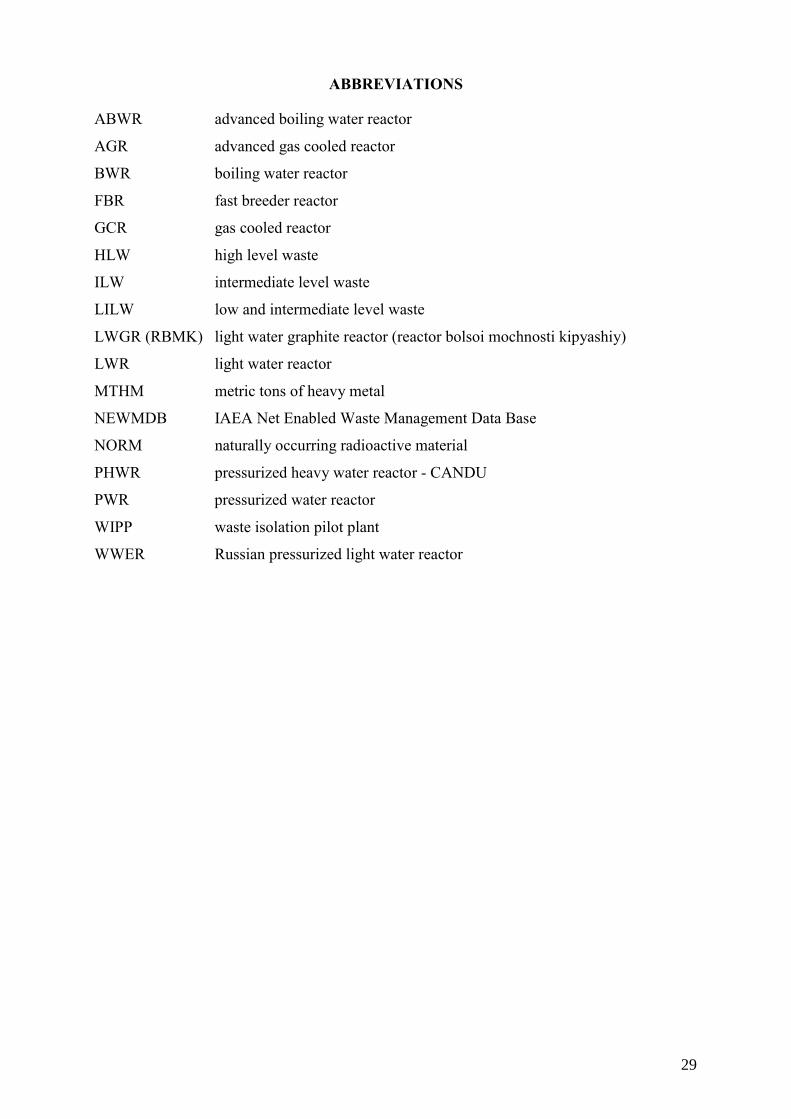
ABBREVIATIONS
ABWR advanced boiling water reactor
AGR advanced gas cooled reactor
BWR boiling water reactor
FBR fast breeder reactor
GCR gas cooled reactor
HLW high level waste
ILW intermediate level waste
LILW low and intermediate level waste
LWGR (RBMK) light water graphite reactor (reactor bolsoi mochnosti kipyashiy)
LWR light water reactor
MTHM metric tons of heavy metal
NEWMDB IAEA Net Enabled Waste Management Data Base
NORM naturally occurring radioactive material
PHWR pressurized heavy water reactor - CANDU
PWR pressurized water reactor
WIPP waste isolation pilot plant
WWER Russian pressurized light water reactor
29

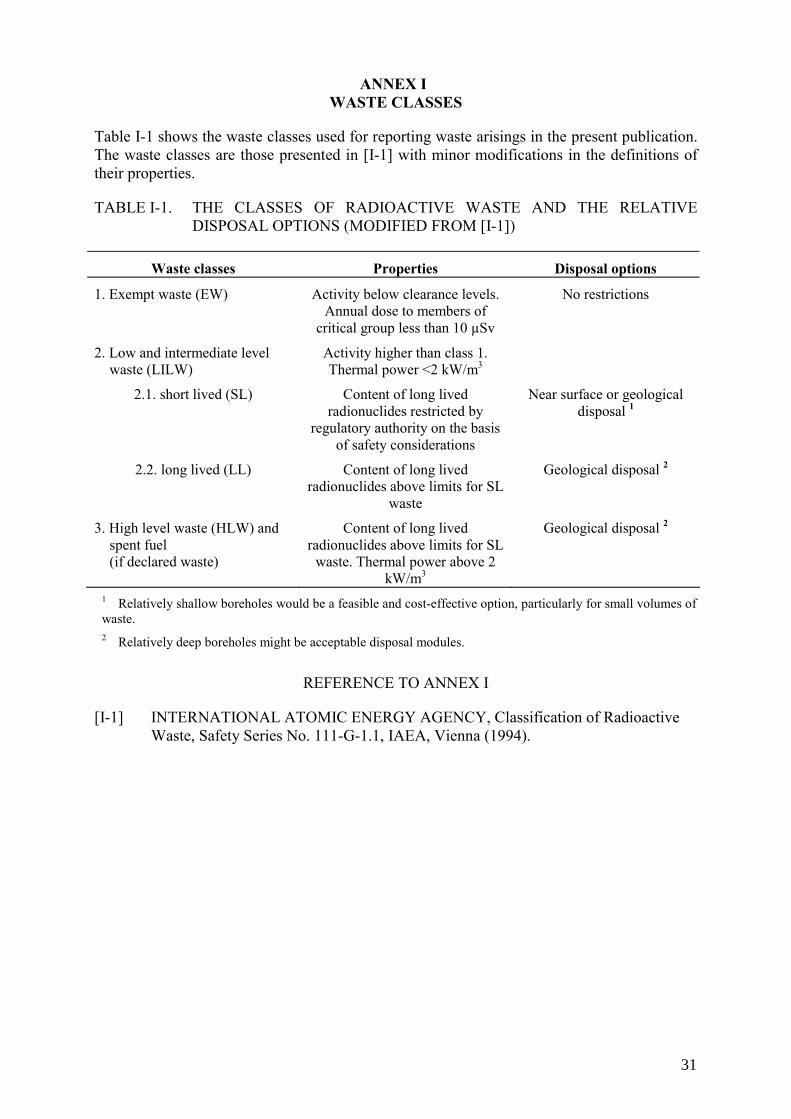
ANNEX I WASTE CLASSES
Table I-1 shows the waste classes used for reporting waste arisings in the present publication. The waste classes are those presented in [I-1] with minor modifications in the definitions of their properties.
TABLE I-1. THE CLASSES OF RADIOACTIVE WASTE AND THE RELATIVE DISPOSAL OPTIONS (MODIFIED FROM [I-1])
Waste classes Properties Disposal options
1. Exempt waste (EW) Activity below clearance levels. Annual dose to members of
critical group less than 10 µSv
No restrictions
2. Low and intermediate level waste (LILW)
Activity higher than class 1. Thermal power <2 kW/m3
2.1. short lived (SL) Content of long lived radionuclides restricted by
regulatory authority on the basis of safety considerations
Near surface or geological disposal 1
2.2. long lived (LL) Content of long lived radionuclides above limits for SL
waste
Geological disposal 2
3. High level waste (HLW) and spent fuel (if declared waste)
Content of long lived radionuclides above limits for SL
waste. Thermal power above 2 kW/m3
Geological disposal 2
1 Relatively shallow boreholes would be a feasible and cost-effective option, particularly for small volumes of waste. 2 Relatively deep boreholes might be acceptable disposal modules.
REFERENCE TO ANNEX I
[I-1] INTERNATIONAL ATOMIC ENERGY AGENCY, Classification of Radioactive Waste, Safety Series No. 111-G-1.1, IAEA, Vienna (1994).
31
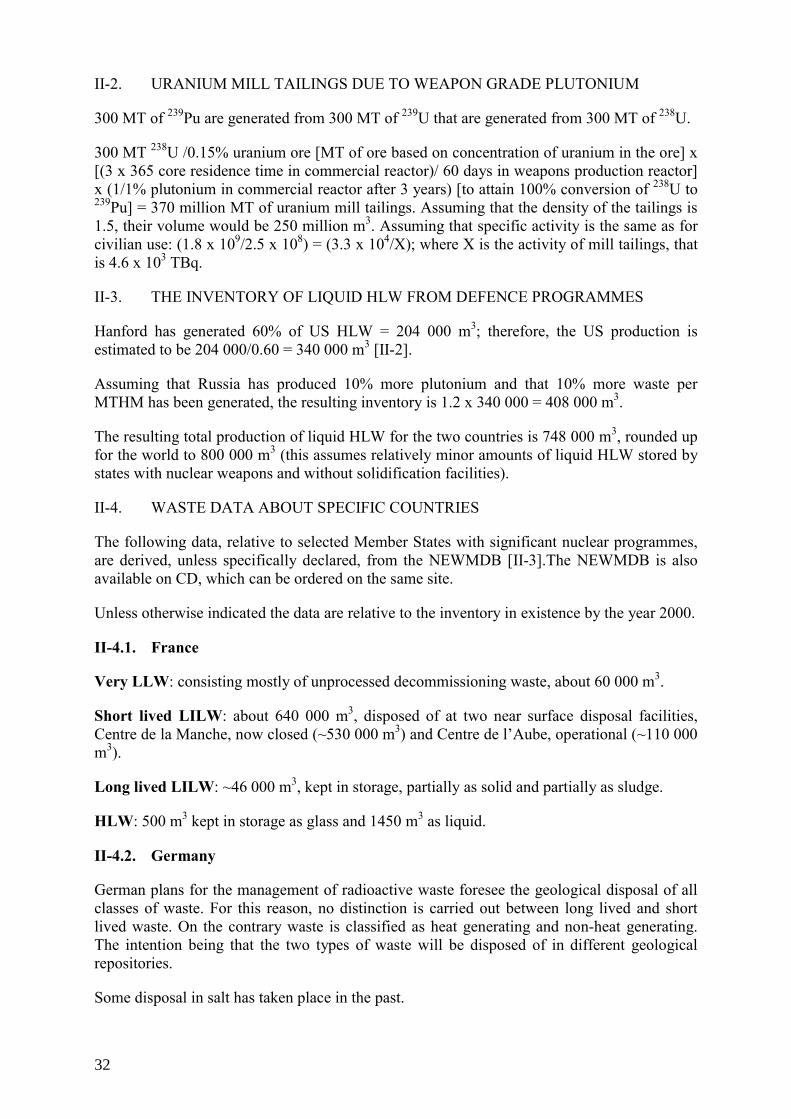
II-2. URANIUM MILL TAILINGS DUE TO WEAPON GRADE PLUTONIUM
300 MT of 239Pu are generated from 300 MT of 239U that are generated from 300 MT of 238U.
300 MT 238U /0.15% uranium ore [MT of ore based on concentration of uranium in the ore] x [(3 x 365 core residence time in commercial reactor)/ 60 days in weapons production reactor] x (1/1% plutonium in commercial reactor after 3 years) [to attain 100% conversion of 238U to 239Pu] = 370 million MT of uranium mill tailings. Assuming that the density of the tailings is 1.5, their volume would be 250 million m3. Assuming that specific activity is the same as for civilian use: (1.8 x 10⁹/2.5 x 108) = (3.3 x 10⁴/X); where X is the activity of mill tailings, that is 4.6 x 10³ TBq.
II-3. THE INVENTORY OF LIQUID HLW FROM DEFENCE PROGRAMMES
Hanford has generated 60% of US HLW = 204 000 m3; therefore, the US production is estimated to be 204 000/0.60 = 340 000 m3 [II-2].
Assuming that Russia has produced 10% more plutonium and that 10% more waste per MTHM has been generated, the resulting inventory is 1.2 x 340 000 = 408 000 m3.
The resulting total production of liquid HLW for the two countries is 748 000 m3, rounded up for the world to 800 000 m3 (this assumes relatively minor amounts of liquid HLW stored by states with nuclear weapons and without solidification facilities).
II-4. WASTE DATA ABOUT SPECIFIC COUNTRIES
The following data, relative to selected Member States with significant nuclear programmes, are derived, unless specifically declared, from the NEWMDB [II-3].The NEWMDB is also available on CD, which can be ordered on the same site.
Unless otherwise indicated the data are relative to the inventory in existence by the year 2000.
II-4.1. France
Very LLW: consisting mostly of unprocessed decommissioning waste, about 60 000 m3.
Short lived LILW: about 640 000 m3, disposed of at two near surface disposal facilities, Centre de la Manche, now closed (~530 000 m3) and Centre de l’Aube, operational (~110 000 m3).
Long lived LILW: ~46 000 m3, kept in storage, partially as solid and partially as sludge.
HLW: 500 m3 kept in storage as glass and 1450 m3 as liquid.
II-4.2. Germany
German plans for the management of radioactive waste foresee the geological disposal of all classes of waste. For this reason, no distinction is carried out between long lived and short lived waste. On the contrary waste is classified as heat generating and non-heat generating. The intention being that the two types of waste will be disposed of in different geological repositories.
Some disposal in salt has taken place in the past.
32
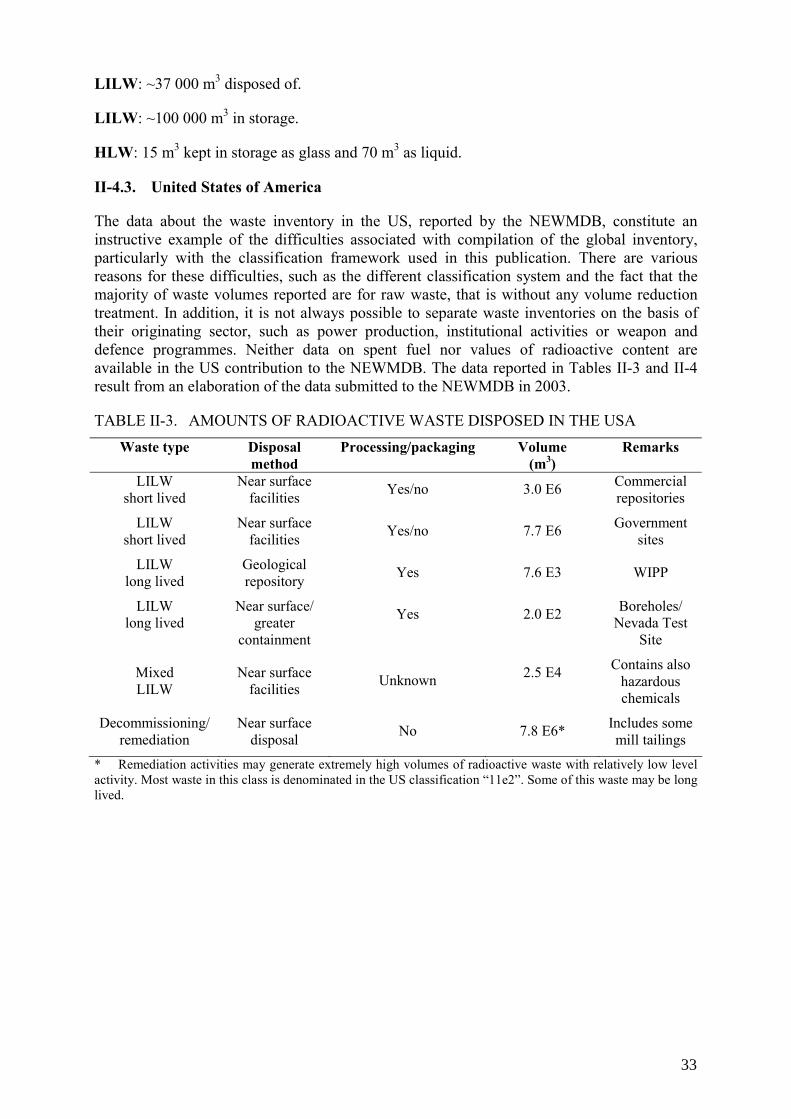
LILW: ~37 000 m3 disposed of.
LILW: ~100 000 m3 in storage.
HLW: 15 m3 kept in storage as glass and 70 m3 as liquid.
II-4.3. United States of America
The data about the waste inventory in the US, reported by the NEWMDB, constitute an instructive example of the difficulties associated with compilation of the global inventory, particularly with the classification framework used in this publication. There are various reasons for these difficulties, such as the different classification system and the fact that the majority of waste volumes reported are for raw waste, that is without any volume reduction treatment. In addition, it is not always possible to separate waste inventories on the basis of their originating sector, such as power production, institutional activities or weapon and defence programmes. Neither data on spent fuel nor values of radioactive content are available in the US contribution to the NEWMDB. The data reported in Tables II-3 and II-4 result from an elaboration of the data submitted to the NEWMDB in 2003.
TABLE II-3. AMOUNTS OF RADIOACTIVE WASTE DISPOSED IN THE USA Waste type Disposal
method Processing/packaging Volume
(m3) Remarks
LILW short lived
Near surface facilities Yes/no 3.0 E6 Commercial
repositories
LILW short lived
Near surface facilities Yes/no 7.7 E6 Government
sites
LILW long lived
Geological repository Yes 7.6 E3 WIPP
LILW long lived
Near surface/ greater
containment
Yes 2.0 E2 Boreholes/ Nevada Test
Site
Mixed LILW
Near surface facilities Unknown 2.5 E4 Contains also
hazardous chemicals
Decommissioning/ remediation
Near surface disposal No 7.8 E6* Includes some
mill tailings
* Remediation activities may generate extremely high volumes of radioactive waste with relatively low level activity. Most waste in this class is denominated in the US classification “11e2”. Some of this waste may be long lived.
33
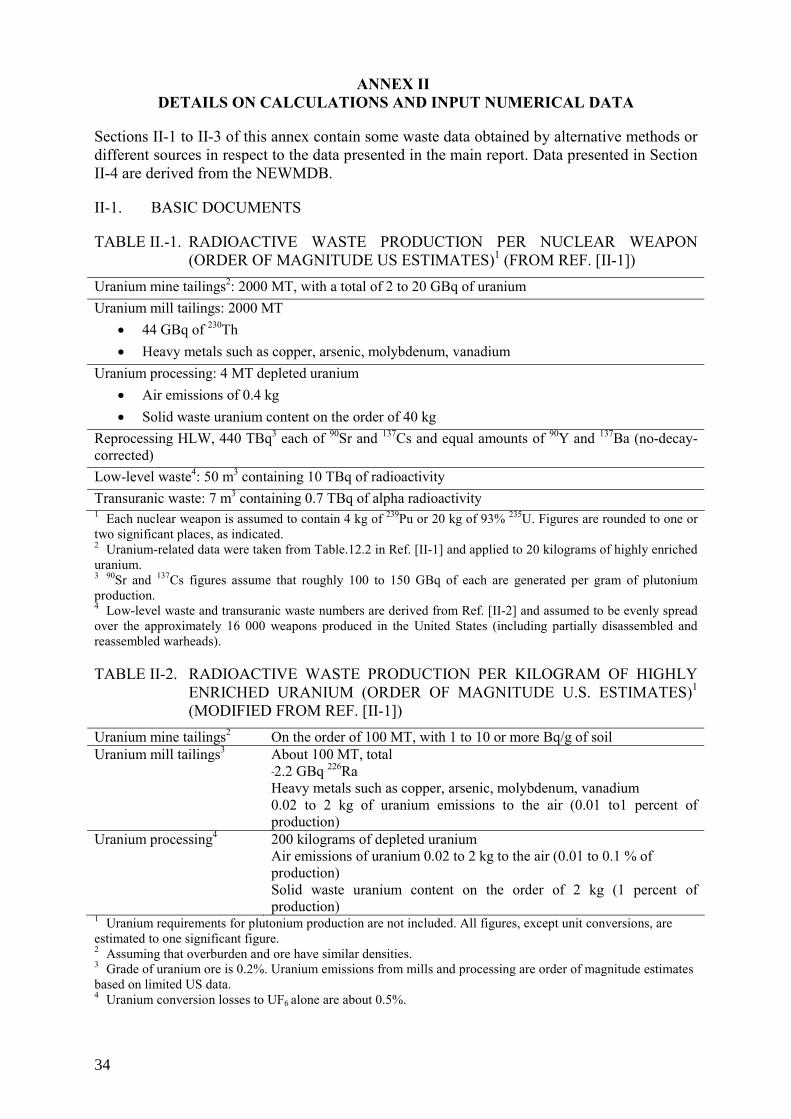
ANNEX II DETAILS ON CALCULATIONS AND INPUT NUMERICAL DATA
Sections II-1 to II-3 of this annex contain some waste data obtained by alternative methods or different sources in respect to the data presented in the main report. Data presented in Section II-4 are derived from the NEWMDB.
II-1. BASIC DOCUMENTS
TABLE II.-1. RADIOACTIVE WASTE PRODUCTION PER NUCLEAR WEAPON (ORDER OF MAGNITUDE US ESTIMATES)1 (FROM REF. [II-1])
Uranium mine tailings2: 2000 MT, with a total of 2 to 20 GBq of uranium Uranium mill tailings: 2000 MT
• 44 GBq of 230Th • Heavy metals such as copper, arsenic, molybdenum, vanadium
Uranium processing: 4 MT depleted uranium • Air emissions of 0.4 kg • Solid waste uranium content on the order of 40 kg
Reprocessing HLW, 440 TBq3 each of 90Sr and 137Cs and equal amounts of 90Y and 137Ba (no-decay-corrected) Low-level waste4: 50 m3 containing 10 TBq of radioactivity Transuranic waste: 7 m3 containing 0.7 TBq of alpha radioactivity 1 Each nuclear weapon is assumed to contain 4 kg of 239Pu or 20 kg of 93% 235U. Figures are rounded to one or two significant places, as indicated. 2 Uranium-related data were taken from Table.12.2 in Ref. [II-1] and applied to 20 kilograms of highly enriched uranium. 3 90Sr and 137Cs figures assume that roughly 100 to 150 GBq of each are generated per gram of plutonium production. 4 Low-level waste and transuranic waste numbers are derived from Ref. [II-2] and assumed to be evenly spread over the approximately 16 000 weapons produced in the United States (including partially disassembled and reassembled warheads).
TABLE II-2. RADIOACTIVE WASTE PRODUCTION PER KILOGRAM OF HIGHLY ENRICHED URANIUM (ORDER OF MAGNITUDE U.S. ESTIMATES)1
(MODIFIED FROM REF. [II-1]) Uranium mine tailings2 On the order of 100 MT, with 1 to 10 or more Bq/g of soil Uranium mill tailings3 About 100 MT, total
˜2.2 GBq 226Ra Heavy metals such as copper, arsenic, molybdenum, vanadium 0.02 to 2 kg of uranium emissions to the air (0.01 to1 percent of production)
Uranium processing4 200 kilograms of depleted uranium Air emissions of uranium 0.02 to 2 kg to the air (0.01 to 0.1 % of production) Solid waste uranium content on the order of 2 kg (1 percent of production)
1 Uranium requirements for plutonium production are not included. All figures, except unit conversions, are estimated to one significant figure. 2 Assuming that overburden and ore have similar densities. 3 Grade of uranium ore is 0.2%. Uranium emissions from mills and processing are order of magnitude estimates based on limited US data. 4 Uranium conversion losses to UF6 alone are about 0.5%.
34
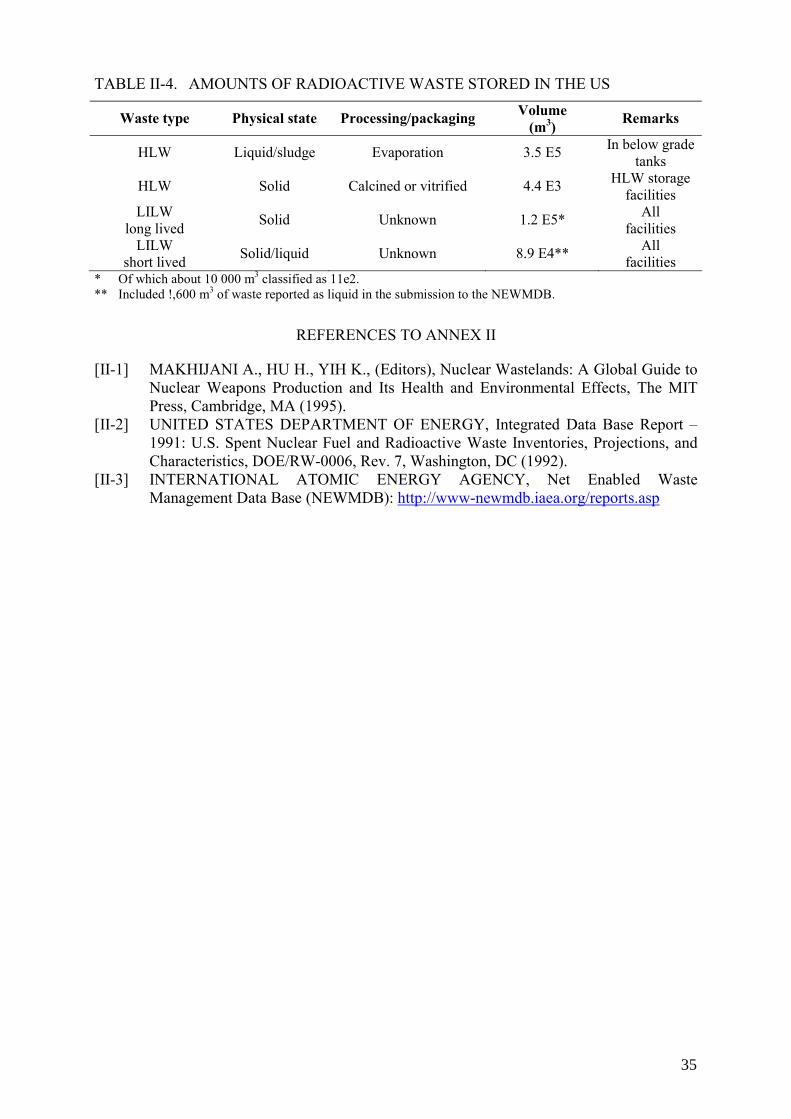
TABLE II-4. AMOUNTS OF RADIOACTIVE WASTE STORED IN THE US
Waste type Physical state Processing/packaging Volume (m3) Remarks
HLW Liquid/sludge Evaporation 3.5 E5 In below grade tanks
HLW Solid Calcined or vitrified 4.4 E3 HLW storage facilities
LILW long lived Solid Unknown 1.2 E5* All
facilities LILW
short lived Solid/liquid Unknown 8.9 E4** All facilities
* Of which about 10 000 m3 classified as 11e2. ** Included !,600 m3 of waste reported as liquid in the submission to the NEWMDB.
REFERENCES TO ANNEX II
[II-1] MAKHIJANI A., HU H., YIH K., (Editors), Nuclear Wastelands: A Global Guide to Nuclear Weapons Production and Its Health and Environmental Effects, The MIT Press, Cambridge, MA (1995).
[II-2] UNITED STATES DEPARTMENT OF ENERGY, Integrated Data Base Report – 1991: U.S. Spent Nuclear Fuel and Radioactive Waste Inventories, Projections, and Characteristics, DOE/RW-0006, Rev. 7, Washington, DC (1992).
[II-3] INTERNATIONAL ATOMIC ENERGY AGENCY, Net Enabled Waste Management Data Base (NEWMDB): http://www-newmdb.iaea.org/reports.asp
35

ANNEX III ENVIRONMENTAL INVENTORIES OF RADIOACTIVE MATERIAL
III-1. RELEASES TO THE ENVIRONMENT FROM PAST OPERATIONS
In some cases liquid radioactive waste has been discharged in surface water bodies or pumped in wells at various depths and at sites characterized by extremely different geological conditions. Examples of environmental contamination caused by the discharge of liquid radioactive waste in surface water bodies are the Techa River basin and the Karachai Lake in the area near the Mayak PA plant in the Ural region [III-1].
During the years 1949-1956, about 76 million m3 of liquid waste were discharged in the Techa River with a radioactive content of 1.0 E5 TBq (both 90Sr and 137Cs amounted to 11-12% of the total). As a result of the discharge in the river, downstream populations were exposed to radiation doses that were considered unacceptable. Consequently various remediation measures were enforced, including reduction of waste discharges and resettlement of a number of downstream villages [III-1].
One of the measures enforced to limit the contamination of the Techa River was to discharge the waste in storage ponds. Karachai Lake was used as a storage pond for liquid ILW. Contaminated sediments from the banks of the lake were then scattered by wind and caused the contamination of an area of 1800 km2 [III-1]. The total activity discharged in the Karachai Lake is estimated to be about 22 TBq consisting mainly of 137Cs and 90Sr (activity ratio of the two radionuclides about 2.8).
Deep well injection of high level liquid radioactive waste was carried out by the former Soviet Union at three sites. The intention was to remove the radioactive material from the near surface environment and to rely on the isolation capacity of confined deep aquifers to allow decay of the radionuclides. The volumes and activities of liquid waste injected into deep wells at the sites of two Russian reprocessing plants are shown in Table 8 (Section 2.4.3.2 of main report).
Low level waste was also injected into wells in the USA. They were not quite as deep as the Russian wells and relied upon the length of travel between injection and discharge and on the retention by geological materials to allow decay of the radioactive contaminants. The latter approach has been used, inter alia, at some DOE sites such as Hanford and INEEL (Idaho).
A disposal approach used in an experimental way at the Oak Ridge National Laboratories in the years from 1959 to 1984 involved mixing liquid radioactive waste with cement to form a sludge that was then injected in a shale formation at depths as great as 300 m. The intention was to retain the radionuclides in the hardened cementitious material, counting on the low permeability of the shales to limit leaching and subsequent migration of the radionuclides. A total of 46 injections were carried out, injecting 19 000 m3 of waste grout mix with an activity of 5.2 E4 TBq [III-2].
The disposal options described in the preceding paragraphs can be considered geological disposal options in which containment is provided exclusively, or mainly (as in hydraulic fracturing), by the geological barriers. Due to questions, at least in the mind of some stakeholders, about the long term reliability of the different isolation systems, such disposal methods were abandoned in the USA.
36
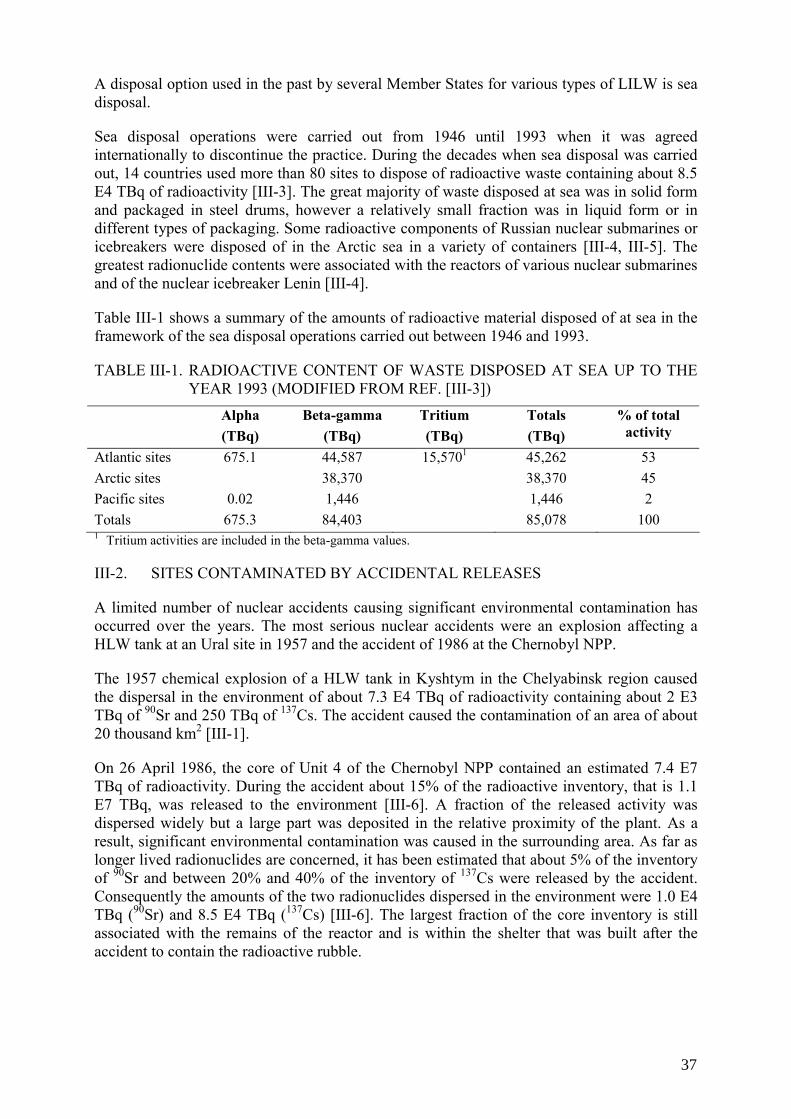
A disposal option used in the past by several Member States for various types of LILW is sea disposal.
Sea disposal operations were carried out from 1946 until 1993 when it was agreed internationally to discontinue the practice. During the decades when sea disposal was carried out, 14 countries used more than 80 sites to dispose of radioactive waste containing about 8.5 E4 TBq of radioactivity [III-3]. The great majority of waste disposed at sea was in solid form and packaged in steel drums, however a relatively small fraction was in liquid form or in different types of packaging. Some radioactive components of Russian nuclear submarines or icebreakers were disposed of in the Arctic sea in a variety of containers [III-4, III-5]. The greatest radionuclide contents were associated with the reactors of various nuclear submarines and of the nuclear icebreaker Lenin [III-4].
Table III-1 shows a summary of the amounts of radioactive material disposed of at sea in the framework of the sea disposal operations carried out between 1946 and 1993.
TABLE III-1. RADIOACTIVE CONTENT OF WASTE DISPOSED AT SEA UP TO THE YEAR 1993 (MODIFIED FROM REF. [III-3])
Alpha (TBq)
Beta-gamma (TBq)
Tritium (TBq)
Totals (TBq)
% of total activity
Atlantic sites 675.1 44,587 15,5701 45,262 53 Arctic sites 38,370 38,370 45 Pacific sites 0.02 1,446 1,446 2 Totals 675.3 84,403 85,078 100 1 Tritium activities are included in the beta-gamma values.
III-2. SITES CONTAMINATED BY ACCIDENTAL RELEASES
A limited number of nuclear accidents causing significant environmental contamination has occurred over the years. The most serious nuclear accidents were an explosion affecting a HLW tank at an Ural site in 1957 and the accident of 1986 at the Chernobyl NPP.
The 1957 chemical explosion of a HLW tank in Kyshtym in the Chelyabinsk region caused the dispersal in the environment of about 7.3 E4 TBq of radioactivity containing about 2 E3 TBq of 90Sr and 250 TBq of 137Cs. The accident caused the contamination of an area of about 20 thousand km2 [III-1].
On 26 April 1986, the core of Unit 4 of the Chernobyl NPP contained an estimated 7.4 E7 TBq of radioactivity. During the accident about 15% of the radioactive inventory, that is 1.1 E7 TBq, was released to the environment [III-6]. A fraction of the released activity was dispersed widely but a large part was deposited in the relative proximity of the plant. As a result, significant environmental contamination was caused in the surrounding area. As far as longer lived radionuclides are concerned, it has been estimated that about 5% of the inventory of 90Sr and between 20% and 40% of the inventory of 137Cs were released by the accident. Consequently the amounts of the two radionuclides dispersed in the environment were 1.0 E4 TBq (90Sr) and 8.5 E4 TBq (137Cs) [III-6]. The largest fraction of the core inventory is still associated with the remains of the reactor and is within the shelter that was built after the accident to contain the radioactive rubble.
37

III-3. WEAPON TEST SITES
The two major nuclear weapon states, the former Soviet Union and the USA, conducted numerous weapon tests within their territories at two locations: Semipalatinsk in Kazakhstan and the Nevada Test Site. Because of the fallout associated with atmospheric testing and with venting from some underground tests, later tests were mostly conducted at more remote locations, Pacific islands and Novaya Zemlya.
Significantly lower numbers of nuclear tests were performed by China, France and United Kingdom. In recent years a few nuclear tests have been carried out also by India and Pakistan. Due to the lack of suitable test sites within their domestic territories, France and UK carried out their tests at remote sites located in Algeria and Pacific islands (France) and Australia and Pacific islands (UK). The number of explosions and the radioactive inventories generated at the test sites are summarized below. Some radioactive material was dispersed in the environment and, at least for the amount released to the atmosphere as fine particles, became the global fallout discussed later. Explosions carried out underground or at the surface also left local contamination.
III-3.1. United States of America
i. Nevada Test Site
The first atmospheric nuclear test was conducted at the Nevada Test Site on January 27, 1951 [III-7]. Atmospheric testing at the site ceased in July 1962. During that time, 86 atmospheric tests were conducted there. 828 underground tests were also conducted at the site from 1951 until September 23, 1992. The activity of residual radioactive material underground at the site, corrected to September 23, 1992, was 4.9 E6 TBq [III-7]. This total includes some NORM from the site geological material that was incorporated into the melted material. Of specific interest were the activities of 90Sr, 137Cs, 239Pu, and 99Tc with 8.1 E4, 1.1 E5, 5.9 E3, 2.1 E5 TBq.
A different compilation shows that underground weapon testing (as of 1989) at the Nevada Test Site generated the following amounts of radioactivity [III-8]:
• 90Sr 1.0 E5 TBq • 137Cs 1.6 E5 TBq • 239Pu 4.1 E3 TBq
ii. Marshall Islands (Bikini and Enewetak Atolls)
The US conducted 106 tests in the Pacific Ocean region [III-9]:
• Pacific Ocean 4 • Johnston Atoll 12 • Enewetak 43 • Bikini 23 • Christmas Island 24
Many tests conducted in the Pacific region were in the high atmosphere and caused little local fallout, however a thermonuclear test performed in 1954 (called “Bravo”) caused unexpected heavy local fallout and direct exposure of inhabitants of nearby islands, fishermen on a boat
38

in the area and US servicemen. Residual contamination exists in the Bikini Atoll and in a few other minor atolls of the Marshall Islands [III-8–III-10].
It has been estimated that testing at Bikini Atoll has caused the dispersal of the following amounts of radioactivity [III-8]:
• 3H 3.4 E7 TBq • 90Sr 8.0 E4 TBq • 137Cs 1.3 E5 TBq • 239Pu <1.0 E3 TBq
III-3.2. Kazakhstan
(i) Semipalatinsk
The former Soviet Union, between 1949 and 1989, conducted at the Semipalatinsk Test Site 456 nuclear tests, including 86 atmospheric and 30 surface tests [III-8, III-11]. It has been estimated that as a result of testing approximately 9 E4 TBq of 137Cs were generated. Reference [III-9] does not provide estimates on the inventories of other radionuclides at the test site, however it is reasonable to assume that the amount of 90Sr would be similar, while the amounts of remaining long lived alpha emitters present at the site are expected to be significantly lower. The radioactive material is partially underground and partially at the surface as a consequence of deposition of fallout generated by atmospheric and surface explosions and by venting from underground tests.
It has been calculated that weapon testing at Semipalatinsk generated the widespread dispersion of the following amounts of radioactivity [III-12]:
• 90Sr 3.5 E3 TBq • 137Cs 6.6 E3 TBq • 239Pu <1.0 E2 TBq
Comparison of the amount of dispersed 137Cs with the estimated production indicates that a large fraction of the activity as been retained at the site, either underground or as soil/water contamination.
III-3.3. Russia Federation
(i) Novaya Zemlya
The test site, located in the Russian Arctic, is large and remote. Most tests conducted at the site were atmospheric and high altitude. One test of 1957 was conducted at the surface and a few more tests were at the water surface or underwater [III-9]. Local levels of contamination are not known.
Nuclear weapon testing (as of 1989) [III-9] generated the following amounts of radioactivity:
• 90Sr 8.5 E4 TBq • 137Cs 1.4 E5 TBq • 239Pu 2.8 E3 TBq
39
III-3.4. United Kingdom
(i) Maralinga, Emu test sites
The UK nuclear testing program consisted mainly of atmospheric explosions. A number of surface safety tests, involving chemical explosions and localized dispersal of 239Pu and uranium were conducted at the Maralinga and Emu test sites [III-13].
The Maralinga site has been the object of remediation measures based on removal of highly contaminated material and on stabilization of remaining contamination. Some activity is still at the site.
III-3.5. France
(ii) Algerian, Mururoa and Fangataufa test sites
The French nuclear testing program started with a few surface tests at a site near Reggane in the Algerian Sahara in 1960 and 1961 [III-9]. In Ecker, a nearby site, 13 underground tests and some safety explosions were conducted. Small amounts of plutonium were dispersed locally by these experiments.
The subsequent French testing programme was conducted at the atolls of Mururoa and Fangataufa in French Polynesia [III-14]. A total number of 193 “nuclear experiments” above and beneath Mururoa and Fangataufa Atolls were conducted between 1966 and 1996. Out of the total number of tests, 178 were nuclear explosions and 15 were safety trials in which nuclear devices were destroyed by chemical explosions [III-14]. Underground testing was conducted between 1975 and 1996. 127 underground tests were conducted at Mururoa and 10 at Fangataufa. In addition 10 underground safety trials were conducted at Mururoa.
Underground testing left radioactive material at the test sites. Some contaminated soil has been removed and buried locally. Residual contamination levels have been found to be very low [III-14]. Contamination still underground might migrate to the lagoon and the ocean with time, however the radiological impact of such release is anticipated to be negligible [III-14].
Underground weapon testing (as of 1989) generated the following amounts of radioactivity [III-9]:
• 90Sr 7.0 E3 TBq • 137Cs 1.1 E4 TBq • 239Pu 6.7 E2 TBq
III-3.6. China
(i) Lop Nor test site
The Chinese nuclear weapons testing programme was carried out at the Lop Nor test site in western China [III-9]. Between 1964 and 1996 China conducted 45 nuclear tests, 23 atmospheric and 22 underground, with a total yield of about 18 MT [III-15]. Weapons testing at Lop Nor (as of 1989) [III-8] left at the site a certain amount of 239Pu, which has been estimated to amount to about 6.7 E1 TBq.
40
III-4. DEPOSITION FROM ATMOSPHERIC TESTING
Two different estimates are available in literature.
Global deposition of radionuclides from atmospheric testing [III-16]:
• 90Sr 4.1 E5 – 4.8 E5 TBq • 137Cs 6.3 E5 – 7.8 E5 TBq • 14C 3.7 E5 TBq • 239Pu 9.4 E3 TBq
Another calculation indicates different amounts of fallout [III-9].
• 90Sr 6.1 E5 TBq • 137Cs 9.2 E5 TBq • 14C 2.1 E5 TBq • 239Pu 6.5 E3 TBq
Among the various assessments of the radiological burden due to radioactive fallout, the one carried out by UNSCEAR is probably the most authoritative [III-9].
III-5. SUMMARY OF ENVIRONMENTAL ACCUMULATIONS
Table III-2 shows rough estimates of the inventories of radioactive material existing at a number of sites. This material is not considered waste as it has not been generated as such and has not been emplaced in its current location as a result of waste management operations. In addition, such material, since it has never been considered waste, is not included in any compilation of radioactive waste inventories. For the sake of perspective, the table includes also an estimate of the global activity of a few radionuclides dispersed worldwide by fallout resulting from atmospheric weapon testing.
In reality, environmental accumulations of radioactive material may need the same surveillance and monitoring as facilities containing radioactive waste. Consequently they need institutional controls and represent a burden for human society. It seems therefore logical to consider such environmental accumulations as one component of the legacy of nuclear activities.
Quantification of the burden associated with environmental accumulations of radioactive material is rather difficult, particularly regarding accumulations at depth resulting from underground tests of nuclear weapons and deliberate injections. Depending on the depth of the explosion and on the hydrogeological conditions of the test site, the residual radionuclides may be more or less isolated from the biosphere. In case of tests performed at significant depth and without subsequent contact between the explosion chamber and moving groundwater, the isolation of the radionuclides could be considered to be similar to what could be achieved in a geological repository. This, which would be obviously the most favourable situation, seems to involve a burden relatively insignificant. In the different case of residual radionuclides being leached and transported by moving groundwater, long term surveillance and environmental monitoring might be required, causing, therefore, a significant burden.
Sites contaminated by different processes, such as nuclear accidents (e.g. the area surrounding the Chernobyl NPP) may also represent a long term burden.
41
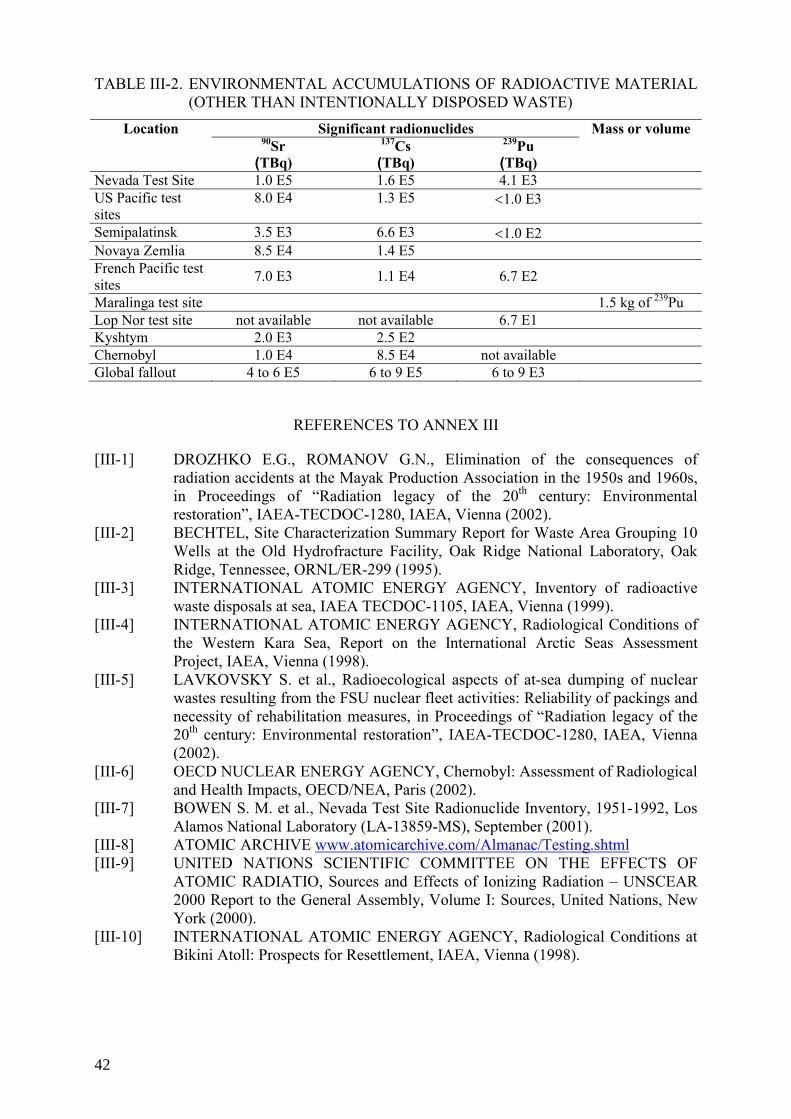
TABLE III-2. ENVIRONMENTAL ACCUMULATIONS OF RADIOACTIVE MATERIAL (OTHER THAN INTENTIONALLY DISPOSED WASTE)
Significant radionuclides Location 90Sr
(TBq) 137Cs (TBq)
239Pu (TBq)
Mass or volume
Nevada Test Site 1.0 E5 1.6 E5 4.1 E3 US Pacific test sites
8.0 E4 1.3 E5 <1.0 E3
Semipalatinsk 3.5 E3 6.6 E3 <1.0 E2 Novaya Zemlia 8.5 E4 1.4 E5 French Pacific test sites 7.0 E3 1.1 E4 6.7 E2
Maralinga test site 1.5 kg of 239Pu Lop Nor test site not available not available 6.7 E1 Kyshtym 2.0 E3 2.5 E2 Chernobyl 1.0 E4 8.5 E4 not available Global fallout 4 to 6 E5 6 to 9 E5 6 to 9 E3
REFERENCES TO ANNEX III
[III-1] DROZHKO E.G., ROMANOV G.N., Elimination of the consequences of radiation accidents at the Mayak Production Association in the 1950s and 1960s, in Proceedings of “Radiation legacy of the 20th century: Environmental restoration”, IAEA-TECDOC-1280, IAEA, Vienna (2002).
[III-2] BECHTEL, Site Characterization Summary Report for Waste Area Grouping 10 Wells at the Old Hydrofracture Facility, Oak Ridge National Laboratory, Oak Ridge, Tennessee, ORNL/ER-299 (1995).
[III-3] INTERNATIONAL ATOMIC ENERGY AGENCY, Inventory of radioactive waste disposals at sea, IAEA TECDOC-1105, IAEA, Vienna (1999).
[III-4] INTERNATIONAL ATOMIC ENERGY AGENCY, Radiological Conditions of the Western Kara Sea, Report on the International Arctic Seas Assessment Project, IAEA, Vienna (1998).
[III-5] LAVKOVSKY S. et al., Radioecological aspects of at-sea dumping of nuclear wastes resulting from the FSU nuclear fleet activities: Reliability of packings and necessity of rehabilitation measures, in Proceedings of “Radiation legacy of the 20th century: Environmental restoration”, IAEA-TECDOC-1280, IAEA, Vienna (2002).
[III-6] OECD NUCLEAR ENERGY AGENCY, Chernobyl: Assessment of Radiological and Health Impacts, OECD/NEA, Paris (2002).
[III-7] BOWEN S. M. et al., Nevada Test Site Radionuclide Inventory, 1951-1992, Los Alamos National Laboratory (LA-13859-MS), September (2001).
[III-8] ATOMIC ARCHIVE www.atomicarchive.com/Almanac/Testing.shtml [III-9] UNITED NATIONS SCIENTIFIC COMMITTEE ON THE EFFECTS OF
ATOMIC RADIATIO, Sources and Effects of Ionizing Radiation – UNSCEAR 2000 Report to the General Assembly, Volume I: Sources, United Nations, New York (2000).
[III-10] INTERNATIONAL ATOMIC ENERGY AGENCY, Radiological Conditions at Bikini Atoll: Prospects for Resettlement, IAEA, Vienna (1998).
42
[III-11] CHEREPNIN YU. S. et al., Radiation heritage of the past in the Republic of Kazakhstan, in Proceedings of “Radiation legacy of the 20th century: Environmental restoration”, IAEA-TECDOC-1280, IAEA, Vienna (2002).
[III-12] INTERNATIONAL ATOMIC ENERGY AGENCY, Radiological Conditions at the Semipalatinsk Test Site, Kazakhstan: Preliminary Assessment and Recommendations for Further Study, IAEA, Vienna (1998).
[III-13] MARTAC, Rehabilitation of former nuclear test sites at Emu and Maralinga (Australia), Report by the Maralinga Rehabilitation Technical Advisory Committee, Canberra (2002).
[III-14] INTERNATIONAL ATOMIC ENERGY AGENCY, The Radiological Situation at the Atolls of Mururoa and Fangataufa: Main Report, IAEA, Vienna (1998).
[III-15] NUCLEAR THREAT INITIATIVE (NTI) – Working for a safer world: www.nti.org/db/china/testlist.htm
[III-16] ROBBINS A., MAKHIJANI A., YIH K., Radioactive Heaven and Earth, The Apex Press, New York (1991).
43

CONTRIBUTORS TO DRAFTING AND REVIEW
Gera, F. Private consultant, Italy
Hioki, K. International Atomic Energy Agency
Keter, A. Israel Atomic Energy Commission, Israel
Parker, F. Private consultant, United States of America
Consultants meetings
Vienna, Austria 7–11 October 2002, 18–-22 August 2003,
23–27 August 2004 and 30 May–3 June 2005
45