estimation of the critical external heat leading to the
TRANSCRIPT

1
Estimation of the critical external heat leading to the failure
of lithium-ion batteries
1Wei Tang, 2Wai Cheong Tam, 1Liming Yuan, 1Thomas Dubaniewicz, 1Richard
Thomas, 1John Soles
1National Institute for Occupational Safety and Health (NIOSH), 626 Cochrans Mill Road,
Pittsburgh, PA, 15236, USA
2National Institute of Standards and Technology (NIST), 100 Bureau Dr., Gaithersburg, MD,
20899, USA
Corresponding author: Wei Tang, 626 Cochrans Mill Rd, Pittsburgh, PA 15236
Corresponding email: [email protected], [email protected]
Abstract
A detailed experimental investigation on the critical external heat leading to the failure of lithium-
ion (Li-ion) batteries was conducted using an Accelerating Rate Calorimeter (ARC) at the National
Institute for Occupational Safety and Health (NIOSH). Several types of commercial Li-ion
batteries were selected for the study, including an iron phosphate Li-ion battery (LFP), a lithium-
titanate battery (LTO), and a lithium-nickel-manganese-cobalt-oxide battery (NMC). Each battery
was placed in a specially designed sealed steel canister and heated in the ARC. Battery voltage
throughout the test was monitored and used to indicate the time to a battery failure. Three
thermocouples, one attached to the battery surface, one measuring air temperature inside the
canister, and one attached to the canister’s internal surface, were used to record temperature
changes during the heating tests. Different thermal behaviors were observed for the various battery
types. An analytical model was developed to estimate the total external heat received by the battery
using the measured temperatures. Experimental data ranked the batteries tested in terms of the heat
to failure as: LFP 26650 (11 kJ) > LFP 18650 (4.3 kJ) > NMC 18650 MH1 (3.6 kJ) ≈ LTO 18650
(3.6 kJ) > NMC 18650 HG2 (3 kJ). Total heat normalized to the battery nominal energy capacity
was also calculated and ranked as: LTO 18650 ≈ LFP 26650 ≈ LFP 18650 > NMC 18650 MH1 ≈
NMC 18650 HG2. The test and analysis method developed can be extended to other types of

2
batteries with a cylindrical shape. Results from this work provide insights to the thermal safety of
Li-ion batteries and can help enhance battery thermal design and management.
Keywords: Lithium-ion battery, Accelerating Rate Calorimetry, heat to failure, radiative heat
transfer, convective heat transfer
Highlights:
1. An experimental method was developed to study the thermal safety of Li-ion batteries.
2. Radiative, convective and total heat transfer to the battery is calculated using temperature.
3. Batteries tested were ranked based on the heat and normalized heat to failure
1. Introduction
The thermal safety of lithium-ion (Li-ion) cells has been an increasing concern due to their ever-
growing number of applications, from consumer electronic products to large electrical vehicles.
Li-ion battery-powered electric vehicles (BEVs) are also an important alternative to diesel-
powered devices in the mining industry. The potential use of Li-ion BEVs in gassy underground
mines poses unique fire and explosion hazards [1]. Methane-air mixtures are found in coal, salt,
copper, uranium and other types of mines, and the energy released during Li-ion battery failure
and thermal runaway can be a potential ignition source for such mixtures [2, 3]. A more reliable
Li-ion battery and its safe use can help reduce the risks of fire and explosion accidents in
underground mines.
Many studies have been performed to investigate the thermal stability of Li-ion batteries. When
the external heat applied to a battery exceeds its operating limit, chemicals inside the battery will
start to react. Generally, a Li-ion battery will undergo several chemical transformation processes
under heat abuse [4-6]: solid electrolyte interphase (SEI) layer decomposition, which has been
reported to start at a temperature as low as 69 °C [7], anode material and electrolyte reaction,
cathode material and electrolyte reaction, electrolyte decomposition, and anode material and
binder reaction. Exothermal chemical reactions will release energy and heat the battery further
until thermal runaway occurs.
Abraham et al. [8] conducted Accelerating Rate Calorimetry tests on 18650-type Li-ion batteries
and found that self-heating started at 84 °C. Wang et al. [9] studied the combustion behavior of 50

3
Ah LiFePO4/graphite batteries from external radiation and found that the thermal runaway occurs
when battery surface temperature reaches 126.7 ± 2.2 °C. Jhu et al. [10] reported the thermal
instability properties (initial exothermic temperature, self-heating rate, maximum temperature,
etc.) of LiCoO2 and Li(Ni1/3Co1/3Mn1/3)O2 of batteries using an adiabatic calorimetry test method.
FM Global studied the flammability of Li-ion batteries in bulk storage and the effectiveness of a
sprinkler fire suppression system [11]. Quintiere described a calorimetry technique to measure the
energetics of a Li-ion battery in thermal runaway [12] and was able to investigate the dynamics of
a battery’s thermal performance, including the time events, temperature, mass loss, and energies.
The thermal runaway of a cylindrical Li-ion battery was experimentally studied using an
Accelerating Rate Calorimeter [13]. Three stages of reactions were identified, and pressure and
temperature change were used to indicate each stage. Thermal modeling of cylindrical Li-ion
batteries has also been conducted to investigate their heat transfer characteristics and thermal
behaviors under various conditions, i.e., charging, discharging and heat abuse [14-15].
Fire calorimeter tests were performed in several studies to investigate the heat release rate and total
heat released from a burning Li-ion battery. Chen [16] investigated the thermal hazards of
cylindrical 18650 LiCoO2 and 18650 LiFePO4 batteries under different states of charge (SOC),
and found that the total heat release from a combusting battery increases with SOC. Larsson et al.
[17] studied the LFP 26650 battery burning characteristics and calculated the normalized total heat
release per energy capacity, estimated at 30 kJ/Wh for a pack of nine batteries. Chen et al. [18]
studied the heat release of different configurations of battery packs and found that the total heat
released from fires varied linearly with the number of cells.
Much of the previous work on the thermal stability of Li-ion batteries has been focused on the
effects of temperature on the internal chemical reactions and their subsequent consequences.
Battery temperature, as a convenient parameter, does provide important information on the battery
thermal safety. However, the battery thermal safety is also a function of the heating mode and heat
duration. From the perspective of energy balance, the amount of external heat that will lead to the
abnormal battery behaviors is also important information that has rarely been reported in the
literature. Total heat received by the battery is a combined parameter of the heating power, duration
and heating mode. Thus, it could be a good representative of the battery thermal stability. In this
paper, experimental investigations were performed to look at the critical external heat that leads to

4
the failure of several types of Li-ion batteries using Accelerating Rate Calorimeter. The amount of
time for the battery voltage to drop to zero was taken as the time to battery failure. Temperature
measurements were recorded for the battery surface and external heat sources. An analytical model
for the evaluation of the heat transfer between the heat source and the battery was developed and
used to estimate the critical amount of external heat that leads to the failure of the battery.
Normalized heat to failure using battery electrical energy capacity was also calculated and
compared to assess the thermal performance of the batteries tested. The results from this paper
provide new information on battery thermal behaviors and can be used to improve the thermal
design of a Li-ion battery under heat abuse.
2. Experiments
2.1 Selected batteries
Five types of commonly used commercial Li-ion batteries were selected for the study: iron
phosphate lithium-ion (LFP) batteries with two sizes, 18650 and 26650 (18650 means the cylinder
is 18 mm in diameter and 65 mm in length; 26650 means the cylinder is 26 mm in diameter and
65 mm in length), two types of lithium-nickel-manganese-cobalt-oxide (NMC) 18650 batteries
which use lithium-nickel-manganese-cobalt as a cathode and graphite as an anode (the proportion
of the metal oxide mixtures in the cathode of the two NMC batteries is not open information), and
lithium-titanate (LTO) 18650 batteries which use lithium titanate for an anode and lithium
manganese oxide as a cathode. The LFP battery uses a lithium ferro-phosphate (LiFePO4) cathode
and a graphite anode. The two types of NMC batteries have different rated capacities and were
noted as NMC 18650 MH1 and NMC 18650 HG2. Among the batteries selected, LFP batteries is
primarily used for stationary storage due to its stability, NMC batteries are viewed as the ideal
material for electric cars with its high capacity, LTO batteries are widely used in mobile medical
devices [19]. Table 1 lists the pretest parameters of the tested batteries. Prior to testing, the batteries
were conditioned with three charge-discharge cycles and then charged to 100% state of change
(SOC) using an Arbin Multi-channel Potentiostat/Galvanostat (MSTAT) system following battery
manufacturer-specific parameters.
Table 1. Parameters of the tested batteries
Battery type Weight
(g)
Measured/Rated
capacity (Ah)
Measured/Nominal
voltage (V)
Measured/nominal
energy capacity (Wh)
LFP 18650 41.8 1.605/1.5 3.34/3.2 5.36/4.8

5
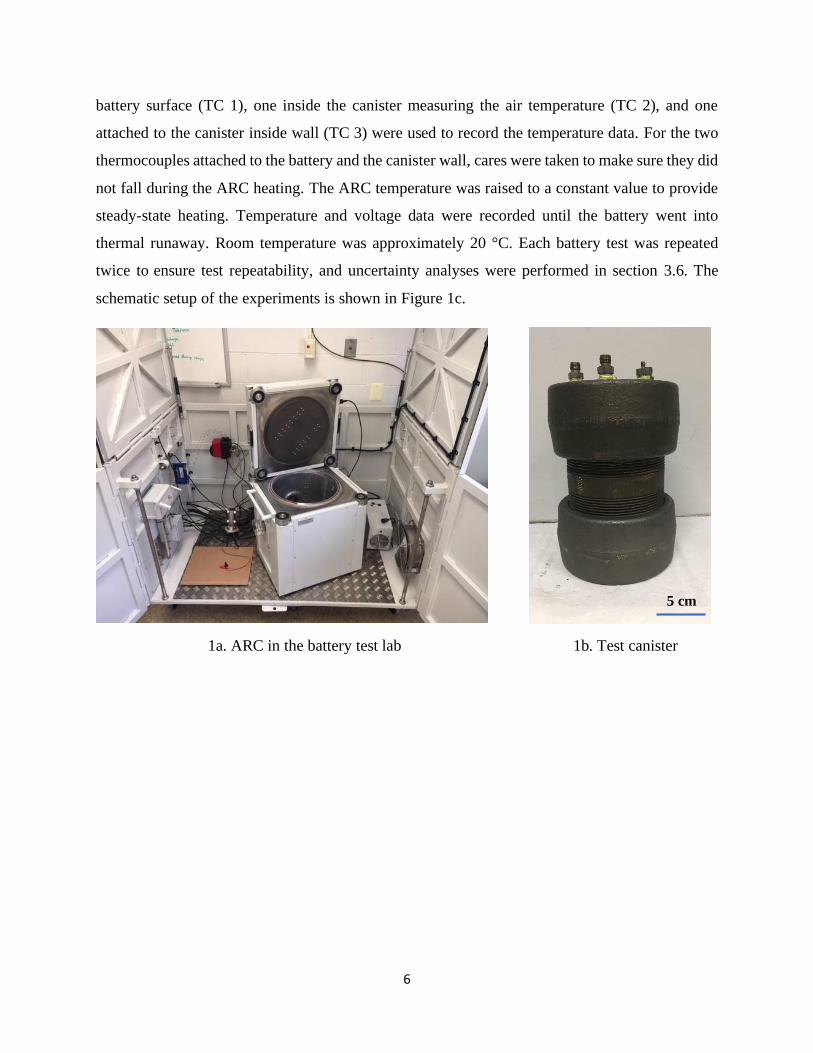
2.2 Accelerating Rate Calorimeter
Figure 1a shows the EV+ Accelerating Rate Calorimeter (ARC, Thermal Hazard Technology
(THT), Bletchley, UK) that was used to conduct the battery thermal tests. The ARC is cylindrical
with a diameter of 40 cm and a depth of 44 cm. Several heaters were installed within the ARC to
provide a maximum temperature of 305°C with a measuring sensitivity of 0.05 °C/min.
Thermocouples embedded in the ARC lid, walls, and bottom recorded the temperature of the ARC.
During the tests, the heating power of the ARC is set to 70% of its maximum, which is 7 kW per
its using requirements. Calibrations were conducted on a regular basis to ensure there is no
temperature drift during tests. The heating power of the ARC was kept the same for all the tests.
2.3 Holding canister
Inside the ARC, a specially designed cylindrical steel canister was used to contain the battery,
shown in the Figure 1b. The canister was made of black steel with a 9.7-cm diameter and 17.4-cm
height. The side-wall thickness was approximately 0.3 cm. The inside surface of the canister was
painted with flat black stove paint so that the heat transfer process from the canister wall to the
battery could be treated as black body radiation. Multiple holes were drilled on the canister cap for
compression fittings to facilitate temperature and voltage measurements inside the canister.
Canister seal integrity was checked prior to ARC tests using a manometer and a pneumatic hand
pump. The canister was positioned in the center of the ARC.
2.4 Temperature and voltage measurement
For each test, one Li-ion battery was positioned in the center of the canister. The external plastic
cover of the battery was removed, this is to avoid that when the battery is heated in the ARC, the
external plastic cover will be melted and forming a layer of protection, thus influencing the heat
transfer to the battery. The outside metal surface was painted using flat black stove paint so that
the emissivity of the battery surface can be taken as one and the calculation of the radiative heat
transfer can be simplified. Wire leads were attached to both ends of the battery for voltage
measurements. Three N-type thermocouples with a bead diameter of 0.5 mm, one attached to the
LFP 26650 84.1 3.048/3.2 3.32/3.2 10.12/10.24
LTO 18650 38.6 1.278/1.3 2.67/2.4 3.41/3.12
NMC 18650 MH1 45.7 3.076/3.2 4.14/3.7 12.73/11.84
NMC 18650 HG2 46.9 2.985/3.0 4.18/3.6 12.48/10.8
6
battery surface (TC 1), one inside the canister measuring the air temperature (TC 2), and one
attached to the canister inside wall (TC 3) were used to record the temperature data. For the two
thermocouples attached to the battery and the canister wall, cares were taken to make sure they did
not fall during the ARC heating. The ARC temperature was raised to a constant value to provide
steady-state heating. Temperature and voltage data were recorded until the battery went into
thermal runaway. Room temperature was approximately 20 °C. Each battery test was repeated
twice to ensure test repeatability, and uncertainty analyses were performed in section 3.6. The
schematic setup of the experiments is shown in Figure 1c.
1a. ARC in the battery test lab 1b. Test canister
5 cm

7
1c. Schematic setup of the test 1d. Li-ion cells tested
Figure 1. Lab photo and schematic setup of the battery thermal test
3. Results and Discussion
3.1 Detection of battery failure
Figure 2 shows the time plot of battery voltage. In the case of the LFP 18650 battery, the initial
battery voltage started at 3.34 V and, after about 2 hours of heating in the ARC, a significant
drop in voltage was observed. After that, the battery voltage went through a turbulent period
till resting at 0 V. In the case of LFP 26650 battery, a sudden drop to 0 V was observed. The
voltage change patterns of NMC 18650 MH1 and HG2 were similar to that of LFP 18650,
while the LTO 18650 was similar to that of LFP 26650. Hereafter, battery failure is defined
when a significant voltage drop is observed and the time to the battery failure is used for battery
heat transfer analysis.
LFP 26650
LFP 18650
NMC 18650 MH1
NMC 18650 HG2
LTO 18650

8
Figure 2. Battery voltage changes in thermal tests
3.2 Temperature measurement

9
Battery surface temperature, gas temperature inside the canister, and canister interior wall
temperature for each battery test were plotted against time and shown in Figure 3 The battery
inside the canister was heated by hot wall radiation and gas convection. Generally, a battery will
go through several thermal stages during an ARC test. First, the battery temperature increases as
the canister wall temperature and interior gas temperature increase. In this stage, the battery keeps
absorbing heat from its surroundings, both in the form of wall radiation and natural convection.
After the battery temperature reaches a certain point, chemicals inside the battery start to react and
the battery temperature quickly rises and exceeds the canister and gas temperature due to the
exothermic processes. At this stage, the battery will no longer absorb heat from the surroundings
but, instead, it will release energy in the form of vented gases. Battery temperature will reach its
peak value when thermal runaway occurs, after which the test is terminated, and the cooling starts.
Various thermal behaviors were observed for different types of batteries during the heating in the
ARC. For example, the LFP batteries vented at about 180 °C with a slight drop in temperature.
After venting, chemical reactions inside the battery kept releasing heat, and the battery temperature
increased until thermal runaway occurred. Battery thermal runaway peak temperature for the NMC
MH1 battery reached around 1,000 °C and was much higher than the peak thermal runaway
temperatures of the other types of batteries. The battery failure happened around the time when
battery temperature exceeded the wall and gas temperatures. In this study, in order to estimate the
amount of external heat that was absorbed by the battery until its failure, the temperature data were
used to do a heat transfer analysis for the period from the start of the test to the battery failure. The
time to battery failure, time to battery thermal runaway, temperature at battery failure, and peak
temperature at battery thermal runaway for each battery type are summarized in Table 2.

10
Figure 3. Battery surface, gas, and wall temperatures during ARC tests
Table 2. Timing and temperatures for each battery type

11
3.3 Heat transfer to the battery
One of the most important parameters of interest to battery safety design and storage is the total
heat received by the battery through its surface from the surrounding environment. In this section,
an analytical model is provided to understand the contribution from the different modes of heat
transfer and to estimate the total heat transfer to the battery causing battery failure and potential
thermal runaway.
For each test, the ARC was first turned on and a uniform heating was imposed on the entire
canister. As shown in Figure 3, the gas temperature inside the canister nearly coincided with the
canister internal wall temperature. Battery surface temperature also increased following the
heating from the canister wall and gas. Since the experimental setup is a closed system, forced
convection does not exist. Thermal conductivity of air at the tested temperatures is low, and
conductive heat transfer to the battery surface is negligible. Therefore, the heat transfer to the
battery from the surroundings is primarily controlled by canister wall radiation and natural
convection from the gas. Other heat transfer mechanisms, such as the latent heat of the battery,
conductive heat transfer within the battery, and the heat generation due to chemical reactions, can
be important to analysis of the thermal behavior of the battery at different stages [19-21]. However,
the current analysis focuses on the early stage before the thermal runaway occurs. Thus these heat
transfer mechanisms inside the battery are neglected. Figure 4 illustrates the geometries of the
battery inside the canister.
Battery type Time to
failure (min)
Time to thermal
runaway (min)
Temperature at
failure (°C)
Thermal runaway peak
temperature (°C)
LFP 18650 134.46 172.8 168 408
LFP 26650 120.22 134.1 183 412
LTO 18650 113.46 114 150 419
NMC 18650 MH1 85.65 106.8 125 960
NMC 18650 HG2 77.83 97.6 124 805
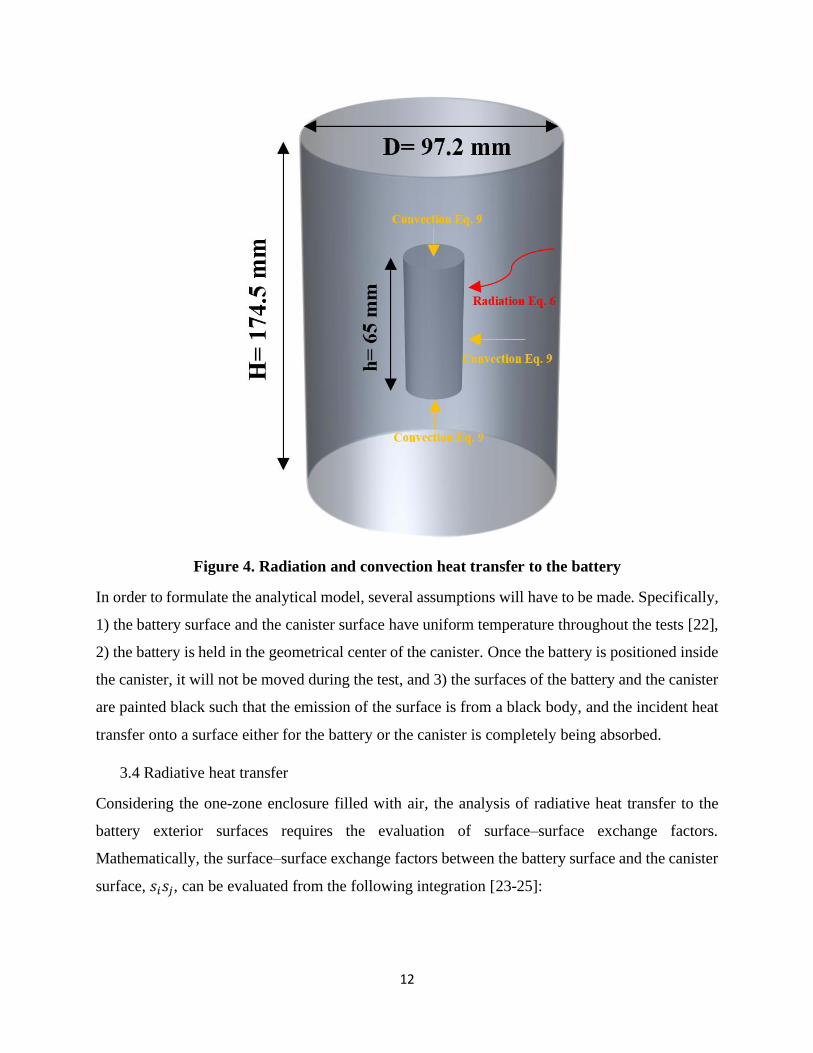
12
Figure 4. Radiation and convection heat transfer to the battery
In order to formulate the analytical model, several assumptions will have to be made. Specifically,
1) the battery surface and the canister surface have uniform temperature throughout the tests [22],
2) the battery is held in the geometrical center of the canister. Once the battery is positioned inside
the canister, it will not be moved during the test, and 3) the surfaces of the battery and the canister
are painted black such that the emission of the surface is from a black body, and the incident heat
transfer onto a surface either for the battery or the canister is completely being absorbed.
3.4 Radiative heat transfer
Considering the one-zone enclosure filled with air, the analysis of radiative heat transfer to the
battery exterior surfaces requires the evaluation of surface–surface exchange factors.
Mathematically, the surface–surface exchange factors between the battery surface and the canister
surface, 𝑠𝑖𝑠𝑗, can be evaluated from the following integration [23-25]:

13
( ) ( )
4 20
cos cos1g
i j
a T S
b w i j
i j j iA A
w
e T es s d dA dA
T S
−
= (1)
where Tw is the interior surface temperature of the canister with an area of Ai, Tg is the gas medium
temperature, S is the line-of-sight distance between the two integration area elements, dAi and dAj,
θi and θj are the angles between the line-of-sight and the unit normal vector of the two differential
area elements, σ is the Stefan-Boltzmann constant, eλb is the blackbody emissive power, and aλ is
the local absorption coefficient. Using the neural network formulation provided in [24], Eq. (1)
can be expressed as:
( )( )amvCOamgwgjijiiji LfXLPTTFAss ,, ,,,,12−− −= (2)
where Fi-j is the view factor from canister surface Ai to battery surface Aj, αi-j is the geometric
absorptance between two areas, Pg is the absorbing gas partial pressure, XCO2 is mole fraction of
CO2, fv is the soot volume fraction, and Lm,a is the averaged mean beam length.
In the current geometric setting, a battery surface can only view a certain part of the canister (i.e.,
the top and bottom surface of the battery can view two canister surfaces, the side surface of the
battery can view three canister surfaces). For that, the incident heat flux due to the canister wall
emission will be:
( )2
4
, , ,
1
1 , , , ,N
w i w j ji ij w j g g ij CO v ij
j
q T F T T P L X f L =
= −
(3)
Since the gas medium bounded between the battery surface and the canister surface is absorbing
and emitting radiation, the incident heat flux due to the gas medium will be:
( )2
4
,
1
, , , ,N
g i g ji ij g g g ij CO v ij
j
q T F T T P L X f L =
= (4)
The total radiative heat transfer on the battery surface will be the sum of the wall emission and the
gas emission:
, , ,rad i w i g iq q q = + (5)
Equations 3–5 are the general governing equations to estimate the total radiation heat transfer on
the battery surface due to both emission from the canister wall and the gas medium. From Figure

14
3, it can be seen that the emitting surface temperature of the canister wall and the temperature of
the gas medium were very close (less than 5% difference). The energy being absorbed by the gas
due to emission from the canister surface will be made up by the emission from the gas itself [24].
Therefore, the radiation effect due to the participating gas medium is negligible. It is worth noting
that the effect of the participating medium for the analysis of radiative heat transfer will become
significant when the emitting surface and the gas medium temperatures are significantly different.
With this simplification, the net radiative heat transfer to the battery from the canister wall can be
simplified as:
( ) ( )44
,, bwbigiwbrad TTAqqAq −=+= (6)
where Tw and Tb are the canister wall and battery surface temperature respectively. Ab is the battery
surface area. The net heat exchange for the battery surface due to thermal radiation, radq , is plotted
in Figure 5 against the time. The data were only displayed from the start of the test to the battery
failure. It can be observed that the radiation heat received for LFP 26650 was much higher than
other types of batteries, partly because the size of the LFP 26650 is larger than other types of
batteries, and thus it has a larger total heat capacity. For the same amount of heat absorbed by the
battery, the surface temperature rise would be lower for LFP 26650.
It is worth noticing that the peak radiative heat transfer rate occurred at around half of the time to
failure for the battery thermal tests instead of at the end of the time to failure. This observation
partly explains that heat transfer rate to the battery alone cannot determine the battery status, and
that the total heat to the battery should be considered.

15
Figure 5. Radiative heat transfer from the wall to the battery surface
3.5 Natural convection
Gas inside the sealed canister is also a heat source for the battery during thermal tests. The gas will
first be heated by the canister wall, and heat will then be transferred from the gas to the battery.
As can be seen from the temperature distributions in Figure 3, the gas temperature was close to the
canister wall temperature but higher than the battery temperature before chemical reactions
occurred inside the battery. Using the measured temperatures, convection heat transfer from the
hot gas to the battery can be calculated using the following equation:
( )bgbcconv TTAhq −= (7)
where convq is the convective heat transfer rate (in W), hc is the convective heat transfer coefficient
(W/m2K), and Tg is the gas temperature (K). The convection heat transfer process is driven by the
temperature difference between the battery surface and the gas medium. As discussed above, only
natural convection was considered here. The natural convection coefficient, hc, can be expressed
in the following correlation [26]:

16
n
bg
cL
TTfh
−= (8)
Where f and n are the coefficients in Table 3 based on the heat transfer conditions, and L is the
characteristic length of the battery.
( )
( )
( )
( )
−
−
−
=−−=
surfacesideTTAL
surfacebottomTTAL
surfacetopTTAL
TTATTL
fq
bgsideb
bgbottomb
bgtopb
bgb
n
bgnconv
35.1
_35.0
33.1
_33.0
33.1
_33.0
94.0
42.0
83.0
(9)
The convective heat transfer rate was calculated for each battery surface (top, bottom, and vertical)
using Equation 9, where Ab_top, Ab_bottom, and Ab_side refer to the areas of battery top, bottom, and
vertical side surfaces. The calculated total convq for the entire battery surface is shown in Figure 6.
Similar to the radiative heat transfer, the peak convective heat rate did not occur at the end of the
time to failure, indicating again that the receiving heat transfer rate to the battery needs to be
combined with the total heat received to evaluate the battery thermal status.
Table 3. Coefficients used in Equation 8 [26].
Geometry Condition f (W mn-2 K-n-1) n
Horizontal plate Width > 0.152 m upper surface Tb>Tg or lower surface Tb<Tg 1.36 0.25
Width > 0.152 m upper surface Tb<Tg or lower surface Tb>Tg 0.68 0.25
Width < 0.152 m upper surface Tb>Tg or lower surface Tb<Tg 0.83 0.33
Width < 0.152 m upper surface Tb<Tg or lower surface Tb>Tg 0.42 0.33
Vertical plate Height > 0.152 m 1.49 0.25
Height < 0.152 m 0.94 0.35

17
Figure 6. Convective heat transfer to the battery surface
3.6 Total heat and uncertainty analysis
Radiative and convective heat transferred from the wall and the hot gas to the battery at the battery
failure can be calculated by integrating the radiative and convective heat flux on Figs. 5 and 6
against time. Calculated total heats to failure for different batteries are plotted in Figure 7a. Data
show that the LFP 26650 required the most external heat (around 11 kJ) for its failure, indicating
that its thermal stability is the best out of all batteries tested. Four other types of batteries with the
same size of 18650 displayed different thermal stability performances under external heat. The
LFP 18650 needed a little over 4 kJ to fail the battery, which is the highest/safest among the four
18650 batteries. The NMC 18650 HG2 needed only 3 kJ to fail, which indicates that this battery
type is the most vulnerable/unstable to external heat.
Total heats to failure were also normalized by the battery nominal electrical energy capacity
(kJ/Wh) listed in Table 1. Normalized data are shown in Figure 7b. Distinctions can be observed
from the figure for the two NMC batteries compared to the other three types of batteries. The
normalized heats to failure for LFP 18650, LFP 26650, and LTO 18650 were between 0.9 and 1.1
kJ/Wh regardless of the battery size and chemistry, while for the NMC batteries, the normalized

18
heats to failure were much smaller, between 0.2 and 0.3 kJ/Wh. A few observations can be made
from the comparison: (1) although the total heat to failure for LFP 26650 is the highest among the
tested batteries, it does not necessarily indicate it is the most stable type of battery considering unit
energy capacity; both the total heat to failure and the normalized heat need to be considered to
evaluate the thermal stability of Li-ion batteries, and (2) NMC batteries have the highest energy
capacity, but they are generally less thermally stable than the other types of batteries tested, as can
be seen from both the total heats to failure and the normalized heats to failure. Further evidence
can be found in Figure 3 and Table 2, as NMC batteries had the lowest temperatures at failure and
the highest thermal runaway peak temperatures. The times to failure were also the shortest among
the tested batteries.
Figure 7. (a) Total heat to failure for batteries of different types, (b) Normalized heat to
failure by battery nominal energy capacity
The uncertainty of the data reported comes from two sources, namely, the uncertainty of the
temperature measurement and the uncertainty of repeating tests. The uncertainty of temperature
measurement is mainly due to the thermocouple accuracy and sensitivity. The N type
thermocouple used in the study has an uncertainty of 0.75% according to its manufacturer, which
will result in the calculated radiation uncertainty using Equation 6 up to 3.03%. The uncertainty
for the convection calculation is the same as the temperature measurement uncertainty of 0.75%.
The uncertainty of repeating tests is described as the standard deviation of the total heats
calculated. For each type of battery tested, LFP 18650 has a 2.02% standard deviation, LFP 26650
a b

19
has 2.4%, LTO has 0.4%, NMC 18650 MH1 has 6.4%, and NMC 18650 HG2 has 1.6%. The
combined uncertainty for each battery type can be calculated using the following formula [27]:
( ) ( ) =
=n
i
iic xucyu1
2 (10)
where ( )yuc is the combined uncertainty, ic is the sensitivity coefficient, and ( )ixu is the standard
uncertainty. Table 4 shows the uncertainty for each category and the combined uncertainty for
each battery type, which are also shown in Figure 7a as the error bar.
Table 4. Estimated uncertainty of measurements
Battery type Uncertainty of
repeating test,
%
Uncertainty of
radiation from
temperature
measurement, %
Uncertainty of
convection from
temperature
measurement, %
Combined
uncertainty, %
LFP 18650 2.0
3.03
0.75
3.72
LFP 26650 2.4 3.94
LTO 18650 0.4 3.15
NMC 18650 MH1 6.4 7.12
NMC 18650 HG2 1.6 3.51
4. Conclusions
As a part of NIOSH’s continual efforts to develop workplace solutions to minimize the occurrence
of mine disasters, such as those potentially originating from Lithium-ion battery fires,
experimental investigations were performed using the Accelerating Rate Calorimeter to study the
thermal performances of different types of Li-ion batteries with a focus on the amount of external
heat needed to cause battery failure. The test method can be easily extended to other types of
batteries with a cylindrical shape. An analytical model was developed to estimate the total external
heat applied to the battery at failure using the experimental data. The results ranked the batteries
tested in terms of the heat to failure as: LFP 26650 (11 kJ) > LFP 18650 (4.3 kJ) > NMC 18650
MH1 (3.6 kJ) ≈ LTO 18650 (3.6 kJ) > NMC 18650 HG2 (3 kJ). However, total heats normalized
to the battery nominal energy capacity gave a different rank: LFP 26650 (1.1 kJ/Wh) ≈ LFP 18650
(0.9 kJ/Wh) ≈ LTO (1.15 kJ/Wh) 18650 > NMC 18650 MH1 (0.31 kJ/Wh) ≈ NMC 18650 HG2
20
(0.28 kJ/Wh). The results from this work provide insights into the thermal stability of Li-ion
batteries and indicate that the evaluation of thermal stability for a Li-ion battery should consider
both total heat to failure and the normalized heat to failure. Information provided here can be used
for developing a sensor or indicator of a battery failure and warning of further dangers, such as
thermal runaway. Further Li-ion battery thermal studies are needed to examine if the results are
applicable to batteries under other forms of abuses, such as overcharging.
Disclaimer
The findings and conclusions in this paper are those of the authors and do not necessarily represent
the official position of the National Institute for Occupational Safety and Health, Centers for
Disease Control and Prevention. Mention of any company or product does not constitute
endorsement by NIOSH.
References
1. Dubaniewicz, T.H., Zlochower, I., Barone, T., Thomas, R., Yuan, L. 2020. Thermal Runaway
Pressures of Iron Phosphate Lithium-Ion Cells as a Function of Free Space Within Sealed
Enclosures, SME Annual Meeting, Feb. 23–26, 2020, Phoenix, AZ, Preprint 20-051.
2. Dubaniewicz, T.H., DuCarme, J.P. 2013. Are lithium-ion cells intrinsically safe? IEEE Trans.
Ind. Appl. 49 (6): 2,451-2,460.
3. Dubaniewicz Jr., T.H., DuCarme, J.P. 2016. Internal short circuit and accelerated rate
calorimetry tests of lithium-ion cells: Considerations for methane-air intrinsic safety and
explosion proof/flameproof protection methods. J. Loss Prev. Process Ind. 43: 575–584.
4. Qingsong Wang, Binbin Mao, Stanislav I. Stoliarov, Jinhua Sun. 2019. A review of lithium
ion battery failure mechanisms and fire prevention strategies. Progress in Energy and
Combustion Science, 73, 95–131.
5. Wang, Q., Jiang, L., Yu, Y., Sun, J. 2018. Progress of enhancing the safety of lithium ion
battery from the electrolyte aspect. Nano Energy, 55:93–114.
6. Wang, Q., Ping, P., Zhao, X., Chu, G., Sun, J., Chen, C. 2012. Thermal runaway caused fire
and explosion of lithium ion battery. J Power Sources, 208:210–24.
7. Wang, Q., Sun, J., Yao, X., Chen, C. 2006. Thermal behavior of lithiated graphite with
electrolyte in lithium-ion batteries. J Electrochem Soc, 153: A329-A33.

21
8. Abraham, D.P., Roth, E.P., Kostecki, R., McCarthy, K., MacLaren, S., Doughty, D.H. 2006.
Diagnostic examination of thermally abused high-power lithium-ion cells. J. Power Sources,
161, 648–657.
9. Qingsong Wang, Peifeng Huang, Ping, Yulong Du, Ke Li, Jinhua Sun, Combustion behavior
of lithium iron phosphate battery induced by external heat radiation, J. Loss Prev. Process Ind.
49 (2017) 961-969.
10. Jhu, C.Y., Wang, Y.W., Wen, C.Y., Shu, C.M., 2012. Thermal runaway potential of LiCoO2
and Li(Ni1/3Co1/3Mn1/3)O-2 batteries determined with adiabatic calorimetry methodology.
Appl. Energy 100, 127-131.
11. Ditch, B., de Vries, J., 2013. Flammability Characterization of Lithium Ion Battery in Bulk
Storage. FM Global, Boston.
12. Quintiere, J.G. 2020. On methods to measure the energetics of a lithium ion battery in thermal
runaway, Fire Safety Journal. Volume 111, January 2020, 102911.
13. Lei, B., Zhao, W., Ziebert, C., Uhlmann, N., Rohde, M., Seifert, H. 2017. Experimental
analysis of thermal runaway in 18650 cylindrical Li-Ion cells using an accelerating rate
calorimeter. Batteries, 3, p. 14.
14. Salvio Chacko, Yongmann M. Chung. 2012. Thermal modelling of Li-ion polymer battery for
electric vehicle drive cycles, Journal of Power Sources Volume 213, 1 September 2012, pages
296-303.
15. Jeon, D.H., Baek, S.M. 2011. Thermal modeling of cylindrical lithium ion battery during
discharge cycle, Energy Conversion and Management, Volume 52, Issues 8–9, August 2011,
pages 2973-2981.
16. Chen, M., Zhou, D., Chen, X. et al. 2015. Investigation on the thermal hazards of 18650 lithium
ion batteries by fire calorimeter. J. Therm. Anal Calorim. 122, 755–763.
https://doi.org/10.1007/s10973-015-4751-5.
17. Larsson, F., Andersson, P., Blomqvist, P., Lorén, A., Mellander, B.E. 2014. Characteristics of
lithium‐ion batteries during fire tests. J. Power Sources, 271, 414.
18. Chen, M., He, Y., De Zhou, C. et al. 2016. Experimental Study on the Combustion
Characteristics of Primary Lithium Batteries Fire. Fire Technol 52, 365–385.
https://doi.org/10.1007/s10694-014-0450-1

22
19. Chen, Y., Evans, J.W. 1996. Thermal analysis of lithium‐ion batteries. Journal of the
Electrochemical Society. 1996 Sep 1;143(9):2708-12.
20. Chen, S.C., Wan, C.C., Wang, Y.Y. 2005. Thermal analysis of lithium-ion batteries. Journal
of power sources. 2005 Jan 10;140(1):111-24.
21. Kim, G.H., Pesaran, A., Spotnitz, R. 2007. A three-dimensional thermal abuse model for
lithium-ion cells. Journal of Power Sources. 2007 Jul 10;170(2):476-89.
22. Xuan Liu, Stanislav I. Stoliarov, Matthew Denlinger, Alvaro Masias, Kent Snyder. 2015
Comprehensive calorimetry of the thermally-induced failure of a lithium ion battery, Journal
of Power Sources, Volume 280, 15 April 2015, Pages 516-525.
23. Yuen, W.W., Tam, W.C., Chow, W.K. 2014. Assessment of radiative heat transfer
characteristics of a combustion mixture in a three-dimensional enclosure using RAD-NETT
(with application to a fire resistance test furnace). International Journal of Heat and Mass
Transfer. 2014 Jan 1; 68:383-90.
24. Tam, W.C., Yuen, W.W. 2018. Assessment of Radiation Solvers for Fire Simulation Models
Using RADNNET-ZM. In Asia-Oceania Symposium on Fire Science and Technology 2018
Oct 22 (pp. 113-126). Springer, Singapore.
25. Tam, W.C., Yuen, W.W. 2019. OpenSC: An Open-source Calculation Tool for Combustion
Mixture Emissivity/absorptivity. US Department of Commerce, National Institute of Standards
and Technology; 2019 Sep 13.
26. Ellison, G.N. 1969. Thermal Computations for Electronic Equipment, Van Nostrand Reinhold,
New York, 1969.
27. Bryant, R., Womeldorf, C., Johnsson, E., and Ohlemiller. T. 2003. Radiative heat flux
measurement uncertainty. Fire Mater. 27:209-222.