estimation of the prevalence of problem drug use in lithuania
DESCRIPTION
Estimation of the Prevalence of Problem Drug Use in Lithuania. Dr Gordon Hay Centre for Drug Misuse Research University of Glasgow, United Kingdom. Introduction. Background Definition Methods to Estimate Prevalence Mortality Multiplier Capture-recapture Methods truncated Poisson method - PowerPoint PPT PresentationTRANSCRIPT

Estimation of the Prevalence of Problem Drug Use in
Lithuania Dr Gordon Hay
Centre for Drug Misuse ResearchUniversity of Glasgow, United
Kingdom

Introduction
• Background• Definition• Methods to Estimate Prevalence
– Mortality Multiplier– Capture-recapture Methods– truncated Poisson method
• Prevalence Estimates– Vilnius, Klaipeda & Lithuania
• Discussion

Background
• UNODC project– Project “HIV/AIDS prevention and care among
injecting drug users and in prison settings in Estonia, Latvia and Lithuania”
• Objectives– To obtain estimates of Problem Drug Use
(PDU) and Injecting Drug Use (IDU) prevalence
• 5 days fieldwork (September 2007)• Workshop on prevalence estimation

My experience
• United Kingdom Government– Estimating the prevalence of problem drug
use• Dundee (1994)• Lanarkshire (2007), Aberdeen (1998)• Scotland (2000, 2003, 2006)• England (2004, 2005, 2006)• Northern Ireland (2005)
– Other studies• Cohort study of drug users in treatment• Children / young people

My Experience
• European Monitoring Centre for Drugs and Drug Addiction (EMCDDA)– All member states required to provide
information on the prevalence of problem drug use
• Seven Cities Study (1997)– Dublin, Helsinki, Rome, Rotterdam, Setubal
Toulouse & Vienna
• Methodological Studies• UK Scientific Expert (problem drug use)

My Experience
• Synergy project– USAID / Family Health International projects– Prevalence estimation in Estonia, Latvia and
Lithuania• Fieldwork in Klaipeda, Riga, Tallinn & Vilnius
– Prevalence estimate for Riga– Recommendations
– Involved in prevalence estimation study in Tallinn
Definitions
• EMCDDA defines problem drug use as:– injecting drug use or long-duration / regular use of
opiates, cocaine and / or amphetamines
• In this study / estimation we define problem drug use as:– Opiate use (mostly opiate injecting)
– We do not include stimulant or marijuana use

Methods to Estimate Prevalence• Indirect methods
– Mortality Multiplier Method– Capture-recapture Method– truncated Poisson Method– Multiple Indicator Method
• Estimate the size of hidden populations

General Idea
• There are some problem drug users that are ‘visible’ or ‘identifiable’ or ‘known’– Treatment– Police– Mortality
• A proportion of problem drug users are visible– In United Kingdom about 40 – 50% in treatment
• Data on visible population can be used to estimate the size of the total population

Mortality Multiplier
• Uses the:– Number of drug-related deaths– Mortality rate
• Both need to refer to the same population, such as opiate users

Drug related death dataSource: Health Statistics Quarterly
Number of deaths related to drug misuse
0
200
400
600
800
1000
1200
1400
1600
1800
2000 2001 2002 2003 2004 2005
Females
Males
1,506 deaths in 2005

Mortality Multiplier
• 1,506 drug-related deaths in 2005• What is the mortality rate?
– Anecdotal evidence = 1% per year
• Therefore 150,600 problem drug users

Mortality Multiplier
• Average 40 drug-related deaths in Lithuania– Source: Lithuanian Focal Point Report to the
EMCDDA
• Mortality rate = 1.7%– Source: Most up-to-date study of drug-related
mortality in European Union (data for Denmark)
• 2,350 injecting drug users in Lithuania• 2,940 problem drug users in Lithuania

Capture-recapture method
• Simple idea:– Only a certain proportion of drug users are in contact
with treatment agencies
• Examine the overlap between those in treatment and a second sample (e.g. Police)
• Find the proportion in treatment• Thus estimate the total number of drug users

Two sample capture-recapture method

Capture-recapture Methods
• With two sources we need to assume that the sources are not related to each other
• With three sources we can include relationships between data sources
• Different statistical models are fitted to the data
• We select the ‘best’ model and estimate

Data sources (Vilnius)
• Three distinct sources from the Vilnius Centre for Addictive Disorders– Detoxification with Subutex (n = 207)– Outpatient Treatment (n = 306)– Police sample (n = 166)
• 6 month period within 2006• Opiate users (mostly injectors)• Does not include methadone
substitution
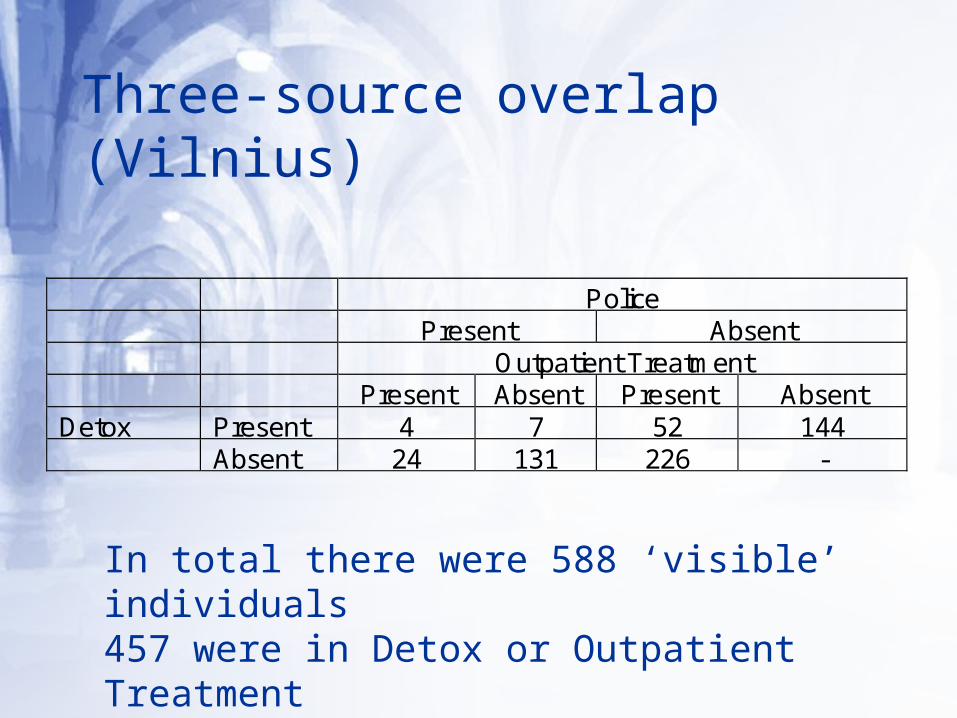
Three-source overlap (Vilnius)
Police Present Absent Outpatient Treatment Present Absent Present Absent Detox Present 4 7 52 144 Absent 24 131 226 -
In total there were 588 ‘visible’ individuals457 were in Detox or Outpatient Treatment
Results (Vilnius)
• 2,167 problem drug users– 95% Confidence Interval = 1,663 – 2,934– Assumes that detox and outpatient sources
are related (but Police data independent)– ‘best’ model and estimate

truncated Poisson method
• Uses a single data source– Number of visits at a syringe exchange
• Number attended once• Number attended twice• Total number who had attended
– Estimates number who have attended zero times
• Assumptions– Attendances are not related to each other– You can identify people who attend more
than once

truncated Poisson Analysis

truncated Poisson analysis (Vilnius)Data for 2006 complete year• Vilnius Centre for Addictive Disorders
– Computerised data– 1,444 people who had used the syringe
exchange provision at any time during 2006
• Estimated 1,622 drug injectors in 2006

truncated Poisson analysis (Vilnius)Data for individual months• Between 250 and 550 individuals
attended in any one month period– More in summer
• Average number of ‘active’ drug injectors each month = 600

truncated Poisson analysis (Klaipeda)• Data from hand written log book (registers)
– Good data– My understanding of Lithuanian alphabet is bad!
• Could only do a monthly analysis• Between 100 and 185 individual attended in
any one month period• Average number of ‘active’ drug injectors
each month = 280• Total number of injectors in Klaipeda = 750

truncated Poisson analysis(Summary)• Vilnius
– 600 ‘active’ injectors per month– 1,663 injectors in 2006
• Klaipeda– 280 ‘active’ injectors per month– 750 injectors in 2006
• Both estimates should be treated with caution– Useful for comparing Vilnius and Klaipeda– Does not contradict capture-recapture analysis

National Estimates
• Use published statistics to extrapolate– Ministry of Interior
• Drug offences
– Lithuanian Focal Point to the EMCDDA • Number of new demands for treatment
– Vilnius Municipality has 50% of national total in both datasets
• Half of Lithuania’s problem drug users live in Vilnius Municipality

National Estimates
• 4,300 problem drug users in Lithuania– 2006 estimate– Problem opiate use
• 3,200 drug injectors– truncated Poisson analysis– 75% injecting

Summary
• These are provisional estimates• The capture-recapture analysis for
Vilnius is as good (if not better) than studies elsewhere in Europe
• The truncated Poisson estimates (for Vilnius and Klaipeda) should be used with caution– But should be reliable for comparing
prevalence rates between the two cities

Discussion
• National Treatment Register– Over 5,000 for Lithuania– 2,600 for Vilnius
• WHO estimates– 7,000 – 11,000 problem drug users
(Lithuania)
• Case definition– Opiate use, problem opiate use