estimation with minimum square error - mit opencourseware · pdf filec h a p t e r 8...
TRANSCRIPT

C H A P T E R 8
Estimation with Minimum Mean Square Error
INTRODUCTION
A recurring theme in this text and in much of communication, control and signal processing is that of making systematic estimates, predictions or decisions about some set of quantities, based on information obtained from measurements of other quantities. This process is commonly referred to as inference. Typically, inferring the desired information from the measurements involves incorporating models that represent our prior knowledge or beliefs about how the measurements relate to the quantities of interest.
Inference about continuous random variables and ultimately about random processes is the topic of this chapter and several that follow. One key step is the introduction of an error criterion that measures, in a probabilistic sense, the error between the desired quantity and our estimate of it. Throughout our discussion in this and the related subsequent chapters, we focus primarily on choosing our estimate to minimize the expected or mean value of the square of the error, referred to as a minimum mean-square-error (MMSE) criterion. In Section 8.1 we consider the MMSE estimate without imposing any constraint on the form that the estimator takes. In Section 8.3 we restrict the estimate to be a linear combination of the measurements, a form of estimation that we refer to as linear minimum mean-square-error (LMMSE) estimation.
Later in the text we turn from inference problems for continuous random variables to inference problems for discrete random quantities, which may be numerically specified or may be non-numerical. In the latter case especially, the various possible outcomes associated with the random quantity are often termed hypotheses, and the inference task in this setting is then referred to as hypothesis testing, i.e., the task of deciding which hypothesis applies, given measurements or observations. The MMSE criterion may not be meaningful in such hypothesis testing problems, but we can for instance aim to minimize the probability of an incorrect inference regarding which hypothesis actually applies.
c 139©Alan V. Oppenheim and George C. Verghese, 2010

∫
∫
∫ ∫
∫
140 Chapter 8 Estimation with Minimum Mean Square Error
8.1 ESTIMATION OF A CONTINUOUS RANDOM VARIABLE
To begin the discussion, let us assume that we are interested in a random variable Y and we would like to estimate its value, knowing only its probability density function. We will then broaden the discussion to estimation when we have a measurement or observation of another random variable X, together with the joint probability density function of X and Y .
Based only on knowledge of the PDF of Y , we wish to obtain an estimate of Y — which we denote as y — so as to minimize the mean square error between the actual outcome of the experiment and our estimate y. Specifically, we choose y to minimize
E[(Y − y)2] = (y − y)2fY (y) dy . (8.1)
Differentiating (8.1) with respect to y and equating the result to zero, we obtain
− 2 (y − y)fY (y) dy = 0 (8.2)
or
yfY (y) dy = yfY (y) dy (8.3)
from which y = E[Y ] . (8.4)
The second derivative of E[(Y − y)2] with respect to y is
2 fY (y) dy = 2 , (8.5)
which is positive, so (8.4) does indeed define the minimizing value of y. Hence the MMSE estimate of Y in this case is simply its mean value, E[Y ].
The associated error — the actual MMSE — is found by evaluating the expression in (8.1) with y = E[Y ]. We conclude that the MMSE is just the variance of Y , namely σY
2 : min E[(Y − y)2] = E[(Y − E[Y ])2] = σ2 . (8.6) Y
In a similar manner, it is possible to show that the median of Y , which has half the probability mass of Y below it and the other half above, is the value of y that minimizes the mean absolute deviation, E[ |Y − y| ]. Also, the mode of Y , which is the value of y at which the PDF fY (y) is largest, turns out to minimize the expected value of an all-or-none cost function, i.e., a cost that is unity when the error is outside of a vanishingly small tolerance band, and is zero within the band. We will not be pursuing these alternative error metrics further, but it is important to be aware that our choice of mean square error, while convenient, is only one of many possible error metrics.
The insights from the simple problem leading to (8.4) and (8.6) carry over directly to the case in which we have additional information in the form of the measured or
c©Alan V. Oppenheim and George C. Verghese, 2010
∫
|
Section 8.1 Estimation of a Continuous Random Variable 141
observed value x of a random variable X that is related somehow to Y . The only change from the previous discussion is that, given the additional measurement, we work with the conditional or a posteriori density fY |X (y|x), rather than the unconditioned density fY (y), and now our aim is to minimize
E[{Y − y(x)}2|X = x] = {y − y(x)}2fY |X (y|x) dy . (8.7)
We have introduced the notation y(x) for our estimate to show that in general it will depend on the specific value x. Exactly the same calculations as in the case of no measurements then show that
y(x) = E[Y X = x] , (8.8)
the conditional expectation of Y , given X = x. The associated MMSE is the variance σ2 of the conditional density fY |X (y|x), i.e., the MMSE is the conditional Y |X variance. Thus, the only change from the case of no measurements is that we now condition on the obtained measurement.
Going a further step, if we have multiple measurements, say X1 = x1,X2 = x2, ,XL = xL, then we work with the a posteriori density · · ·
fY | X1,X2,··· ,XL (y | x1, x2, · · · , xL) . (8.9)
Apart from this modification, there is no change in the structure of the solutions. Thus, without further calculation, we can state the following:
The MMSE estimate of Y , given X1 = x1, ,XL = xL,· · ·
is the conditional expectation of Y : (8.10)
y(x1, . . . , xL) = E[Y X1 = x1, ,XL = xL] | · · ·
For notational convenience, we can arrange the measured random variables into a column vector X, and the corresponding measurements into the column vector x. The dependence of the MMSE estimate on the measurements can now be indicated by the notation y(x), with
∫ ∞
y(x) = −∞
y fY |X(y | X = x) dy = E[ Y | X = x ] . (8.11)
The minimum mean square error (or MMSE) for the given value of X is again the conditional variance, i.e., the variance σY
2 |X of the conditional density fY |X(y | x).
EXAMPLE 8.1 MMSE Estimate for Discrete Random Variables
A discrete-time discrete-amplitude sequence s[n] is stored on a noisy medium. The retrieved sequence is r[n]. Suppose at some particular time instant n = n0 we have
©Alan V. Oppenheim and George C. Verghese, 2010 c
142 Chapter 8 Estimation with Minimum Mean Square Error
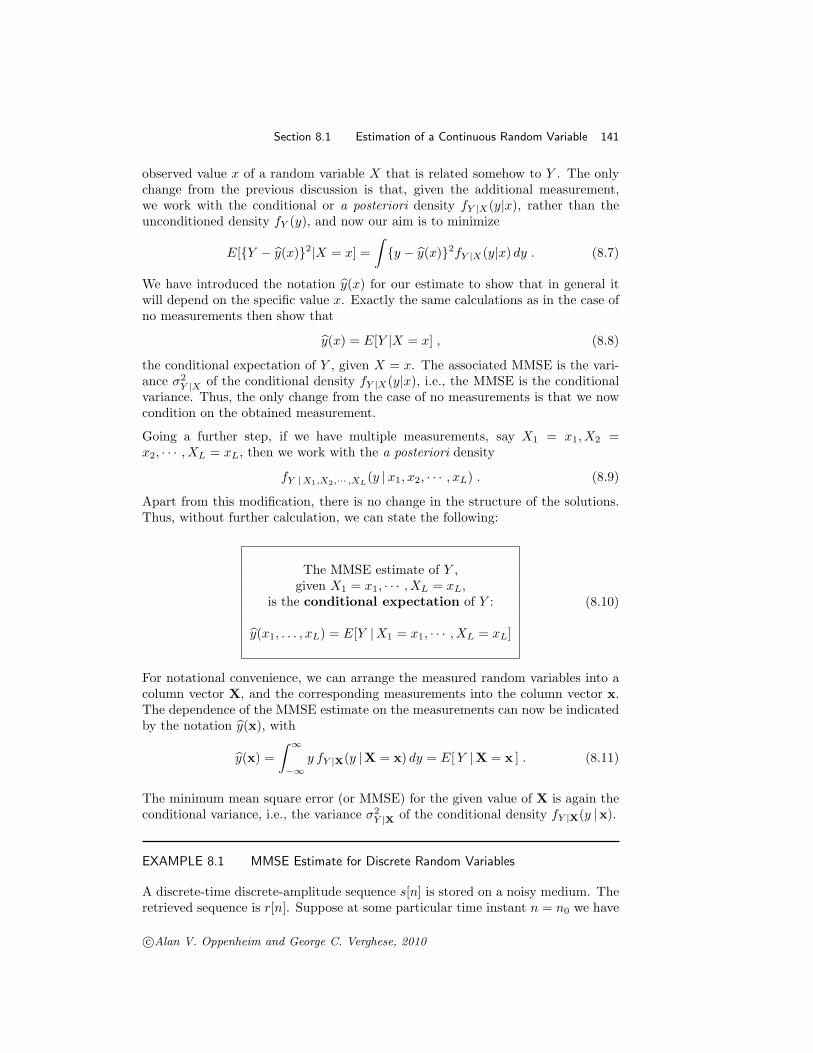
s[n0] and r[n0] modeled as random variables, which we shall simply denote by S and R respectively. From prior measurements, we have determined that S and R have the joint probability mass function (PMF) shown in Figure 8.1.
r
1
s-1 1
-1
FIGURE 8.1 Joint PMF of S and R.
Based on receiving the value R = 1, we would like to make an MMSE estimate sof S. From (8.10), s = E(S|R = 1), which can be determined from the conditional PMF PS|R(s|R = 1), which in turn we can obtain as
PR,S (R = 1, s)PS|R(s|R = 1) =
PR(R = 1) . (8.12)
From Figure 8.1,
2 PR(1) = (8.13)
7
and
PR,S (1, s) =
0 s = −1 1/7 s = 0 1/7 s = +1
Consequently, {
1/2 s = 0 PS|R(s|R = 1) =
1/2 s = +1
Thus, the MMSE estimate is s = 1 . Note that although this estimate minimizes 2 the mean square error, we have not constrained it to take account of the fact that S can only have the discrete values of +1, 0 or −1. In a later chapter we will return to this example and consider it from the perspective of hypothesis testing, i.e., determining which of the three known possible values will result in minimizing
©Alan V. Oppenheim and George C. Verghese, 2010 c

Section 8.1 Estimation of a Continuous Random Variable 143
a suitable error criterion.
EXAMPLE 8.2 MMSE Estimate of Signal in Additive Noise
A discrete-time sequence s[n] is transmitted over a noisy channel and retrieved. The received sequence r[n] is modeled as r[n] = s[n] + w[n] where w[n] represents the noise. At a particular time instant n = n0, suppose r[n0], s[n0] and w[n0] are random variables, which we denote as R, S and W respectively. We assume that
12
12S and W are independent, that W is uniformly distributed between + and −
and S is uniformly distributed between −1 and +1. The specific received value is 14
,
R = , and we want the MMSE estimate s for S. From (8.10),
1 |4) (8.14) s = E(S R =
14 ): which can be determined from fS|R(s R =|
14fR|S ( s)fS (s)1 |
fR(fS|R(s|R =
4) = . (8.15) 1
4 )
We evaluate separately the numerator and denominator terms in (8.15). The PDF fR|S (rindicated in Figure 8.2 below.
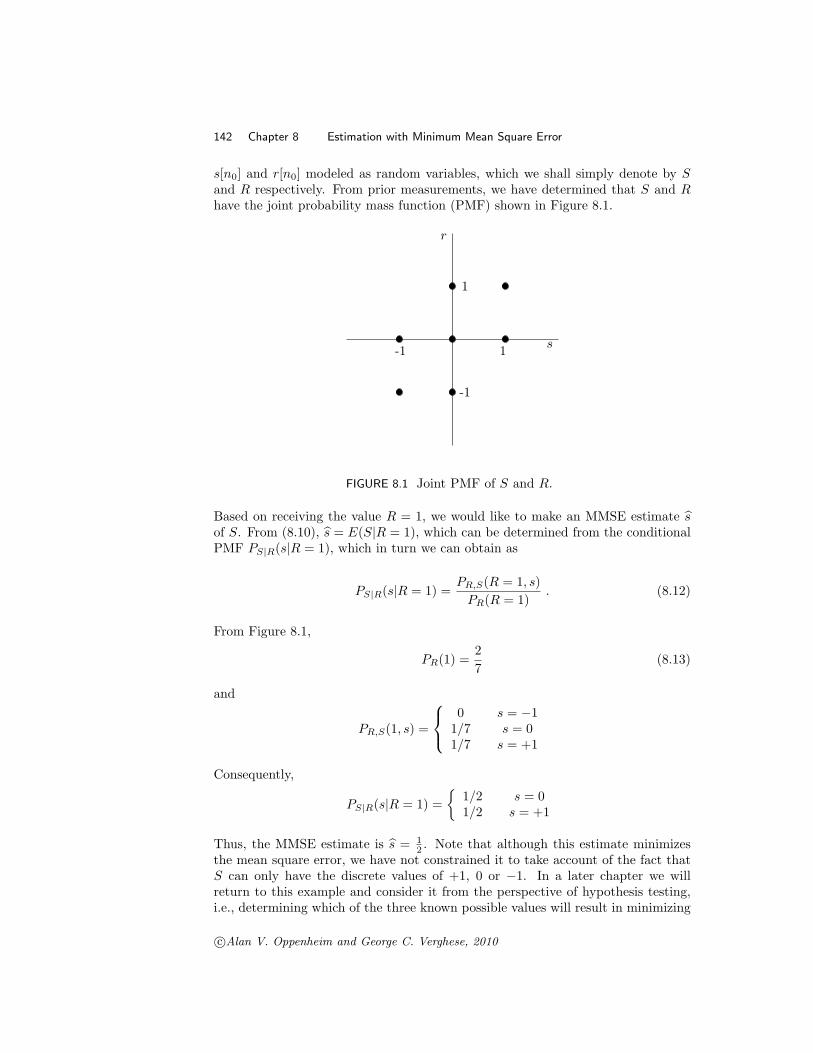
s) is identical in shape to the PDF of W , but with the mean shifted to s, as |14 |s) is as shown in Figure 8.3,Consequently, fR|S (
s)fS (s) is shown in Figure 8.4.and fR|S (14 |
fR|S (r|s)
r
1
− 12 + s + 1
2 + s
FIGURE 8.2 Conditional PDF of R given S, fR|S (r|s).
14
14To obtain fS|R(s R|
tained by evaluating the convolution of the PDF’s of S and W ) we divide Figure 8.4 by fR( ), which can easily be ob=
at the argument 14
14More simply, since fS|R(s R|
same as Figure 8.4 but scaled by fR(
) must have total area of unity and it is the =. 14 ), we can easily obtain it by just normalizing
Figure 8.4 to have an area of 1. The resulting value for s is the mean associated 14with the PDF fS|R(s R =| ), which will be
1 4
. (8.16) s =
©Alan V. Oppenheim and George C. Verghese, 2010 c
{
|
144 Chapter 8 Estimation with Minimum Mean Square Error
1
s
− 14 0
34
14 |s). Plot of fR|S (FIGURE 8.3
1 2
s − 1
4340
14 |Plot of fR|S ( s)fS (s). FIGURE 8.4
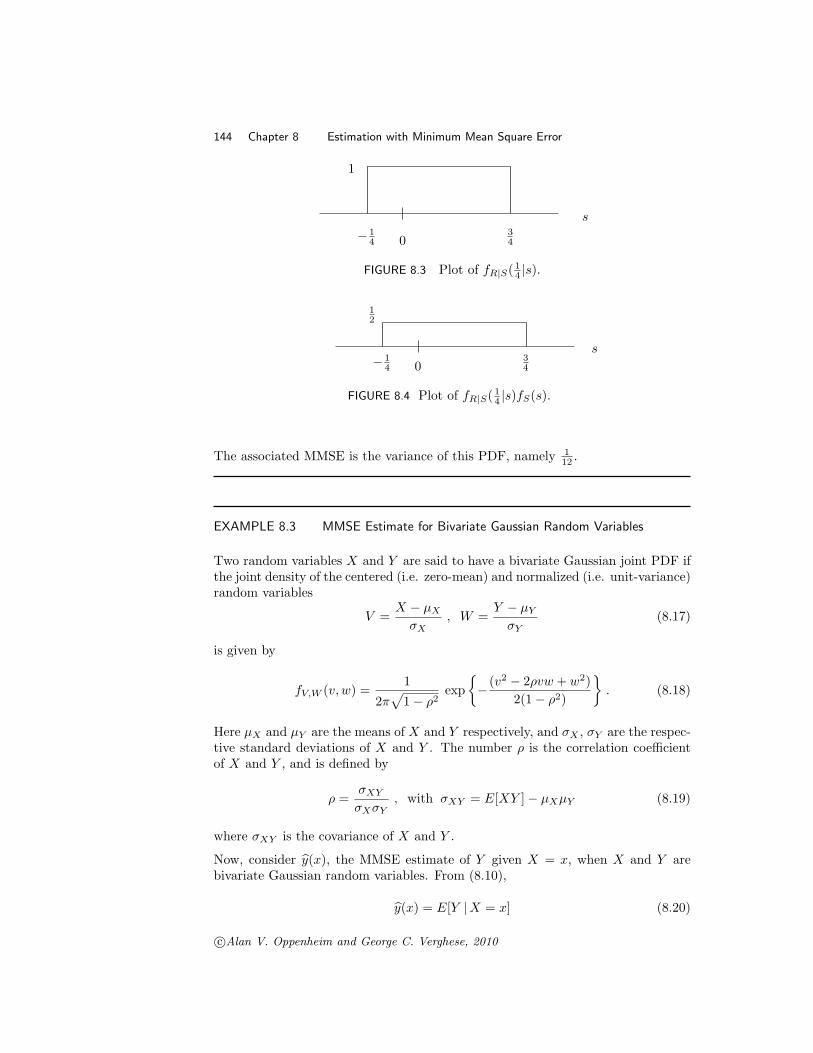
1 12 .The associated MMSE is the variance of this PDF, namely
EXAMPLE 8.3 MMSE Estimate for Bivariate Gaussian Random Variables
Two random variables X and Y are said to have a bivariate Gaussian joint PDF if the joint density of the centered (i.e. zero-mean) and normalized (i.e. unit-variance) random variables
V = X − µX
, W = Y − µY
(8.17) σX σY
is given by
1 (v2 − 2ρvw + w2(1 − ρ2)
2) }
. (8.18) fV,W (v, w) = 2π
√1 − ρ2
exp −
Here µX and µY are the means of X and Y respectively, and σX , σY are the respective standard deviations of X and Y . The number ρ is the correlation coefficient of X and Y , and is defined by
σXY ρ = , with σXY = E[XY ] − µX µY (8.19)
σX σY
where σXY is the covariance of X and Y .
Now, consider y(x), the MMSE estimate of Y given X = x, when X and Y are bivariate Gaussian random variables. From (8.10),
y(x) = E[Y X = x] (8.20)
©Alan V. Oppenheim and George C. Verghese, 2010 c

Section 8.2 From Estimates to an Estimator 145
or, in terms of the zero-mean normalized random variables V and W , [
x − µX ]
y(x) = E (σY W + µY ) V = | σX
= σY E
[
W | V = x −
σX
µX ]
+ µY . (8.21)
It is straightforward to show with some computation that fW |V (w v) is Gaussian with mean ρv, and variance 1 − ρ2, from which it follows that
|
[ x − µX
] [ x − µX
]
E W V = = ρ . (8.22) | σX σX
Combining (8.21) and (8.22),
y(x) = E[ Y X = x ] | σY
= µY + ρ (x − µX ) (8.23) σX
The MMSE estimate in the case of bivariate Gaussian variables has a nice linear (or more correctly, affine, i.e., linear plus a constant) form.
The minimum mean square error is the variance of the conditional PDF fY |X(y|X = x):
E[ (Y − y(x))2 | X = x ] = σY 2 (1 − ρ2) . (8.24)
Note that σY 2 is the mean square error in Y in the absence of any additional infor
mation. Equation (8.24) shows what the residual mean square error is after we have a measurement of X. It is evident and intuitively reasonable that the larger the magnitude of the correlation coefficient between X and Y , the smaller the residual mean square error.
8.2 FROM ESTIMATES TO AN ESTIMATOR
The MMSE estimate in (8.8) is based on knowing the specific value x that the random variable X takes. While X is a random variable, the specific value x is not, and consequently y(x) is also not a random variable.
As we move forward in the discussion, it is important to draw a distinction between the estimate of a random variable and the procedure by which we form the estimate. This is completely analogous to the distinction between the value of a function at a point and the function itself. We will refer to the procedure or function that produces the estimate as the estimator.
For instance, in Example 8.1 we determined the MMSE estimate of S for the specific value of R = 1. We could more generally determine an estimate of S for each of the possible values of R, i.e., −1, 0, and + 1. We could then have a tabulation of these results available in advance, so that when we retrieve a specific value of R
c©Alan V. Oppenheim and George C. Verghese, 2010

146 Chapter 8 Estimation with Minimum Mean Square Error
we can look up the MMSE estimate. Such a table or more generally a function of R would correspond to what we term the MMSE estimator. The input to the table or estimator would be the specific retrieved value and the output would be the estimate associated with that retrieved value.
We have already introduced the notation y(x) to denote the estimate of Y given X = x. The function y( ) determines the corresponding estimator, which we · will denote by y(X), or more simply by just Y , if it is understood what random variable the estimator is operating on. Note that the estimator Y = y(X) is a random variable. We have already seen that the MMSE estimate y(x) is given by the conditional mean, E[Y X = x], which suggests yet another natural notation for |the MMSE estimator:
Y = y(X) = E[Y |X] . (8.25)
Note that E[Y X] denotes a random variable, not a number. |The preceding discussion applies essentially unchanged to the case where we observe several random variables, assembled in the vector X. The MMSE estimator in this case is denoted by
Y = y(X) = E[Y |X] . (8.26)
Perhaps not surprisingly, the MMSE estimator for Y given X minimizes the mean square error, averaged over all Y and X. This is because the MMSE estimator minimizes the mean square error for each particular value x of X. More formally,
EY,X
( [Y − y(X)]2
) = EX
( EY |X
( [Y − y(X)]2 | X
))
= ∫ ∞ (
EY |X
( [Y − y(x)]2 | X = x
) fX(x) dx . (8.27)
−∞
(The subscripts on the expectation operators are used to indicate explicitly which densities are involved in computing the associated expectations; the densities and integration are multivariate when X is not a scalar.) Because the estimate y(x) is chosen to minimize the inner expectation EY |X for each value x of X, it also minimizes the outer expectation EX, since fX(X) is nonnegative.
EXAMPLE 8.4 MMSE Estimator for Bivariate Gaussian Random Variables
We have already, in Example 8.3, constructed the MMSE estimate of one member of a pair of bivariate Gaussian random variables, given a measurement of the other. Using the same notation as in that example, it is evident that the MMSE estimator is simply obtained on replacing x by X in (8.23):
σYY = y(X) = µY + ρ
σX (X − µX ) . (8.28)
The conditional MMSE given X = x was found in the earlier example to be σ2 (1 −Y ρ2), which did not depend on the value of x, so the MMSE of the estimator, averaged
©Alan V. Oppenheim and George C. Verghese, 2010 c
Section 8.2 From Estimates to an Estimator 147
over all X, ends up still being σ2 (1 − ρ2). Y
EXAMPLE 8.5 MMSE Estimator for Signal in Additive Noise
Suppose the random variable X is a noisy measurement of the angular position Y of an antenna, so X = Y + W , where W denotes the additive noise. Assume the noise is independent of the angular position, i.e., Y and W are independent random variables, with Y uniformly distributed in the interval [−1, 1] and W uniformly distributed in the interval [−2, 2]. (Note that the setup in this example is essentially the same as in Example 8.2, though the context, notation and parameters are different.)
Given that X = x, we would like to determine the MMSE estimate y(x), the resulting mean square error, and the overall mean square error averaged over all possible values x that the random variable X can take. Since y(x) is the conditional expectation of Y given X = x, we need to determine fY |X (y|x). For this, we first determine the joint density of Y and W , and from this the required conditional density.
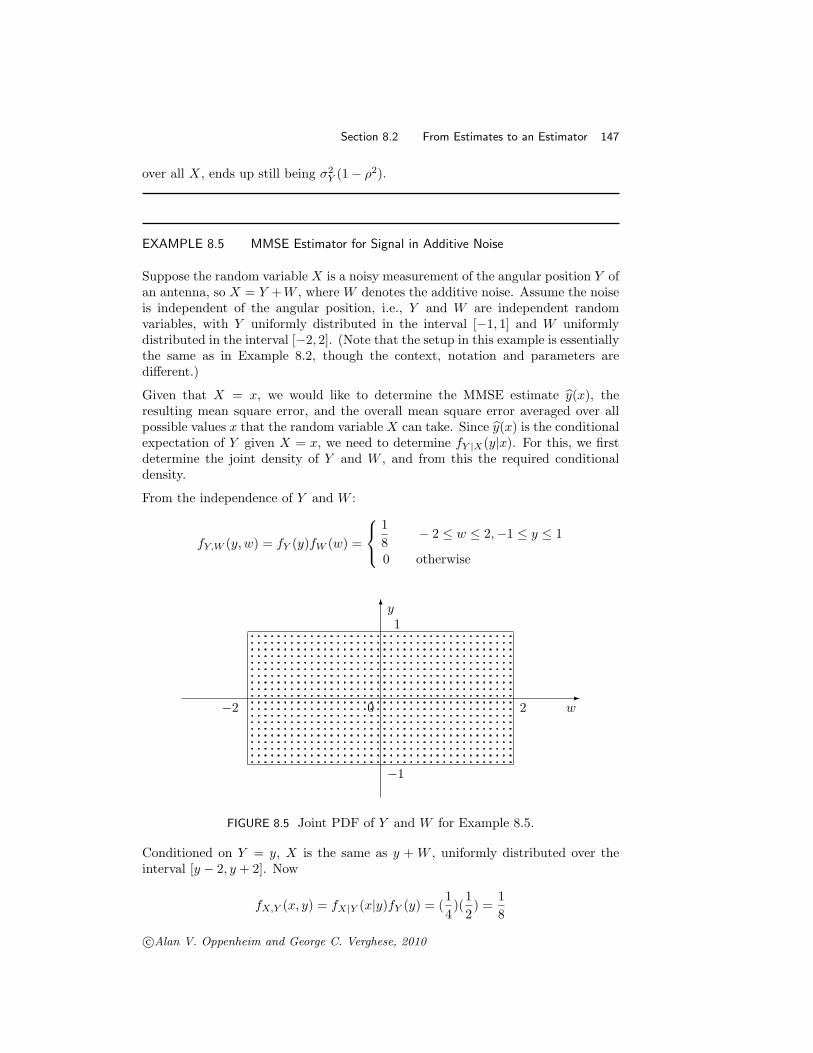
From the independence of Y and W :
1 − 2 ≤ w ≤ 2, −1 ≤ y ≤ 1 fY,W (y, w) = fY (y)fW (w) = 8
0 otherwise
�y 1
� −2 0 2 w
−1
FIGURE 8.5 Joint PDF of Y and W for Example 8.5.
Conditioned on Y = y, X is the same as y + W , uniformly distributed over the interval [y − 2, y + 2]. Now
1 1 1 fX,Y (x, y) = fX|Y (x|y)fY (y) = (
4)(
2) =
8
©Alan V. Oppenheim and George C. Verghese, 2010 c

148 Chapter 8 Estimation with Minimum Mean Square Error
for −1 ≤ y ≤ 1, y − 2 ≤ x ≤ y + 2, and zero otherwise. The joint PDF is therefore uniform over the parallelogram shown in the Figure 8.6.
�y 1
� x−3 −2 −1 0 1 2 3
−1
FIGURE 8.6 Joint PDF of X and Y and plot of the MMSE estimator of Y from Xfor Example 8.5.
�y �y �y �y �y �y �y
�1
0 1
� −1 1 12
12
12
fY |X (y | −3) fY |X (y | −1) fY |X (y | 1) fY |X (y | 3)
fY |X (y | −2) fY |X (y | 0) fY |X (y | 2)
FIGURE 8.7 Conditional PDF fY |X for various realizations of X for Example 8.5.
Given X = x, the conditional PDF fY |X is uniform on the corresponding vertical section of the parallelogram:
fY |X (y, x) =
1 − 3 ≤ x ≤ −1 , −1 ≤ y ≤ x + 23 + x
1 − 1 ≤ x ≤ 1 , −1 ≤ y ≤ 1 (8.29)2
1
3 − x 1 ≤ x ≤ 3 , x − 2 ≤ y ≤ 1
©Alan V. Oppenheim and George C. Verghese, 2010c
∫ ∫ ∫
Section 8.2 From Estimates to an Estimator 149
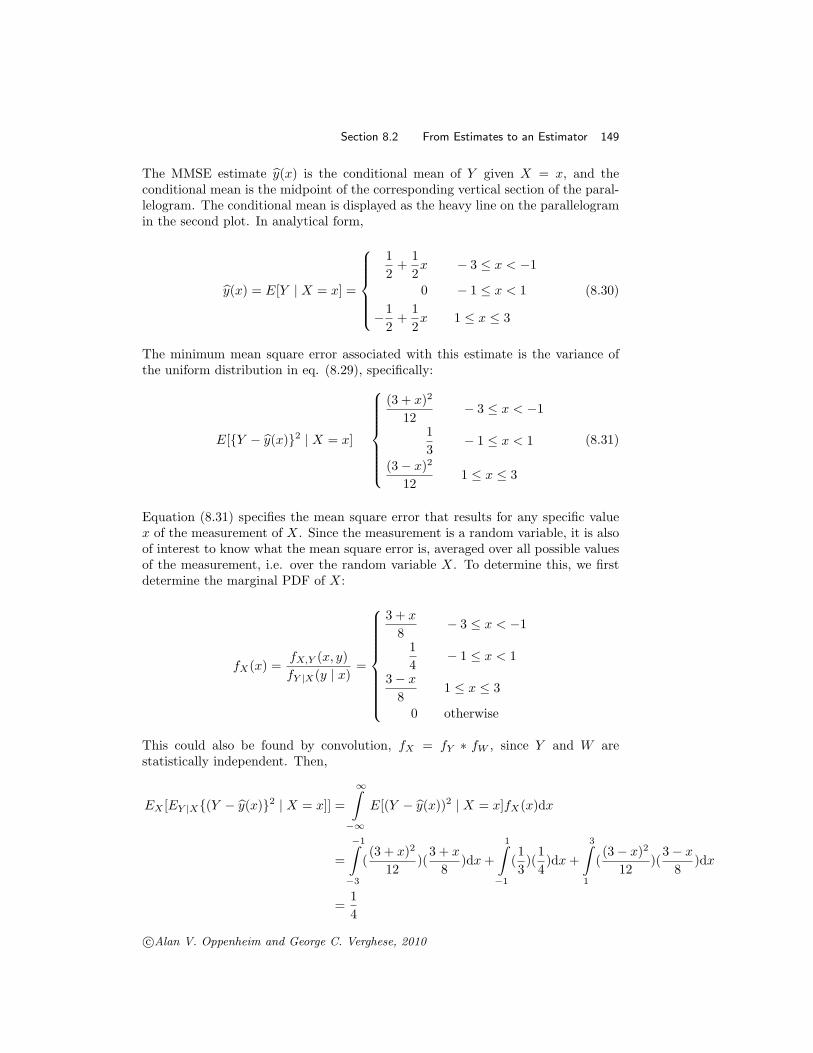
The MMSE estimate y(x) is the conditional mean of Y given X = x, and the conditional mean is the midpoint of the corresponding vertical section of the parallelogram. The conditional mean is displayed as the heavy line on the parallelogram in the second plot. In analytical form,
1 1+ x − 3 ≤ x < −1
2 2
y(x) = E[Y
The minimum mean square error associated with this estimate is the variance of the uniform distribution in eq. (8.29), specifically:
X = x] = 0 − 1 ≤ x < 1 (8.30)| 1 1−2
+2
1 ≤ x ≤ 3x
X = x]E[{Y − y(x)}2 |
(3 + x)2
− 3 ≤ x < −1 12
1
3(3 − x)2
12
− 1 ≤ x < 1 (8.31)
1 ≤ x ≤ 3
Equation (8.31) specifies the mean square error that results for any specific value x of the measurement of X. Since the measurement is a random variable, it is also of interest to know what the mean square error is, averaged over all possible values of the measurement, i.e. over the random variable X. To determine this, we first determine the marginal PDF of X:
fX (x) = fX,Y (x, y) fY |X (y | x)
=
3 + x − 3 ≤ x < −1 8
1
4− 1 ≤ x < 1
3 − x 1 ≤ x ≤ 3
80 otherwise
This could also be found by convolution, fX = fY ∗ fW , since Y and W are statistically independent. Then,
∫∞
EX [EY |X {(Y − y(x)}2 | X = x]] = E[(Y − y(x))2 | X = x]fX (x)dx
−∞
=
−1
( (3 + x)2
12
1 3
)( )dx + ( )( )dx + ( (3 − x)2
12
3 + x 1 1)(
3 − x8
)dx 8 3 4
−3 −1 1
1=
4
©Alan V. Oppenheim and George C. Verghese, 2010c

150 Chapter 8 Estimation with Minimum Mean Square Error
Compare this with the mean square error if we just estimated Y by its mean, namely 0. The mean square error would then be the variance σY
2 :
σ2 [1 − (−1)]2 1 ,= = Y 12 3
so the mean square error is indeed reduced by allowing ourselves to use knowledge of X and of the probabilistic relation between Y and X.
8.2.1 Orthogonality
A further important property of the MMSE estimator is that the residual error Y − y(X) is orthogonal to any function h(X) of the measured random variables:
EY,X [{Y − y(X)}h(X)] = 0 , (8.32)
where the expectation is computed over the joint density of Y and X. Rearranging this, we have the equivalent condition
EY,X [y(X)h(X)] = EY,X [Y h(X)] , (8.33)
i.e., the MMSE estimator has the same correlation as Y does with any function of X. In particular, choosing h(X) = 1, we find that
EY,X [y(X)] = EY [Y ] . (8.34)
The latter property results in the estimator being referred to as unbiased: its expected value equals the expected value of the random variable being estimated. We can invoked the unbiasedness property to interpret (8.32) as stating that the estimation error of the MMSE estimator is uncorrelated with any function of the random variables used to construct the estimator.
The proof of the correlation matching property in (8.33) is in the following sequence of equalities:
EY,X [y(X)h(X)] = EX [EY |X [Y |X]h(X)] (8.35)
= EX [EY |X [Y h(X)|X]] (8.36)
= EY,X [Y h(X)] . (8.37)
Rearranging the final result here, we obtain the orthogonality condition in (8.32).
8.3 LINEAR MINIMUM MEAN SQUARE ERROR ESTIMATION
In general, the conditional expectation E(Y X) required for the MMSE estimator |developed in the preceding sections is difficult to determine, because the conditional density fY |X(y|x) is not easily determined. A useful and widely used compromise
c©Alan V. Oppenheim and George C. Verghese, 2010

Section 8.3 Linear Minimum Mean Square Error Estimation 151
is to restrict the estimator to be a fixed linear (or actually affine, i.e., linear plus a constant) function of the measured random variables, and to choose the linear relationship so as to minimize the mean square error. The resulting estimator is called the linear minimum mean square error (LMMSE) estimator. We begin with the simplest case.
Suppose we wish to construct an estimator for the random variable Y in terms of another random variable X, restricting our estimator to be of the form
Yℓ = yℓ(X) = aX + b , (8.38)
where a and b are to be determined so as to minimize the mean square error
EY,X [(Y − Yℓ)2] = EY,X [{Y − (aX + b)} 2] . (8.39)
Note that the expectation is taken over the joint density of Y and X; the linear estimator is picked to be optimum when averaged over all possible combinations of Y and X that may occur. We have accordingly used subscripts on the expectation operations in (8.39) to make explicit for now the variables whose joint density the expectation is being computed over; we shall eventually drop the subscripts.
Once the optimum a and b have been chosen in this manner, the estimate of Y , given a particular x, is just yℓ(x) = ax + b, computed with the already designed values of a and b. Thus, in the LMMSE case we construct an optimal linear estimator, and for any particular x this estimator generates an estimate that is not claimed to have any individual optimality property. This is in contrast to the MMSE case considered in the previous sections, where we obtained an optimal MMSE estimate for each x, namely E[Y X = x], that minimized the mean square |error conditioned on X = x. The distinction can be summarized as follows: in the unrestricted MMSE case, the optimal estimator is obtained by joining together all the individual optimal estimates, whereas in the LMMSE case the (generally non-optimal) individual estimates are obtained by simply evaluating the optimal linear estimator.
We turn now to minimizing the expression in (8.39), by differentiating it with respect to the parameters a and b, and setting each of the derivatives to 0. (Consideration of the second derivatives will show that we do indeed find minimizing values in this fashion, but we omit the demonstration.) First differentiating (8.39) with respect to b, taking the derivative inside the integral that corresponds to the expectation operation, and then setting the result to 0, we conclude that
EY,X [Y − (aX + b)] = 0 , (8.40)
or equivalently E[Y ] = E[aX + b] = E[Yℓ] , (8.41)
from which we deduce that b = µY − aµX , (8.42)
where µY = E[Y ] = EY,X [Y ] and µX = E[X] = EY,X [X]. The optimum value of b specified in (8.42) in effect serves to make the linear estimator unbiased, i.e., the
c©Alan V. Oppenheim and George C. Verghese, 2010

152 Chapter 8 Estimation with Minimum Mean Square Error
expected value of the estimator becomes equal to the expected value of the random variable we are trying to estimate, as (8.41) shows.
Using (8.42) to substitute for b in (8.38), it follows that
Yℓ = µY + a(X − µX ) . (8.43)
In other words, to the expected value µY of the random variable Y that we are estimating, the optimal linear estimator adds a suitable multiple of the difference X − µX between the measured random variable and its expected value. We turn now to finding the optimum value of this multiple, a.
First rewrite the error criterion (8.39) as
E[{(Y − µY ) − (Yℓ − µY )}2] = E[( Y − aX)2] , (8.44)
where Y = Y − µY and X = X − µX , (8.45)
and where we have invoked (8.43) to obtain the second equality in (8.44). Now taking the derivative of the error criterion in (8.44) with respect to a, and setting the result to 0, we find
E[( Y − aX)X] = 0 . (8.46)
Rearranging this, and recalling that E[Y X] = σY X , i.e., the covariance of Y and X, and that E[X2] = σ2 , we obtain X
σY X σY a = = ρY X
σ2 σX , (8.47)
X
where ρY X — which we shall simply write as ρ when it is clear from context what variables are involved — denotes the correlation coefficient between Y and X.
It is also enlightening to understand the above expression for a in terms of the vector-space picture for random variables developed in the previous chapter.
aX
FIGURE 8.8 Expression for a from Eq. (8.47) illustrated in vector space.
The expression (8.44) for the error criterion shows that we are looking for a vector aX, which lies along the vector X, such that the squared length of the error vector
©Alan V. Oppenheim and George C. Verghese, 2010
YY − a X = Y − Yℓ
X
c
Section 8.3 Linear Minimum Mean Square Error Estimation 153
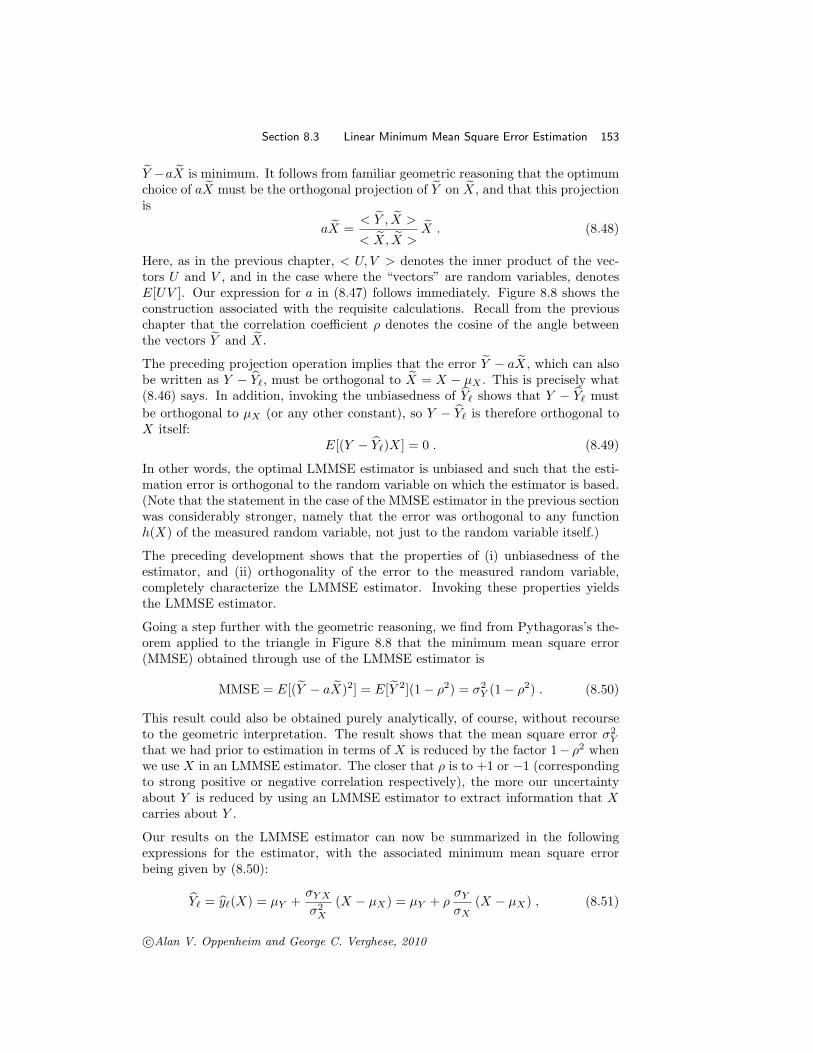
Y −aX is minimum. It follows from familiar geometric reasoning that the optimum choice of aX must be the orthogonal projection of Y on X, and that this projection is
< ˜ X > Y , ˜X = X . (8.48) a ˜ ˜ X >
˜< X, ˜
Here, as in the previous chapter, < U, V > denotes the inner product of the vectors U and V , and in the case where the “vectors” are random variables, denotes E[UV ]. Our expression for a in (8.47) follows immediately. Figure 8.8 shows the construction associated with the requisite calculations. Recall from the previous chapter that the correlation coefficient ρ denotes the cosine of the angle between the vectors Y and X.
The preceding projection operation implies that the error Y − aX, which can also be written as Y − Yℓ, must be orthogonal to X = X − µX . This is precisely what (8.46) says. In addition, invoking the unbiasedness of Yℓ shows that Y − Yℓ must be orthogonal to µX (or any other constant), so Y − Yℓ is therefore orthogonal to X itself:
E[(Y − Yℓ)X] = 0 . (8.49)
In other words, the optimal LMMSE estimator is unbiased and such that the estimation error is orthogonal to the random variable on which the estimator is based. (Note that the statement in the case of the MMSE estimator in the previous section was considerably stronger, namely that the error was orthogonal to any function h(X) of the measured random variable, not just to the random variable itself.)
The preceding development shows that the properties of (i) unbiasedness of the estimator, and (ii) orthogonality of the error to the measured random variable, completely characterize the LMMSE estimator. Invoking these properties yields the LMMSE estimator.
Going a step further with the geometric reasoning, we find from Pythagoras’s theorem applied to the triangle in Figure 8.8 that the minimum mean square error (MMSE) obtained through use of the LMMSE estimator is
MMSE = E[( Y − aX)2] = E[Y 2](1 − ρ2) = σY 2 (1 − ρ2) . (8.50)
This result could also be obtained purely analytically, of course, without recourse to the geometric interpretation. The result shows that the mean square error σY
2
that we had prior to estimation in terms of X is reduced by the factor 1 − ρ2 when we use X in an LMMSE estimator. The closer that ρ is to +1 or −1 (corresponding to strong positive or negative correlation respectively), the more our uncertainty about Y is reduced by using an LMMSE estimator to extract information that X carries about Y .
Our results on the LMMSE estimator can now be summarized in the following expressions for the estimator, with the associated minimum mean square error being given by (8.50):
σY X σYYℓ = yℓ(X) = µY +
σ2 (X − µX ) = µY + ρσX
(X − µX ) , (8.51) X
c©Alan V. Oppenheim and George C. Verghese, 2010
154 Chapter 8 Estimation with Minimum Mean Square Error
or the equivalent but perhaps more suggestive form
Yℓ − µY = ρ
X − µX . (8.52)
σY σX
The latter expression states that the normalized deviation of the estimator from its mean is ρ times the normalized deviation of the observed variable from its mean; the more highly correlated Y and X are, the more closely we match the two normalized deviations.
Note that our expressions for the LMMSE estimator and its mean square error are the same as those obtained in Example 8.4 for the MMSE estimator in the bivariate Gaussian case. The reason is that the MMSE estimator in that case turned out to be linear (actually, affine), as already noted in the example.
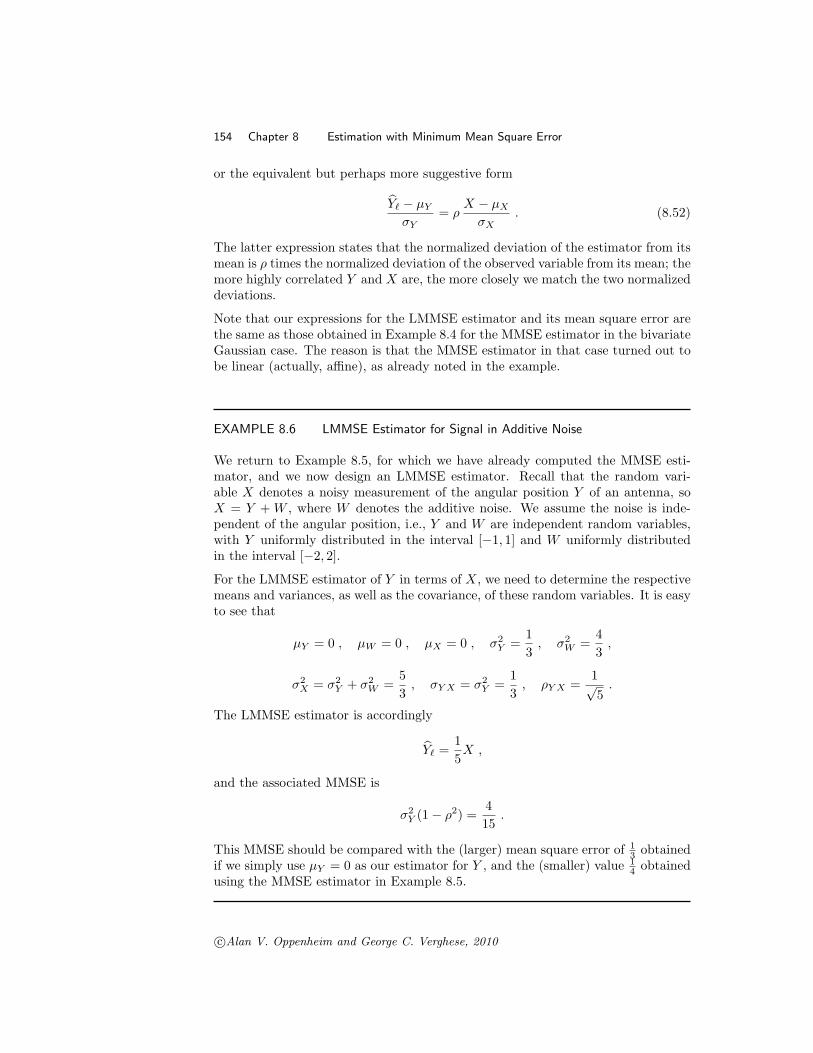
EXAMPLE 8.6 LMMSE Estimator for Signal in Additive Noise
We return to Example 8.5, for which we have already computed the MMSE estimator, and we now design an LMMSE estimator. Recall that the random variable X denotes a noisy measurement of the angular position Y of an antenna, so X = Y + W , where W denotes the additive noise. We assume the noise is independent of the angular position, i.e., Y and W are independent random variables, with Y uniformly distributed in the interval [−1, 1] and W uniformly distributed in the interval [−2, 2].
For the LMMSE estimator of Y in terms of X, we need to determine the respective means and variances, as well as the covariance, of these random variables. It is easy to see that
1 42 2= 0 , µW = 0 , µX = 0 , σ , σµY = = ,Y W3 3
5 1 1 σ2
X = σ2 Y + σ2 2
Y, σY X = σ3
, ρY X = √5
= = .W 3
2
The LMMSE estimator is accordingly
1 5 X , Yℓ =
and the associated MMSE is
Y (1 − ρ2) = 4
. 15
σ
1 31 4
obtained obtained
This MMSE should be compared with the (larger) mean square error ofif we simply use µY = 0 as our estimator for Y , and the (smaller) valueusing the MMSE estimator in Example 8.5.
©Alan V. Oppenheim and George C. Verghese, 2010 c
Section 8.3 Linear Minimum Mean Square Error Estimation 155
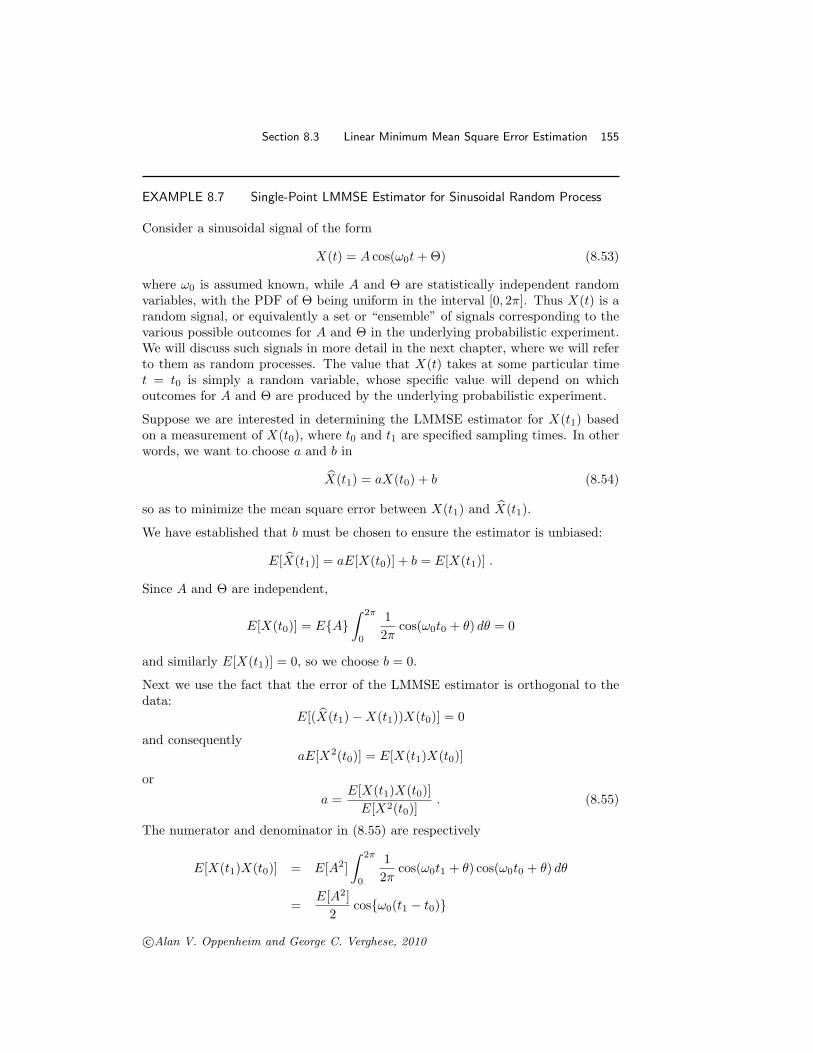
EXAMPLE 8.7 Single-Point LMMSE Estimator for Sinusoidal Random Process
Consider a sinusoidal signal of the form
X(t) = A cos(ω0t + Θ) (8.53)
where ω0 is assumed known, while A and Θ are statistically independent random variables, with the PDF of Θ being uniform in the interval [0, 2π]. Thus X(t) is a random signal, or equivalently a set or “ensemble” of signals corresponding to the various possible outcomes for A and Θ in the underlying probabilistic experiment. We will discuss such signals in more detail in the next chapter, where we will refer to them as random processes. The value that X(t) takes at some particular time t = t0 is simply a random variable, whose specific value will depend on which outcomes for A and Θ are produced by the underlying probabilistic experiment.
Suppose we are interested in determining the LMMSE estimator for X(t1) based on a measurement of X(t0), where t0 and t1 are specified sampling times. In other words, we want to choose a and b in
X(t1) = aX(t0) + b (8.54)
so as to minimize the mean square error between X(t1) and X(t1).
We have established that b must be chosen to ensure the estimator is unbiased:
E[X(t1)] = aE[X(t0)] + b = E[X(t1)] .
Since A and Θ are independent,
∫ 2π 1 E[X(t0)] = E{A} cos(ω0t0 + θ) dθ = 0
2π0
and similarly E[X(t1)] = 0, so we choose b = 0.
Next we use the fact that the error of the LMMSE estimator is orthogonal to the data:
E[( X(t1) − X(t1))X(t0)] = 0
and consequently aE[X2(t0)] = E[X(t1)X(t0)]
or E[X(t1)X(t0)]
a = . (8.55) E[X2(t0)]
The numerator and denominator in (8.55) are respectively
∫ 2π 1 E[X(t1)X(t0)] = E[A2] cos(ω0t1 + θ) cos(ω0t0 + θ) dθ
2π
E[A2] 0
= cos{ω0(t1 − t0)}2
©Alan V. Oppenheim and George C. Verghese, 2010 c

156 Chapter 8 Estimation with Minimum Mean Square Error
and E[X2(t0)] = E[A2] . Thus a = cos{ω0(t1 − t0)}, so the LMMSE estimator is 2
X(t1) = X(t0) cos{ω0(t1 − t0)} . (8.56)
It is interesting to observe that the distribution of A doesn’t play a role in this equation.
To evaluate the mean square error associated with the LMMSE estimator, we compute the correlation coefficient between the samples of the random signal at t0 and t1. It is easily seen thatρ = a = cos{ω0(t1 − t0)}, so the mean square error is
E[A2] (1 − cos 2 {ω0(t1 − t0)}
) =
E[A2] sin2 {ω0(t1 − t0)} . (8.57)
2 2
We now extend the LMMSE estimator to the case where our estimation of a random variable Y is based on observations of multiple random variables, say X1, . . . ,XL, gathered in the vector X. The affine estimator may then be written in the form
L
Yℓ = yℓ(X) = a0 + ∑
aj Xj . (8.58) j=1
As we shall see, the coefficient ai of this LMMSE estimator can be found by solving a linear system of equations that is completely defined by the first and second moments (i.e., means, variances and covariances) of the random variables Y and Xj . The fact that the model (8.58) is linear in the parameters ai is what results in a linear system of equations; the fact that the model is affine in the random variables is what makes the solution only depend on their first and second moments. Linear equations are easy to solve, and first and second moments are generally easy to determine, hence the popularity of LMMSE estimation.
The development below follows along the same lines as that done earlier in this section for the case where we just had a single observed random variable X, but we use the opportunity to review the logic of the development and to provide a few additional insights.
We want to minimize the mean square error
L
E[(
Y − (a0 + ∑
aj Xj ))2]
, (8.59) j=1
where the expectation is computed using the joint density of Y and X. We use the joint density rather than the conditional because the parameters are not going to be picked to be best for a particular set of measured values x — otherwise we could do as well as the nonlinear estimate in this case, by setting a0 = E[Y X = x] and |setting all the other ai to zero. Instead, we are picking the parameters to be the best averaged over all possible X. The linear estimator will in general not be as good
©Alan V. Oppenheim and George C. Verghese, 2010 c

Section 8.3 Linear Minimum Mean Square Error Estimation 157
as the unconstrained estimator, except in special cases (some of them important, as in the case of bivariate Gaussian random variables) but this estimator has the advantage that it is easy to solve for, as we now show.
To minimize the expression in (8.59), we differentiate it with respect to ai for i = 0, 1, , L, and set each of the derivatives to 0. (Again, calculations involving · · · second derivatives establish that we do indeed obtain minimizing values, but we omit these calculation here.) First differentiating with respect to a0 and setting the result to 0, we conclude that
L
E[Y ] = E[ a0 + ∑
aj Xj ] = E[Yℓ] (8.60) j=1
or L
a0 = µY − ∑
aj µXj , (8.61) j=1
where µY = E[Y ] and µXj = E[Xj ]. This optimum value of a0 serves to make the linear estimator unbiased, in the sense that (8.60) holds, i.e., the expected value of the estimator is the expected value of the random variable we are trying to estimate.
Using (8.61) to substitute for a0 in (8.58), it follows that
L
Yℓ = µY + ∑
aj (Xj − µXj ) . (8.62) j=1
In other words, the estimator corrects the expected value µY of the variable we are estimating, by a linear combination of the deviations Xj − µXj between the measured random variables and their respective expected values.
Taking account of (8.62), we can rewrite our mean square error criterion (8.59) as
L
E[{(Y − µY ) − (Yℓ − µY )}2] = E[(
Y − ∑
aj Xj ))2]
, (8.63) j=1
where Y = Y − µY and Xj = Xj − µXj . (8.64)
Differentiating this with respect to each of the remaining coefficients ai, i = 1, 2, ...L, and setting the result to zero produces the equations
L
E[( Y − ∑
aj Xj )Xi] = 0 i = 1, 2, ..., L . (8.65) j=1
or equivalently, if we again take account of (8.62),
E[(Y − Yℓ)Xi] = 0 i = 1, 2, ..., L . (8.66)
c©Alan V. Oppenheim and George C. Verghese, 2010

158 Chapter 8 Estimation with Minimum Mean Square Error
Yet another version follows on noting from (8.60) that Y − Yℓ is orthogonal to all constants, in particular to µXi , so
E[(Y − Yℓ)Xi] = 0 i = 1, 2, ..., L . (8.67)
All three of the preceding sets of equations express, in slightly different forms, the orthogonality of the estimation error to the random variables used in the estimator. One moves between these forms by invoking the unbiasedness of the estimator. The last of these, (8.67), is the usual statement of the orthogonality condition that governs the LMMSE estimator. (Note once more that the statement in the case of the MMSE estimator in the previous section was considerably stronger, namely that the error was orthogonal to any function h(X) of the measured random variables, not just to the random variables themselves.) Rewriting this last equation as
E[Y Xi] = E[YℓXi] i = 1, 2, ..., L (8.68)
yields an equivalent statement of the orthogonality condition, namely that the LMMSE estimator Yℓ has the same correlations as Y with the measured variables Xi.
The orthogonality and unbiasedness conditions together determine the LMMSE estimator completely. Also, the preceding developments shows that the first and second moments of Y and the Xi are exactly matched by the corresponding first and second moments of Yℓ and the Xi. It follows that Y and Yℓ cannot be told apart on the basis of only first and second moments with the measured variables Xi.
We focus now on (8.65), because it provides the best route to a solution for the coefficients aj , j = 1, . . . , L. This set of equations can be expressed as
L∑ σXi Xj aj = σXiY , (8.69)
j=1
where σXiXj is the covariance of Xi and Xj (so σXiXi is just the variance σ2 ), Xi
and σXiY is the covariance of Xi and Y . Collecting these equations in matrix form, we obtain
σX1X1 σX1X2 · · · σX1XL
a1
σX1Y
σX2X1
. . .
σX2X2
. . .
· · · . . .
σX2XL
. . .
a2 . . .
=
σX2Y . . .
. (8.70)
σXLX1 σXL X2 · · · σXLXL aL σXLY
This set of equations is referred to as the normal equations. We can rewrite the normal equations in more compact matrix notation:
(CXX) a = CXY (8.71)
where the definitions of CXX, a, and CXY should be evident on comparing the last two equations. The solution of this set of L equations in L unknowns yields the
©Alan V. Oppenheim and George C. Verghese, 2010 c

Section 8.3 Linear Minimum Mean Square Error Estimation 159
{aj } for j = 1, , L, and these values may be substituted in (8.62) to completely · · · specify the estimator. In matrix notation, the solution is
a = (CXX)−1CXY . (8.72)
It can be shown quite straightforwardly (though we omit the demonstration) that the minimum mean square error obtained with the LMMSE estimator is
σY 2 − CY X(CXX)−1CXY = σY
2 − CY Xa , (8.73)
where CY X is the transpose of CXY .
EXAMPLE 8.8 Estimation from Two Noisy Measurements
R1
↓⊕ X1→ →
|Y →
| ⊕ X2→ →
↑R2
FIGURE 8.9 Illustration of relationship between random variables from Eq. (8.75) for Example 8.8.
Assume that Y , R1 and R2 are mutually uncorrelated, and that R1 and R2 have zero means and equal variances. We wish to find the linear MMSE estimator for Y , given measurements of X1 and X2. This estimator takes the form Yℓ = a0 +a1X1 +a2X2. Our requirement that Yℓ be unbiased results in the constraint
a0 = µY − a1µX1 − a2µX2 = µY (1 − a1 − a2) (8.74)
Next, we need to write down the normal equations, for which some preliminary calculations are required. Since
X1 = Y + R1
X2 = Y + R2 (8.75)
and Y , R1 and R2 are mutually uncorrelated, we find
E[Xi 2] = E[Y 2] + E[R2
i ] ,
E[X1X2] = E[Y 2] ,
E[XiY ] = E[Y 2] . (8.76)
©Alan V. Oppenheim and George C. Verghese, 2010 c

]
]
160 Chapter 8 Estimation with Minimum Mean Square Error
The normal equations for this case thus become [
σ2 + σ2 σ2 [
σ2 Y
2 2 2 2σ σ σ σ+ Y
[σ2 + σ2
−σ2 R
Y
Y
R
Y
Y
R
Y
Y
] [ a1
]
] [ 2σY
Yσ2
(8.77) = a2
from which we conclude that [
a1 ]
2σ+ R
2σ− Y 2σY
1 =
(σ2 + σ2
σ2
= . R
R
2 22σ σ+ Y
Y
Y − σ4 Y [ ]
1
)2a2
(8.78) 1
Finally, therefore,
2(σR2σ+ R
1 2 2σ X σ+ +1 YY
2 2σ σRY
2σ2 Y
and applying (8.73) we get that the associated minimum mean square error (MMSE) is
Yℓ X2) (8.79) = µY
. (8.80)
2 2sonable values at extreme ranges of the signal-to-noise ratio σ /σRY
2 22σ σ+ RY
One can easily check that both the estimator and the associated MMSE take rea.
©Alan V. Oppenheim and George C. Verghese, 2010 c

MIT OpenCourseWarehttp://ocw.mit.edu
6.011 Introduction to Communication, Control, and Signal Processing Spring 2010
For information about citing these materials or our Terms of Use, visit: http://ocw.mit.edu/terms.