ethanol in brasil: a model to follow or to avoid? (latin america … · 2015-12-16 · weather...
TRANSCRIPT
Ethanol in Brasil: a model to follow or to avoid? (Latin America mini-series 3 of 4)Dario Gaeta
Understand the Ethanol economic
environment in Brazil: past, present and
future
Know how a Sugarcane mill works
Evaluate the recent milestones of the Ethanol
Program
Keep asking…
Objectives
Milestones of the Ethanol in Brazil
Basics about Sugarcane Ethanol
Comparison between Ethanol and Gasoline
Feasibility of the Ethanol as biofuel
Future of the Bio feedstock – end of Oil era?
Futurology
Q&A
AGENDA
Early 70’s ‐ launched the Ethanol Program by Military Government
Late 70’s –Ethanol car developed, production grew 6 fold
80’s ‐ second oil crisis, ethanol supply crisis
Late 90’s – blend increased to 22%
2003 – FFC launched
2005‐2007 – ethanol booming
2008 – 2014 – ethanol blowing
2016 – ethanol Phoenix program
Milestones for Sugarcane Ethanol in Brazil
Source: UNICA
SUGARCANE MILL and BASICSUNICA PRESENTATION
http://english.unica.com.br/virtual‐mill/video‐new/virtual‐mill.htm

• 5MM t of sugarcane p.y.
• 3.000 employees
• 24/7 – 260 days
• > 800 vehicles
• 40 MM USD maintenance cost every year
• 10.000 ha replant every year
• 300 MM l Ethanol
• 250 Th t Sugar
KEY NUMBERS – Sugarcane mill
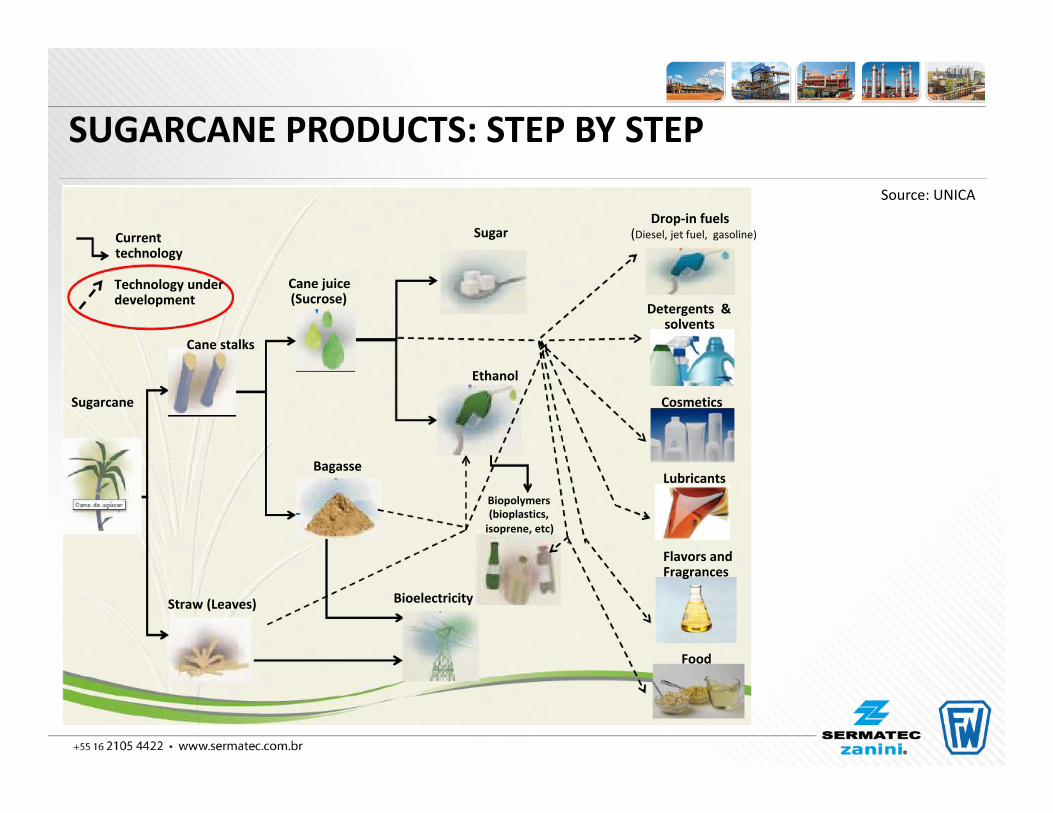
Cane juice(Sucrose)
Bagasse
Ethanol
Sugarcane
SugarCurrenttechnology
Technology underdevelopment
Cane stalks
Detergents &solvents
Cosmetics
Drop‐in fuels(Diesel, jet fuel, gasoline)
Straw (Leaves) Bioelectricity
Biopolymers(bioplastics,isoprene, etc)
Lubricants
Flavors andFragrances
Food
Source: UNICA
SUGARCANE PRODUCTS: STEP BY STEP
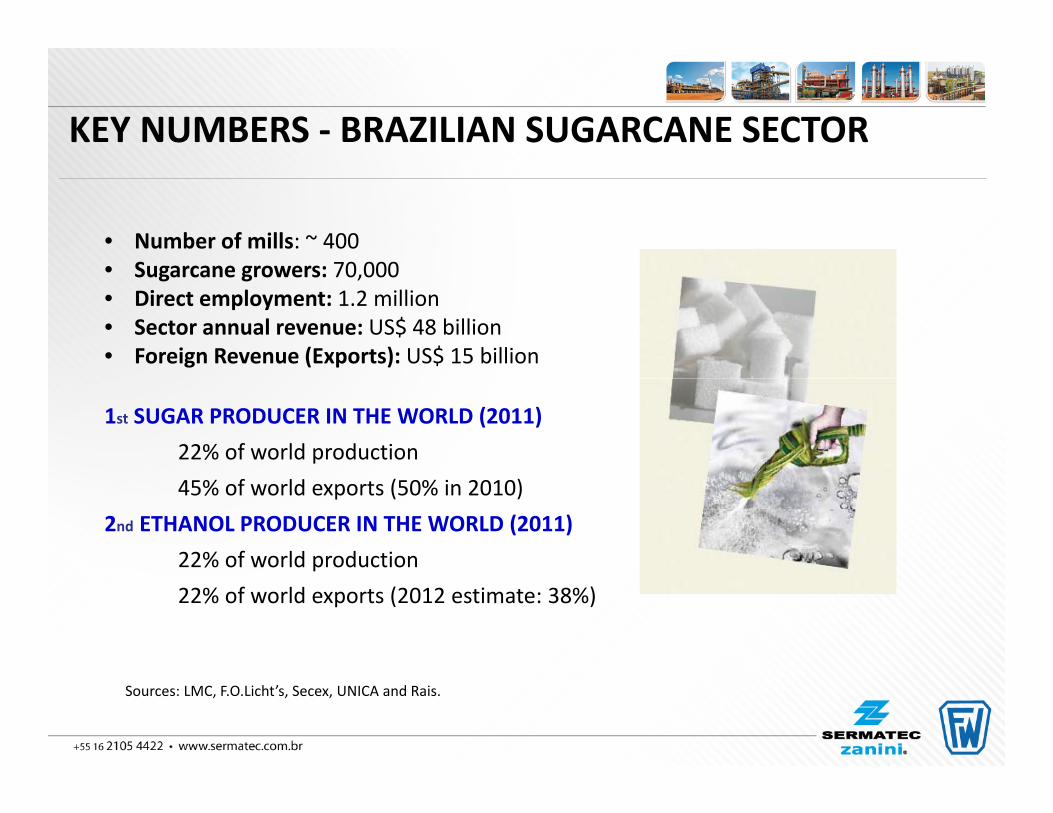
Sources: LMC, F.O.Licht’s, Secex, UNICA and Rais.
• Number of mills: ~ 400• Sugarcane growers: 70,000• Direct employment: 1.2 million• Sector annual revenue: US$ 48 billion• Foreign Revenue (Exports): US$ 15 billion
1st SUGAR PRODUCER IN THE WORLD (2011)22% of world production45% of world exports (50% in 2010)
2nd ETHANOL PRODUCER IN THE WORLD (2011)22% of world production22% of world exports (2012 estimate: 38%)
KEY NUMBERS ‐ BRAZILIAN SUGARCANE SECTOR
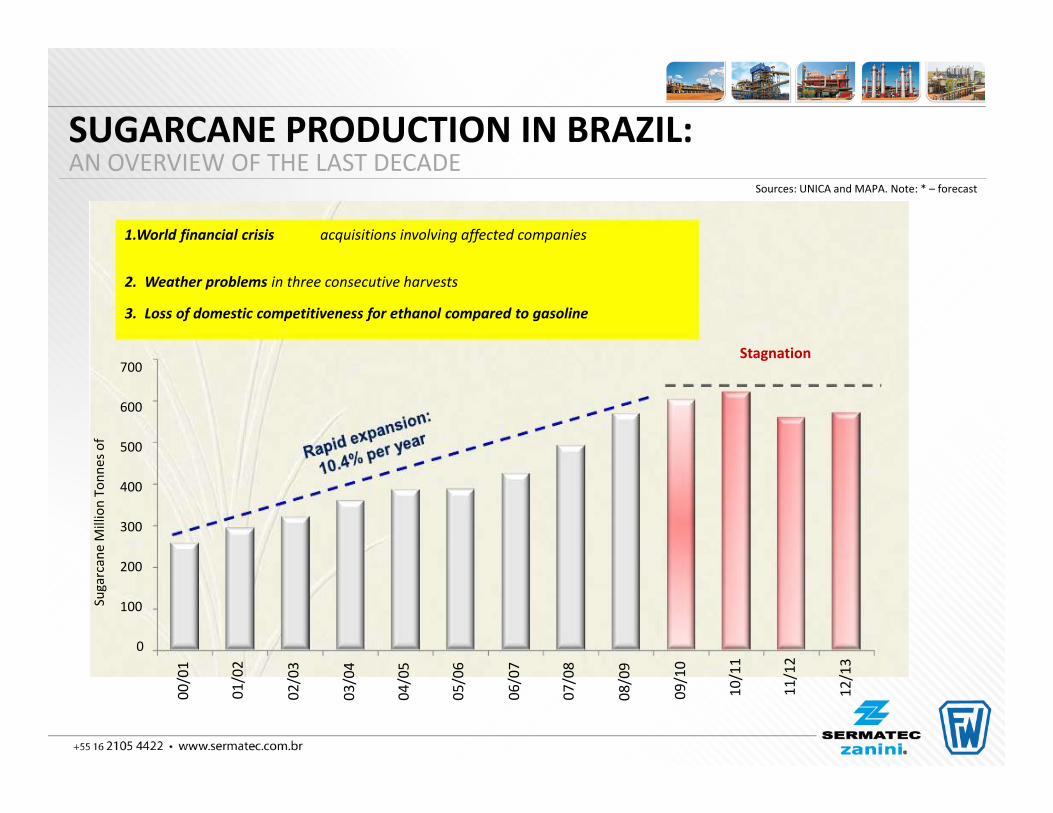
SugarcaneMillionTonn
esof
00/01
01/02
02/03
03/04
04/05
05/06
06/07
07/08
08/09
09/10
12/13
10/11
11/12
Stagnation
1.World financial crisis acquisitions involving affected companies
2. Weather problems in three consecutive harvests
3. Loss of domestic competitiveness for ethanol compared to gasoline
700
600
500
400
300
200
100
0
Sources: UNICA and MAPA. Note: * – forecast
SUGARCANE PRODUCTION IN BRAZIL:AN OVERVIEW OF THE LAST DECADE
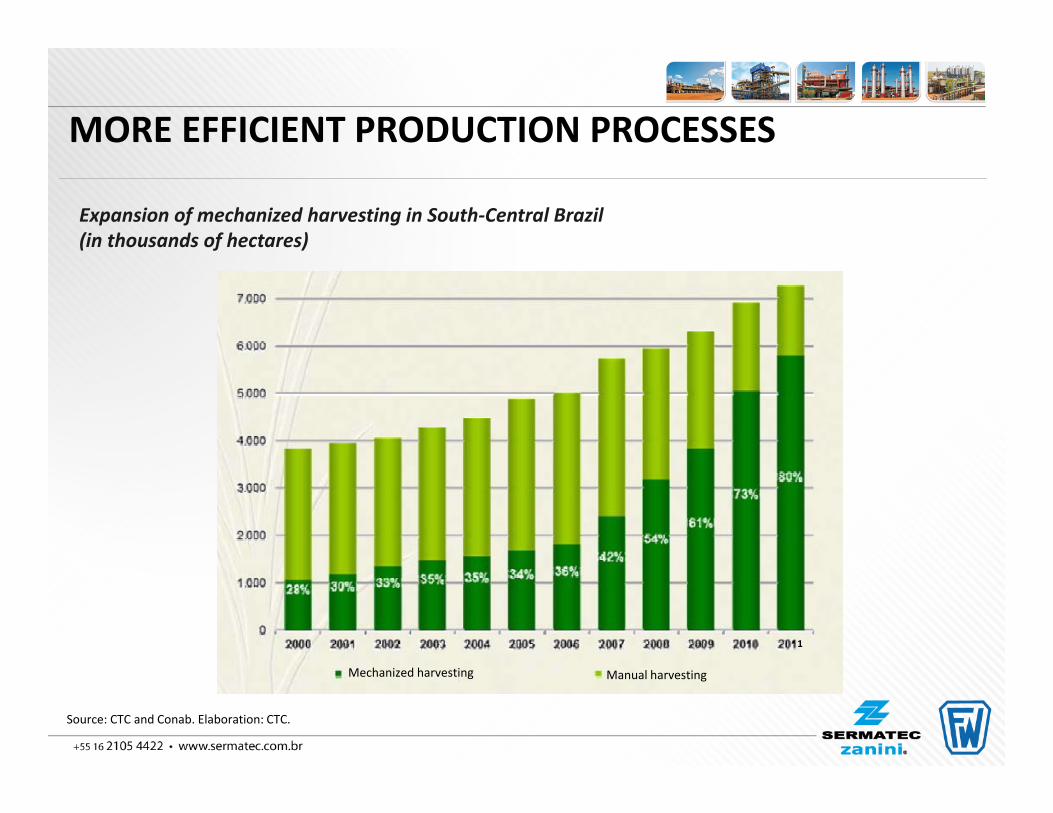
Expansion of mechanized harvesting in South‐Central Brazil(in thousands of hectares)
1
Mechanized harvesting Manual harvesting
Source: CTC and Conab. Elaboration: CTC.
MORE EFFICIENT PRODUCTION PROCESSES
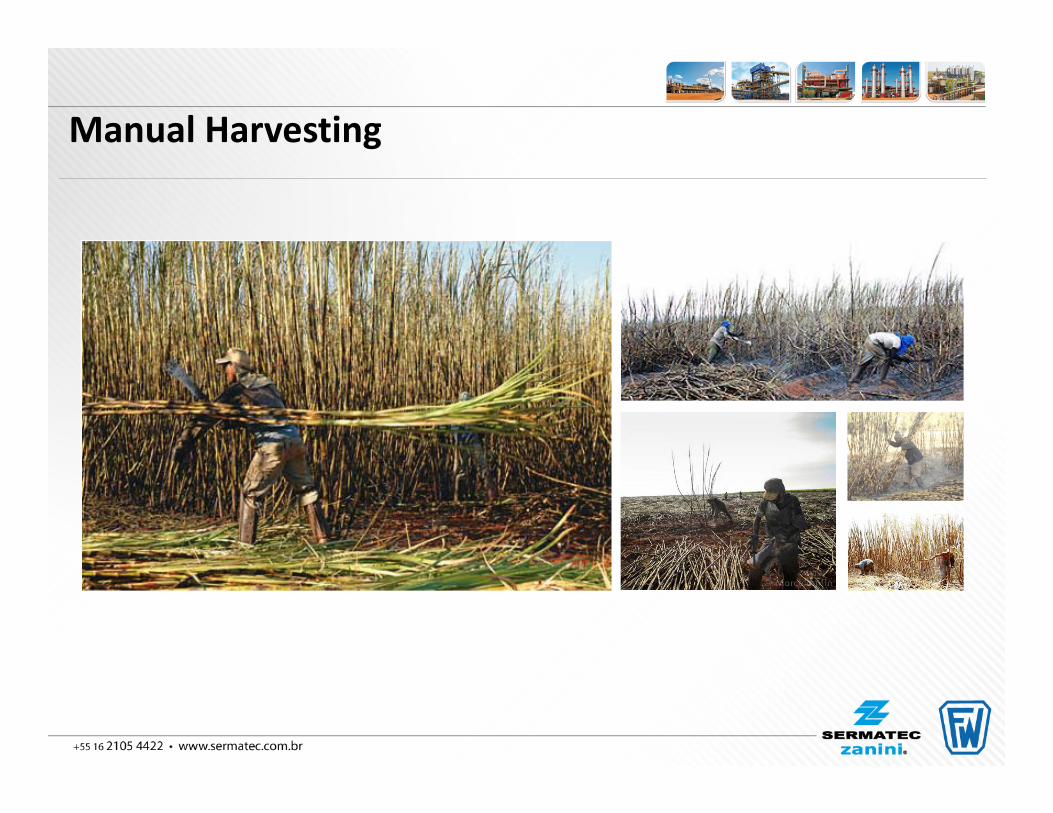
Manual Harvesting
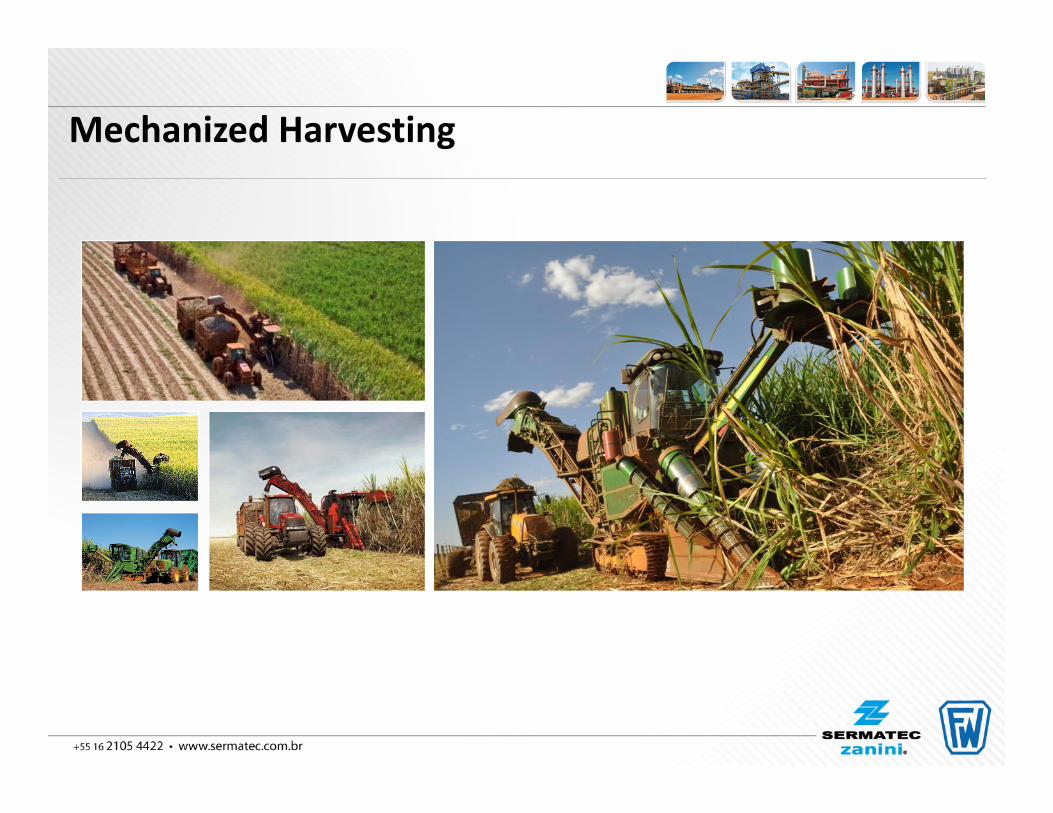
Mechanized Harvesting
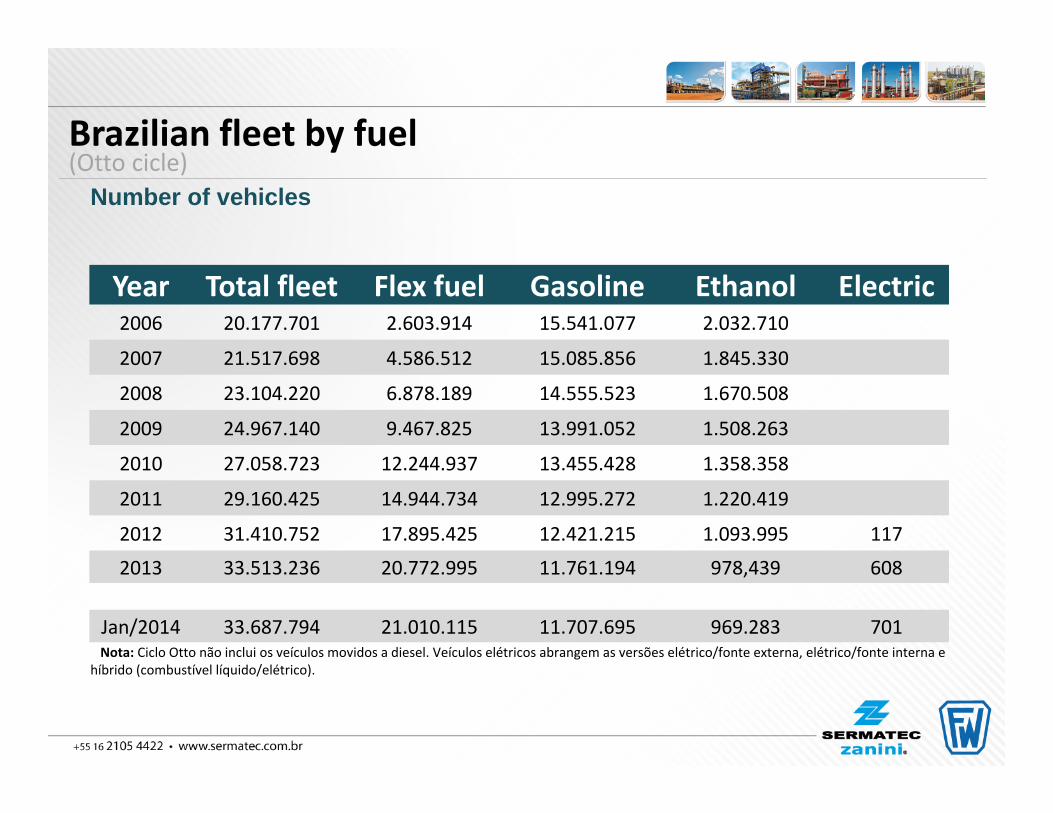
Brazilian fleet by fuel(Otto cicle)
Number of vehicles
Year Total fleet Flex fuel Gasoline Ethanol Electric2006 20.177.701 2.603.914 15.541.077 2.032.710
2007 21.517.698 4.586.512 15.085.856 1.845.330
2008 23.104.220 6.878.189 14.555.523 1.670.508
2009 24.967.140 9.467.825 13.991.052 1.508.263
2010 27.058.723 12.244.937 13.455.428 1.358.358
2011 29.160.425 14.944.734 12.995.272 1.220.419
2012 31.410.752 17.895.425 12.421.215 1.093.995 117
2013 33.513.236 20.772.995 11.761.194 978,439 608
Jan/2014 33.687.794 21.010.115 11.707.695 969.283 701Nota: Ciclo Otto não inclui os veículos movidos a diesel. Veículos elétricos abrangem as versões elétrico/fonte externa, elétrico/fonte interna e
híbrido (combustível líquido/elétrico).
motorcycles
(million)
Fleet
2005
2006
2007
2008
2009
2010
2011
2012
2013
2014
2015
2016
2017
Millions
ofvehicles
2003
2004
2005
2006
2007
2008
2009
2010
2011
2012
2013
2014
2015
2016
2017
2018
2019
2020
2018
2019
2020
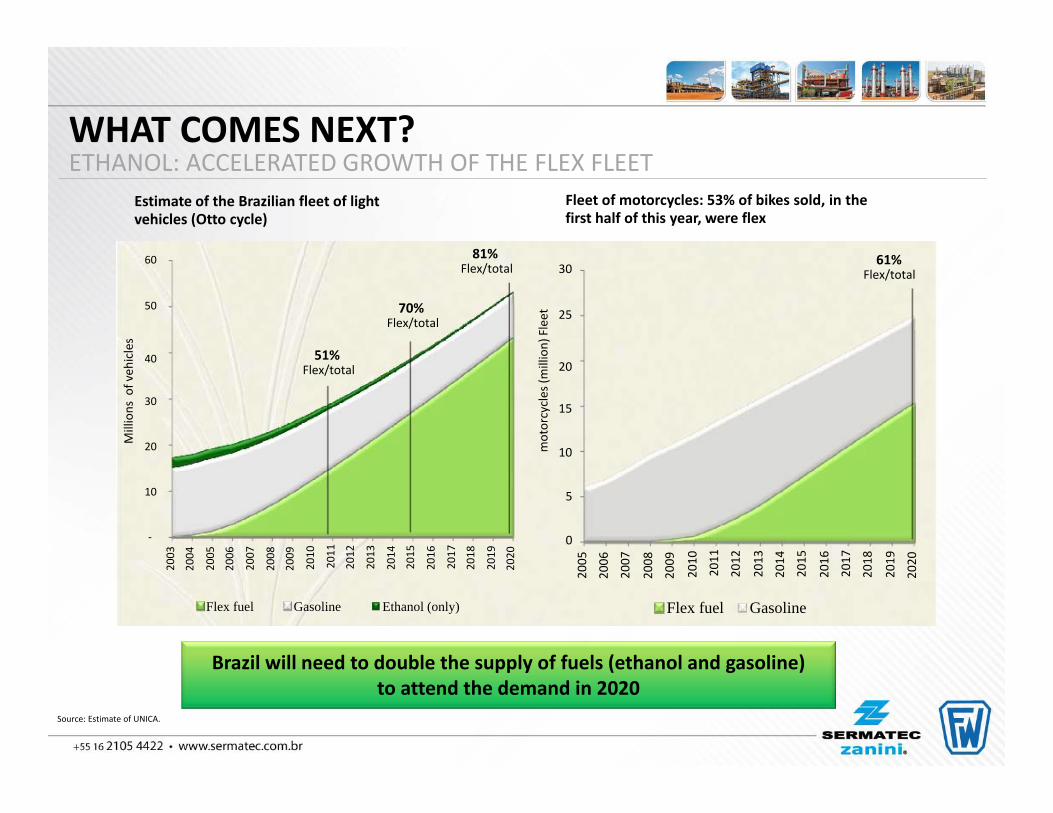
Estimate of the Brazilian fleet of lightvehicles (Otto cycle)
50
60
51%Flex/total
70%Flex/total
81%Flex/total
25
3061%
Flex/total
Fleet of motorcycles: 53% of bikes sold, in thefirst half of this year, were flex
40
30
20
10
‐
Flex fuel Gasoline Ethanol (only)
20
15
10
5
0
Flex fuel Gasoline
Source: Estimate of UNICA.
Brazil will need to double the supply of fuels (ethanol and gasoline)to attend the demand in 2020
WHAT COMES NEXT?ETHANOL: ACCELERATED GROWTH OF THE FLEX FLEET
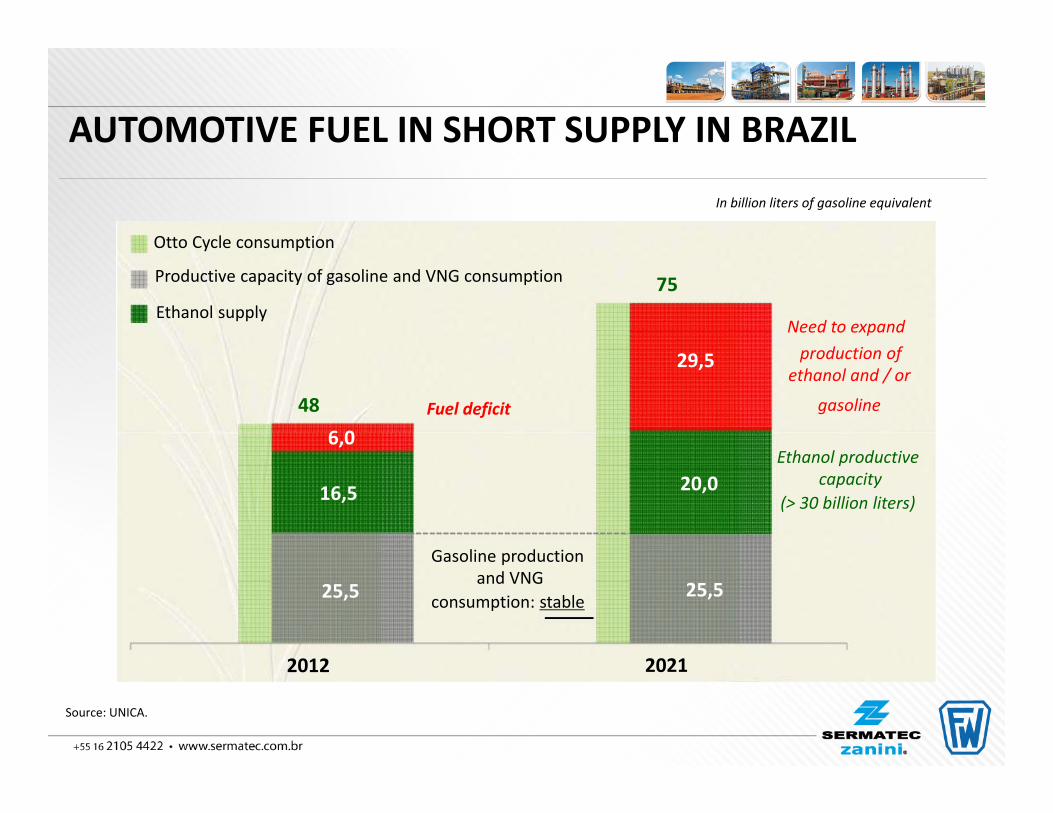
48
75Ethanol supply
Productive capacity of gasoline and VNG consumption
29,5
Need to expandproduction of
ethanol and / or
gasoline
Otto Cycle consumption
Fuel deficit
6,0
16,5
25,5
2012
25,5
2021
20,0Ethanol productive
capacity(> 30 billion liters)
Gasoline productionand VNG
consumption: stable
Source: UNICA.
In billion liters of gasoline equivalent
AUTOMOTIVE FUEL IN SHORT SUPPLY IN BRAZIL
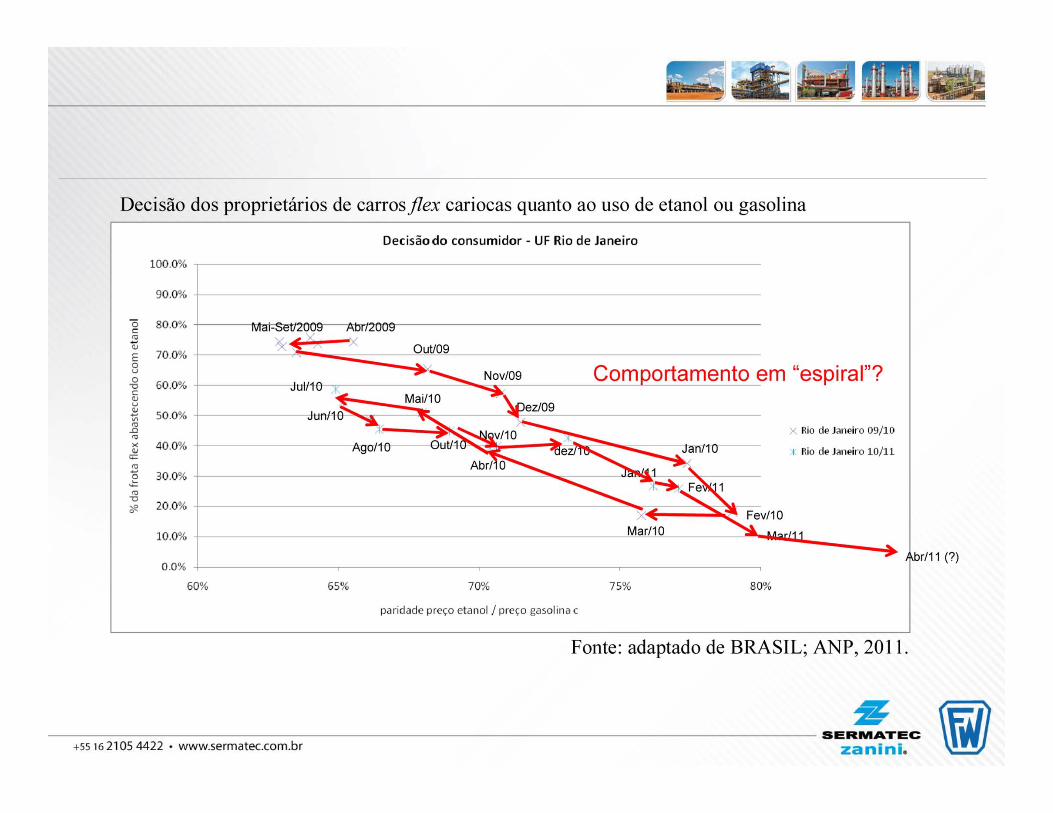
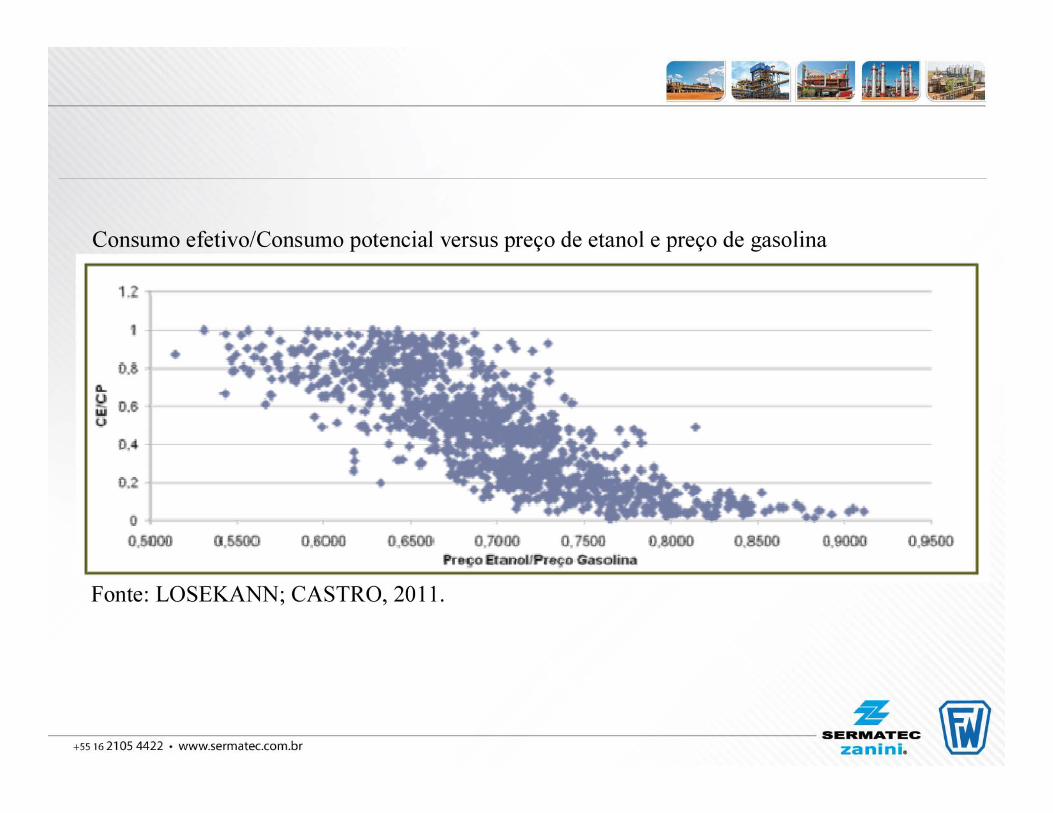
There is a historical 70% Ethanol/gasoline price ratio
Mills have flexibility but not that much:
60 / 40 – 40 / 60
Since 2009 Gasoline did not have its price adjust by inflation
Since 2009 Ethanol has a 7%p.a. avg cost increase
Petrobras case
Lack of long term Policy
Ethanol trade offs
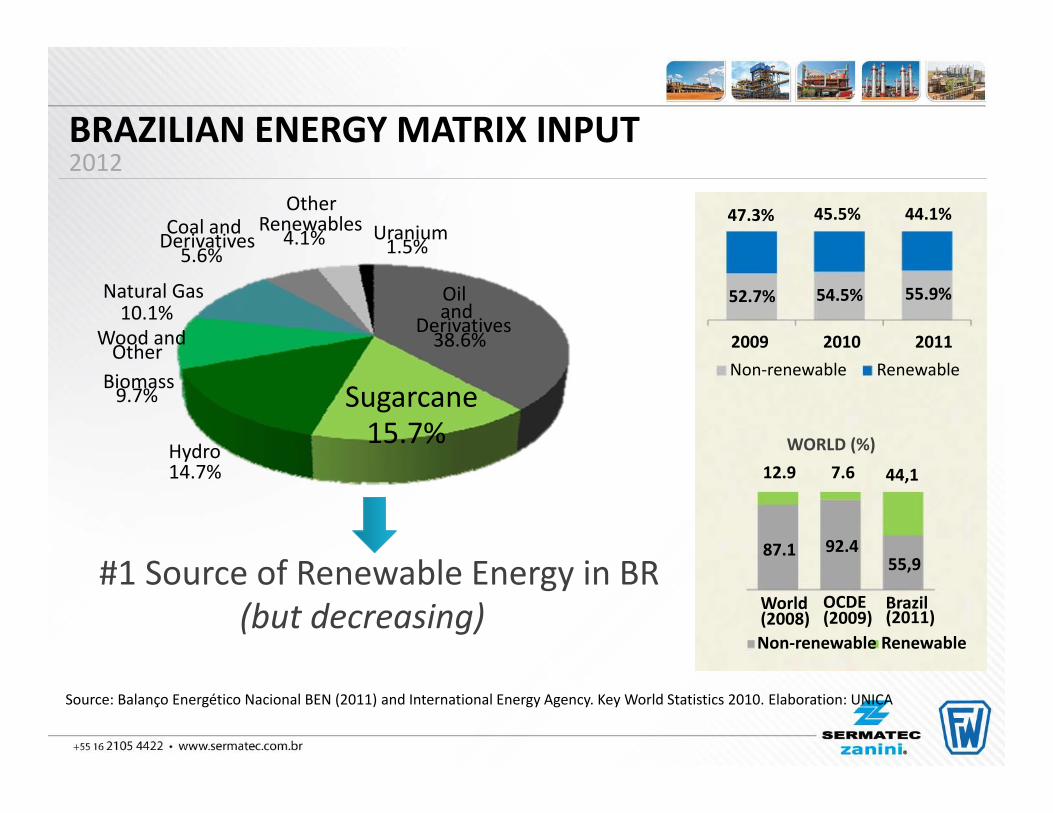
Source: Balanço Energético Nacional BEN (2011) and International Energy Agency. Key World Statistics 2010. Elaboration: UNICA
BRAZILIAN ENERGY MATRIX INPUT2012
52.7% 54.5% 55.9%
47.3% 45.5% 44.1%
2009 2010 2011Non‐renewable Renewable
WORLD (%)12.9 7.6 44,1
87.1
World(2008)
92.4
OCDE(2009)
55,9
Brazil(2011)
Non‐renewable Renewable
Oiland
Derivatives38.6%
Natural Gas10.1%
Wood andOther
Coal andDerivatives5.6%
OtherRenewables
4.1% Uranium1.5%
Sugarcane15.7%
Hydro14.7%
Biomass9.7%
#1 Source of Renewable Energy in BR(but decreasing)
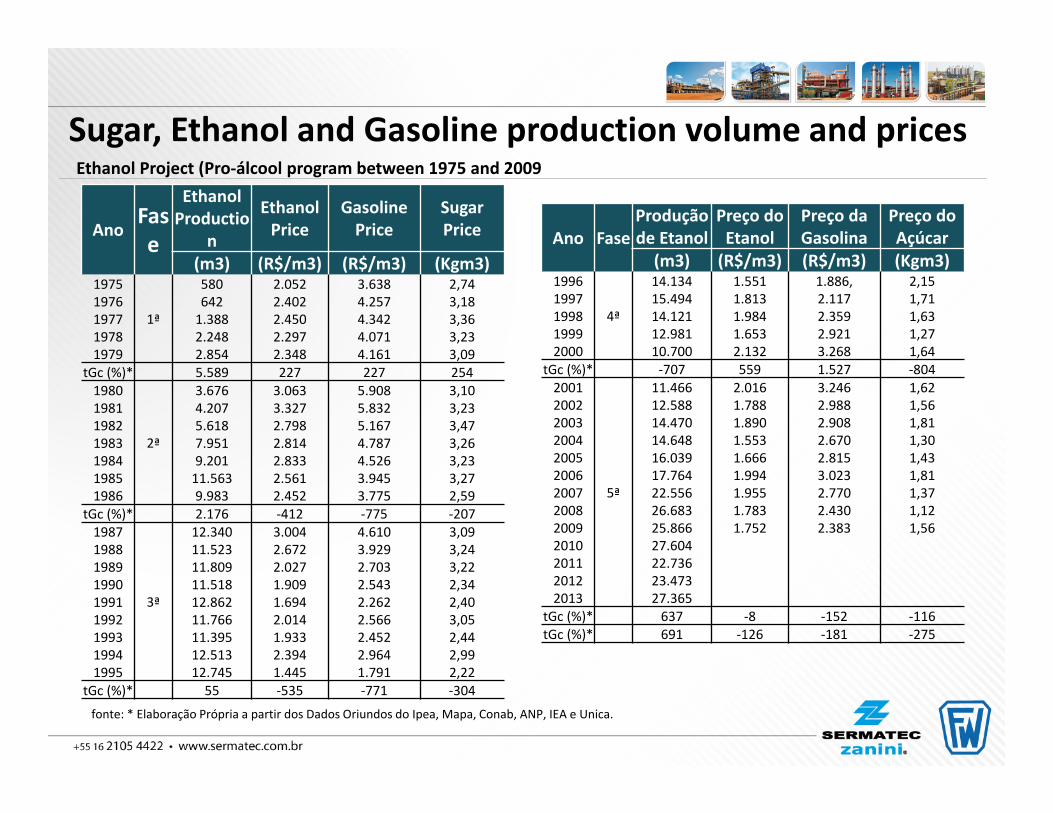
Sugar, Ethanol and Gasoline production volume and prices
AnoFase
EthanolProductio
n
EthanolPrice
GasolinePrice
Sugar Price
(m3) (R$/m3) (R$/m3) (Kgm3)19751976197719781979
1ª
5806421.3882.2482.854
2.0522.4022.4502.2972.348
3.6384.2574.3424.0714.161
2,743,183,363,233,09
tGc (%)* 5.589 227 227 2541980198119821983198419851986
2ª
3.6764.2075.6187.9519.20111.5639.983
3.0633.3272.7982.8142.8332.5612.452
5.9085.8325.1674.7874.5263.9453.775
3,103,233,473,263,233,272,59
tGc (%)* 2.176 ‐412 ‐775 ‐207198719881989199019911992199319941995
3ª
12.34011.52311.80911.51812.86211.76611.39512.51312.745
3.0042.6722.0271.9091.6942.0141.9332.3941.445
4.6103.9292.7032.5432.2622.5662.4522.9641.791
3,093,243,222,342,403,052,442,992,22
tGc (%)* 55 ‐535 ‐771 ‐304
Ethanol Project (Pro‐álcool program between 1975 and 2009
Ano FaseProdução de Etanol
Preço do Etanol
Preço da Gasolina
Preço do Açúcar
(m3) (R$/m3) (R$/m3) (Kgm3)19961997199819992000
4ª
14.13415.49414.12112.98110.700
1.5511.8131.9841.6532.132
1.886,2.1172.3592.9213.268
2,151,711,631,271,64
tGc (%)* ‐707 559 1.527 ‐8042001200220032004200520062007200820092010201120122013
5ª
11.46612.58814.47014.64816.03917.76422.55626.68325.86627.60422.73623.47327.365
2.0161.7881.8901.5531.6661.9941.9551.7831.752
3.2462.9882.9082.6702.8153.0232.7702.4302.383
1,621,561,811,301,431,811,371,121,56
tGc (%)* 637 ‐8 ‐152 ‐116tGc (%)* 691 ‐126 ‐181 ‐275
fonte: * Elaboração Própria a partir dos Dados Oriundos do Ipea, Mapa, Conab, ANP, IEA e Unica.
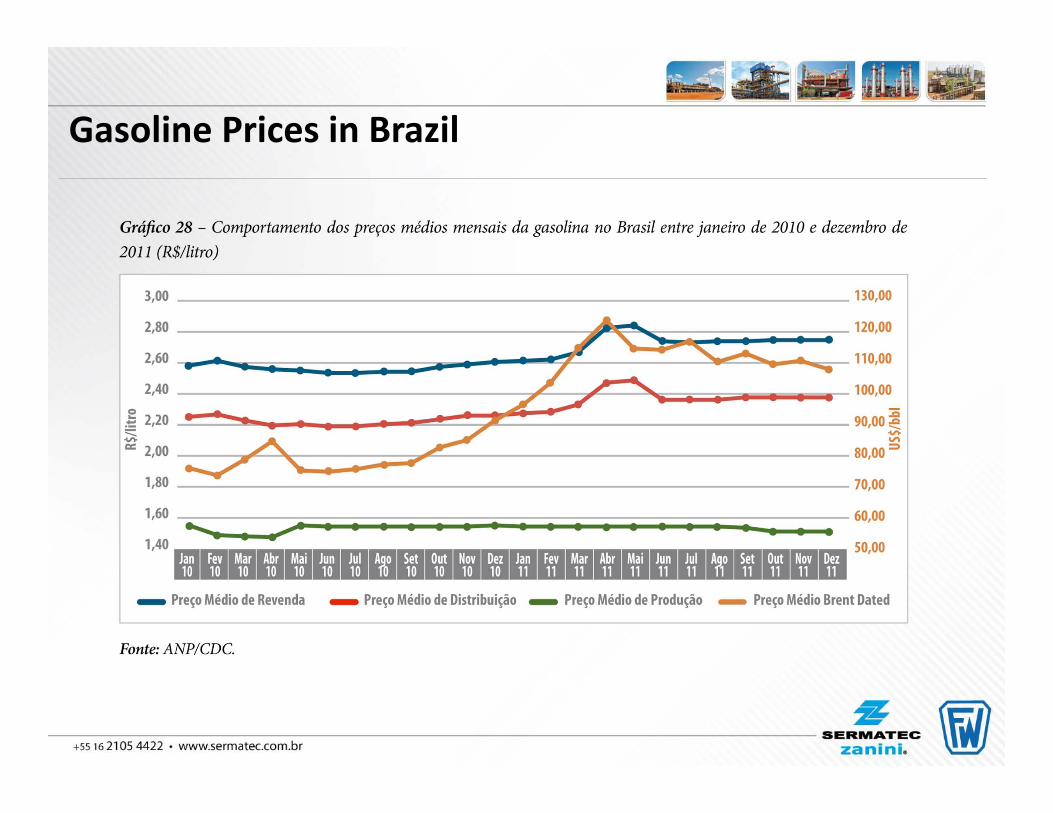
Gasoline Prices in Brazil
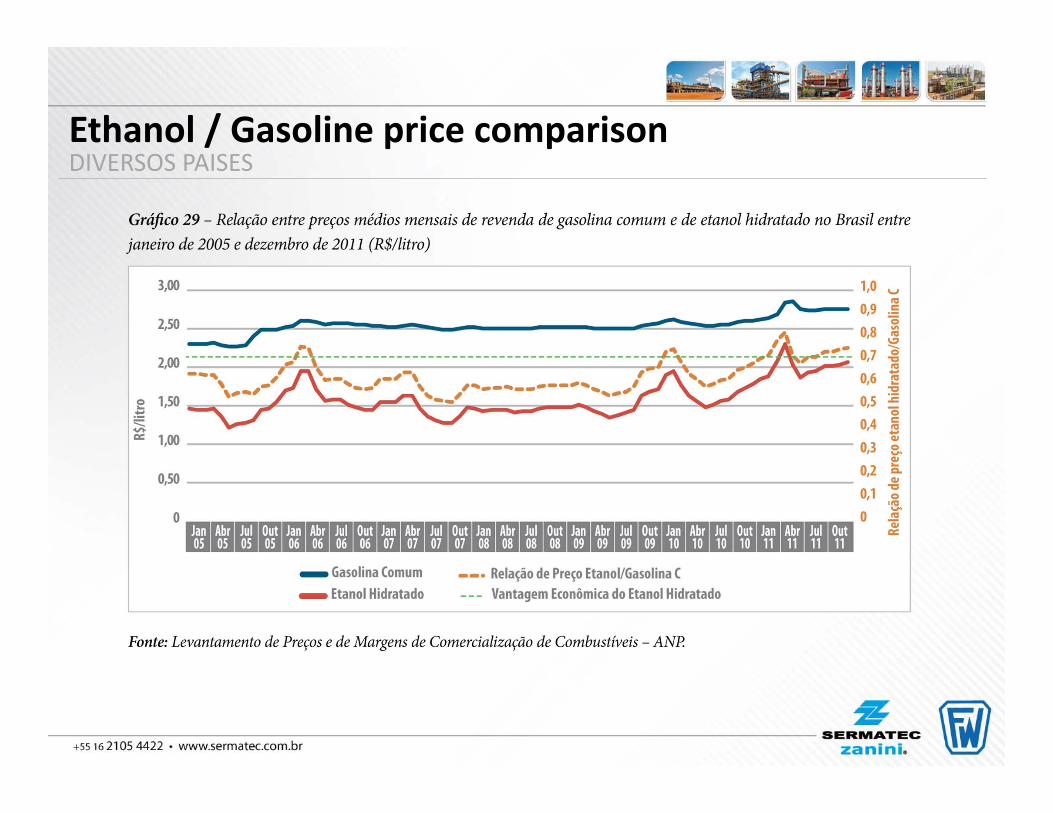
Ethanol / Gasoline price comparisonDIVERSOS PAISES
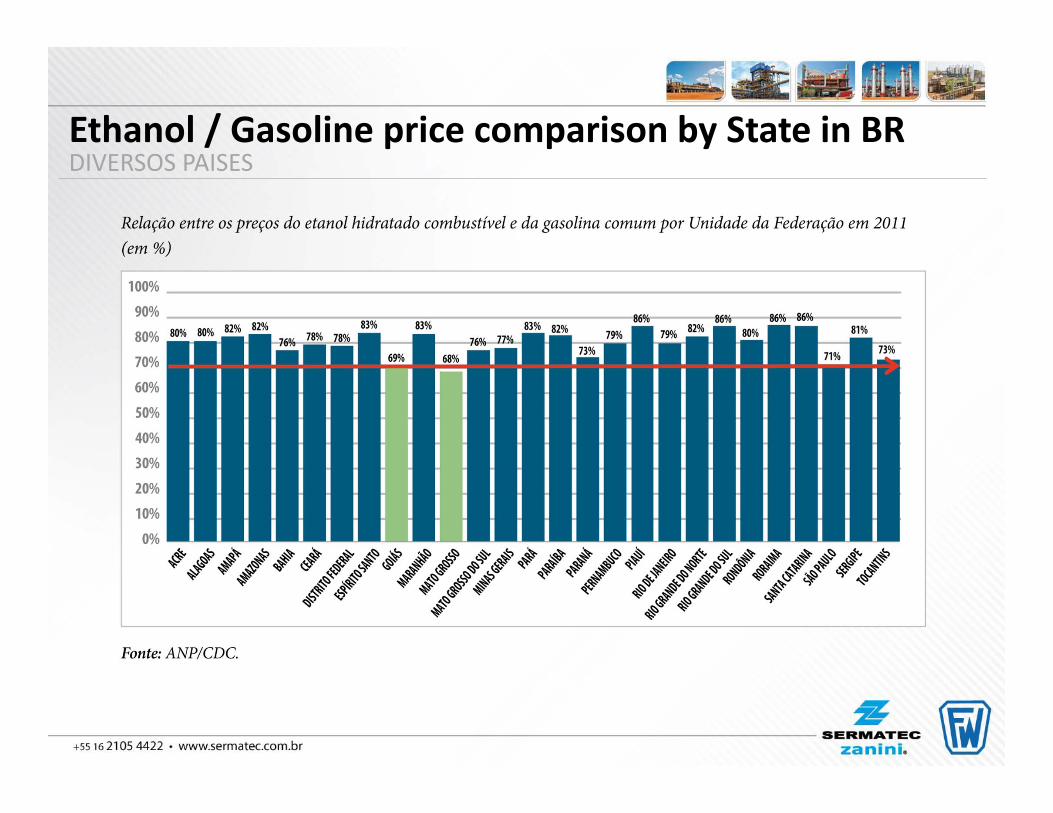
Ethanol / Gasoline price comparison by State in BRDIVERSOS PAISES
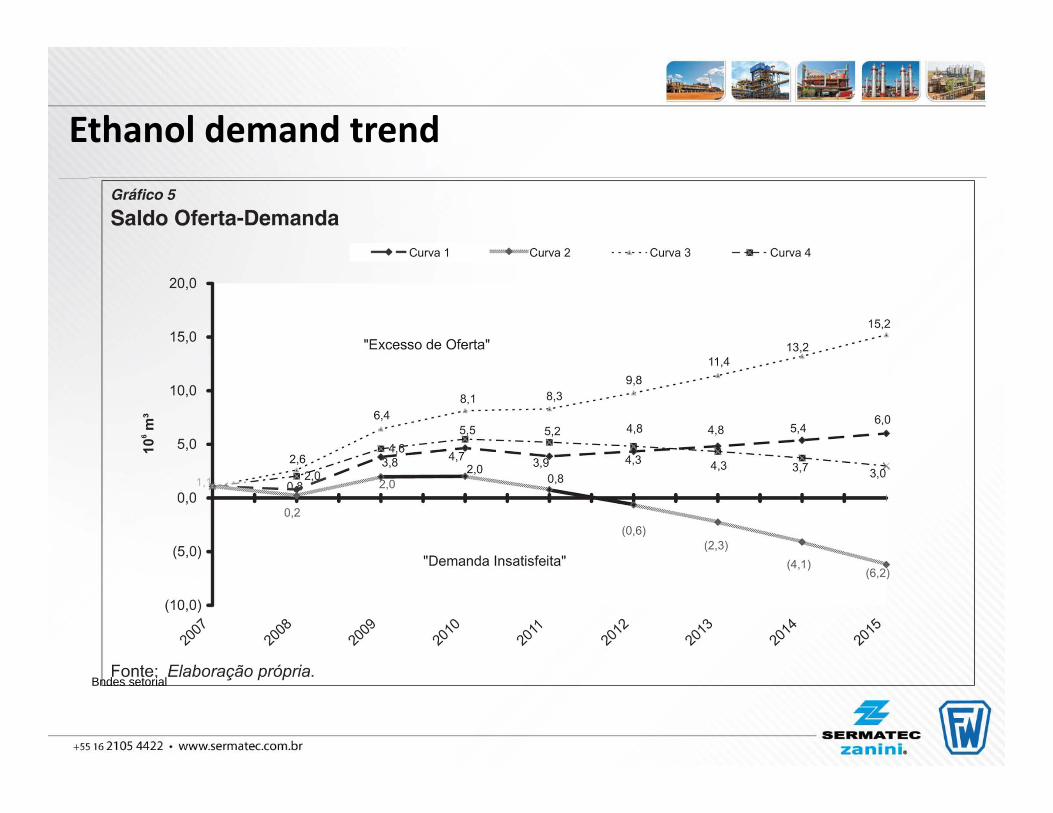
Ethanol demand trend
Bndes setorial
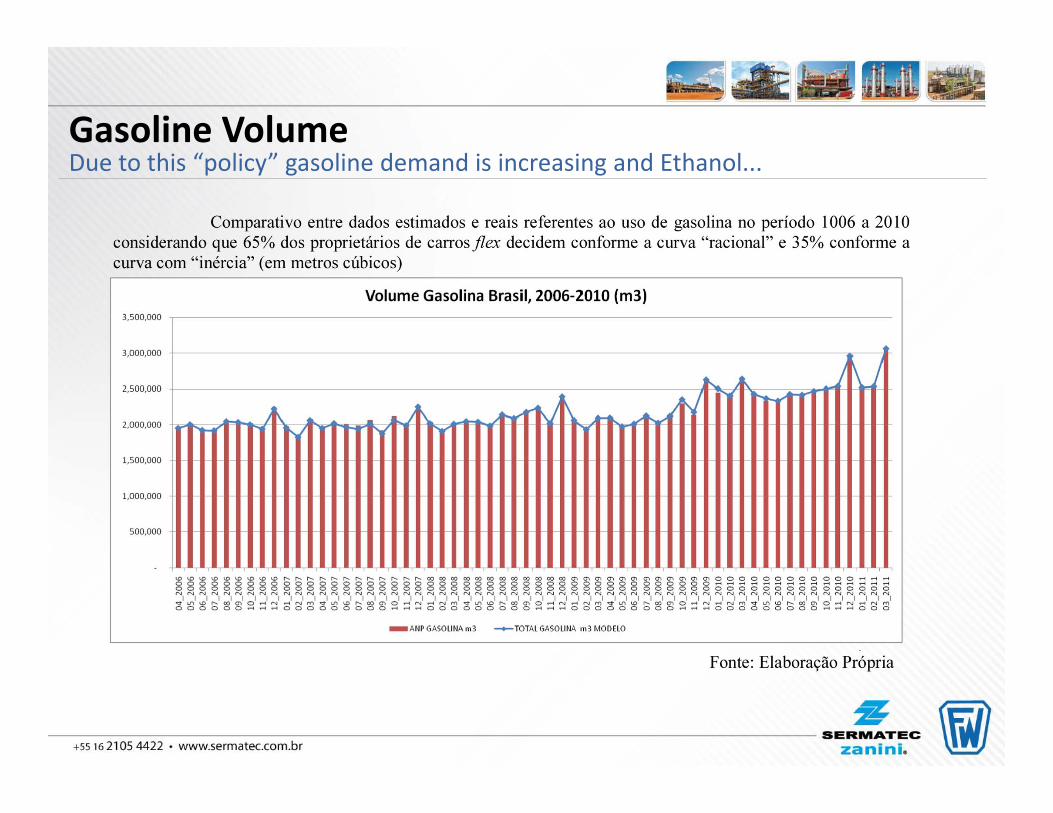
Gasoline VolumeDue to this “policy” gasoline demand is increasing and Ethanol...
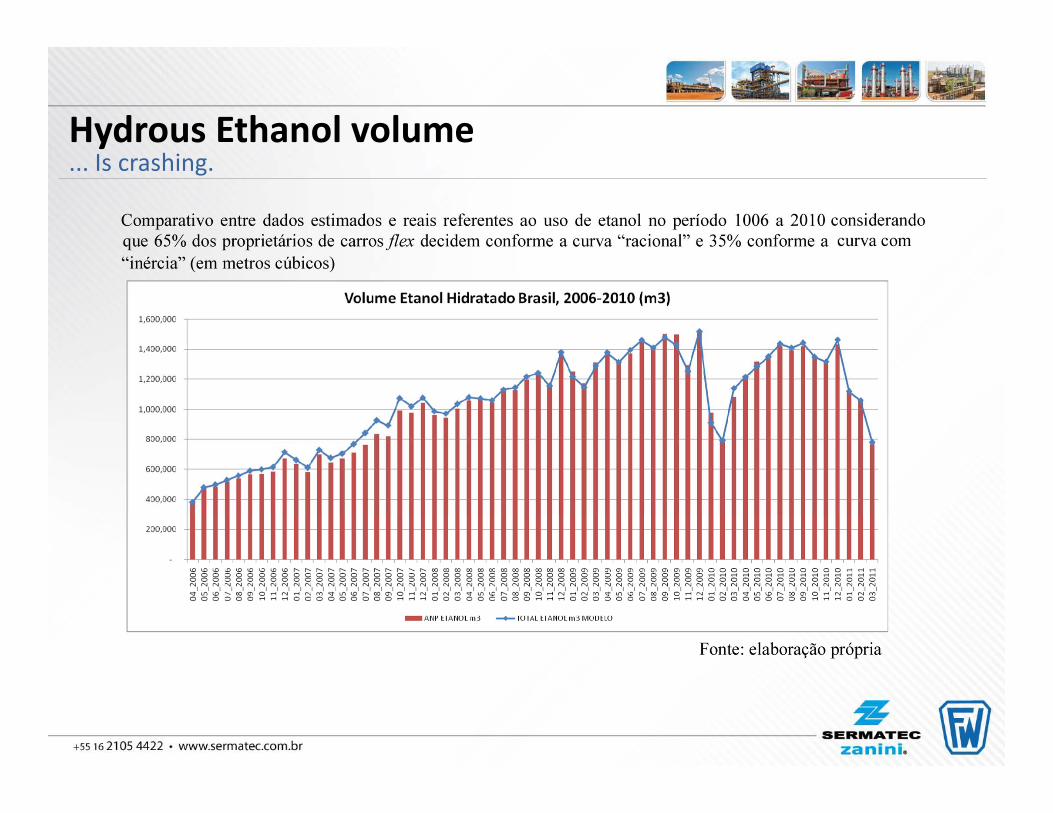
Hydrous Ethanol volume... Is crashing.
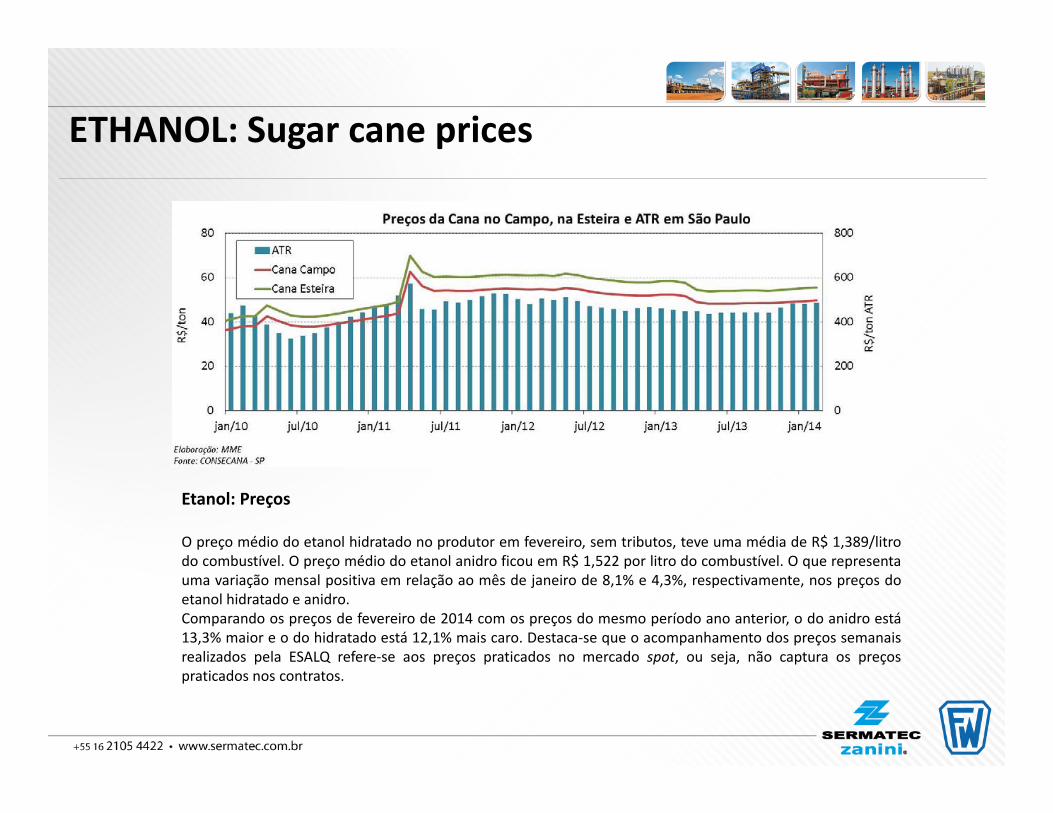
ETHANOL: Sugar cane prices
Etanol: Preços
O preço médio do etanol hidratado no produtor em fevereiro, sem tributos, teve uma média de R$ 1,389/litrodo combustível. O preço médio do etanol anidro ficou em R$ 1,522 por litro do combustível. O que representauma variação mensal positiva em relação ao mês de janeiro de 8,1% e 4,3%, respectivamente, nos preços doetanol hidratado e anidro.Comparando os preços de fevereiro de 2014 com os preços do mesmo período ano anterior, o do anidro está13,3% maior e o do hidratado está 12,1% mais caro. Destaca‐se que o acompanhamento dos preços semanaisrealizados pela ESALQ refere‐se aos preços praticados no mercado spot, ou seja, não captura os preçospraticados nos contratos.
ETHANOL: Sugar cane prices
ETHANOL: margins
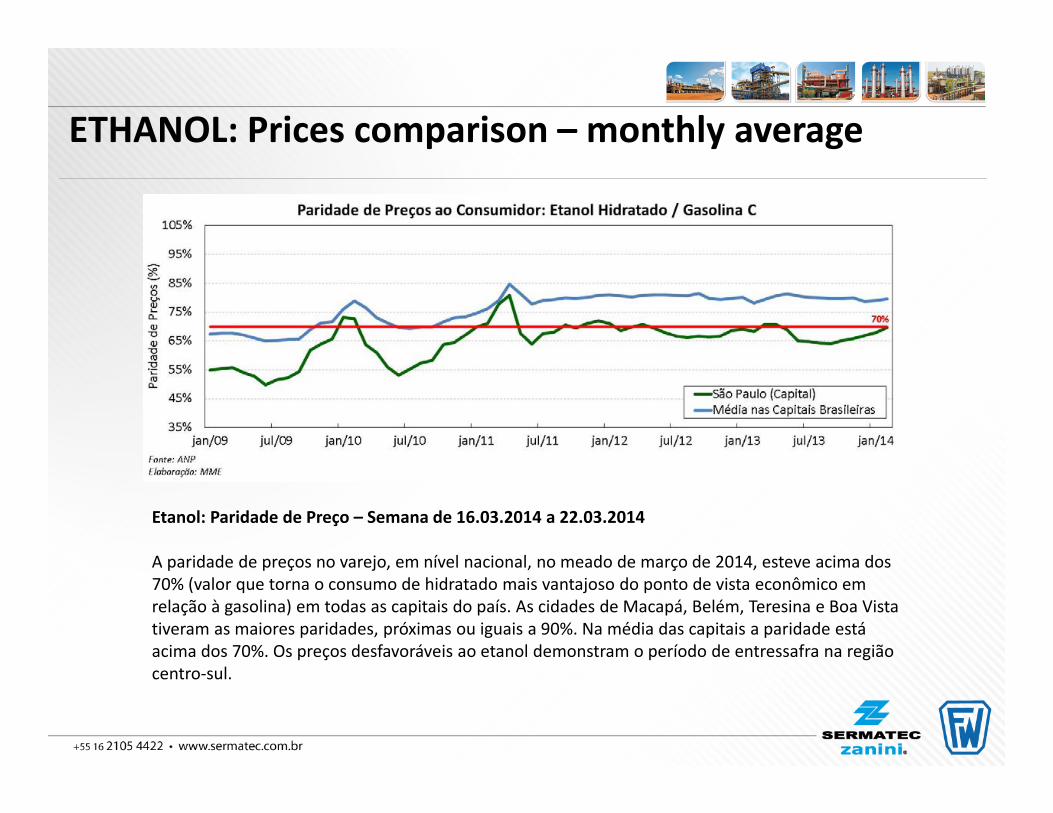
ETHANOL: Prices comparison – monthly average
Etanol: Paridade de Preço – Semana de 16.03.2014 a 22.03.2014
A paridade de preços no varejo, em nível nacional, no meado de março de 2014, esteve acima dos 70% (valor que torna o consumo de hidratado mais vantajoso do ponto de vista econômico em relação à gasolina) em todas as capitais do país. As cidades de Macapá, Belém, Teresina e Boa Vista tiveram as maiores paridades, próximas ou iguais a 90%. Na média das capitais a paridade está acima dos 70%. Os preços desfavoráveis ao etanol demonstram o período de entressafra na região centro‐sul.
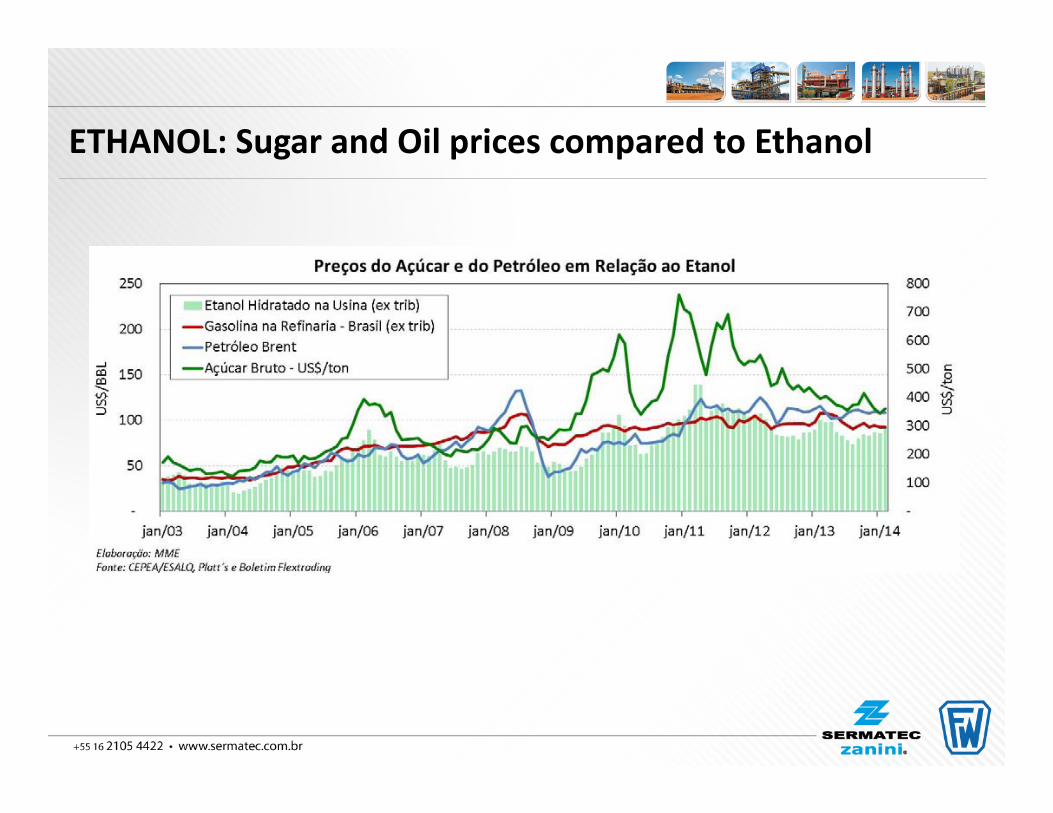
ETHANOL: Sugar and Oil prices compared to Ethanol
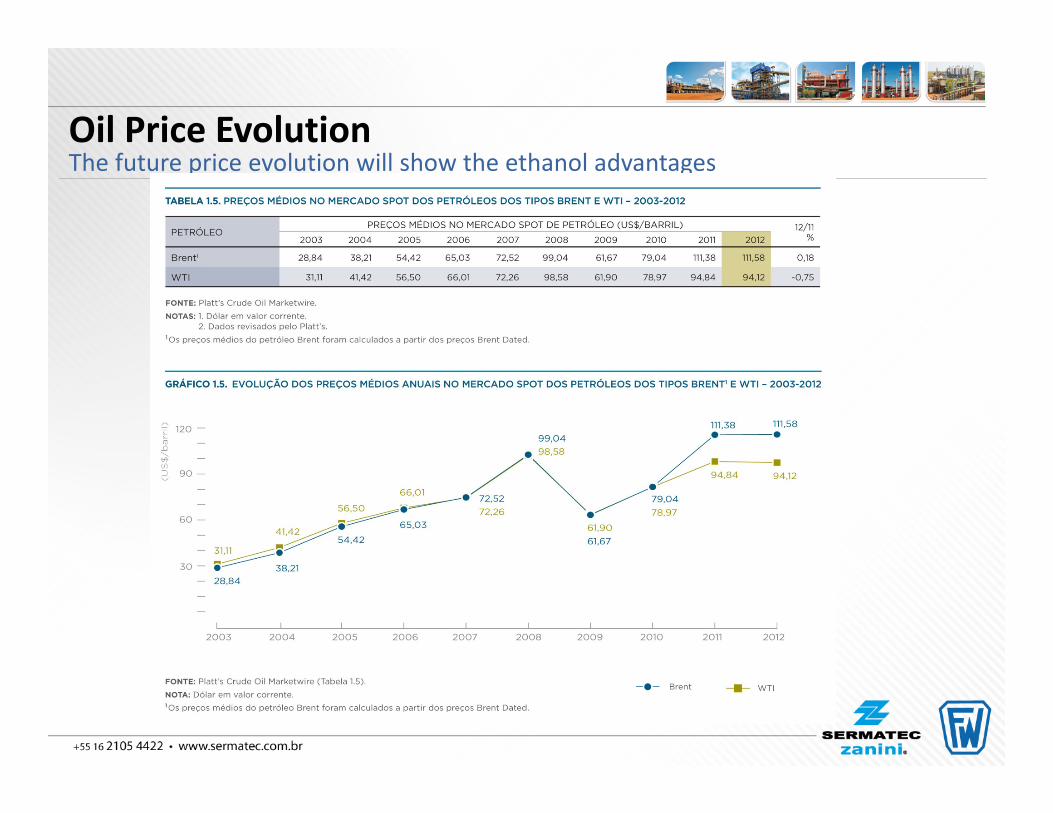
Oil Price EvolutionThe future price evolution will show the ethanol advantages
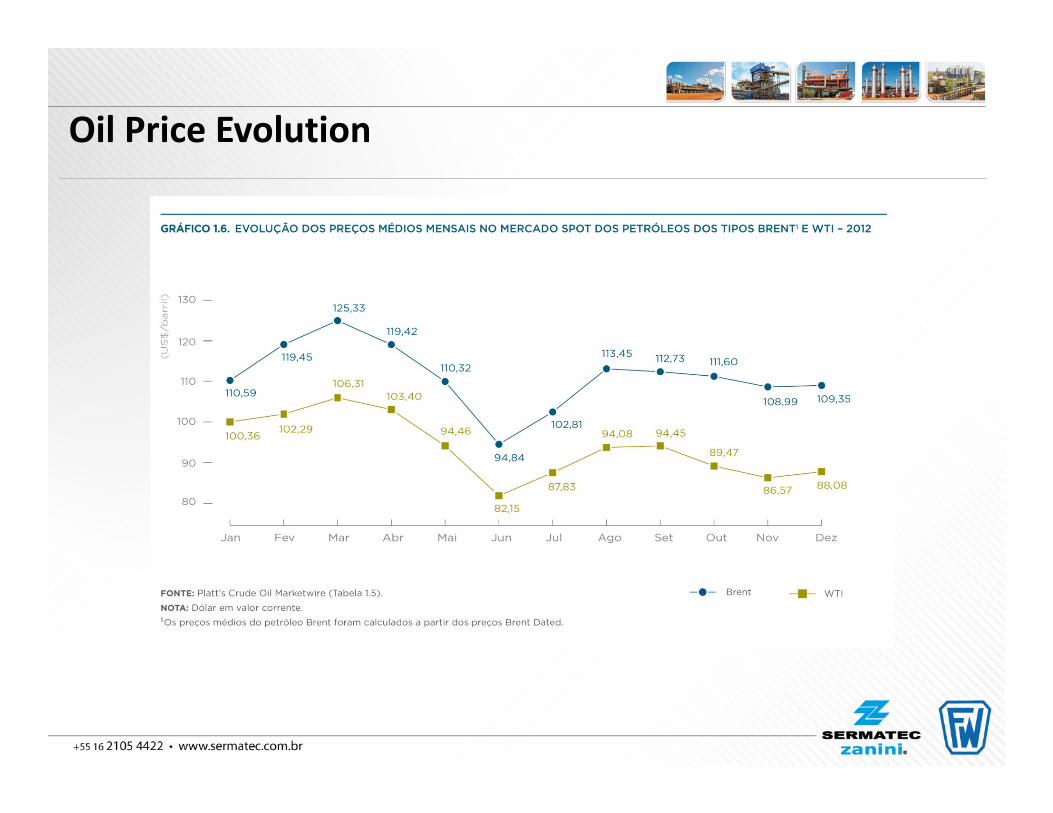
Oil Price Evolution
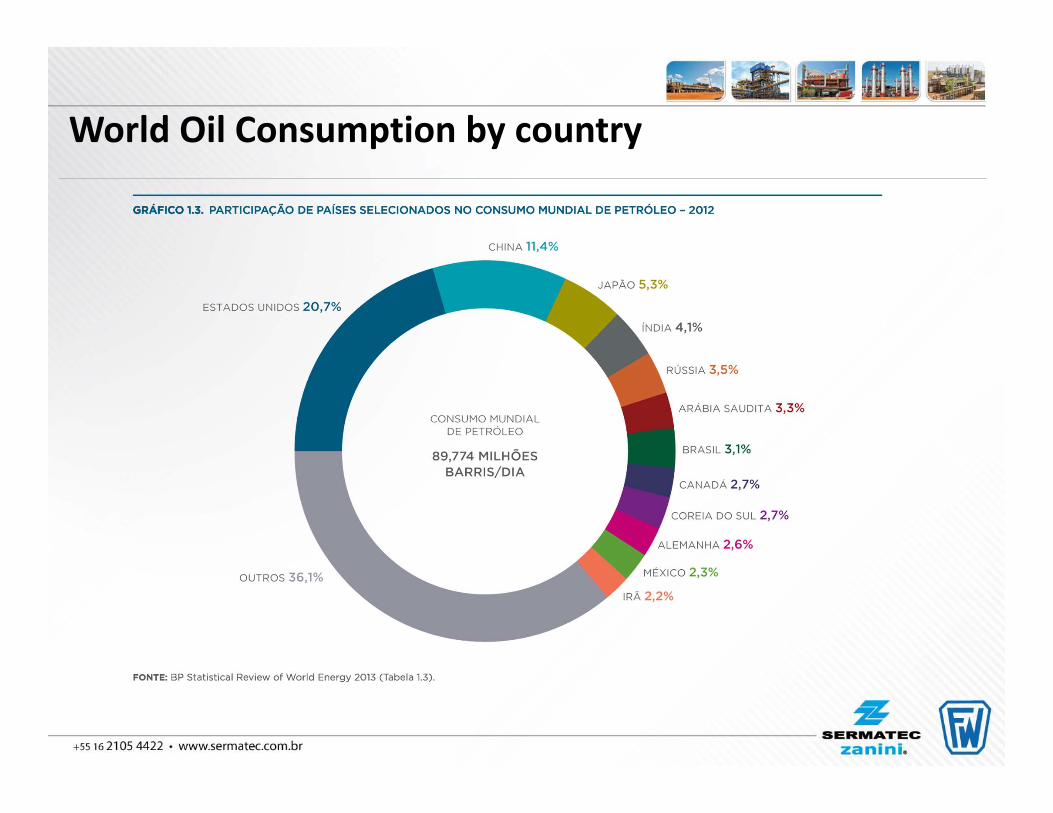
World Oil Consumption by country
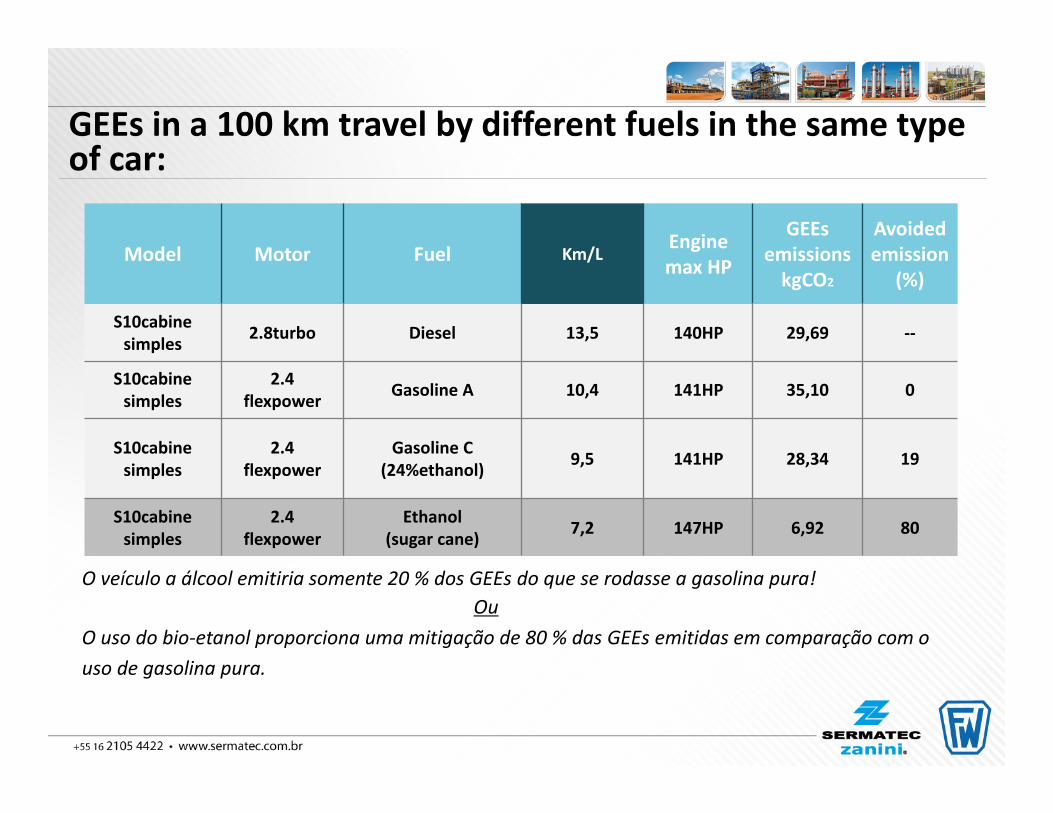
Model Motor Fuel Km/LEngine max HP
GEEsemissionskgCO2
Avoidedemission
(%)
S10cabinesimples 2.8turbo Diesel 13,5 140HP 29,69 ‐‐
S10cabinesimples
2.4flexpower Gasoline A 10,4 141HP 35,10 0
S10cabinesimples
2.4flexpower
Gasoline C(24%ethanol) 9,5 141HP 28,34 19
S10cabinesimples
2.4flexpower
Ethanol(sugar cane) 7,2 147HP 6,92 80
O veículo a álcool emitiria somente 20 % dos GEEs do que se rodasse a gasolina pura!Ou
O uso do bio‐etanol proporciona uma mitigação de 80 % das GEEs emitidas em comparação com ouso de gasolina pura.
GEEs in a 100 km travel by different fuels in the same type of car:
Ethanol will be an additive to gasoline worldwide
Biomass residue will have cost (waste also)
Algae may be the biggest source of CH
Nanotech will open new frontiers
Futurolgy
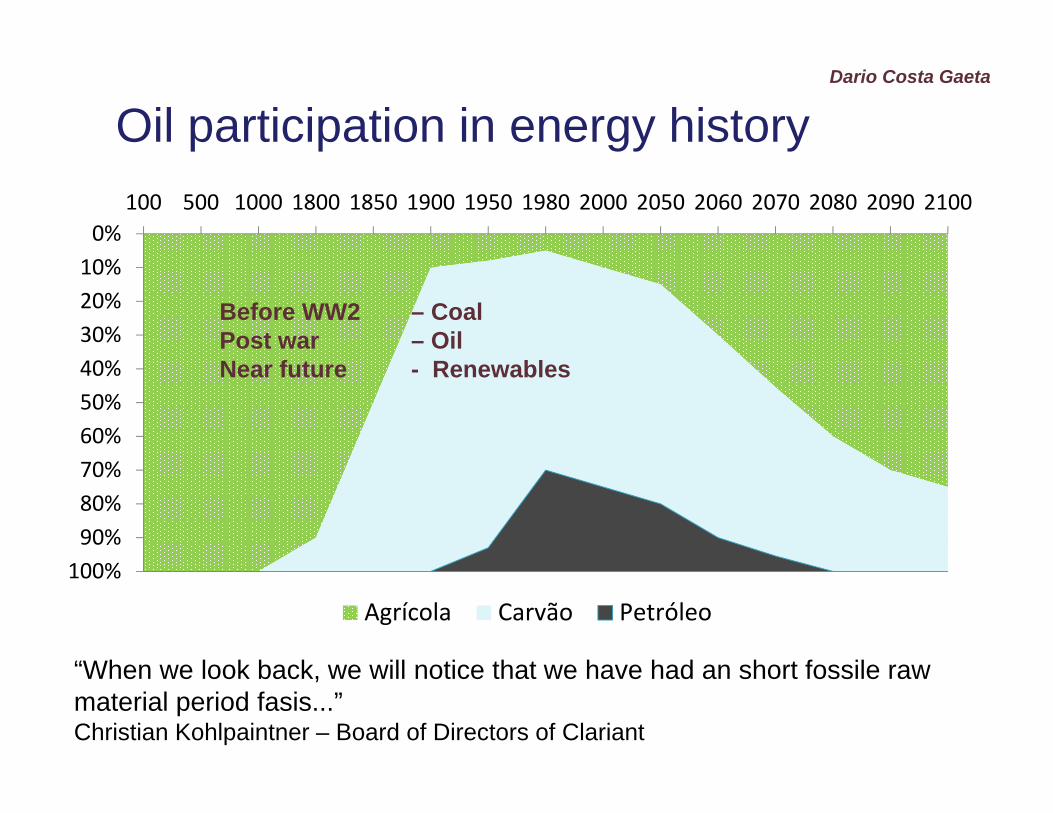
0%10%20%30%40%50%60%70%80%90%100%
100 500 1000 1800 1850 1900 1950 1980 2000 2050 2060 2070 2080 2090 2100
Agrícola Carvão Petróleo
Before WW2 – CoalPost war – OilNear future - Renewables
Dario Costa Gaeta
“When we look back, we will notice that we have had an short fossile rawmaterial period fasis...”Christian Kohlpaintner – Board of Directors of Clariant
Oil participation in energy history
Thank you!!!
Back up
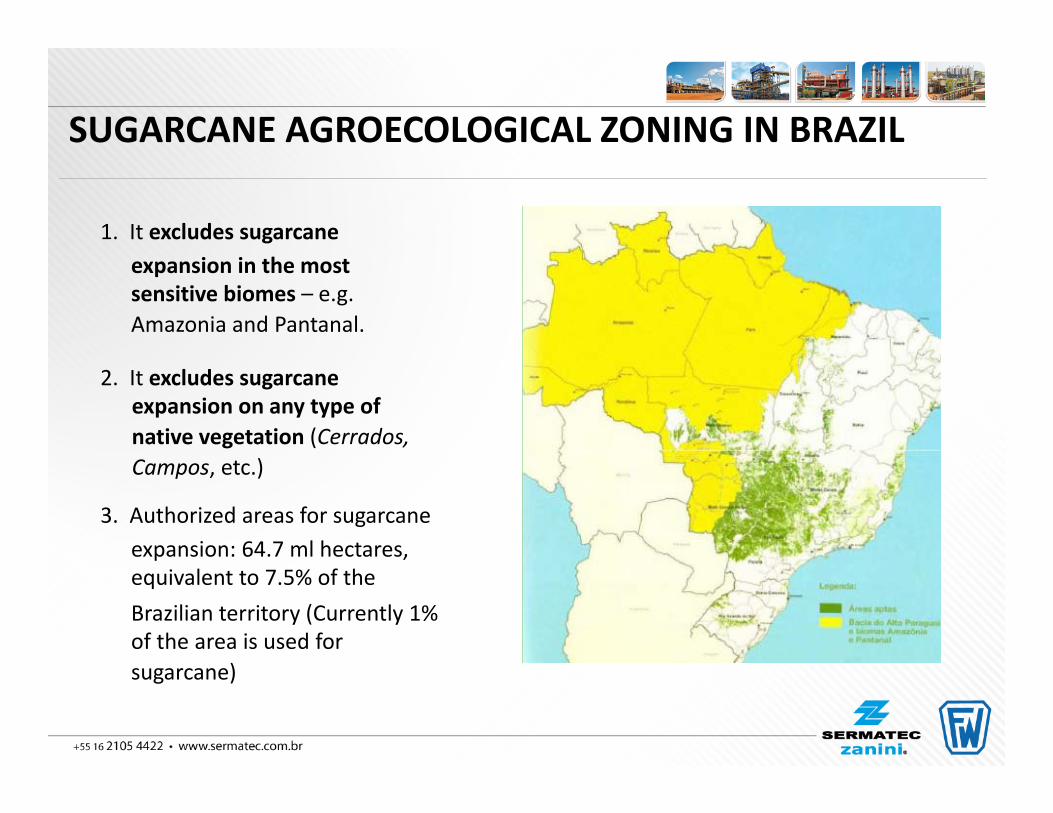
1. It excludes sugarcaneexpansion in the mostsensitive biomes – e.g.Amazonia and Pantanal.
2. It excludes sugarcaneexpansion on any type ofnative vegetation (Cerrados,Campos, etc.)
3. Authorized areas for sugarcaneexpansion: 64.7 ml hectares,equivalent to 7.5% of theBrazilian territory (Currently 1%of the area is used forsugarcane)
SUGARCANE AGROECOLOGICAL ZONING IN BRAZIL
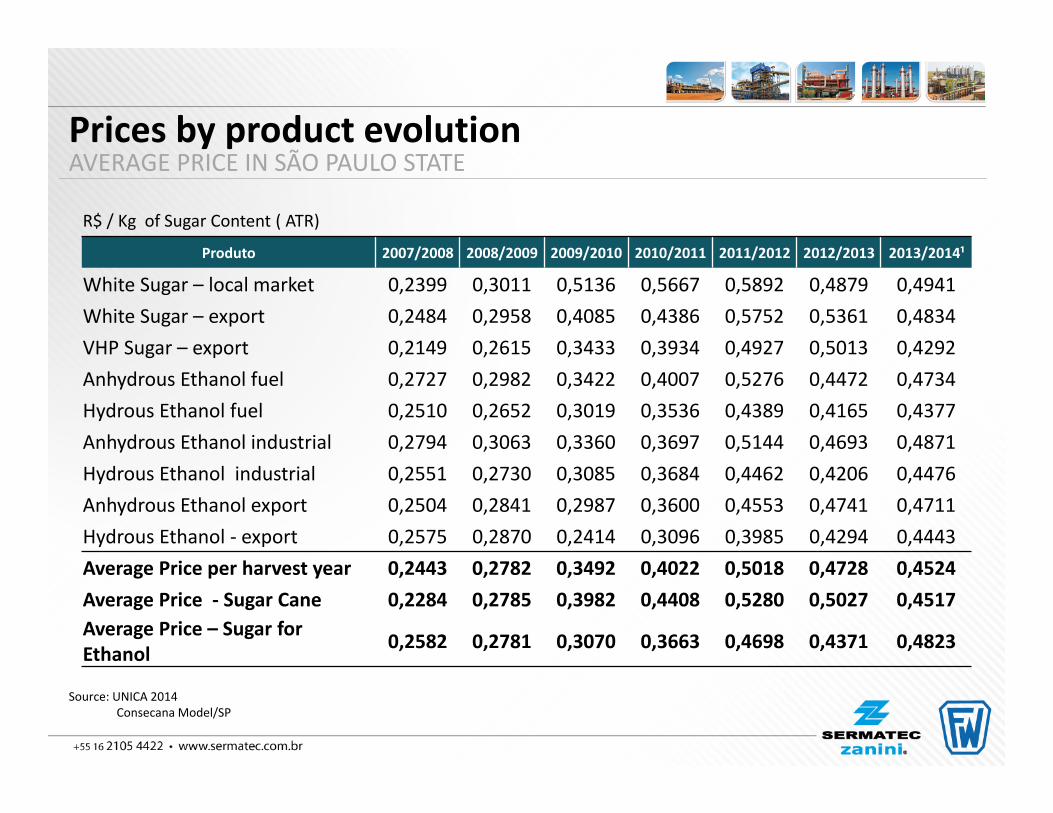
Prices by product evolutionAVERAGE PRICE IN SÃO PAULO STATE
Source: UNICA 2014Consecana Model/SP
R$ / Kg of Sugar Content ( ATR)
Produto 2007/2008 2008/2009 2009/2010 2010/2011 2011/2012 2012/2013 2013/2014¹
White Sugar – local market 0,2399 0,3011 0,5136 0,5667 0,5892 0,4879 0,4941White Sugar – export 0,2484 0,2958 0,4085 0,4386 0,5752 0,5361 0,4834VHP Sugar – export 0,2149 0,2615 0,3433 0,3934 0,4927 0,5013 0,4292Anhydrous Ethanol fuel 0,2727 0,2982 0,3422 0,4007 0,5276 0,4472 0,4734Hydrous Ethanol fuel 0,2510 0,2652 0,3019 0,3536 0,4389 0,4165 0,4377Anhydrous Ethanol industrial 0,2794 0,3063 0,3360 0,3697 0,5144 0,4693 0,4871Hydrous Ethanol industrial 0,2551 0,2730 0,3085 0,3684 0,4462 0,4206 0,4476Anhydrous Ethanol export 0,2504 0,2841 0,2987 0,3600 0,4553 0,4741 0,4711Hydrous Ethanol ‐ export 0,2575 0,2870 0,2414 0,3096 0,3985 0,4294 0,4443Average Price per harvest year 0,2443 0,2782 0,3492 0,4022 0,5018 0,4728 0,4524Average Price ‐ Sugar Cane 0,2284 0,2785 0,3982 0,4408 0,5280 0,5027 0,4517Average Price – Sugar for Ethanol 0,2582 0,2781 0,3070 0,3663 0,4698 0,4371 0,4823
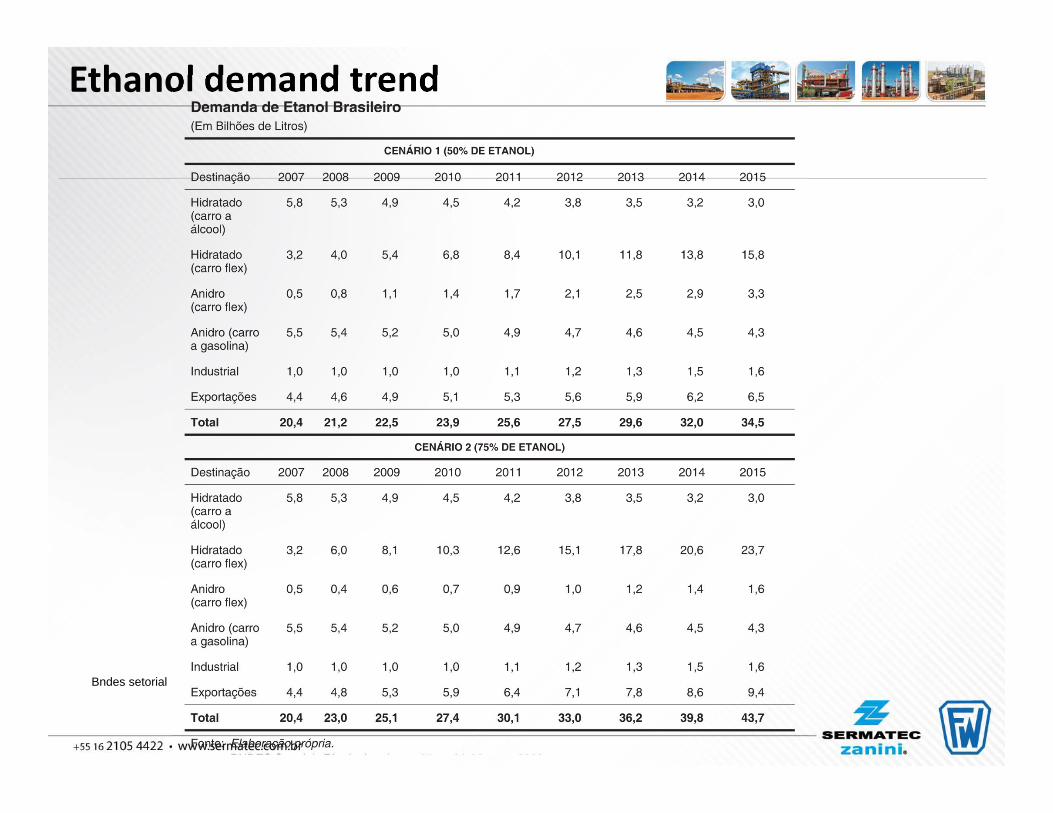
Ethanol demand trend
Bndes setorial