ethanol plant diversification - ace 2017 plant diversification - ace 2017.pdf ·...
TRANSCRIPT

Product Diversification: Proven Path Forward
American Coalition for Ethanol Annual Conference 2017
Neal Jakel – VP Strategy and Technology6105 Rockwell Drive NE, Suite CCedar Rapids, IA 52402(319) 320-‐[email protected]
Leaders in Biofuels/Biochemicals

2
Presentation Outline
© 2017 Fluid Quip Process Technologies, LLC. All rights reserved.
“As the ethanol industry continues to mature, the need for diversification is ever more important, given the limited market and market volatility of ethanol. Ethanol is still approximately 75% of the typical plant’s revenue and is held captive to external market influences as is DDGS given the commodity nature of this product. New products, new market, hence new opportunities for the ethanol industry are growing. FQPT has developed a suite of commercially proven technologies that help ethanol plants truly become biorefineries via product diversification.”
}Related Industry Lessons Learned
}Ethanol Headwinds
}Trends Moving Forward
}Diversification Pathway

3
Presentation Goal
© 2017 Fluid Quip Process Technologies, LLC. All rights reserved.
“It's often said that the definition of insanity is doing the same thing over and over and expecting a
different result”
Don’t be insane at the end of this presentation!

4
Related Industry Lessons Learned
© 2017 Fluid Quip Process Technologies, LLC. All rights reserved.

5
The Beauty of the Corn Kernel
Starch = 73.9%
Fiber = 11.3
Protein = 8.9%
Germ (Oil) = 4.4%
© 2017 Fluid Quip Process Technologies, LLC. All rights reserved.
4 simple components, endless opportunities

6
Wet Mill Process – Well Refined Since 1844
© 2017 Fluid Quip Process Technologies, LLC. All rights reserved.

7
Wet Mill Products – Then and NowThen 1980’s – 40+ wet millsØStarch (acid. & modified)ØDextrose (unrefined refined, 95 & 99)
ØFructose (42 and 55)ØCorn OilØSpent GermØGluten Feed (wet & dry)ØSteep WaterØGluten MealØCitric Acid
Now 2017 – 21 wet millsØStarch (acid., modified, many more)ØDextrose (unrefined/refined, 95 & 99, maltodextrin, cyclodextrins)
ØFructose (42 and 55)ØCorn OilØSpent GermØGluten Feed (wet & dry)ØSteep WaterØGluten MealØCitric AcidØGluten IsolateØBrewer’s Yeast
Ø150+ more
© 2017 Fluid Quip Process Technologies, LLC. All rights reserved.
Corn Wet Mill 200+ SKU’s
8
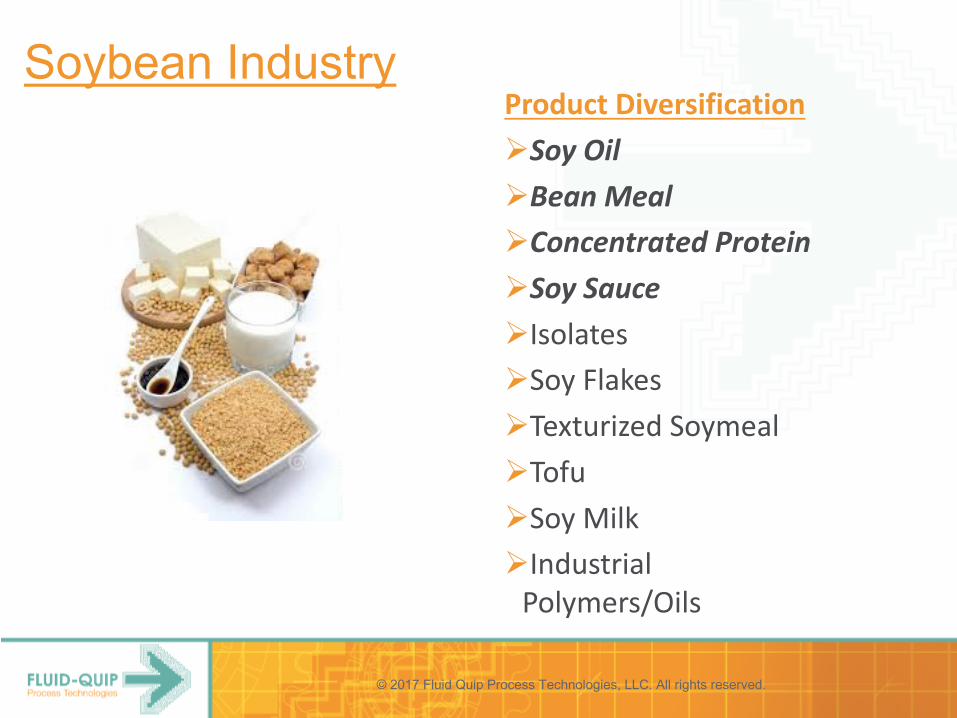
Soybean IndustryProduct DiversificationØSoy OilØBean MealØConcentrated ProteinØSoy SauceØIsolatesØSoy FlakesØTexturized SoymealØTofuØSoy MilkØIndustrial Polymers/Oils
© 2017 Fluid Quip Process Technologies, LLC. All rights reserved.

9
Dry Mill Ethanol Process – Tried and True
Corn Oil
© 2017 Fluid Quip Process Technologies, LLC. All rights reserved.

10
Dry Mill Ethanol – Then and Now
Then 1980’s
Ø EthanolØ W/D DGS
© 2017 Fluid Quip Process Technologies, LLC. All rights reserved.
Now 2017
ØEthanolØW/D DGSØCorn OilØCO2
Wet MillØCorn OilØGerm MealØGluten MealØGluten FeedØStarch
Dry MillØCorn Oil
ØDDGS
ØEthanol

11
Ethanol Headwinds
© 2017 Fluid Quip Process Technologies, LLC. All rights reserved.

12
News/HeadwindsØ “ Ethanol is heading toward obsolescence. Iowa will need a new
plan.” – Des Moines Register August 13th
Ø Electric cars, solar/wind cost to produce and portable power sources
Ø EPA/RFA – 2022?Ø Political forcesØ Global export reliance
Ø >1B gallons exported (7% of US production)
Ø US ethanol plant expansions (organic and greenfield) – 400+ MG in 2017/18 and more coming – efficient producer hurdles
Ø Brazil – sugar cane pricing/corn alternative season
© 2017 Fluid Quip Process Technologies, LLC. All rights reserved.

13
Brazil – Sugar Cane Pricing
© 2017 Fluid Quip Process Technologies, LLC. All rights reserved.

14
Trends Moving Forward
© 2017 Fluid Quip Process Technologies, LLC. All rights reserved.

15
Market Demand – Population Growth
© 2017 Fluid Quip Process Technologies, LLC. All rights reserved.

16
Meat Protein Forecast to Continue
© 2017 Fluid Quip Process Technologies, LLC. All rights reserved.

17
First Generation Proteins Ø Grains; Animal proteinsØ Commercially available in direct competition with food
Second Generation ProteinsØ Not based on arable land and irrigationØ Based on insects and microbesØ Technical difficulties and regulatory challenges
Third Generation ProteinsØ Recovering nutrients from waste – circular economyØ Aqua feed nutrients from waste water; agricultural
waste waterØ Major technical and regulatory issues
World Protein Production Must Increase by 50% by 2040Animal feed is in competition with human food
© 2017 Fluid Quip Process Technologies, LLC. All rights reserved.
18
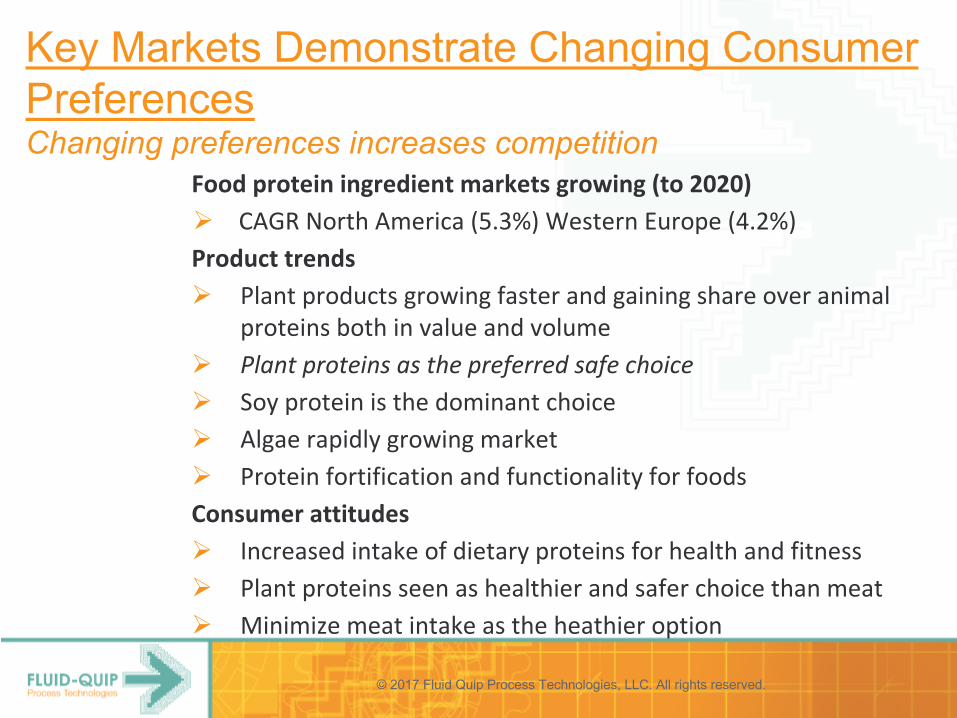
Food protein ingredient markets growing (to 2020)Ø CAGR North America (5.3%) Western Europe (4.2%)Product trendsØ Plant products growing faster and gaining share over animal
proteins both in value and volumeØ Plant proteins as the preferred safe choiceØ Soy protein is the dominant choiceØ Algae rapidly growing marketØ Protein fortification and functionality for foodsConsumer attitudesØ Increased intake of dietary proteins for health and fitnessØ Plant proteins seen as healthier and safer choice than meatØ Minimize meat intake as the heathier option
Key Markets Demonstrate Changing Consumer PreferencesChanging preferences increases competition
© 2017 Fluid Quip Process Technologies, LLC. All rights reserved.

19
Soy is the fastest expanding crop in the world.Mainly used in feed for animals in meat and dairy
Amazon deforestation unsustainable. Need for balanced approach cereals/oilseeds and protein crops to solve the protein deficit – EU and China major importers of protein.
BUT -‐ Growth at great environmental and social cost. Companies ranked on commitment to Responsible Soy
Sustainability and Safety Concerns Add Pressure to Identifying Alternative Proteins
Continued ban on the use of rendered products (EU – moving to the US)
Until a suitable validation method available from accredited Reference Laboratory to identify MBM from pigs and poultry
Round Table on Responsible Soy (RTRS )
© 2017 Fluid Quip Process Technologies, LLC. All rights reserved.

20
Trends which will have major impact on the feed additives industry moving forwardØ Fundamentals remain the same:
- increasing global meat consumption, - industrialization of meat products, and - growing awareness of quality of dairy and meat products consumed- growth in aquaculture.
Ø The main issue now is the transition of the global feed additive sector to the post-antibiotic era, which is now no longer a matter of "if" but "when".
Development of replacement strategies
© 2017 Fluid Quip Process Technologies, LLC. All rights reserved.

21
“Renewable Chemical Market worth $49B Today, Growing to $84B Over Next 5 Years”
Source: Markets and Markets, 2016Footnote: $49B includes Bio-Ethanol
$35B Growth in 5 Years
Biochemicals Via Sugars From…
© 2017 Fluid Quip Process Technologies, LLC. All rights reserved.

22
Change
© 2017 Fluid Quip Process Technologies, LLC. All rights reserved.
ChangeChangeChangeChange

23
Diversification Pathway
© 2017 Fluid Quip Process Technologies, LLC. All rights reserved.

24
Red Sea vs Blue Sea
© 2017 Fluid Quip Process Technologies, LLC. All rights reserved.

25
Red Sea vs Blue Sea
© 2017 Fluid Quip Process Technologies, LLC. All rights reserved.
Doing what you know versus doing what you should
Red Sea of Competition
Blue Sea of Competition
Circus Circus OleTaxi UberVideos NetFlixDry Grind Bio Complex

26
Nebraska News
Koch Industries' energy arm to invest $50 million in Nebraska ethanol plant
$50M investment in Nebraska ethanol plant could be wave of the futureBy: Brent MartinJanuary 20, 2017
Maximized Stillage Co-Products™
© 2017 Fluid Quip Process Technologies, LLC. All rights reserved.

27
What is Maximized Stillage Co-Products™Ø Specialty protein derived from the bioethanol processØ Post distillation protein separation technologyØ Separates whole stillage into a protein (corn and yeast)
rich stream, a traditional DDGS stream and corn oilØ In commercial operations for 7+ year, 3 systems
operating, 2 more in construction/engineering
© 2017 Fluid Quip Process Technologies, LLC. All rights reserved.

28
How Did FQPT Get to This Point?
© 2017 Fluid Quip Process Technologies, LLC. All rights reserved.
Risk Reduction Across the Business PlatformTechnical does the system work, proven commercially, how many
are operating (touch & feel), reliability, consistency, etc..Financial project cost locked in, variables, loan/debt financing,
bank buy in, project top $$ risks -‐ how to mitigateRegulatory permitting, RFS, efficient producer impactsMarketing product proven value, testing completed, supply and
demand, competing productsOther Competing technologies – identifying and tracking

29
Technical Overview
Ø 3 plants operating, 7+ years of operational knowhow
Ø Plant’s number 4 & 5 in design/construction phase
Ø 3x increase in annual Still Pro 50™ production in 2016
Ø Capacity doubling again to 500+ tons/day in 2018
Still Pro 50TM Proven Technology
Paddle Screens Cake
Filtration Decanters
Whole Stillage
Fiber Cake
Fiber
Decanters
Rotary Dryers
Syrup
DDGS
Clarified Stillage
Fine FiberPressure
Screens
Clarifiers
Evaps
Ring Dryer Still Pro 50™
Protein Decanter
BacksetProtein Cake
Corn OilCentrate
© 2017 Fluid Quip Process Technologies, LLC. All rights reserved.

30
MSC™ Ethanol Plant Process BenefitsØ Clarified thin stillage, yields higher (50%+) syrup solidsØ Lower CIP and hydroblasting cyclesØ Drives ability to yield > 1.0 pounds/bushel of corn oilØ Reduces existing DDGS dryer loading by 40+%, adds capacity to grind more corn =
more ethanolØ Plant capacity gain of 5+%, due to improved fermentation viability, lower solids in
backset and debottleneck backendØ High titer fermenters drives distillation performance improvementsØ Ability to produce separated fiber stream for future cellulosic conversionØ NO additional water is added to the system
© 2017 Fluid Quip Process Technologies, LLC. All rights reserved.

31
MSC™ Financial Evaluation
© 2017 Fluid Quip Process Technologies, LLC. All rights reserved.

32
Financial Economics of the Technology
Ø 14% of Plant Revenue Completely Hedgeable – Tied to SBM/CGM
Ø Lowers Dependence on Ethanol and DDGS Revenues
© 2017 Fluid Quip Process Technologies, LLC. All rights reserved.

33
Financial Sensitivity – Tornado Chart
Base Case NPV = $94M $0.14 – 19/gal EBITDA
$39M SP50 Price $140M
$50M SP50 Yield $129M
$79M Corn Oil Yield $117M
$67M DDGS Value to Corn $113M
$87M Corn Oil $98M
© 2017 Fluid Quip Process Technologies, LLC. All rights reserved.

34
Regulatory Impact PotentialProduct Knowledge Still Pro 50™ØNOT Hi-‐Pro DDGS: AAFCO – “Grains Distillers Dried Yeast”ØAlternative AAFCO name needed?ØCarbon intensity impact potentialØEPA long form – additional co-‐product creditØHSN importing codes
MSC™ DDGSØ34% pro/fat – meets export specØImproved Color and OdorØImproved DigestibilityØTruly Differentiated from Corn/DDGS/Hi Pro DDGS Pricing
© 2017 Fluid Quip Process Technologies, LLC. All rights reserved.

35
MSC™ Marking Value, Iterative Process
Feeding Trials
Customer Discussions
Customer Feeding Trials
Pricing Validation
Technology Development
& Enhancement
Ø R&D and feeding trial investments drive deeper understanding of true product ($ value) potential
Ø Expanding customer usage baseØ Leading University Prof supporting
product and research activitiesØ Securing top marketing firms to
lead Still Pro 50™ marketing effortØ Engaged leading
marketing/branding companyØ Pricing guarantees key to successØ Floor price established, moving
higher as learnings progress
© 2017 Fluid Quip Process Technologies, LLC. All rights reserved.

36
What is the Protein Product Composition
Constituent (as fed)
Still Pro 50™
SoybeanMeal
Corn Gluten Meal
Dry Matter (%) 93 89 90
Protein (%) 52 48 63
Fat (%) 3 1 2
Crude Fiber(%) 5 33 5
Ash (%) 5 4 4
Starch (%) 4 3 17
Total Digestible AA (%)
91 88 93
LysineØ -‐ 30% Ileal digestible lysine compared with SBM
Ø+ 95% Ileal digestible lysine compared with CGM
Methionine and CysteineØ+ 8% Ileal digestible M+C compared with SBM
Ø -‐ 28% Ileal digestible M+C compared with CGM
Total Energy ContentØ + 25% compared to SBMØ -‐ 14% compared to CGM
© 2017 Fluid Quip Process Technologies, LLC. All rights reserved.

37
Species and Market OpportunitiesProduct Options
ØPet Food
ØAqua
ØPoultry
ØSwine
ØDairy
ØBeef
value
© 2017 Fluid Quip Process Technologies, LLC. All rights reserved.

38
Ø Musca Domestica larvaeØ Protein (%) 45-‐60Ø Fat (%) 20-‐35
Ø Current legislation a barrierØ Chemical safetyØ Microbiological SafetyØ Potential allergens
Ø Supply difficultiesØ Consumer attitudes
Demand for Alternative ProteinsClutching at straws
© 2017 Fluid Quip Process Technologies, LLC. All rights reserved.

39
Volume (MTons)
Proportion of cpd feed
Inclusion rate (%)
Volume Still Pro 50™ (T/yr)
19 0.1 5 95,000
21 0.1 5 105,00055 0.2 12.5 1,375,00024 0.2 12.5 600,000
0.3 0.5 30 45,000
11 0.4 12.5 550,0009 0.2 15 270,000
US Target Market Volume > 3M tons/yrCurrent Production ~150K tons/yr, Endless Opportunity
At the current minimal inclusion rate of Still Pro 50™, the US market would only be ~80% covered with a 100% penetration rate into the US Ethanol market.
© 2017 Fluid Quip Process Technologies, LLC. All rights reserved.
40
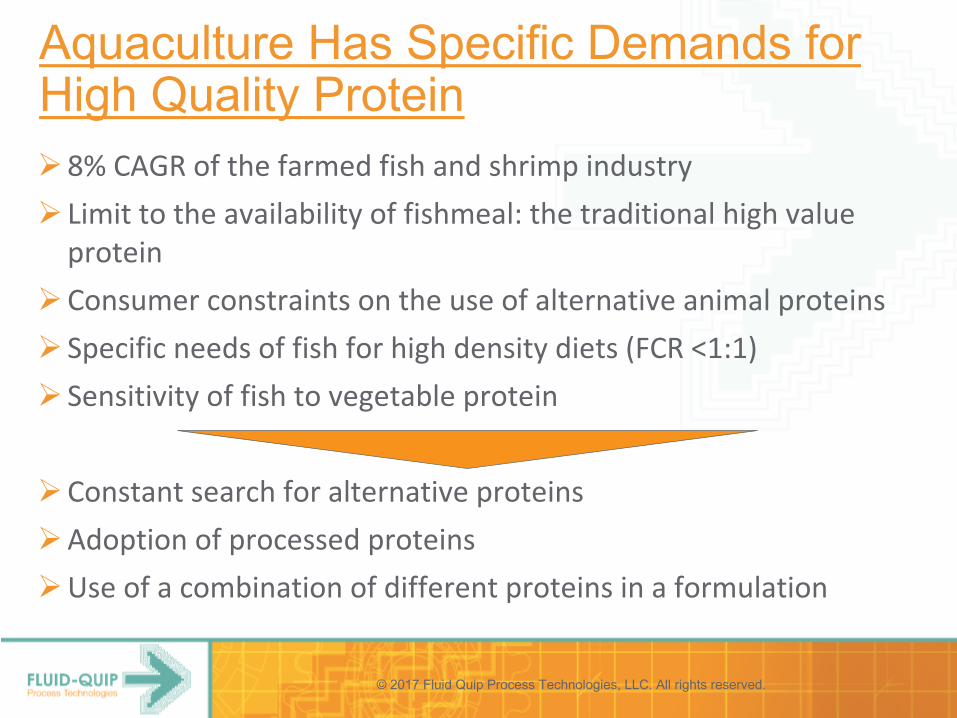
Aquaculture Has Specific Demands for High Quality ProteinØ8% CAGR of the farmed fish and shrimp industryØ Limit to the availability of fishmeal: the traditional high value protein
ØConsumer constraints on the use of alternative animal proteinsØ Specific needs of fish for high density diets (FCR <1:1)Ø Sensitivity of fish to vegetable protein
ØConstant search for alternative proteinsØAdoption of processed proteinsØUse of a combination of different proteins in a formulation
© 2017 Fluid Quip Process Technologies, LLC. All rights reserved.

41
A significant market need for alternative proteins due to stagnant supply of fishmeal
13.1
61.3
78.5
0
10
20
30
40
50
60
70
80
90
90 95 '00 '05 10 '15 '20
Global aquaculture production(MTons)
8%
2.5%
At current inclusion rates of Fishmeal, given forecasted production, a market gap of ~2 M tons is expected (~4 B USD market value given current prices)
6.4 6.5 6.8
012345678910
'90 '95 '00 '05 '10 '15 '21
0.1% 0.4%
8.7
Global Fishmeal production(MTons)
Global Fishmeal production is stagnant, yet fish demand growing at 6 – 8% per
year
Global farm raised fish demand growing at a significant rate – lacking fishmeal in
rations
© 2017 Fluid Quip Process Technologies, LLC. All rights reserved.

42
Increased demand; 2000-‐2014Ø Fishmeal price
tripledØ Soybean price
about doubled
Not All Proteins are Created Equal
© 2017 Fluid Quip Process Technologies, LLC. All rights reserved.

43
Increase in fishmeal prices will impact growth in value of the marketEU Fishmeal Consumption, 1990-2021
Growing demand drives Fishmeal price
651 709
433
1,688
2,361
0
500
1,000
1,500
2,000
2,500
90 95 '00 '05 10 '15 21
World prices of Fishmeal(USD/T)
5%
3.4%
Value of global Fishmeal market predicted to grow at 5.4% CAGR1
2012 2021
5.4%
Global fishmeal market, Value(billion USD)
$10B
$16B
$19B
7.4%
Growth due to price increase
Additional demand
2012 2021Volume 6,262 kT 6,826 kTPrice $1,600 $2,360
Source: OECD-FAO Agricultural Outlook 20121. Projection is based on following assumptions:
© 2017 Fluid Quip Process Technologies, LLC. All rights reserved.

44
Product Value Discovery
© 2017 Fluid Quip Process Technologies, LLC. All rights reserved.

45
Comprehensive Portfolio of Trials Demonstrates EfficacyTrial Title Centre and trials leader Results
Analytical data FQPT/labs 50+% proteinIleal digestibility of Still Pro 50 and DDGS Univ of Illinois: Prof C. Parsons 89% ileal protein digestibilityEffect of Still Pro 50 on broiler performance Colorado Quality Research CQR 5% inclusion of SP50Effect of Still Pro 50 on broiler performance Colorado Quality Research CQR 5% inclusion of SP50Digestibility of Still Pro 50 in swine Univ of Illinois: Prof H. Stein Standardised ID of aa 77.1%Replacement of FM with Still Pro 50 for young swine Univ of Illinois: Prof H. Stein Partial replacement of FMReplacement of SPC with Still Pro 50 in trout University of Idaho: Prof R. Hardy Replacement of soya isolateStill Pro 50 as a protein for shrimp and tilapia Univ of Auburn: Prof A Davis 15% inclusion of SP50Still Pro 50 as RPAA Cumberland labs 74% RUPComparison of Still Pro 50 with commercial RPAA Univ of Nottingham:
Dr J. Margerison Equivalent to market leader
Measurement of yeast content in Still Pro 50 Englyst Carbohydrates: Dr K. Englyst 24% yeast in DM
Available lysine in Still Pro 50 (Carpenter Lysine) Sciantec: Prof P. Williams Average available lysine 98%
12 trials show Still Pro 50 commands a premium over SBM approaching CGM
© 2017 Fluid Quip Process Technologies, LLC. All rights reserved.

46
170
180
190
200
210
220
230
Wt gain
Feed int
Wt gain
Feed int
Wt gain
Feed int
Wt gain
Feed int
Wt gain
Feed int
0 6 12 18 24
16 12 8 4 0
Control 25% SP50 50% SP50 75%SP50 100%SP50
Growth and feed intake of juvenile rainbow trout
A Supremely Versatile Protein Supplement
Replacement of SPC with SP50
Ø No difference in weight gain (NS)
Ø No difference in SGR (NS)
Ø Tendency to increase FI with SP50
Ø 18% SP50 inclusion optimum
SPC%
SP50%
© 2017 Fluid Quip Process Technologies, LLC. All rights reserved.

47
0
0.5
1
1.5
2
2.5
3
Hipro SBM DDGS RPaa Rape RPaa SBM SP501 SP502
Residual ruminal aa
Comparison of SP50 with RPAA
Ø Approx 10% more essential RPAA than market leader
Ø 89% post ruminal aa digestibility
LysineM+CTotal
% RPaa
A Supremely Versatile Protein Supplement
© 2017 Fluid Quip Process Technologies, LLC. All rights reserved.

48
Specialty Proteins Support Particular MarketsProtein content of specific proteins
Product crude protein content (%)
Product positioning
Volac
ICC
AgriProtein
PepSoyGen
Young animal (piglet, chick)
Pig & PoultryRuminant Aqua Pet
Hamlet Protein
Denkavit
SoyPass
Low High
European Protein
AlphaSoy (AgroKorn)
Price positioning
20-25%
32%
36%
N/A
41%
48%
50%
54%
55%
60%
61%
64%
68%
69%
Denkavit, Volac
DDGS
Rapeseed meal
European Pro
ICC yeast
Soybean meal
StillPro50
PepSoyGen
Hamlet
Larvae
CanPro
Gluten meal
AlphaSoy
Fishmeal
RPAA
Still Pro 50
© 2017 Fluid Quip Process Technologies, LLC. All rights reserved.

49
0
100
200
300
400
500
600
700
800
900
Sep-‐11 Apr-‐12 Oct-‐12 May-‐13 Nov-‐13 Jun-‐14 Dec-‐14 Jul-‐15 Jan-‐16 Aug-‐16 Mar-‐17
$/To
n
Month/Yr
Protein Product Pricing
Corn Gluten Meal
Still Pro 50
SBM
DDGS
Corn Gluten Feed
Corn
© 2017 Fluid Quip Process Technologies, LLC. All rights reserved.

50
Value Added Proteins Attract Significant Price Premiums Over Commodity Feed Ingredients
Commodities are priced according to protein concentration. Value Added commercial products command a premium;
Ø Bacterial control, increase in protein digestibility, probiotic effect
Ø Yeast effects (palatability, nucleotides, mannans, glucans, Vitamin B etc.)
Ø Eliminated anti-‐nutritional factors of soybean, high palatability and high digestibility
Ø Soluble antinutritional factors washed away, zero phytate
Protein supplement prices correlated with protein concentration and added value
Added value components of Still Pro 50™ attract a premium
Indicate a $300 premium above SBM
Canola meal 375DDGS
220
Canolameal250
SBM390
NGM SBM480
Corn gluten,800
PMM,800
Potato,1,400
R² = 0.98063
0
200
400
600
800
1000
1200
1400
1600
1800
25 45 65 85
Value added products
Value GBP/T, UK market
Commodity price line
Commodities
Fishmeal 1320
ICC yeast950
Hamlet Pro. 720
CanPro900
European Protein
305
Soycomil,1200
0
200
400
600
800
1000
1200
1400
1600
1800
25 45 65 85
DDGS330
Canolameal375
SBM600
NGM SBM720
Corn gluten,1200
PMM,1200
Potato,2,100
R² = 0.98063
0
200
400
600
800
1000
1200
1400
1600
1800
25 45 65 85
Value added products
Value $/T, 2016
Commodity price line
Commodities
+$300 premium
2700
2400
2100
1800
1500
1200
300
600
900
0
Protein Concentration (%)
DDGS130
© 2017 Fluid Quip Process Technologies, LLC. All rights reserved.
51
Competing Products
© 2017 Fluid Quip Process Technologies, LLC. All rights reserved.

52
Ø Musca Domestica larvaeØ Protein (%) 45-60Ø Fat (%) 20-35
Ø Current legislation a barrierØ Chemical safetyØ Microbiological SafetyØ Potential allergens
Ø Supply difficultiesØ Consumer attitudes
Insect ProteinArgued that insects have a large potential to become an important ingredient as animal feed
© 2017 Fluid Quip Process Technologies, LLC. All rights reserved.
53
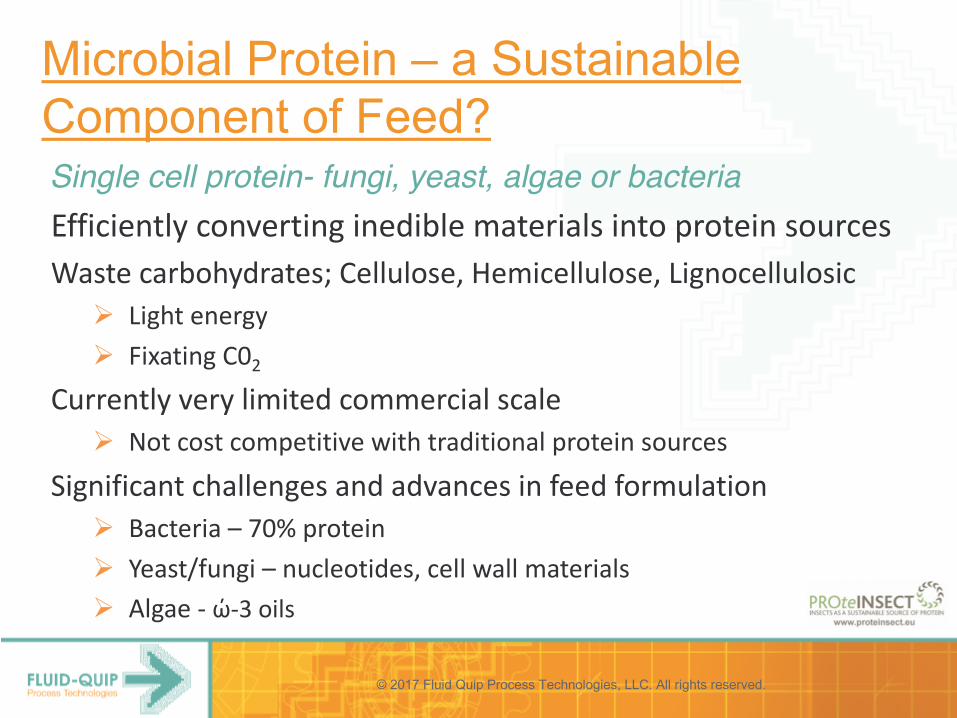
Efficiently converting inedible materials into protein sourcesWaste carbohydrates; Cellulose, Hemicellulose, Lignocellulosic
Ø Light energyØ Fixating C02
Currently very limited commercial scaleØ Not cost competitive with traditional protein sources
Significant challenges and advances in feed formulationØ Bacteria – 70% proteinØ Yeast/fungi – nucleotides, cell wall materialsØ Algae -‐ ώ-‐3 oils
Microbial Protein – a Sustainable Component of Feed? Single cell protein- fungi, yeast, algae or bacteria
© 2017 Fluid Quip Process Technologies, LLC. All rights reserved.

54
The Bottom Line Value Drivers of Still Pro 50™
ØWorld-‐wide a shortage of high quality protein for animals• SP50 high density, benign, high quality AA, low fiber content
Ø Ethanol co-‐product DDGS/protein is significantly undervalued
Ø Still Pro 50TM is a versatile high value protein• Applications in a wide variety of species• A significant world-‐wide market opportunity
ØMultiple production units make Still Pro 50TM a viable and consistent alternative feed protein
© 2017 Fluid Quip Process Technologies, LLC. All rights reserved.

55
A Tried and Tested Bolt-on / Differentiated Technology
Ø Significant improvement in plant efficiency• Oil extraction > 1lb/bu• 10% increased ethanol yield• Energy neutral
Ø 3 plants in operation, 2 in construction and engineeringØ < 3 year pay backØ Substantial financial returnsØ An exclusive marketing contract
• Technology sound marketing to support product value
Differentiated non-commodity high value specialty protein
© 2017 Fluid Quip Process Technologies, LLC. All rights reserved.
Changing the Sugar Paradigm
© 2017 Fluid Quip Process Technologies, LLC. All rights reserved.

57
“Renewable Chemical Market worth $49B Today, Growing to $84.3B Over Next 5 Years”
Source: Markets and Markets, 2016Footnote: $49B includes BioEthanol

58
Biochemicals via Sugars …
© 2017 Fluid Quip Process Technologies, LLC. All rights reserved.

59
Who is Participating
All contents are to be considered confidential and proprietary work product of FQPT© 2016 Fluid Quip Process Technologies, LLC. All rights reserved.
DuPont Industrial Biosciences and ADM Announce Breakthrough Platform Technology for Long Sought-‐After Molecule (2016)
Cargill acquires OPX Biotechnologies’ fermentation technology (2015)Minneapolis, Boulder, Colo. -‐ April 28, 2015 – Cargill has acquired Colorado-‐based OPX Biotechnologies’ proprietary fermentation-‐based processes and systems. These technologies are used to produce bio-‐based chemicals from sugars for use in non-‐food applications such as lubricants, detergents, plastics, agrichemicals and personal care products.
Rivertop Renewables raises $26 million from Cargill, others (2014)
VIRENT SECURES $46 MILLION IN FUNDING TO ACCELERATE BIOFUELS SCALE-‐UP (2010)Royal Dutch Shell leads investment round, with strong participation from Cargill and other existing shareholders.
DuPont Tate & Lyle – an energy-‐saving partnership (2004)Corn is a completely ‘renewable’ resource. Turning it into products previously made from petro-‐chemicals can be good for the environment – and for business.
60
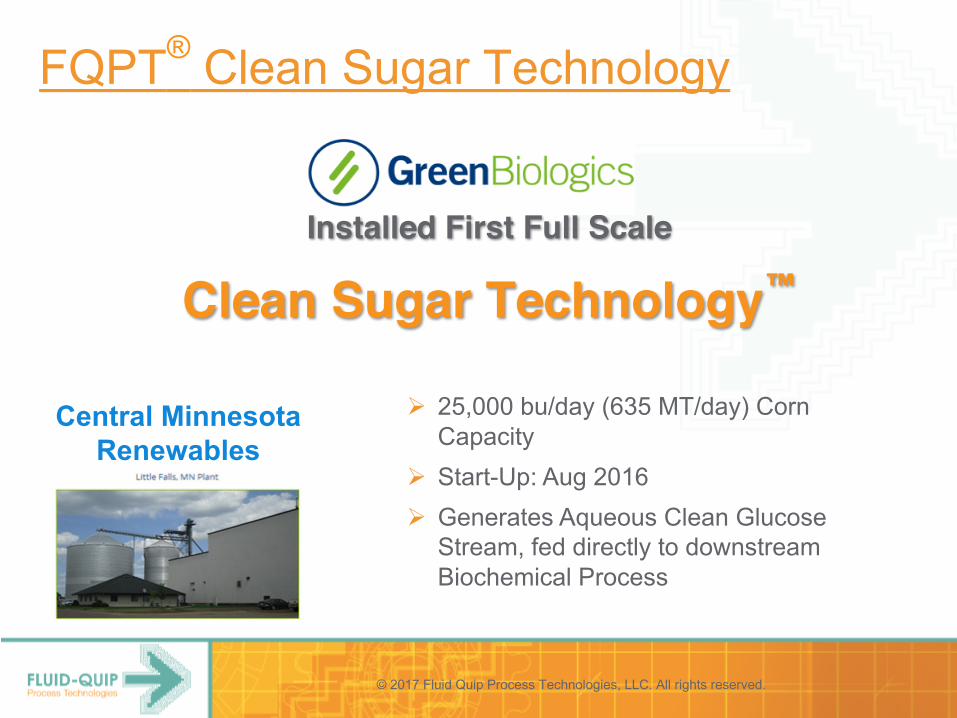
FQPT® Clean Sugar Technology
Installed First Full Scale
Clean Sugar Technology™
Central Minnesota Renewables
Ø 25,000 bu/day (635 MT/day) Corn Capacity
Ø Start-Up: Aug 2016Ø Generates Aqueous Clean Glucose Stream, fed directly to downstream Biochemical Process
© 2017 Fluid Quip Process Technologies, LLC. All rights reserved.

61
FQPT’s Clean Sugar Technology™Wet Mill = Expensive Dry Mill = Purity Limitation
CST™ = The Solution
Multi-Stage Wash System
Corn Oil
Clean Sugar
Fiber/Protein Separations
Corn Fiber
Corn Gluten Protein
Milling
“DDGS”Oil Separation
ClarificationBiochemical conversion process
Starch Conversion
Corn
Clean Sugar Technology™Patent Pending - 20170022529
Option 1
Option 2
© 2017 Fluid Quip Process Technologies, LLC. All rights reserved.
Lab Scale then Pilot Scale

62
Ethanol Produces the Lowest Cost CarbohydrateFQPT® sugar price is 20%+ lower than traditional corn wet mill cost
$0.1702
$0.1258 $0.1340
$-
$0.0200
$0.0400
$0.0600
$0.0800
$0.1000
$0.1200
$0.1400
$0.1600
$0.1800
Corn Wet Milling 95 DX Cost Ethanol Sugar Cost FQPT CST Sugar Cost
Sugar Cost ($ / lbs Sugar DMB)
Cost Delta = $0.0081 / #sugar dmb
Cost Delta = $0.0362 / # sugar dmb
© 2017 Fluid Quip Process Technologies, LLC. All rights reserved.

63
CST™ – Glucose & Fructose
Glucose(hexose)
Fructose(ketohexose)
O
OH
CH2OH
HO
OH
HO
CH2OH
HO
HO
HOCH2OH
O
H
H
H
Both are C6H12O6
Same Molecular Formula – Different Properties
© 2017 Fluid Quip Process Technologies, LLC. All rights reserved.

64
CST™ – Dextrose & Fructose
Assuming US Corn at $3.75/bu & US Feedstuff Pricing
Similar Sugar to Wet Mill – Much Lower Pricing
Wet Mill CSTTM CSTTM Advantages
Dextrose $0.17 -‐0.20+
$0.10 -‐0.14
No SO2
Fructose $0.25 -‐0.30+
$0.20 -‐0.23
High Purity
Low CapEx/OpEx
FOB Factory Price per pound dm
© 2017 Fluid Quip Process Technologies, LLC. All rights reserved.
80% of Biochemical production cost is raw material – CST™ provides the opportunity to reduce this by >22%

65
CST™ Clean Sugar Technology™
*Patent Pending
Ø Operating a full commercial system at a US biochemical facility since 2016
Ø Yields a sugar stream similar to a food-‐grade wet mill process
Ø Bolt-‐on technology to existing biofuels facility
Ø Integrates with all other FQPT technologies and process solutions
Ø System generates ~92% co-‐product value compared to a wet mill system
© 2017 Fluid Quip Process Technologies, LLC. All rights reserved.
66
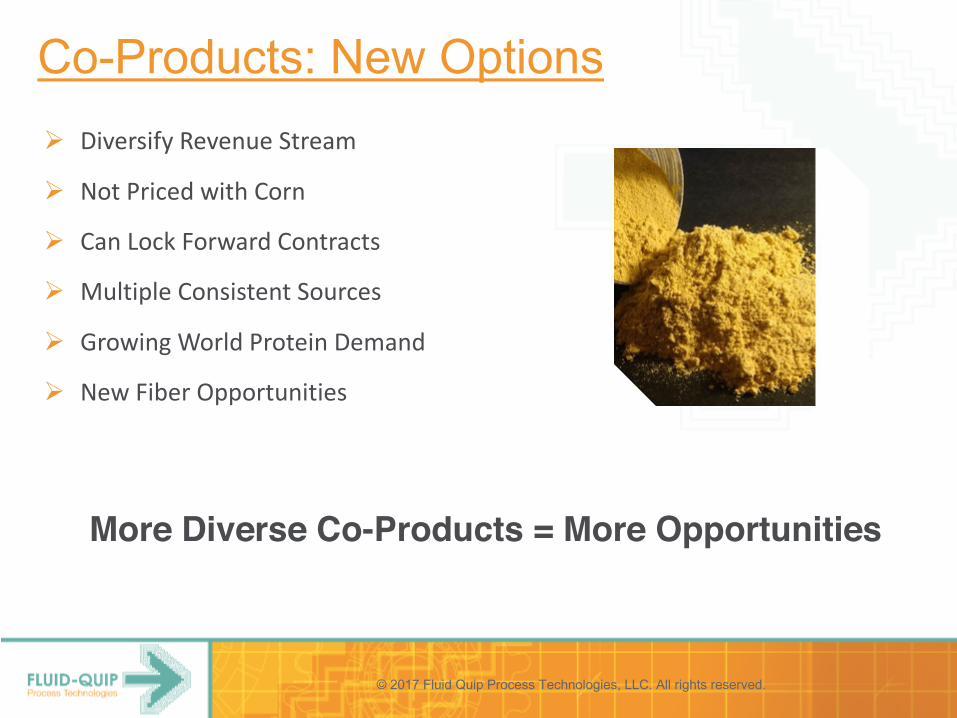
Co-Products: New OptionsØ Diversify Revenue Stream
Ø Not Priced with Corn
Ø Can Lock Forward Contracts
Ø Multiple Consistent Sources
Ø Growing World Protein Demand
Ø New Fiber Opportunities
More Diverse Co-Products = More Opportunities
© 2017 Fluid Quip Process Technologies, LLC. All rights reserved.

67
Dry Mill Ethanol Model Moving Forward
© 2017 Fluid Quip Process Technologies, LLC. All rights reserved.
CompetitionWet MillØCorn OilØGerm MealØGluten MealØGluten FeedØ Starch
TodayEthanol PlantØCorn OilØ SP50 – Alternative Protein
ØDDGSØ Ethanol
TomorrowBio PlantØ Industrial oils and lubricants
Ø Zein Protein, AA purification,
ØPre/probioticsØCellulosic ethanolØ Food fibersØ TextileØBiochemicalsØReplacement fuels

68
Fluid Quip Process Technologies – What Differentiates Us
Ø Focused on the Biofuels and Biochemical opportunity
Ø Provide proven project and process solutionsØ Experienced staff of chemical and mechanical engineers
Ø Plant Management / Operation ExpertiseØ Partner with Fluid-‐Quip, Inc. to customize equipment
300+ Combined Years of Corn Wet Milling and Dry Grind Ethanol Engineering Expertise
© 2017 Fluid Quip Process Technologies, LLC. All rights reserved.

69
FQPT – Advanced Biofuels Technologies}SGT Selective Grind Technology™: Front end wet starch grinding
}FBP Fiber By-‐Pass™: Fiber separation pre-‐fermentation
}MSC Maximized Stillage Co-‐Products™: Fiber separation post fermentation
}BOS Brix Oil Separation™: Oil separation from liquefaction
}CST Clean Sugar Technology™: Low insoluble sugar stream
}TSC Thin Stillage Clarification™: Removes insoluble solids from evap feed
US Patents US8778433, US8813973, Foreign Filing, Patents Pending
© 2017 Fluid Quip Process Technologies, LLC. All rights reserved.
70
FQPT Project SolutionsØ Facility expansions
Ø Fermenter additions
Ø Plant optimization
Ø Engineering studies/evaluationsØPlant Mass and Energy Balances – Pinch Analysis
ØOptimization review and capital deployment analysis
Ø Construction management services
Ø Maintenance services
Ø Turn-‐Key project solutions
© 2017 Fluid Quip Process Technologies, LLC. All rights reserved.

Thank you
Leaders in Biofuels/BiochemicalsNeal Jakel – VP Strategy and TechnologyFluid Quip Process Technologies6105 Rockwell Drive NE, Suite CCedar Rapids, IA [email protected]
© 2017 Fluid Quip Process Technologies, LLC. All rights reserved.